multimodal needs assessment - toledo metropolitan … · socio-economics of the study region...
TRANSCRIPT

Multimodal Needs Assessment
September 2011
Toledo Metropolitan Area Council of Governments (TMACOG)

Toledo Metropolitan Area Council of Governments (TMACOG)
300 Martin Luther King Jr. Drive
Suite 300 Toledo, OH 43604
419.241.9155 www.tmacog.org
This document is largely a compilation of several previously prepared TMACOG studies and outside reports as listed in the Appendix. It complements previous work to advance a balanced modal transportation network and fulfills aspects of the FY 2011 Annual Work Plan. This assessment provides a frame of reference for future multimodal analysis and supports ongoing efforts to achieve an efficient allocation of investments among all modes of transport in the regional network.


TMACOG Multimodal Needs Assessment
September, 2011 i
TABLE OF CONTENTS Introduction............................................................................................................................................1 Methodology..........................................................................................................................................2 Socio-Economics of the Study Region ..................................................................................................3
Population Trends ..............................................................................................................................3 Employment Trends...........................................................................................................................4 Trip Purpose.......................................................................................................................................4 Environmental Justice Considerations...............................................................................................5
The Regional Multimodal System .......................................................................................................11 Roadways.........................................................................................................................................11 Rail Facilities ...................................................................................................................................13
Passenger Rail Facilities ..............................................................................................................13 Freight Rail Facilities...................................................................................................................13
Transit Network ...............................................................................................................................17 Non-Vehicular Transportation Network ..........................................................................................23
Bike Network ...............................................................................................................................23 Pedestrian Networks ....................................................................................................................27
Air Facilities.....................................................................................................................................33 Waterborne Facilities .......................................................................................................................33
Connectivity Needs......................................................................................................................37 Recommendations and Future Work ...................................................................................................41 Appendix—Sources Consulted............................................................................................................43 FIGURES
Figure 1. TMACOG Region Population Trend .............................................................................3 Figure 2. 2010 Funding Sources of Toledo Metropolitan Area Transit Providers ......................19
TABLES
Table 1. Mode Split of Daily Work Trips in the TMACOG Region...........................................12 Table 2. Summary of Safe Routes Initiatives with the Region....................................................28 Table 3. Enrollments of Schools in Accident Zones....................................................................29 Table 4. Summary of Multimodal Needs and Initiatives.............................................................38
MAPS Map 1A. Key Destinations and Employment by Traffic Analysis Zone TMACOG Metropolitan Planning Area ........................................................................7 Map 1B. Key Destinations and Employment by Traffic Analysis Zone Toledo Urban Area ........................................................................................................9 Map 2: Roadways and Railways..................................................................................................15 Map 3. Public Transit and Connectivity ......................................................................................21 Map 4. Bikeway Facilities ...........................................................................................................25 Map 5. Sidewalks, Schools and Accidents ..................................................................................31 Map 6. Air, Rail, and Port Facilities ............................................................................................29 Map 7. Multimodal Needs and Initiatives....................................................................................39


TMACOG Multimodal Needs Assessment
September, 2011 1
Introduction This project provides an assessment of the interconnections among all transportation modes in the TMACOG metropolitan planning area: highway, freight and passenger rail, public transit, bicycle/pedestrian, air, and water. This multimodal analysis of the regional system takes into consideration the concept of complete streets. Recently introduced federal legislation (Safe and Complete Streets Act of 2011) defines complete streets as a roadway that safely accommodates all travelers, particularly public transit users, bicyclists, pedestrians (including individuals of all ages and individuals with mobility, sensory, neurological, or hidden disabilities), motorists, and freight vehicles, to enable all travelers to use the transportation network safely and efficiently. The purpose of this assessment is to review the balance between modes and describe the integration among them. A well-connected, complete street system serves the mobility needs of all transport system users whether by motorized or non-motorized mode. Streets, sidewalks, and bikeways should be safe for everyone including young, old, and disabled. The transportation system must be simultaneously useful for businesses and emergency responders, for bicyclists and pedestrians, for people using wheelchairs and other assistive devices, for public transit users, and for people of all ages. Increased and interconnected transportation options are necessary for communities to meet the future demands created by a changing population, a transforming economy, and the increasingly global movement of goods. A fully functioning multimodal system is essential to maintaining the economic prosperity and personal livability of the region. This report describes the “completeness” of existing pedestrian, bike, and street travel routes in the Toledo Metropolitan Area Council of Governments (TMACOG) region with an emphasis on connectivity between modes. It is intended to be a useful reference to TMACOG’s Transportation Council, its several planning committees, and their work programs. For more information, including rosters, operating procedures, and meeting materials, see “Councils and Committees” on the TMACOG Transportation page http://tmacog.org/tran_body.htm. The Transportation Planning committee, Pedestrian & Bikeways committee, and Public Transit & Passenger Rail committee in particular can use this report as a resource to pursue goals of increased mobility in the region. This assessment demonstrates regional efforts in pursuit of selected transportation goals for the region’s transportation system. The FY2011 Annual Work Program lists several goals in pursuit of achieving a sustainable and seamless multimodal transportation system including:
To improve transportation and safety using state or federal programs intended to correct problematic infrastructure conditions.
To improve freight transportation efficiency and support efforts to increase the volume of freight moving within and through the region.
To increase and improve passenger rail transportation serving the region. To provide for increased availability and promote usage of pedestrian and bicycle
transportation within the region. To improve provision of public transportation facilities and services throughout the region.
A well-functioning multimodal system increases transport opportunities for those who do not drive by choice as well as those whose ability to drive is limited or prohibited. The carless, the unemployed, people with economic or physical circumstances that limit their transportation options are not the only ones who benefit. Society overall is served by reductions in commute times, traffic

TMACOG Multimodal Needs Assessment
September, 2011 2
congestion, and oil consumption. An integrated multimodal system is a necessary element in increased economic activity and improved cultural life in the region while also offering the potential for improved air quality.
Methodology The study area is the TMACOG metropolitan planning area that includes all of Lucas and Wood counties in northwest Ohio, and the three southernmost townships in Monroe County, Michigan (Erie, Bedford, and Whiteford townships). The two largest cities within the region are Toledo and Bowling Green. In addition to Toledo, Lucas County is home to several smaller suburban cities that ring the urban core, some small villages, and some open rural areas. Wood County has several small villages and is primarily rural except for Bowling Green and the northern tier suburbs near Toledo. Most of the geographically based information contained in this report is drawn from the findings of selected previous TMACOG studies as well as from outside sources such as the Brookings Institution (see Appendix—Sources Consulted). Sidewalk information is available for the first time. It shows the presence or absence of sidewalks on one or both sides of the street. Blending data and conclusions from separate prior analyses with new information provides new insight to assess modal connections. The current report benefits enormously from the comprehensive planning expertise and extensive public involvement process that is a hallmark of TMACOG work products. Census data from 2000 is the basis of many studies consulted for this report—an important caveat to interpreting the findings of this analysis. Except for aggregate metropolitan statistical area population counts, Census data from 2010 is not yet available. As geographically based 2010 Census data are released, a more current picture of regional land use will emerge. Detailed population and housing characteristics by census tracts would similarly add an important geographic dimension to this analysis. This report begins with a summary of the socio-economic dynamics of the region. A basic analysis of key destinations and employment density (from data supplied by ODOT in 2009) forms the foundation for assessing connectivity among transportation options. Key destinations for work, education, healthcare, shopping, and leisure are reviewed in relation to employment density estimates. Data on roadways and railways explores connectivity of rail to truck within the freight sector. Comparison of the freight transport system—including marine and air—to the pedestrian, cyclist, personal vehicle, and transit systems reveals modal conflicts. The summary presented in Table 4: Summary of Multimodal Needs and Initiatives along with Map 7 details remedies to minimize known connectivity gaps and notes cost estimates (to the extent that these calculations exist). Recommendations for a more integrated and comprehensive modal system, including enhancements to data and future planning steps, conclude this assessment. The connectivity gaps outlined and depicted in this assessment do not form an all-inclusive account. As the first explicitly multimodal view of the entire transport system, this assessment seeks not to comprehensively identify all system gaps, but to provide a starting point for further analysis. The various committees within the TMACOG organization may choose to build upon the approach and findings of this study.

TMACOG Multimodal Needs Assessment
September, 2011 3
Socio-Economics of the Study Region
Population Trends The TMACOG transportation region currently has 608,943 people living in it. There has been a slight decline within the region over the past 10 years, owing to a nearly 3 percent population loss in Lucas County. However, the remaining portions of the region have experienced population gains. The population projection for Lucas County is continuing to show a steady decline over the next 20 years. In contrast, the jurisdictions to the north, west, and south will experience moderate population growth. As shown in Figure 1, the portion of Monroe County, Michigan, within the TMACOG area has experienced the largest rate of population growth, albeit from a relatively small base.
Figure 1. TMACOG Region Population Trend
0
100,000
200,000
300,000
400,000
500,000
600,000
700,000
1970 1980 1990 2000 2010
Po
pu
lati
on
TMACOG MPO Area Lucas CountyWood County Monroe County (TMACOG portion)Monroe County (complete)
-1.1%
% Change 2000-10
-2.9%
+3.7%
+5.8%
+4.2%
Data Source: 2010 Census. Several other demographic shifts within this increasingly suburban population are underway that have implications for the Toledo metropolitan multimodal network. As noted in On the Move: 2007-2035 Transportation Plan–Update 2011 the average age of this population is generally rising as life expectancies have lengthened and birthrates declined. Another factor is out-migration is exceeding in-migration. A key implication of this trend is that a generally more elderly population will likely put greater demands on public transit.

TMACOG Multimodal Needs Assessment
September, 2011 4
Employment Trends According to the U.S. Bureau of Labor Statistics, the overall number of jobs in the region has declined by 13 percent in the past decade to 330,000 employed persons. The largest employment sectors are manufacturing, trade, transportation and utilities, education and health services, government, professional and business services, and leisure and hospitality. From 2001 to 2010, one in three manufacturing jobs has disappeared. Nevertheless, there remains a significant industrial base in the region including key employers such as Chrysler (Jeep), Dana Corp., First Solar Inc., Fisher Tool & Die, General Motors, Libbey Inc., Magna-Norplas, MTS Seating, Owens Corning, Owens Illinois Inc., and TNS Custom Research. The commercial base is also strong, particularly the trade, transportation and utilities sector with such firms as Andersons Inc., FedEx Ground Services, United Parcel Service, and Walgreens Distribution Co. The continued presence of manufacturing and warehousing/distribution centers relies to a great degree on the condition and capacity of the freight transport system. Bucking the general trend, the education and health sector has experienced slow but steady growth with 7,400 more jobs in 2010 than in 2001. Major employers in this sector are Bowling Green State University, HCR Manor Care, Heidelberg University, Lourdes University, Mercy Health Partners, Owens Community College, Penta Career Center, Promedica Health System, and the University of Toledo. The Brookings Institution reports a rising enrollment trend nationally and notes that the Toledo area has experienced an increase in college enrollment of over 10 percent between 2000 and 2008 (State of Metropolitan America). Access to educational and medical facilities is greatly enhanced by a robust passenger transportation network. Overall employment levels are falling faster than the population decline. Therefore, the number of unemployed (to say nothing of the under-employed, or those working two part-time jobs) is increasing. The unemployment rate rose from 4.8 percent in 2001 to 11.3 percent in 2010. The implication for transportation planners is that, very likely, there are more people who are either carless or cannot consistently afford to maintain or use their vehicles on a regular basis. As noted earlier, the 2010 Census data will shed light on the household characteristics such as car ownership and employment. As with the generally aging population, this trend also implies greater demand for public transit or other alternatives such as walking or bicycling. For employed people, although there are still many large scale factories in the region, the shift away from manufacturing jobs means that large employment centers are becoming less common. A pattern of smaller, more dispersed facilities is increasingly common.
Trip Purpose Work is a primary trip purpose, so pinpointing the location of key employers in relation to populations most likely to use non-auto travel options is essential to a modal needs assessment. As with the population redistribution, the trend in employment locations (office complexes, manufacturing facilities, retail centers, etc.) has been a move away from the downtown central business district (CBD) to the suburbs. The shift from a single concentrated core to dispersed communities throughout the region changes the spatial pattern of employment centers. Consequently, the directional patterns of daily trips no longer follow a simple hub and spoke model. Today, multi-directional commuter networks that are cross-suburb and that emanate from neighborhoods near the city center are commonplace. Within Toledo, as in many other cities, the

TMACOG Multimodal Needs Assessment
September, 2011 5
past decade has seen the rise of a small current against the tide of decentralization. Former industrial spaces converted into residences are producing a slight trend toward downtown living, particularly among young single professionals or older couples with no children. Besides the work commute, other top trip purposes are school, medical, shopping, and leisure activities. These trips may originate from home (home-based), or they may originate from another location (non-home-based). Home-based trips are those that begin at home with a destination of work, shopping, school, or other unspecified destinations. Non-home-based trips are generally shorter than home-based trips and are due largely to trip chaining. For example, a single outing might consist of a stop to drop children off at daycare followed by a stop at a coffee shop, then to work. Travel home from work may involve several non-home-based trips such as to the grocery store, dry cleaners, school, soccer practice, etc. Home-based trips range from an average length of five miles for shopping trips to nearly nine miles for work trips. One conclusion of this fact is that when it comes to choosing where to live, people are still willing to trade off a longer trip to work in order to live in a desired area. Shopping has the lowest average distance among home-based trips indicating that people prefer to shop at locations relatively close to home. The locations of the region’s major grocery chains offer evidence of this preference. For example, in the urbanized area, most grocery stores are located within four to five miles of each other demonstrating shoppers are seldom willing to drive longer distances to make purchases. In addition to school, shopping, and other well-established destinations, several potential future growth locations are envisioned in the region. Destinations slated for redevelopment include the reclaimed industrial site of the former Jeep plant, and the Marina District where mixed residential and commercial development may occur. The Hollywood Casino Toledo, currently under construction and scheduled to open in early 2012, is anticipated to be a significant entertainment destination.
Environmental Justice Considerations The TMACOG transportation planning process fully considers how environmental justice (EJ) areas (locations with a concentration of minority and/or low-income population) are impacted by transportation projects. TMACOG seeks to produce a system where the public health and environmental impacts of the transportation system are fairly distributed across all races and classes. In the multimodal connectivity context, equitably sharing the burdens and assets of the transportation system facilitates the regional economic recovery by improving overall livability and connecting people to jobs. Data from the 2010 Census related to EJ areas within the region are not yet available. Given the significant volume of foreclosures and the ongoing effects of the financial and housing crisis that began in 2008, the size and shape of EJ areas has likely grown and changed considerably since the 2000 Census. Data from the Ohio Department of Transportation puts the minority share of Lucas County’s population at 22.5 percent and Wood County’s share at 5.2 percent. As new data become available, this component will be updated accordingly.

TMACOG Multimodal Needs Assessment
September, 2011 6
The socio-economic factors mentioned above in combination with the location of key destinations create a picture of where people travel both out of necessity (for example, for work or medical reasons) and by choice (parks and recreational facilities). In summary, the relatively simple traffic flow patterns of a few decades ago have grown in complexity. Maps 1A and 1B depict 2009 employment density patterns as per Traffic Analysis Zones (TAZ) in relation to key destinations. A TAZ as defined by the U.S. Census Bureau is “A special area delineated by state and/or local transportation officials for tabulating traffic-related data, especially journey-to-work and place-of-work statistics. A TAZ usually consists of one of more census blocks, block groups, or census tracts.” As residential demographics from the 2010 Census become available, an important dimension regarding where people live will complement the picture of where they work. Additional data on race, age, auto ownership, will also make this assessment more complete.

ò
o
^
oo
o
^
^
o
k
J
k
k
# *
# *
ò [[ò [
G
o
G
ò
ò
^
^G
k
k
o
o o
o
o
o
k
^
G
G
G
k
k
^
GG
G
oo^ I2
o
o
[# *
o
^
^
o
o
[
[
[[
k[# *
k
ok k
o
o
o
o
o
k
k
k
k
k
C
C C
C
C
C
C
C
CC
C
C
C
C
C
o
k
k
k
k
k
k
k
kk
k k
ko
k
k
k
k
k
k
k
kk
k
k
k
k
k
k
k
C
C
C
CC
C
C
CC C
o
o o
[o
o
C
C C
C
C
C
ò
ò
[
C
CC
C CC C
C
C CCCC C
C
C C
Ja
Ja
C C
C
C
ooo
o
o
J
J
ò
ò
k
C
§ ¦75
§ ¦75
§ ¦475
§ ¦475
§ ¦280
§ ¦80
§ ¦80
t u6
t u23
t u23
t u20
t u23
t u24
t u24
t u20A
t u20
§ ¦90
§ ¦90
Lu
ca
s C
ou
nt
yL
uc
as
Co
un
ty
Wo
od
Co
un
ty
Wo
od
Co
un
ty
La
ke
E
ri
e
Mo
nr
oe
Co
un
ty
Mo
nr
oe
Co
un
ty
t u20
t u24
t u24
SE
E
BO
WL
ING
GR
EE
N
INS
ET
Mic
higa
nO
hio
RE
FE
R T
O
MA
P 1
B
TO
LE
DO
UR
BA
N A
RE
A
Clay HS
Coontz
Complex
Fisher T
ool & Die
and M
TS Seating
Biofit Engineered
Products
Johnso
n Controls
TOLEDO
OREG
ON
MAUMEE
BOWLING
GREEN
NORTH
WOOD
SYLVANIA
BER
KEY
PER
RYSBURG
ROSSFO
RD
WATERVILLE
WHITEH
OUSE
WALBRIDGE
HASKINS
PORTAGE
OTTAWA
HILLS
LUNA PIER
NORTH
BALTIM
ORE
WESTO
N
HOLLAND
MILLBURY
JERRY CITY
PEM
BERVILLE
FOSTORIA
LUCKEY
HOYTVILLE
SWANTO
N
BRADNER
BLO
OMDALE
GRAND RAPIDS
RISINGSU
N
WAYNE
CYG
NET
CUSTAR
MILTO
NCEN
TER
TONTO
GANY
BAIRDSTOWN
WEST
MILLG
ROVE
HARBOR
VIEW
USF Holland
Otsego Park
Pace
setter
Park
Centennial Terrace
Seco
r
Air Commerce Park
Otsego HS
Bedford HS Elm
wood HS
Bend View
Eastwood HS
Fostoria HS
Farnsw
orth
Providence
Maumee
Bay SP
Toledo Express
Airport
Anth
ony W
ayne HS
Maso
n Conso
lidated Sch
ools
North Baltim
ore HS
Blue Creek
Conse
rvation Area
Mary Jane
Thursto
n SP
Ottawa N
ational W
ildlife Refuge
Oak Openings
Irwin Prairie
Cedar Point National W
ildlife Refuge
Northwest Ohio
Trans‐Shipment Term
inal
Monroe Co. C
ommunity College
Lake Erie Rese
arch Center
Ü0
24
1M
iles
Map
1A
- K
ey D
est
inat
ions
and
Em
ploy
men
t by
Tra
ffic
Ana
lysi
s Z
one,
TM
AC
OG
Met
ropo
litan
Pla
nnin
g A
rea
Dat
e of
Map
: Sep
tem
ber
6, 2
011
* T
he
U
.S.
Ce
nsu
s B
ure
au
d
efin
es
a T
raff
ic A
na
lysi
s Z
on
e
(TA
Z)
as,
"A
sp
eci
al a
rea
d
elin
ea
ted
by
sta
te a
nd
/or
loca
ltr
an
spo
rta
tion
off
icia
ls f
or
tab
ula
ting
tra
ffic
-re
late
d d
ata
, e
spe
cia
lly jo
urn
ey-
to-w
ork
an
dp
lace
-of-
wo
rk s
tatis
tics.
A T
AZ
usu
ally
co
nsi
sts
of
on
e o
r m
ore
cen
sus
blo
cks,
blo
ck g
rou
ps,
or
cen
sus
tra
cts.
"
o
# *
# *
k
^
G
kCC
C CC
C
C C
CCC
C
C C
C
ooo
o
o
J
ò§ ¦75
t u6Wood Co.
Histo
rica
l Center
Century M
arketing
Greenline Foods
City Park
Carter Park
Woodland M
all
Wintergarden Park
Sim
pso
nGarden Park
Wood County
Hosp
ital
Wood Co.
Court House
Wood Co.
Fairgrounds
Bellard Business Center
Bowlin
g Green HS
Wood Co.
Services Complex
Innova
tive
Tech
nology Park
Wood County
Regional A
irport
Bowlin
g Green
State University
BG Community
Center
Wood‐B
ridge
Business Park
Bo
wli
ng
Gre
en In
set
Tole
do
Met
rop
olit
an A
rea
Co
un
cil o
f G
ove
rnm
ents
300
Mar
tin
Lu
ther
Kin
g,
Jr.
Dr.
, Ste
. 30
0To
led
o, O
hio
436
04P
ho
ne
(419
) 2
41-9
155
ww
w.t
mac
og
.org
Inte
rsta
te a
nd U
S r
oute
s
New
US
-24
Mun
icip
ality
Bou
ndar
y
Traf
fic
An
alys
is Z
on
e (T
AZ
)
Tota
l Nu
mb
er o
f E
mp
loye
es in
200
9
Lake
Erie
/Mau
mee
Riv
er25
-249
em
ploy
ees
250-
499
empl
oye
es
500-
999
empl
oye
es
>10
00 e
mpl
oyee
s
JA
irpo
rt
I 2A
mtr
ak
J aB
us S
tatio
n
CB
usin
ess
and
Indu
stry
òC
ultu
ral a
nd H
isto
rical
kU
nive
rsity
and
Col
lege
kH
igh
Sch
ool
# *G
over
nm
ent
GH
ospi
tal a
nd M
edic
al
oP
ark,
Rec
reat
ion,
and
Nat
ure
Pre
serv
e
^S
hopp
ing
Cen
ter
[S
port
s an
d E
nter
tain
men
t
Key
De
stin
atio
ns
Ba
se D
ata
*
0-24
em
ploy
ees
7


ò
^
o
o
^
^
o
k
ò
[[ò[
G
o
G
ò
ò
^
^G
k
k
o
G
G
k
k
^
G
G
G
o
o
^
I2
[
#*
o
^
^
o
[
[
[[
k
[#*
k
o
k
k
o
o
o
o
k
k
k
k
k
C
C
C
C
C
C
C
C
C C
C
C
C
C
o
k
k
k
k
k
k
k
k
k
k
ko
k
k
k
k
k
k
k
k
C
C
CC
C
CC
o
o
[ o
C
C
C
C
C
C
ò
ò
[
C
C
CJa
Ja
J
ò
k
C
§¦75
§¦475
§¦475
§¦280
§¦80
§¦80
tu23
tu20
tu20A
§¦90
§¦90
L u c a s C o u n t yL u c a s C o u n t y
W o o d C o u n t yW o o d C o u n t y
tu20
tu24
SEE
DOWNTOWN
TOLEDO
INSET
tu23
Michigan
Ohio
Andersons Grain& Kuhlman CargoTerminals
ToledoMuseum
of Art
L a k e E r i e
TOLEDO
OREGON
MAUMEE
NORTHWOOD
SYLVANIA
PERRYSBURG
ROSSFORD
WATERVILLE
WHITEHOUSE
WALBRIDGE
OTTAWAHILLS
HOLLAND
MILLBURY
HARBOR VIEW
Megabus
First Solar
Ottawa Park
Orleans Park
Sunoco
BP Oil
OlanderPark
Raceway Park
The Andersons
Davis College
Johns Manville
WoodlandsPark
Bass Pro Shops
Walbridge Park
Woodville Mall
The Toledo Zoo
Oak Shade Grove
Buttonwood Park
PacesetterPark
Toledo Speedway
Flower Hospital
ToledoHospital
Lake HS
Clay HS
Former Jeep Plant
Libby Glass
Start HS
Scott HS
Stranahan Theater
Pearson
Crossroads Centre
St. UrsulaAcademy
Notre DameAcademy
Maumee HS
Rogers HS
Heidelberg College
CentennialTerrace
LourdesUniversity
Side Cut
TNS Custom Research
Whitmer HS
Bowsher HS
St. Luke's
Owens Illinois
Rossford HS
Woodward HS
GeneralMotors
St. Charles Hospital
Scott Park Campus
Universityof Toledo
Cedar Business Center
Lucas Co. Fairgrounds
Northwood HS
Coontz Complex
St. Johns HS
UPS
CITGO Petroleum Corp.
Dana Technology Center
Perrysburg HS
Stautzenberger College
St. Vincent Hospital
Hollywood Casino
Springfield HS
Shops at Fallen Timbers
St. Anne Hospital
Owens College
ToledoExecutive
Airport
ToledoBotanicalGardens
UT HealthScience Campus
WestgateShoppingCenter
AirlineIntermodalTerminal
Bay Park Hospital
Wildwood
W. W. Knight
Town Center at Levis Commons
Levis CommonsIndustrial Park
Capital CommonsBusiness Park
Chrysler‐Jeep
Sylvania Southview HS
Walgreens
Maumee Valley Country Day School
Penta School
MidwestTerminals
WestfieldShopping
Center
Fallen Timbers Battlefield Monument
St. Francis De Sales HS
Marathon
SpringMeadows
SylvaniaNorthview HS
PilkingtonSwan Creek
Central Catholic HS
Cardinal Stritch HS
Chrysler
FedExLucas Co. Recreation Center
ToledoTech.Academy
OttawaHills HS
Great Lakes Window
ArrowheadBusiness Park
Crane Business Center Magna‐Norplas
Fort Meigs Monument
Ü
Map 1B - Key Destinations and Employment by Traffic Analysis Zone,Toledo Urban Area
ò
[ [
ò
[
o
o
^
I2
[
#*
k
[
#*
k
C
[
ò
ò
Ja
§¦75
§¦280
Greyhound
OwensCorning
Mercy College
Marina District
Huntington Arena
Waite HS
Fifth Third Field
Erie StreetMarket International Park
Lucas Co.Courthouse
Amtrak
ToledoMaritime
Center
Promenade ParkSeagateCenter
Col. James M. SchoonmakerMuseum Ship
Main Library
The Docks
One Govt.Center
ImaginationStation
Valentine Theater
Downtown Toledo Inset
0 2 41MilesDate of Map: September 7, 2011
Traffic Analysis Zone (TAZ)
Total Number of Employees in 2009
Lake Erie/Maumee River
25-249 employees
250-499 employees
500-999 employees
>1000 employees
J Airport
I2 Amtrak
Ja Bus Station
C Business and Industry
ò Cultural and Historical
k University and College
k High School
#* Government
G Hospital and Medical
o Park, Recreation, and Nature Preserve
^ Shopping Center
[ Sports and Entertainment
Key Destinations
Base Data
0-24 employeesInterstate andUS routes
New US-24
MunicipalityBoundary
Area of Extent
Toledo Metropolitan AreaCouncil of Governments
300 Martin Luther King, Jr. Dr., Ste. 300Toledo, Ohio 43604Phone (419) 241-9155www.tmacog.org
9


TMACOG Multimodal Needs Assessment
September, 2011 11
The Regional Multimodal System The current transportation network will need to adapt to continuing demographic and economic changes. With ever tightening funding at federal, state, and local levels, it is imperative that government and business pursue the most cost-effective methods to maintain the system, improve its performance, and expand where needed. One approach to meeting this challenge is to assess and enhance the system by identifying deficiencies or gaps that connect the various modes. Inventorying the existing system from the vantage point of connectivity offers insights into how well current facilities enable and encourage people to adopt different modes (mode-shifting) or to use multiple modes during a single trip (mode-combining) for their personal travel. It also provides insight into the ease with which freight professionals can move shipments between and among truck, rail, and ship modes. This perspective supports the pursuit of strategies that refine the transportation system by building functionality across and between modes for personal and commercial users.
Roadways The overall network of streets, bridges, and highways in Lucas and Wood counties and the southern three townships of Michigan accommodates motorists, emergency responders, and freight haulers, as well as non-motorists. The region’s major highway network is comprised of approximately 1,400 miles of roadways and hundreds of bridges. With respect to the highway system, 240 miles are limited access freeways (I-75, I-475, I-280); 525 miles are U.S. and state routes (such as U.S. 23, U.S. 24, U.S. 6 SR 2, SR 25). The highway system carries an average of more than 2 million vehicle trips per day with more than 11 percent made by trucks. The Ohio Turnpike (I-80/90) supports significant passenger and freight traffic volume with three interchanges in the region. Arterial or collector roadways comprise the rest of the roadway system. Except for limited access roadways, all roads in the system serve transit, bicycle, and pedestrian modes in addition to auto and truck traffic. The goal of many committed and planned improvements to area roadways is to alleviate congestion, improve air quality, and increase safety for area motorists and non-motorists. In terms of personal commuting, several studies conclude that people overwhelmingly prefer their car to mass transit or other modes such as walking or biking. There are a variety of reasons for individual mode choice including time, cost, weather, and personal freedom. The availability of alternatives to the single-occupancy vehicle as well as their safety and usefulness plays a considerable role in mode choice. The following table quantifies the number of daily work trips by mode as a share of all trips in the TMACOG region.

TMACOG Multimodal Needs Assessment
September, 2011 12
Table 1. Mode Split of Daily Work Trips in the TMACOG Region
Mode Number of Trips % of Total All Modes 162,488 100.00% Drive Alone 132,347 81.45% Carpool 14,243 8.77% Work at home 7,416 4.56% Walk 5,764 3.55% Bus 1,113 0.68% All others 1,061 0.65% Bicycle 381 0.23% Taxicab 109 0.07% Motorcycle 54 0.03%
Source: TMACOG 2035 Plan–Update 2011 (based on 2000 Census). In terms of commercial users, the volume of freight traffic flowing into, out of, and through the TMACOG region is heavy. The intersection of north-south I-75 and east-west I-80/90 is one of the nation’s busiest crossroads. The amount of economic activity supported by regional transportation infrastructure (roadways in addition to the region’s international and domestic airports, Class I railroads, and navigable waterways) is fundamental to economic health. Indeed, the confluence of geography and commercial trade patterns supports the region’s emergence as a foremost North American center of international freight transport, logistics, and distribution. Home to more than 80 transportation-related firms, the region is a major center for the trucking industry. Several major freight-generating hubs such as USF Holland, Fed-Ex, and UPS dot the region and generate large daily volumes of traffic. The I-475/I-75 split near the site of the former Chrysler Jeep plant is the busiest section of highway in the region. As new demands on the system result from the region’s competitive advantage in freight movement, new challenges arise in supplying a balanced infrastructure. Accommodating local freight movements to commercial/retail businesses, manufacturing and industrial locations, and office complexes enhances the economic competitiveness of the region. A balance between freight and residential needs is integral to both livability and economic viability. Similarly, connectivity between freight modes such as to/from ship, rail, and truck is of key importance. A review of linkages between the National Highway System (NHS) and local major freight terminals reveals multimodal conflicts in several segments of the roadway system. These so-called “last mile” NHS connectors offer access to and from the highway to major water, air, rail, and other freight facilities. Concerns range from pavement deficiencies to congestion and safety issues to reducing conflict points between freight and passenger modes. The TMACOG region competes with other regions throughout the U.S. and the world. Maintaining and improving the access to industrial and commercial facilities is critical to keep pace with advances made elsewhere and is essential to the overall economic viability of the region.

TMACOG Multimodal Needs Assessment
September, 2011 13
Rail Facilities
Passenger Rail Facilities Two long distance routes, the Lake Shore Limited and the Capitol Limited, serve Toledo’s Amtrak station, the Martin Luther King Jr. Plaza. The Lake Shore Limited travels daily between Chicago and New York City and Boston. The Capitol Limited, as its name implies, travels daily between Chicago and Washington, DC. Four trains per day, two eastbound and two westbound, travel through the station, albeit at hours not convenient to family travel. Amtrak offers connecting bus service from Toledo to the Michigan cities Detroit, Ann Arbor, and Lansing; however, rail connections between Toledo and other nearby cities not on these east-west routes are non-existent. Despite limited connections and awkward hours of service, the Toledo station is the busiest of the seven Amtrak stations in Ohio. During 2010, more than 65,000 passengers boarded or de-boarded in Toledo, representing about 45 percent of total station usage in the state. Although limited bus connections are available from the train station, the 2005 Regional Core Circulator Study concluded there is a need at the station for an intercity bus operation such as Greyhound, and a direct public transportation connection to the heart of downtown Toledo. Currently, the Greyhound station is in the center of downtown, 1.6 miles from the Amtrak station. Taxi service is the only connection. The streetcar alternative recommended in this study would also serve to close the gap in connection between urban core locations and the train station. Improved passenger rail service envisioned for northwest Ohioans includes the Ohio Hub plan as detailed in the 2035 Plan–Update 2011. This rail initiative would create several intercity travel corridors that would link the Toledo region with numerous other destinations in Ohio, the Midwest, and Canada. This initiative has not moved toward implementation largely due to funding issues and lack of consensus. To respond to the challenges identified in public transit and passenger rail, TMACOG has recently revised its committee structure to include the Public Transit & Passenger Rail Committee. This committee will focus on identifying population needs, improving connectivity, and building awareness of and facilitating discussion about these critical transportation options.
Freight Rail Facilities According to the Toledo Regional Economic Plan: Transportation & Logistics Industry Sector, the region is the among the top five largest freight rail hubs in the U.S. Three Class I railroads –Canadian National (CN), CSX Corporation, and Norfolk Southern (NS) – serve the region. These three rail companies plus the short line Ann Arbor Railroad operate 118 miles of track located in Lucas County, 148 miles in Wood County, and 37 miles in southern Monroe County. Two freight rail improvements in the region will benefit the local economy through increased investments in the warehousing and logistics industry. The NS Chicago-Cleveland mainline that passes through Toledo is the busiest freight artery east of Chicago. NS is engaged in a $12.8 million public-private partnership to expand the capabilities of the Airline Junction Rail Yard in central Toledo. Improvements include intermodal ramp expansion, addition of new siding and access tracks, switch upgrade and improved train routing through the yard.
TMACOG Multimodal Needs Assessment
September, 2011 14
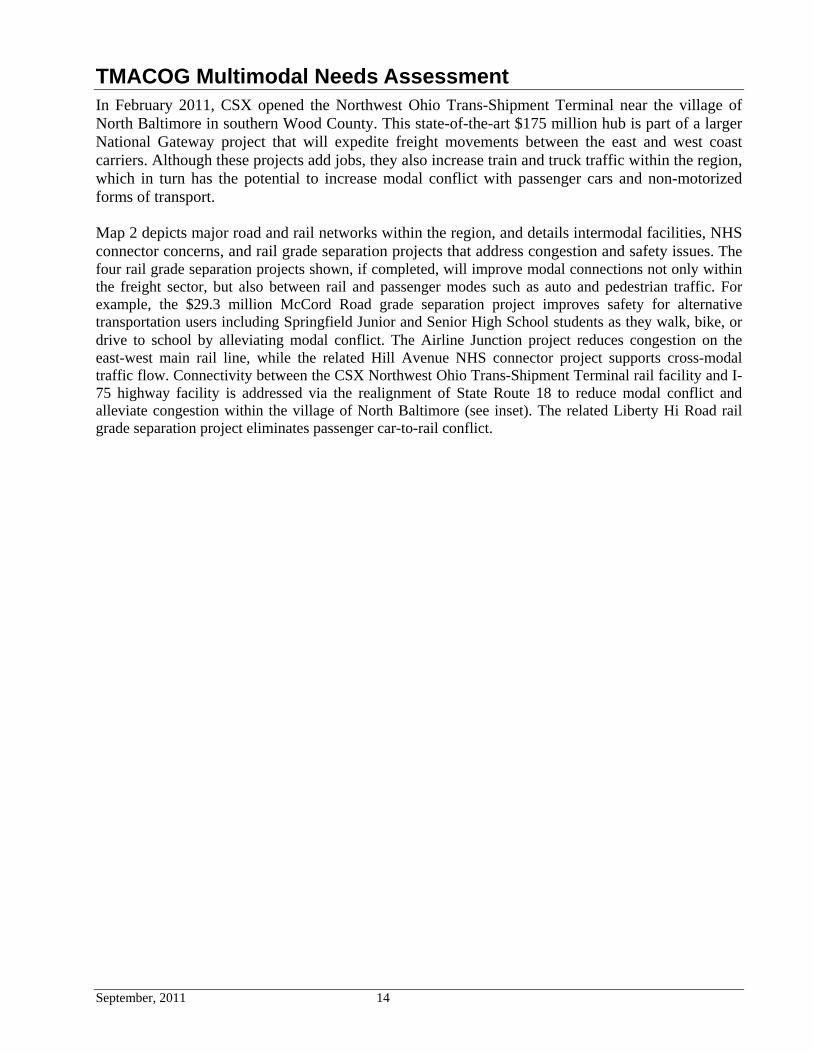
In February 2011, CSX opened the Northwest Ohio Trans-Shipment Terminal near the village of North Baltimore in southern Wood County. This state-of-the-art $175 million hub is part of a larger National Gateway project that will expedite freight movements between the east and west coast carriers. Although these projects add jobs, they also increase train and truck traffic within the region, which in turn has the potential to increase modal conflict with passenger cars and non-motorized forms of transport. Map 2 depicts major road and rail networks within the region, and details intermodal facilities, NHS connector concerns, and rail grade separation projects that address congestion and safety issues. The four rail grade separation projects shown, if completed, will improve modal connections not only within the freight sector, but also between rail and passenger modes such as auto and pedestrian traffic. For example, the $29.3 million McCord Road grade separation project improves safety for alternative transportation users including Springfield Junior and Senior High School students as they walk, bike, or drive to school by alleviating modal conflict. The Airline Junction project reduces congestion on the east-west main rail line, while the related Hill Avenue NHS connector project supports cross-modal traffic flow. Connectivity between the CSX Northwest Ohio Trans-Shipment Terminal rail facility and I-75 highway facility is addressed via the realignment of State Route 18 to reduce modal conflict and alleviate congestion within the village of North Baltimore (see inset). The related Liberty Hi Road rail grade separation project eliminates passenger car-to-rail conflict.

ALEXIS
CENTRAL
COREY
Toledo
ALEXIS
DETR
OIT
LAGRANGE
CHERRY
HAGM
ANBENORE
MANHATTAN
SUMMIT
CEDAR POINT
YORK
LALL
ENDO
RF
FRONT
WYNN
Oregon
PICKLE
STARRWOODVILLE
WHEE
LING
ConsaulAdvanceWarning
NAVARRE
OAKDALEMIAMI
HILL
DORR
BANCROFT
AIRPORTSOUTH
ANTHONY WAYNE TRAIL
BROADWAYWESTERN
NEBRASKA
BYRN
E
SOUTH
ANGOLA
BANCROFT
DORR
NEBRASKA
HILL
ANGOLA
MCCO
RD
CRISS
EY
CENT
ENNI
AL
CENTRAL
ALBO
N
AIRPORT
HOLL
AND
- SYL
VANI
A
REYN
OLDS
SALISBURY
GLENDALE
DETR
OIT
RIVER
RIVER
OREG
ON
TRAC
Y
GLEN
WOOD
LIME C
ITY
FRONT
WILLISTON
RIVER
OTTE
R CRE
EK
GREENBELT
YANKEE SMITHMONROE COUNTY
LUCAS CO.
WOOD CO.
MICHIGANOHIO
Lake Erie
Waterville
COLL
INGW
OOD
FIVE POINT
ROACHTON
ECKEL JUNCTION
SYLVANIA
WILK
INS
EBER
MONCLOVA
STITT
WATE
RVILL
E- M
ONCL
OVA
DUTCH
SANDUSKY
Toledo ExpressAir Commerce Park
Berkey
STAD
IUM
BROWN
SUMM
IT
STIC
KNEY
SUDER
LASKEY JACK
MAN
DOUG
LAS
SECO
R
TALM
ADGE
MONROE
SYLVANIA
TREMAINSVILLE
ALEXIS
BRINT
KING
ANGOLA
Swanton
HEATHERDOWNS
Millbury
OTTAWA CO.
NS - 1 per week
CSX/AA -1 per day
NS - 3
0 to 4
0 per
day
CN -5 per day
NS - 4 per day/WE - 2 per day
NS
AA - 1 to5 per day
CSXNS
CSX
NS - 4
per d
ay
CSX -
15 to
20 pe
r day
NS - one per day
NS - 90 to 100 per day/Amtrak - 4 per day
CSX -
6 to
8 per
day
CSX -
6 to
8 per
day
CSX - 12 to 15 per day
CSX - 1 to 2 per day
NS - 90 to 100 per day/Amtrak - 4 per day
Hallet AveGrade
Separation
McCordGrade
Separation
StickneyRail Conflict
Wales RdGrade
Separation
AirlineIntermodal
Yard
ToledoSeaport
CSX -15 per day
MatzingerAdvanceWarning
SummitAdvanceWarning
CSX - 15 to20 per day
Tracy RdImprovements 795
CSX
Toledo ExpressAirport
ToledoExecutive
Airport
Toledo
Toledo
Maumee
Northwood
Sylvania
Rossford
Perrysburg
Walbridge
Ottawa Hills
Holland
Rossford
HarborView
NorthBaltimore
WOOD CO.
Cygnet
LIBER
TY H
I
Northwest OhioTrans-Shipment
Terminal
HANCOCK CO.
CSX - 45 to50 per day
Liberty Hi RdGrade
Separation
CSX - 6 to 8 per day
SR 18 AlignmentImprovements
Map 2 - Roadways and Railways 300 Martin Luther King, Jr. Drive, Suite 300Toledo, Ohio 43604 419-241-9155www.tmacog.org
Toledo MetropolitanArea Council of Governments
Southern Wood County
0 1 20.5 1.5Miles
0 1 20.5 1.5Miles
Source: ODOT, U.S. Census Bureau, LucasCounty, Wood County, CSX, Norfolk Southern,Canadian National, Ann Arbor RR, Amtrak
map data: 9/9/11
Total Number of Employees in2010 by TAZ
0-24 employees25-249 employees250-499 employees500-999 employees>1000 employees
AirportAmtrakBus StationBusiness and IndustryCultural and HistoricalUniversity and CollegeHigh SchoolGovernmentHospital and Medical
Shopping CenterSport and Entertainment
Park, Recreation, orNature Preserve
NHS Connector Routes
Modal ConflictsGrade Separation ProjectsIntermodal Project Sites
15

TMACOG Multimodal Needs Assessment
September, 2011 17
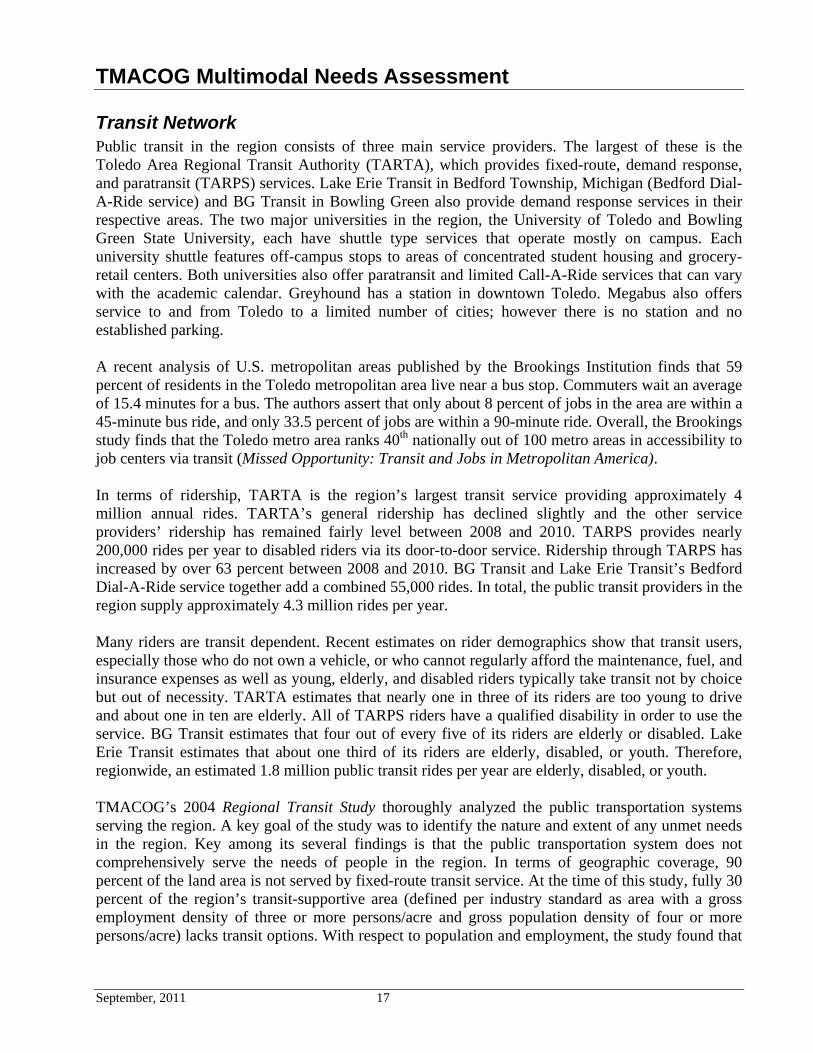
Transit Network Public transit in the region consists of three main service providers. The largest of these is the Toledo Area Regional Transit Authority (TARTA), which provides fixed-route, demand response, and paratransit (TARPS) services. Lake Erie Transit in Bedford Township, Michigan (Bedford Dial-A-Ride service) and BG Transit in Bowling Green also provide demand response services in their respective areas. The two major universities in the region, the University of Toledo and Bowling Green State University, each have shuttle type services that operate mostly on campus. Each university shuttle features off-campus stops to areas of concentrated student housing and grocery-retail centers. Both universities also offer paratransit and limited Call-A-Ride services that can vary with the academic calendar. Greyhound has a station in downtown Toledo. Megabus also offers service to and from Toledo to a limited number of cities; however there is no station and no established parking. A recent analysis of U.S. metropolitan areas published by the Brookings Institution finds that 59 percent of residents in the Toledo metropolitan area live near a bus stop. Commuters wait an average of 15.4 minutes for a bus. The authors assert that only about 8 percent of jobs in the area are within a 45-minute bus ride, and only 33.5 percent of jobs are within a 90-minute ride. Overall, the Brookings study finds that the Toledo metro area ranks 40th nationally out of 100 metro areas in accessibility to job centers via transit (Missed Opportunity: Transit and Jobs in Metropolitan America). In terms of ridership, TARTA is the region’s largest transit service providing approximately 4 million annual rides. TARTA’s general ridership has declined slightly and the other service providers’ ridership has remained fairly level between 2008 and 2010. TARPS provides nearly 200,000 rides per year to disabled riders via its door-to-door service. Ridership through TARPS has increased by over 63 percent between 2008 and 2010. BG Transit and Lake Erie Transit’s Bedford Dial-A-Ride service together add a combined 55,000 rides. In total, the public transit providers in the region supply approximately 4.3 million rides per year. Many riders are transit dependent. Recent estimates on rider demographics show that transit users, especially those who do not own a vehicle, or who cannot regularly afford the maintenance, fuel, and insurance expenses as well as young, elderly, and disabled riders typically take transit not by choice but out of necessity. TARTA estimates that nearly one in three of its riders are too young to drive and about one in ten are elderly. All of TARPS riders have a qualified disability in order to use the service. BG Transit estimates that four out of every five of its riders are elderly or disabled. Lake Erie Transit estimates that about one third of its riders are elderly, disabled, or youth. Therefore, regionwide, an estimated 1.8 million public transit rides per year are elderly, disabled, or youth. TMACOG’s 2004 Regional Transit Study thoroughly analyzed the public transportation systems serving the region. A key goal of the study was to identify the nature and extent of any unmet needs in the region. Key among its several findings is that the public transportation system does not comprehensively serve the needs of people in the region. In terms of geographic coverage, 90 percent of the land area is not served by fixed-route transit service. At the time of this study, fully 30 percent of the region’s transit-supportive area (defined per industry standard as area with a gross employment density of three or more persons/acre and gross population density of four or more persons/acre) lacks transit options. With respect to population and employment, the study found that

TMACOG Multimodal Needs Assessment
September, 2011 18
more that 47 percent of the region’s population and 57 percent of jobs in the region are not served by fixed-route service. Another finding highlights inadequacies of schedule especially for night and weekend hours. This is especially problematic for riders who work second or third shift. A further problem noted is the restricted access to transit among the region’s transit dependent population. In summary, the comprehensive Regional Transit Study reveals a somewhat fragmented transit system that is challenged to serve some key populations and areas. The 2005 Regional Core Circulator Study conducted for TMACOG by Wilbur Smith Associates focused on the downtown Toledo area. The purpose of this analysis was to identify the best overall mode of downtown transportation in order to support and expand the urban economic core of the region. This study found that the locally preferred alternative involved a streetcar system in combination with other operational changes to bus loops and street directional operations (one-way/two-way). Other recommended improvements dealt with streetscapes, wayfinding, and connectors to major medical and educational institutions. Alternative funding priorities and fiscal constraints at both the federal and local levels prevented implementation. Taking into consideration the current population trends along with the ridership facts noted above, it is likely that the problems identified in these previous studies are the same today, if not worse. Fuel prices have risen and become more volatile in the past few years and undoubtedly play a role among riders who choose public transit (unlike those who ride due to necessity such as the elderly or disabled). There are signs that as prices at the gas pump rise, individuals are expanding their trip-making options to select modes other than the personal vehicle. TARTA confirms that bus ridership fluctuates somewhat with changing gas prices. All TARTA buses are equipped with bicycle racks and riders can transport their bikes free of charge to facilitate mode-combining. Since the publication of these studies, TARTA has undergone declines in funding and corresponding changes to its service pattern. TARTA, as shown in figure 2, has an unusual funding structure. More than any other provider in the region (or elsewhere in the state) TARTA is dependent to a very large degree on local funds – primarily a property tax – for its basic operations. TARTA’s contracts for services with entities such as the Toledo Public School system and Owens Community College generate some added revenue.

TMACOG Multimodal Needs Assessment
September, 2011 19
Figure 2. 2010 Funding Sources of Toledo Metropolitan Area Transit Providers
20%
50%58%
24%
32%
2%43%
10%
19%
13%8%
20%
BG TRANSIT LAKE ERIE TRANSIT TARTA
Farebox
Federal
State
Local
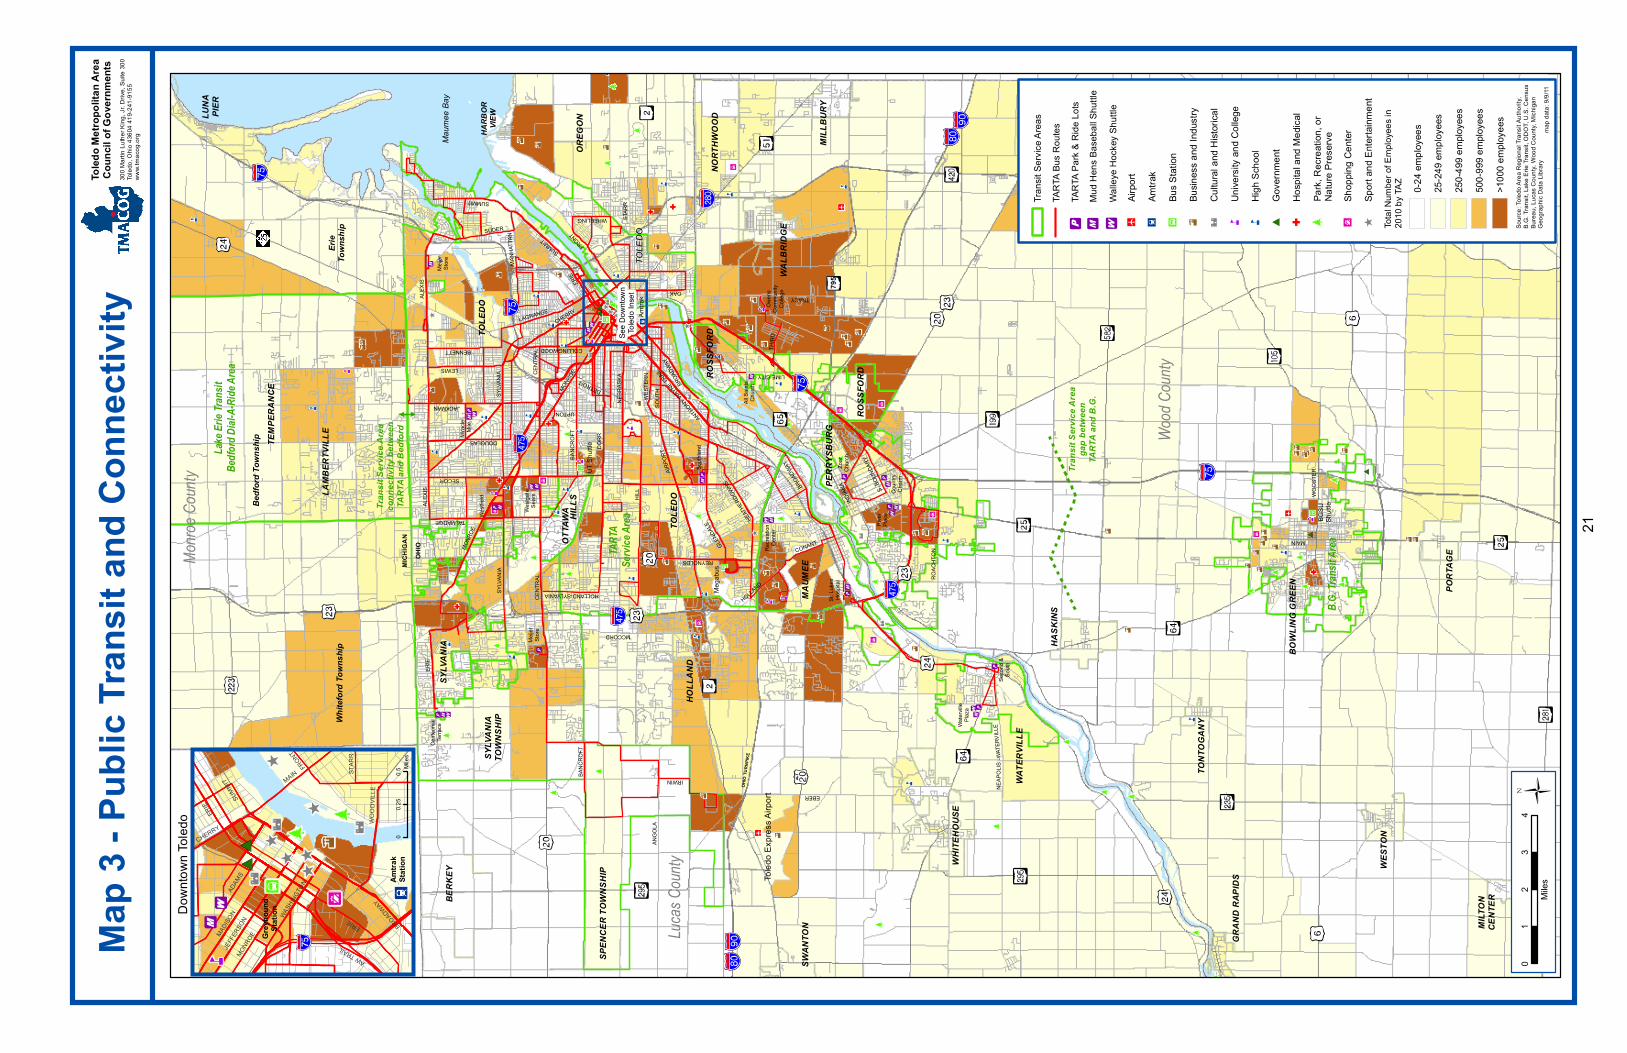
TARTA’s locally sourced funds primarily come from a property tax levied on the nine jurisdictions within the TARTA service area. As shown on Map 3, in addition to Toledo, TARTA serves the suburban communities of Ottawa Hills, Sylvania, Rossford, Maumee, Perrysburg, and Waterville, along with Sylvania and Spencer townships. Until recently, no community could leave the service area without the approval of the remaining jurisdictions. In 2011, Ohio enacted legislation (Am. Sub. H.B. 153) allowing communities to opt in or out of the service and tax levy by way of a local ballot measure. The consent of the remaining jurisdictions is no longer required. While this opt-out method increases local control of taxation, it further fragments the regional approach to the provision of public transit. In contrast, most other larger metropolitan area transit providers in Ohio depend upon a county-wide sales tax. As can be seen from Lake Erie Transit revenue sources, the Michigan public transit funding formula provides significantly greater state funding than is the case in Ohio. The 2009 TARTA Comprehensive Operational Analysis (COA) examined the property tax-based funding mechanism in relation to service provision alternatives. It also considered other funding options such as sales tax derived revenue. The study found in favor of a downtown Toledo hub in combination with a Lucas County sales tax (plus the two Wood County jurisdictions of Perrysburg and Rossford). The authors of the COA support this as the most viable alternative to serve the greatest number of people in the most efficient way. A countywide sales tax might enable TARTA to extend service coverage beyond its current reach and could potentially address the unserved needs identified in this and previous studies. However, it is worth noting that sales taxes ebb and flow with economic cycles (in ways that property taxes were relatively immune from—at least until the

TMACOG Multimodal Needs Assessment
September, 2011 20
mortgage driven housing market collapse of 2008) and can fall short of funding needs in recessionary times. Other recommendations set forth in the COA include the addition of cross-town routes, expanded evening and weekend service, and combined Call-A-Ride zones to allow users to travel to adjacent communities. A combination of regular bus routes and Call-A-Ride service covers the TARTA service area. There is no public transit connection between Toledo and Bowling Green, the region’s two largest population centers. Two daily links between Lake Erie Transit’s Bedford Dial-A-Ride and TARTA, plus one on-call connection from Bedford to the Miracle Mile shopping center in Toledo, form the connectivity between providers. In terms of parking, TARTA has arrangements in various locations for “park and ride” commuters and for Mud Hens Baseball/Walleye Hockey Shuttle pickup points. These are usually busy suburban lots with good lighting. Privately operated Megabus provides intercity service at discounted rates and uses the site of a now demolished mall for its pickup point. With no redevelopment at this location, its parking is inadequate and does not offer security, especially for those wishing to leave vehicles overnight or for several days. Currently, a city block separates the closest TARTA bus connection from the Amtrak station, an inconvenience to able-bodied travelers, let alone the elderly and disabled. The hours of service mismatch between the Amtrak trains schedule and the TARTA bus schedule exacerbates the connectivity problem. TARTA buses are few during the overnight and early morning hours when the Amtrak trains arrive. A new $7.5 million TARPS paratransit intermodal facility is being constructed next door to the Martin Luther King, Jr. Plaza. The structure will house as a service garage and some administrative offices for TARPS. It is scheduled to open in late 2011. A TARTA stop at this location could support efforts to expand transportation services available at the plaza. However, the hours of service mismatch would still present connectivity problems for late night arriving rail passengers. Connections between the transit and bicycle/pedestrian networks exist. All TARTA buses accommodate bicycles, although there are no bike parking stations that offer the ability to lock up and leave a bike rather than take it on the bus. A review of over 2,000 TARTA bus stops in relation to sidewalk locations revealed very few bus stops where sidewalks were absent. The need for or presence of other infrastructure, such as shelters or benches for riders who are waiting for buses, has not been evaluated for this study. Map 3 depicts the transit service areas covered by TARTA, Bedford Dial-A-Ride, and BG Transit in relation to one another and to key destinations and employment density. The map offers a look at within-mode connections between transit providers and multimodal connections to sidewalks and parking areas.
Toled
o Exp
ress A
irport
OHIO
TURN
PIKE
Lake
Erie
MICH
IGAN
OHIO
OREG
ONLUNA
PIER
579
Monro
e Coun
ty
Lucas
Count
y
Wood
Count
y
Sandu
sky Co
unty
163
199
Lake E
rie Tr
ansit
Bedfo
rd Dia
l-A-Ri
de Are
a
B.G. Tr
ansit
Area
TEMP
ERAN
CE
LAMB
ERTV
ILLE
Bedf
ord T
owns
hip
BERK
EYSY
LVAN
IA
SYLV
ANIA
TOW
NSHI
P
OTTA
WA
H
ILLS
TOLE
DO
TOLE
DO
HARB
ORVIE
W
Maum
ee B
ay
TOLE
DO
NORT
HWOO
D
MILL
BURY
WALB
RIDG
E
ROSS
FORDRO
SSFO
RD
PERR
YSBU
RG
MAUM
EE
HOLL
AND
SPEN
CER
TOW
NSHI
P
SWAN
TON
WHI
TEHO
USE
WATE
RVILL
E
HASK
INS
TONT
OGAN
Y
GRAN
D RA
PIDS
BOW
LING
GREE
N
LUCK
EY
PORT
AGE
WES
TON
PEMB
ERVI
LLE
CENT
RAL
MONR
OE
BANC
ROFT
SYLV
ANIA
ANGO
LA
ERIE
ALEX
IS
BANC
ROFT
DORR
HILL
BENNETT
JACKMAN
SECOR
TALMADGE
MONROE
UPTON
SUMMIT
CHERRY
FRONT
STAR
R
MANH
ATTA
N
OAK
AIRPO
RT
ANTHONY WAY
NE TRAIL
BROA
DWAY
GLEN
DALE
REYNOLDS
MCCORD
LAGRANGE
NEBR
ASKA
DETROIT
HEAT
HERD
OWNS
TRACY
Cente
nnial
Terra
ce
Meije
rSto
reWe
stgate
Sears
Mirac
le M
ileWe
stfiel
d
Meije
rSto
re
All Sa
ints
Churc
h
South
land
Recre
ation
Cente
r
St. Lu
kes
Hosp
ital
River
Place
Coun
tryCh
arm
Zoar
Churc
h
Water
ville
Plaza
795
Owen
sCo
mmun
ityCo
llege
EBER
CENT
RAL
WEST
ERN
SOUT
H
MILT
ONCE
NTER
SUMMIT
WHEELING
SUDER
ALEX
IS ERIE
COLLINGWOOD
LEWIS
DOUGLAS
SYLV
ANIA
HOLLAND-SYLVANIA
IRWIN
LIME CITY
THIR
D
BROA
DWAY
HOLLAND
CONANT
INDIAN
A S. BO
UNDA
RY
ROAC
HTON
NEAP
OLIS
-WAT
ERVI
LLE
Erie
Town
ship
White
ford
Town
ship
TART
ASe
rvice
Area
Seco
nd &
South
Tran
sit S
ervic
e Are
aga
p betw
een
TART
A an
d B.G
.
UT S
huttle
Mega
bus
Amtra
k
BGSU
Shutt
leWO
OSTE
R
MAIN
Tran
sit S
ervic
e Are
aco
nnec
tivity
betw
een
TART
A an
d Bed
ford
CLAY
CEN
TER
RISI
NGSU
N
Map 3
- Pub
lic Tr
ansit
and C
onne
ctivit
y30
0 Mart
in Lu
ther K
ing, J
r. Driv
e, Su
ite 30
0To
ledo,
Ohio
4360
4 419
-241-9
155
www.t
maco
g.org
Toled
o Metr
opoli
tan A
rea
Coun
cil of
Gov
ernm
ents
01
23
4Mi
les
ERIE
SUMMIT
ADAM
SMONR
OE
WASHIN
GTON
ERIE
MADISO
N
WOOD
VILLE
OAK
E. BROADWAY
MIAMI
FRONT
CHERRY
BROADWAY
AW TRAIL
STAR
R
MAIN
JEFF
ERSO
N
Amtra
kSta
tion
Grey
houn
dSta
tion
See D
ownto
wnTo
ledo I
nset
Down
town T
oledo
00.2
50.5
Miles
Sourc
e: To
ledo A
rea R
egion
al Tra
nsit A
uthori
ty,B.G
. Tran
sit, L
ake E
rie Tr
ansit
, ODO
T, U.
S. Ce
nsus
Burea
u, Lu
cas C
ounty
, Woo
d Cou
nty, M
ichiga
nGe
ograp
hic D
ata Li
brary
ma
p data
: 9/9/
11
Total
Num
ber o
f Emp
loyee
s in
2010
by TA
Z 0-24 e
mploy
ees
25-24
9 emp
loyee
s25
0-499
emplo
yees
500-9
99 em
ploye
es>1
000 e
mploy
ees
Airpo
rtAm
trak
Bus S
tation
Busin
ess a
nd In
dustr
yCu
ltural
and H
istori
cal
Unive
rsity
and C
olleg
eHig
h Sch
ool
Gove
rnmen
tHo
spita
l and
Med
ical
Shop
ping C
enter
Sport
and E
nterta
inmen
t
Park,
Rec
reatio
n, or
Natur
e Pres
erve
TART
A Bus
Rou
tesTra
nsit S
ervice
Area
s
Mud H
ens B
aseb
all Sh
uttle
TART
A Park
& Ri
de Lo
ts
Walle
ye H
ocke
y Shu
ttle
21


TMACOG Multimodal Needs Assessment
September, 2011 23
Non-Vehicular Transportation Network A multimodal system offers a balanced mix of personal transportation options beyond motorized travel all of which must blend with the freight system. The TMACOG region seeks to improve quality of life by expanding pedestrian and bicycle transportation options and improving system safety. It is regional policy to consider adding pedestrian and bicycle facilities (bike lanes or paths) with roadway construction projects. As bridges are re-decked, rebuilt or newly constructed improvements to pedestrian and bikeway facilities are considered. Bridges over (or underpasses of) major barriers – expressways, railroad tracks, and rivers – should be considered for inclusion of raised sidewalks and striped/signed bike lanes as part of a “complete streets” policy and to eliminate choke points. Bikeways, sidewalks, and multi-use paths serve to support the same trip purposes as the roadways and the public transit system. In addition, a well-designed bicycle-pedestrian system is accessible to diverse users including seniors, people with disabilities or special needs, and other non-drivers such as those too young to drive. An added benefit of the non-motorized network is that it facilitates recreational and fitness goals of the community. Connectivity between the bicycle, pedestrian, and motorized networks enhances the safety and functionality of the entire system. Equally important, a strong, well-used non-vehicular network is likely to reduce pollution as people respond to options presented by walkable and bikable communities.
Bike Network The TMACOG regional bikeway system includes one-way specially marked bike lanes that are designated within roadways, roadways with signed routes, multi-use trails and paths suitable for non-motorized transportation (with ADA motorized modes excepted), and bicycle parking facilities. The Bicycle Facilities Guide published and updated periodically by TMACOG builds awareness about the bikeways network in northwest Ohio and southeast Michigan for both commuters and recreational riders. Some proposed segments will connect existing trails. For example, once the Wabash Cannonball Trail and the North Coast Inland Trail (NCIT) are connected, there will be a nearly complete system of trails extending across Ohio from Indiana to Pennsylvania. Several bikeway projects currently underway or proposed attempt to link existing facilities and/or provide fuller implementation of a numbered, signed bike route system. Discussions are taking place surrounding the concept of a regional “loop” to connect other facilities such as the Wabash Cannonball Trail, I-280 trench path, Westside Corridor, University/Parks Trail, etc. The North Coast Inland Trail and the Oregon bike network are also targeted for future development. The Westside Rail Corridor project is a critical piece in ongoing efforts to preserve abandoned rail corridors and develop them for multiple non-motorized uses. This rail corridor, shown on Map 4, extends from nearly the Ohio-Michigan state line across Lucas County and the Maumee River into Wood County. Several partners are collaborating on the $6.5 million acquisition of approximately 11 miles of the CSX Toledo Terminal Westside Corridor. The partners are the Trust for Public Land, Metroparks of the Toledo Area, University of Toledo, City of Toledo, Wood County Park District, Wood County Port Authority, and TMACOG. The purchase of this corridor is intended as a

TMACOG Multimodal Needs Assessment
September, 2011 24
protective buy to preserve the rail right-of-way for future use. The intent is to develop, design, and construct a multi-use path thereby creating a key artery in the bike facility network. As can be seen on Map 4, the proposed Westside Corridor location running through relatively dense Traffic Analysis Zones suggests that the envisioned trail would become highly used for commuting as well as recreational purposes. It would offer within-mode connectivity to two main bikeways. The Westside Corridor intersects the University/Parks Trail and a significant 38-mile east-west Share-the-Road signed route. The cross-county route follows Bancroft Road in western Lucas County, traverses through rural, suburban, and urban zones, following Corduroy Road on the eastern edge of the county towards Lake Erie. Good pavement condition is critical to the usefulness of dedicated on-road bike lanes and Share-the-Road routes. According to 2009 Pavement Condition Rating (PCR) data provided by the Ohio Department of Development, most Share-the-Road routes and bike lanes score well (very good to good). Acceptable pavement conditions improve the safety and convenience for riders as well as for the drivers with whom they share the road. However, some segments have low PCRs (fair to very poor). Many of these segments serve the downtown core. For example, the stretch of roadway on Summit Street from Clayton to Lafayette presents hazards to cyclists, potentially dissuading some from choosing this route. Overall, 4.02 bikeway miles rate very poor, 5.27 miles rate poor, and 5.40 miles rate fair. Low PCRs occur on sections of Bancroft Street between Reynolds Road and Cherry Street, on sections of Broadway Street from Glendale Avenue to Summit Street, and on Summit from Broadway to Suder Avenue. Map 4 depicts existing multi-use paths, one-way specially marked on-road lanes, and signed connector/Share-the-Road routes. Proposed facilities as shown will close many of the gaps within the bicycle mode. Established parking facilities and “ad hoc” parking lots such as school lots reveal places where the transition between car and bike modes likely occurs. Stretches of on-road bike routes with low PCRs reveal where improvements would benefit both motorized and non-motorized modes. The ability for individuals to combine bicycling with another mode during a single trip is somewhat dependent on the presence, location, and condition of bike racks, lockers, or parking facilities. A greater understanding as to how current bicycle commuters use the system, their ratings of it, and user suggestions for improvements would support future planning.

ò
^
oo
o
^
^
o
k
J
k
k
ò[[ò[
G
o
G
ò
ò
^
^ G
k
k
o
o
o
o
o
o
G
G
k
^
G
G
G
oo
^I2
o
o
[#*
o
^
^
o
[
[
[[
k
[#*
k
o
kk
o
o
o
o
o
k
k
k
k
k
C
C
C
C
C
C
C
C
C C
C
C
C
C
o
k
k
k
k
k
k
k
kk
k
k
ko
k
k
k
k
kk
k
k
k
k
k
k
C
C
CC
C
C
CC
o
oo
[oo
C
C
C
C
C
C
ò
ò
[
C
C
C
C
C
CC
Ja
Ja
C
J
ò
IAIAIA
XY
XYIA
IAXYIAIA
XY
IA
IAIAXYIA
IAIA
IAIA
IAIAIAIA
XY
IAIAIA
IAIAIAIA
XYIAIAXY
XY
IAIA
IAIAIAIA
IA
IAIA
IA
IAIA
IAIA
XY IA
XY
IAIAIA
XY
IA XY IA
IA
IA
IAIA
IAIA
IA
XY
IA
IA
§¦75
§¦75
§¦475
§¦475
§¦280
§¦80
§¦80
tu23tu20
tu23
tu24
tu24
tu20A
tu20
§¦90
§¦90
L u c a s C o u n t yL u c a s C o u n t y
W o o d C o u n t yW o o d C o u n t y
L a k e E r i e
M o n r o e C o u n t yM o n r o e C o u n t y
tu20 tu24
tu24
SEE
TOLEDO
INSET
We
sts
ide
Co
rrid
or
Wabash Cannonball Trail - North
Wabash Cannonball Trail -
South
Towpath Trail
University/Parks Trail
To the NorthCoast Inland Trail
Har
old
Le
wis
Do
ug
las
Kil
bu
rn
Sylvania-Metamora
Bri
nt
Pa
rk
BancroftCorduroy
Oregon BikeNetwork
Maumee-Perrysburg
Bridge
Kin
g
Alb
on
FallenTimbers
Sta
diu
m
!
TOLEDO
OREGON
MAUMEE
NORTHWOOD
SYLVANIABERKEY
PERRYSBURG
ROSSFORD
WATERVILLE
WHITEHOUSE
WALBRIDGE
HASKINS
OTTAWAHILLS
LUNA PIER
HOLLAND
MILLBURY
LUCKEY
SWANTON
TONTOGANY
HARBOR VIEW
Ü0 2 41
Miles
Map 4 - Bikeway Facilities
Date of Map: September 7, 2011
o
#*
#*
k
^
G
k
k
k
CC
CCC
C
CC
CCCC
C
C
C
o
o o
o
o
J
ò
IA
XY
IA
IA
IA
§¦75
tu6
BOWLINGGREEN
PORTAGE
NORTH BALTIMORE
Sli
pp
ery
Elm
Tra
il
CYGNET
JERRY CITY
Wooster St.I-75 overpass
Bowling Green Inset
ò
[[ò
[
G
ò
G
G
o
o
^
I2
[
#*
k
[#*
C
C
C
k
k
k
k
k
C
C
CC
[ o
ò
òJa
IA
IA
IA
IAIAIA
§¦75
§¦280
!
Summ
it Bik
e Pat
h
Phase
2
Phase 1
EastsideTrail
Front BikePath
Bancroft
Cherry
Seaman
Starr
Morrison
Green
belt
I-2
80
Bik
e T
rail
Woodville
Riverside Trail
Toledo Inset
Area of Extent for the Main Map
Area of "Bowling Green Inset"
Bike FacilityLength (Miles)
Bike Lane 12Multi-Use Path 94Share-the-Road Route 98Committed/Proposed Project 39
Parking Lot Near Bike Facility
IA Dedicated Parking Lot
XY Ad Hoc Parking Lot
Key Destination
[ Sport and Entertainment
^ Shopping Center
oPark, Recreation, and Nature Preserve
G Hospital and Medical
#* Government
k High School
k University and College
ò Cultural and Historical
C Business and Industry
Ja Bus Station
I2 Amtrak
J Airport
Traffic Analysis Zone (TAZ)
Total Number of Employees in 2010
0-24 employees
25-249 employees
250-499 employees
500-999 employees
>1000 employees
Interstate and US routes
New US-24
Maumee River/Lake Erie
Municipality Boundary
Base Layers * Includes projects listed on the 2035 Long Range Plan - Update 2011 Priority Projects list
^ Includes projects listed on the 2035 Long Range Plan - Update 2011 Committed Projects list oron the 2012-15 TIP Projects list
Bike Facility
Proposed Bike Project *
Committed Bike Project ^
Existing Bike Lane
Existing Multi-Use Path
Share-the-Road Route
Low Pavement ConditionRating on Bike Lanes
Low Pavement ConditionRating on Share-the-Road Routes
Toledo Metropolitan AreaCouncil of Governments
300 Martin Luther King, Jr. Dr., Ste 300Toledo, Ohio 43604Phone (419) 241-9155www.tmacog.org
25


TMACOG Multimodal Needs Assessment
September, 2011 27
Pedestrian Networks Sidewalks and their infrastructure (signals, crosswalks, signage) support the development of a more people-friendly system. TMACOG (especially through its Pedestrian and Bikeways committee) seeks to promote consistency in sidewalk and trail maintenance regulations across the region. In order to maintain pedestrian systems, political jurisdictions within the region are encouraged to enact and enforce laws on construction and maintenance of walks. Jurisdictions are further encouraged to include in their snow/ice removal plans a policy concerning publicly owned walks/trails, and enact/enforce laws regarding clearing facilities adjacent to private property. A policy mechanism giving townships authority over maintaining and clearing sidewalks would enhance the network. To facilitate a comprehensive approach to the pedestrian network TMACOG has recently completed a physical inventory of all sidewalks in the region, documenting the overall continuity they provide to pedestrians. The sidewalk inventory details whether sidewalks are present on both sides of the street, one side, or not present at all. This new resource can facilitate progress towards a regional sidewalk policy, support initiatives by local schools to improve safety, and enhance efforts by jurisdictions to enforce their existing sidewalk construction and maintenance laws. Sidewalks have been the subject of previous TMACOG analyses to identify schools with substandard pedestrian facilities. The earliest phase was a pilot project that tested a walking survey methodology. Students, school staff, and local government officials were asked to provide assessments of pedestrian routes to school. In partnership with King Elementary School in Toledo, this process explored specific ways to assess pedestrian routes and address ways to improve the ability of students to walk safely to school. The next phase expanded the pilot project into a region-wide study of all schools with 79 schools from 16 districts participating. The 2003 study entitled Pedestrian Facilities Inventory – Phase II integrated the results of a written survey with total enrollments and number of walkers per school. Several schools with the greatest pedestrian concerns were identified. Problems dealt with limited presence of sidewalks, or sidewalks in poor repair or which were poorly maintained (i.e., snow or vegetation). One approach schools can use to get financial support to address pedestrian networks is via the federal Safe Routes to School (SRTS) program. Several schools in the region have accessed this resource. Results of walking audits have led to infrastructure and non-infrastructure improvements such as the addition of crosswalks and traffic calming techniques to improve safety. Investments in SRTS initiatives since 2007 have exceeded $941,000 in 14 projects and involved 20 schools. As detailed in Table 2, five infrastructure projects, two non-infrastructure projects, three combined infrastructure and non-infrastructure projects, and four planning/start up projects have occurred to date.

TMACOG Multimodal Needs Assessment
September, 2011 28
Table 2. Summary of Safe Routes Initiatives with the Region Schools Award Type Year City County Project Summary
Anthony Wayne Schools $6,000 3 2007 Waterville Lucas School Travel Plan Engineering Funding and Other
$22,400 1 2007 Whitehouse Lucas Ped Bridge and Sidewalks
Chase Elementary School $6,000 4 2008 Toledo Lucas School Travel Plan and Other
Coy and Starr Elementary Schools and Fassett Middle School
$240,000 1 2008 Oregon Lucas Sidewalks on Pickle Road, Edward Street, Starr Ave.
$150,000 1 2007 Sidewalk improvements
$93,692 2 2011 Walking School Bus Event, Walking Club, Get Moving, Tallies and surveys, Media Campaign, Contest
$50,000 2 2009 Education, Encouragement
Elmhurst Elementary School $6,000 4 2008 Toledo Lucas School Travel Plan and Other
Garfield Elementary School $6,000 4 2008 Toledo Lucas School Travel Plan and Other
Glenwood Elementary School $6,000 4 2008 Toledo Lucas School Travel Plan and Other
Highland and Maplewood Elementary Schools and McCord JHS
$202,465 1 2011 Sylvania Lucas Signage, pavement markings, crossings pedestrian signals and flashing beacons for 4 schools.
Fort Meigs, Frank, St Rose, Toth, and Woodland Elementary Schools
$24,000 3 2007 Perrysburg Wood School Travel Plan Engineering Funding and Other
$123,000 1 2010 Signing and pavement markings
Haskins Elementary School $6,000 3 2007 Haskins Wood School Travel Plan Engineering Funding and Other
Total $941,557 Notes on Type:
1. Infrastructure — This includes, but is not limited to, sidewalk improvements; traffic calming and speed reduction improvements; pedestrian and bicycle crossing improvements; on-street bicycle facilities; off-street bicycle and pedestrian facilities; secure bicycle parking facilities; and traffic diversion improvements in the vicinity of schools. 2. Non-infrastructure — This includes, but is not limited to, the creation and reproduction of promotional and educational materials; bicycle and pedestrian safety curricula, materials and trainers; training, including SRTS training workshops that target school- and community-level audiences; modest incentives for SRTS contests, and incentives that encourage more walking and bicycling over time; data gathering, analysis, and evaluation reporting at the local project level; equipment and training needed for establishing crossing guard programs. 3. Combined infrastructure and non-infrastructure — A project that combines infrastructure and non-infrastructure funding into a single award rather than making separate awards for each. These individual projects can include activities described in the Infrastructure and Non-infrastructure definitions listed above. 4. Planning/Start-up — This includes, but is not limited to, assistance developing a comprehensive SRTS action plan setting up a SRTS program.
Data Source: Prepared from data provided by the National Center for Safe Routes to School, www.saferoutesinfo.org. The new sidewalk inventory combined with the most current data involving car-pedestrian and car-cyclist accidents has the potential to provide a new way to identify areas where the need for modal conflict reduction is greatest. A review of pedestrian and bicycle accident frequency during 2009 and 2010 within a half-mile radius of all schools in the region reveals that most school areas have very few crashes (see inset on Map 5). A close-up view of schools and sidewalks in two of the three areas where pedestrian crashes are highest is presented on Map 5. The 9 schools in these areas are listed in Table 3 along with their enrollments. The relative enrollment at each school within the accident zone can offer added insight into where to target resources to reduce modal conflict.

TMACOG Multimodal Needs Assessment
September, 2011 29
Table 3. Enrollments of Schools in Accident Zones School EnrollmentAutism Academy of Learning 54Garfield Elementary 279Horizon Science Academy 282St. Thomas Aquinas 346Sherman Elementary 373Robinson Elementary 397Raymer Elementary 458Toledo School for the Arts 528Waite High School 1,043
It is not possible to draw conclusions as to the need for improvements in these or other zones without better information such as might be generated by replicating the 2003 Pedestrian Facilities study discussed above. For example, the accidents within the zones may or may not have had anything to do with school-generated traffic. More analysis on accident specifics and a better inventory of sidewalk/curb conditions, crosswalk design, and signage in high accident zones could help to direct limited resources to where they would be most needed in reducing modal conflicts.

TMACOG Multimodal Needs Assessment
September, 2011 30
This page intentionally left blank.
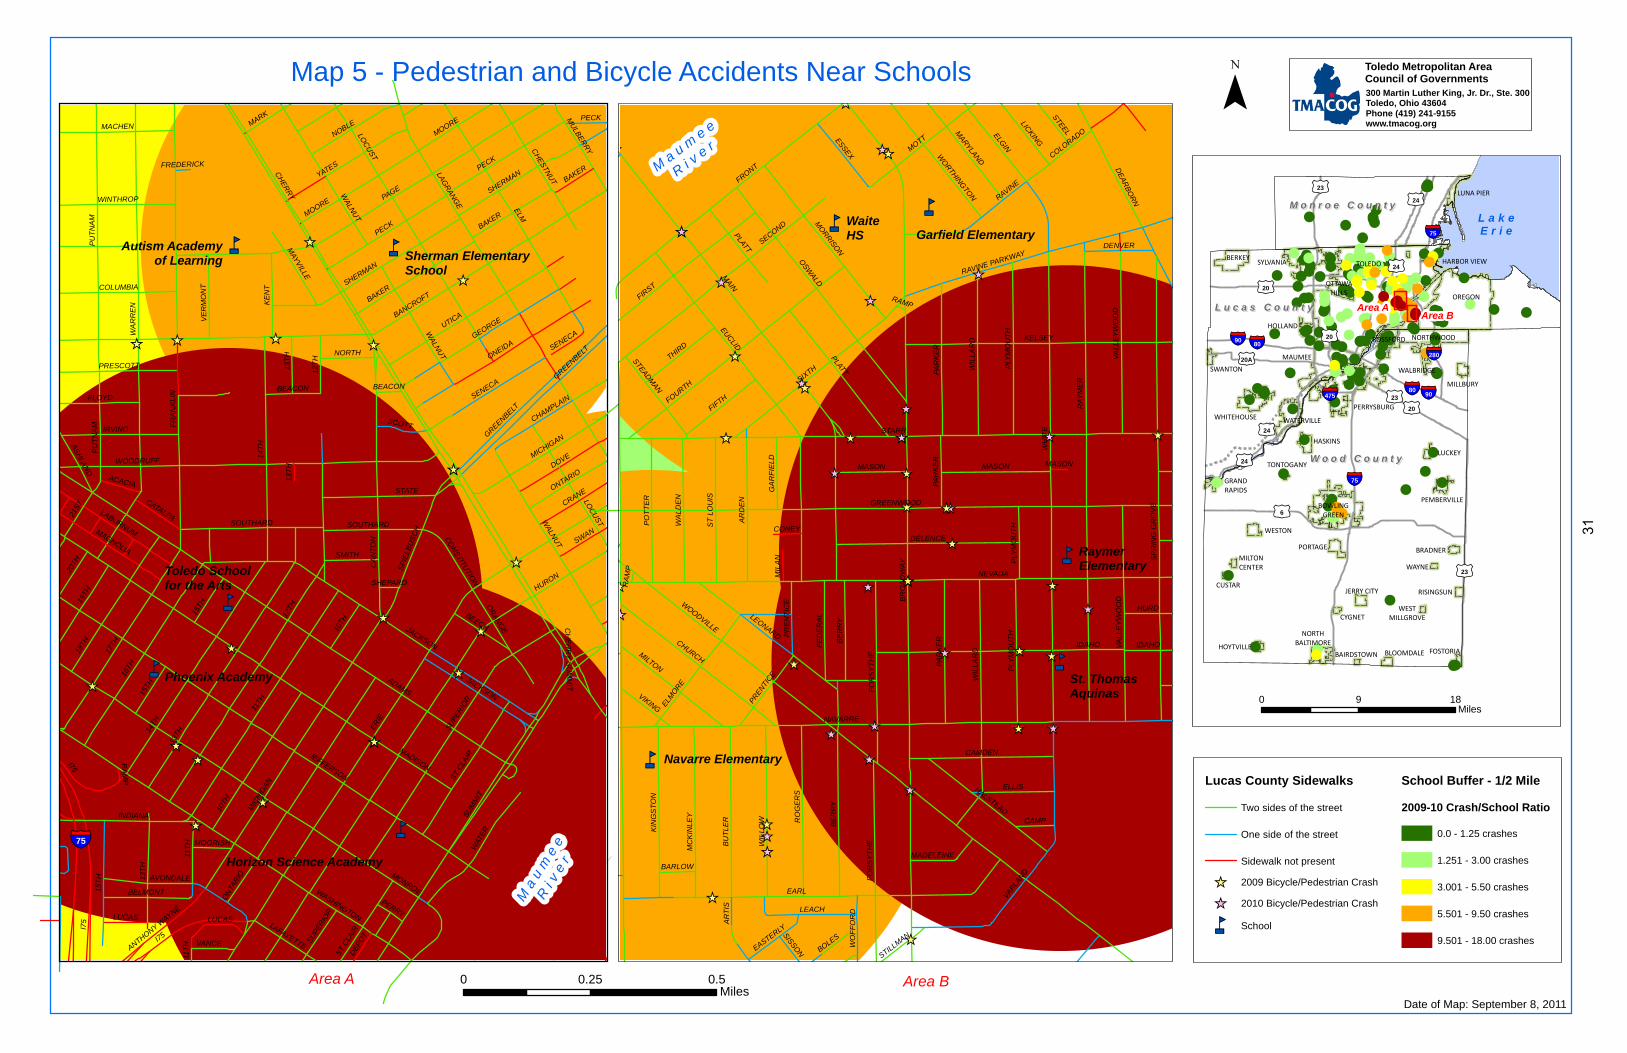
Map 5 - Pedestrian and Bicycle Accidents Near Schools
Date of Map: September 8, 2011
0 0.25 0.5Miles
0 9 18Miles
¯
kj
kj
kj
kj
kj
[_
[_[_
[_
[_
[_
[_
[_[_
[_[_
[_
[_[_[_
[_ [_
[_
[_
[_
[_[_
Autism Academyof Learning Sherman Elementary
School
Toledo Schoolfor the Arts
Phoenix Academy
Horizon Science Academy
Ma
um
ee
Ri v
er
§¦75
ER
IE
CH
ER
RY
12TH
ADAMS
PAGE
HURON
ELM
11TH
BANCROFT
MADISON
MONROE
WA
RR
EN
14T
H
FR
AN
KL
IN
17TH
16TH
JEFFERSON
I75
JACKSON
LOC
US
T
LAG
RA
NG
E
UTICA
10TH
SUM
MIT
18TH
CA
NT
ON
WOODRUFF
MIC
HIG
AN
WASHINGTON
ON
TAR
IO
PU
TN
AM
SU
PER
IOR
ONEIDA
PECK
15T
H
WA
LNU
T
13T
H
GEORGE
YATES
WAT
ER
STATE
19TH
DOVE
GREENBELT
ST
CLA
IR
SHERMAN
IRVING
SENECA
KE
NT
INDIANA
NOBLE
BAKER
CH
ES
TNU
T
MACHEN
OR
AN
GE
SP
IELB
US
CH
SOUTHARD
FLOYD
LABURNUM
MOORE
MAGNOLIA
CHAMPLAIN
CRANE
COLUMBIA
21S
T
PRESCOTT
WINTHROP
20TH
BEECH
MARK
SWAN
BELMONT
MU
LBE
RR
Y
MAY
VILLE
SMITH
VE
RM
ON
T
AVONDALE
LUCAS
SCOTT
NORTH
AS
HLA
ND
LAFAYETTE
BEACON
VANCEANTHONY W
AYNE
CATALPA
ACACIA
CO
NS
TITUTIO
N
DE
PO
T
PERRY
FREDERICK
MOORISH
RA
MP
SHEPARD
CH
ER
RY
SU
MM
IT
12T
H
11T
H
I75
13T
H
SOUTHARD
10TH
15TH
14TH
SHERMAN
BEACON
PU
TN
AM
BAKER
WA
LNU
T
13TH
I75
SENECA
MICHIGAN
ONTARIO
LOC
US
T
11T
H15
TH
13
TH
GREENBELT
SUP
ERIO
R
PECK
ST
CLA
IR
PECK
WA
LNU
T
BAKER
JACKSON
MOORE
LUCAS
Area A
kj
kj
kj
kj
kj
[_
[_
[_
[_
[_
[_[_
[_
[_
[_
[_
[_
[_[_
[_
[_
[_
[_
[_
[_
[_ [_
[_
[_[_
[_
[_
[_[_
[_
[_
[_
[_
[_
[_
[_
[_
[_
[_
[_
[_
[_
[_
[_
[_
[_
[_
Navarre Elementary
St. ThomasAquinas
RaymerElementary
WaiteHS Garfield Elementary
Ma u m
e e
Ri v
e r
WH
ITESTARR
BR
OA
DW
AY
EARL
MAIN
NEVADA
NAVARRE
RA
YM
ER
WOODVILLE
EUC
LID
FRONT
GREENWOOD
IDAHO
SIXTH
KELSEY
FOURTH
BE
RR
YO
SWALD
SECOND
SP
RIN
G G
RO
VE
FIRST
PLATT
MOTT
CHURCH
RAVINE
BU
TL
ER
ELM
OR
E
WIL
LOW
LEONARD
AR
DE
N
RO
GE
RS
DELENCE
PA
RK
ER
FO
RS
YT
HE
WIL
LAR
D
DE
AR
BO
RN
PO
TT
ER
MO
RR
ISON
MILTON
WA
LD
EN
MC
KIN
LE
Y
CAMDEN
KIN
GS
TO
N
ELGIN
ST
LO
UIS
PLY
MO
UT
H
FIFTH
VAR
LAN
D
ELLIS
MASON
VA
LLE
YW
OO
D
THIRD
HALSTEAD
LEACH
RAVINE PARKWAY
ESSEX
AR
TIS
MARYLAN
D
FE
DE
RA
L
LICKIN
G
WO
RTHIN
GTO
N
VIKING
STEADM
AN
STEEL
DENVER
HURD
BOLES
PR
EN
TIC
E
GA
RF
IELD
CAMP
EASTERLY
WO
FF
OR
DMADELEINE
MIL
AN
BARLOW
SISSON
CONEY
STILLMAN
COLORADO
RA
MP
RAMP
PA
RK
ER
MASON
FO
RS
YT
HE
VA
LLE
YW
OO
D
PLATT
IDAHO
WIL
LAR
D
PA
RK
ER
MASON
PLY
MO
UT
HP
LYM
OU
TH
BE
RR
Y
PREN
TIC
E
Area B
Toledo Metropolitan AreaCouncil of Governments300 Martin Luther King, Jr. Dr., Ste. 300Toledo, Ohio 43604Phone (419) 241-9155www.tmacog.org
Lucas County Sidewalks School Buffer - 1/2 Mile
2009-10 Crash/School RatioTwo sides of the street
One side of the street
Sidewalk not present
kj School
[_ 2010 Bicycle/Pedestrian Crash
[_ 2009 Bicycle/Pedestrian Crash
0.0 - 1.25 crashes
1.251 - 3.00 crashes
3.001 - 5.50 crashes
5.501 - 9.50 crashes
9.501 - 18.00 crashes
§¦75
§¦75
§¦475
§¦280
§¦80
§¦80
tu6
tu23
tu23
tu20
tu23
tu24
tu24
tu20A
tu20
§¦90
§¦90
L u c a s C o u n t yL u c a s C o u n t y
W o o d C o u n t yW o o d C o u n t y
L a k eE r i e
M o n r o e C o u n t yM o n r o e C o u n t y
tu20
tu24
tu24
Area AArea B
TOLEDO
OREGON
MAUMEE
BOWLINGGREEN
NORTHWOOD
SYLVANIABERKEY
PERRYSBURG
ROSSFORD
WATERVILLEWHITEHOUSE
WALBRIDGE
HASKINS
PORTAGE
OTTAWAHILLS
LUNA PIER
NORTHBALTIMORE
WESTON
HOLLAND
MILLBURY
JERRY CITY
PEMBERVILLE
FOSTORIA
LUCKEY
HOYTVILLE
SWANTON
BRADNER
BLOOMDALE
GRANDRAPIDS
RISINGSUN
WAYNE
CYGNET
CUSTAR
MILTONCENTER
TONTOGANY
BAIRDSTOWN
WESTMILLGROVE
HARBOR VIEW
31


TMACOG Multimodal Needs Assessment
September, 2011 33
Air Facilities The Toledo Express Airport is the main air facility located within the TMACOG region. It transported 130,000 passengers in 2008. Just outside the region to the north is the considerably larger Detroit Metropolitan Airport (Wayne County). Approximately 976,000 passengers are drawn away from Toledo Express Airport to Detroit Metropolitan Airport annually. The reason cited by many travelers using Detroit Metro is the number of direct flights and the wider range of flight times. Several other air facilities in the region offer primarily private air service. For passengers, connectivity to the region’s airports is limited to private options such as personal car, rental car, or hired taxi/limo service. There is no bus or train service to Toledo Express or Detroit Metro. Toledo Express Airport is home to the Ohio Air National Guard’s 180th Fighter Wing. Over 400 full-time military and federal civilian employees work at the base and one weekend a month over 1,000 people are on base for regular training. Aircraft at the base include F-16, Block 42, and Fighting Falcon. The Toledo Express Airport housed the international air cargo hub operations of Schenker/BAX Global from 1991 until their announced closure in 2011. The facility was once among the busiest cargo airports in the nation. However, changing economics associated with expedited freight both since September 11, 2001 and the more recent recession of 2008 have contributed to a modal shift to truck and rail. The Toledo Executive Airport also known as Metcalf Field offers general aviation and light, expedited freight services. The Toledo-Lucas County Port Authority operates both it and the Toledo Express Airport. The Wood County Regional Airport supports general aviation. It is also home to the Bowling Green State University Aviation Studies program. See Map 6 for how these air facilities connect to road and rail networks.
Waterborne Facilities The region is located on the western edge of Lake Erie, the southernmost of the Great Lakes. Here the lake is fed by the Maumee River which itself is the centerpiece of the largest drainage basin in the entire Great Lakes system. Private and public marinas dot the shorelines of the river, lake, and bays. Excursion and charter fishing services are available for hire, all signals of robust water-based activity and development along the waterfronts and shorelines. Despite this, no waterborne passenger transportation services regularly connect passengers across the river or lake to desired destinations such as nearby cities in Ohio, Michigan, or Ontario, Canada. Cross-river connectivity is available via several bridges that support mostly automotive/truck traffic. Some crossings—notably the bridge connecting Perrysburg and Maumee and the Craig Bridge connecting North and East Toledo neighborhoods—are friendlier to pedestrians and cyclists. Waterborne freight activity is lively and robust in stark contrast to commercial passenger activity. The Port of Toledo is among the busiest cargo locations on the Great Lakes, owing to high volumes of agricultural, coal, and iron ore shipments. One of the largest operators at the port is Midwest Terminals. In 2010, the port’s shipments cleared 4.7 million metric/freight tons. This economically strategic inland port is centrally located within the Saint Lawrence Seaway/Great Lakes system. Multimodal connectivity includes on-dock rail connections at most of the port’s fifteen marine

TMACOG Multimodal Needs Assessment
September, 2011 34
terminals. Road access routes also connect waterborne activity to the land. Recent upgrades to cargo handling capability at the port set the stage for increased rail and truck traffic and commercial/industrial activity. Waterways, like roadways, are maintained to support uninterrupted traffic. Whereas pavement conditions and turning radii are important to surface freight movement, shipping channel depths and dock conditions are essential to waterborne freight movement. Shipping channels are dredged regularly to remain navigable to large Great Lakes freighters. Local geography strongly influences connectivity by waterway to the Toledo seaport. Sediment accumulation is a relatively greater concern here than elsewhere because the Maumee River watershed is the largest drainage basin in the entire Great Lakes system. The large watershed is extensively farmed which helps to produce high volumes of sediment flowing into the mouth of the river and the Maumee Bay. The very shallow depth of western Lake Erie further exacerbates the situation and has the potential to limit connectivity between water and surface freight. Keeping the harbor and shipping channel open is essential to supporting port-generated economic activity in the region. However, dredging impacts more than just shipping interests because there are numerous environmental issues associated with sediment removal and deposit. A range of stakeholders from government agencies such as the Environmental Protection Agency and the Department of Natural Resources, to industry groups such as charter boat operators and commercial fishers, to recreational boaters and the general public have interests in how sediment removal is handled. Map 6 highlights the Maumee River shipping channel and many of the facilities that line the river. It also shows two “confined disposal” facilities where a portion of the dredged sediment is deposited.
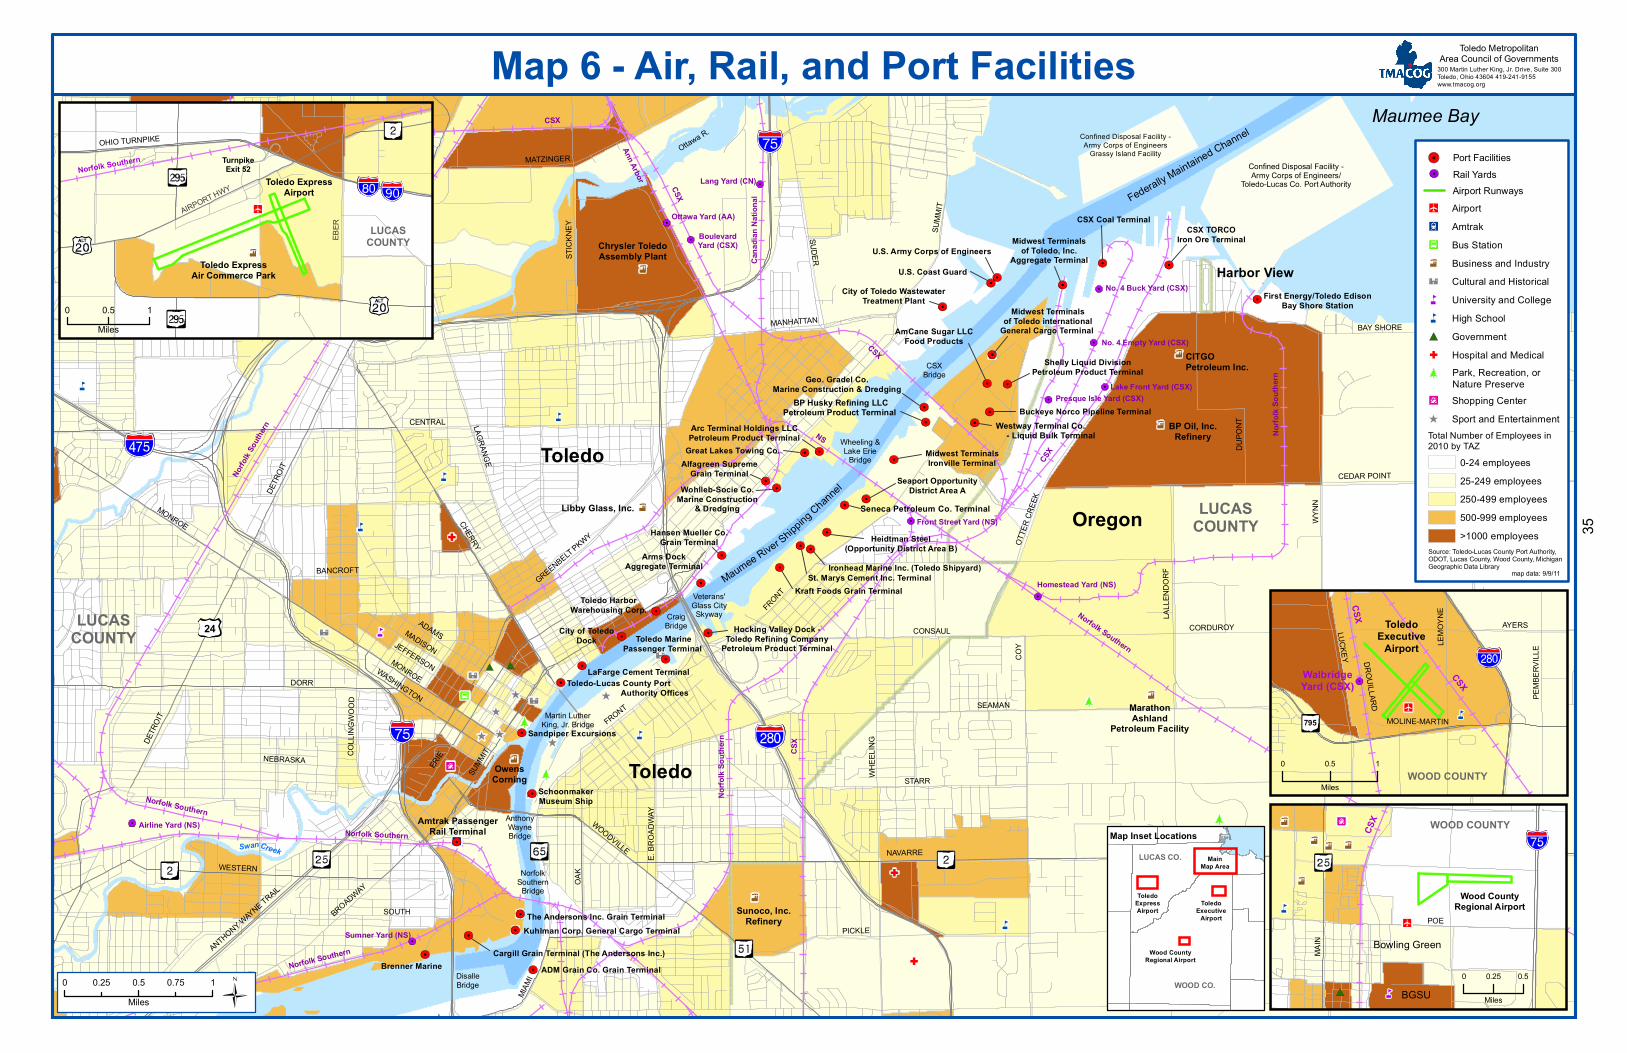
Amtrak PassengerRail Terminal
WOOD COUNTY
Confined Disposal Facility -Army Corps of Engineers/
Toledo-Lucas Co. Port Authority
Lake Front Yard (CSX)
Homestead Yard (NS)
Front Street Yard (NS)
Sumner Yard (NS)
Lang Yard (CN)
BoulevardYard (CSX)
Ottawa Yard (AA)
Airline Yard (NS)
Maumee BayCSX
Norfo
lk Sou
thern
Ann Arbor
CSX
Cana
dian N
ation
al
CSX
NS
CSX
Norfolk Southern
Norfo
lk So
uthern
Norfo
lk So
uthern CSX
Norfolk Southern
Norfolk Southern
Norfolk Southern
Veterans'Glass CitySkywayCraig
Bridge
Martin LutherKing, Jr. Bridge
AnthonyWayneBridge
CENTRAL LAGRANGE
CHERRY
STIC
KNEY
MATZINGER
DETR
OIT
SUDER
MANHATTAN
SUMM
IT
CEDAR POINT
OTTE
R CRE
EK
DUPO
NT
WYNN
BAY SHORE
CORDUROY
SEAMAN
LALL
ENDO
RF
STARRFRONT
FRONT
COY
WHEE
LING
MADISONJEFFERSONMONROEWASHINGTON
ERIE
SUMMITCO
LLIN
GWOO
D
BANCROFT
DORR
NEBRASKA
ANTHONY WAYNE TRAIL
BROADWAY
WOODVILLE NAVARRE
MIAM
I
PICKLE
MONROE
ADAMS
DETR
OIT
WESTERN
Swan
GREENBELT PKWY
Federally Maintained Channel
Maumee River
LUCASCOUNTY
No. 4 Empty Yard (CSX)
Presque Isle Yard (CSX)
No. 4 Buck Yard (CSX)
Shipping C
hannel
BP Husky Refining LLCPetroleum Product Terminal
CONSAUL
SOUTH
OAK
BP Oil, Inc.Refinery
MarathonAshland
Petroleum Facility
Sunoco, Inc.Refinery
Chrysler ToledoAssembly Plant
DisalleBridge
E. BR
OADW
AY
CITGOPetroleum Inc.
24
Westway Terminal Co. - Liquid Bulk Terminal
Creek
Libby Glass, Inc.
OwensCorning
NorfolkSouthern
Bridge
Wheeling &Lake Erie
Bridge
CSXBridge
LUCASCOUNTY
Ottawa R.
U.S. Coast Guard
City of ToledoDock
SchoonmakerMuseum Ship
Kraft Foods Grain Terminal
Cargill Grain Terminal (The Andersons Inc.)
Arms DockAggregate Terminal
ADM Grain Co. Grain Terminal
LaFarge Cement Terminal
AmCane Sugar LLCFood Products
Buckeye Norco Pipeline Terminal
Toledo-Lucas County Port Authority Offices
Alfagreen SupremeGrain Terminal
Hansen Mueller Co.Grain Terminal
The Andersons Inc. Grain TerminalKuhlman Corp. General Cargo Terminal
City of Toledo WastewaterTreatment Plant First Energy/Toledo Edison
Bay Shore Station
Toledo HarborWarehousing Corp.
Shelly Liquid DivisionPetroleum Product Terminal
Midwest Terminalsof Toledo, Inc.
Aggregate Terminal
Confined Disposal Facility -Army Corps of Engineers
Grassy Island Facility
Great Lakes Towing Co.
U.S. Army Corps of Engineers
Sandpiper Excursions
Brenner Marine
St. Marys Cement Inc. Terminal
Seneca Petroleum Co. Terminal
Geo. Gradel Co.Marine Construction & Dredging
Arc Terminal Holdings LLCPetroleum Product Terminal
Wohlleb-Socie Co.Marine Construction
& Dredging
Toledo MarinePassenger Terminal
Hocking Valley Dock -Toledo Refining Company
Petroleum Product Terminal
CSX Coal Terminal
Midwest Terminalsof Toledo international
General Cargo Terminal
Heidtman Steel(Opportunity District Area B)
Seaport OpportunityDistrict Area A
CSX TORCOIron Ore Terminal
Ironhead Marine Inc. (Toledo Shipyard)
Midwest TerminalsIronville TerminalToledo
Oregon
Toledo
Harbor View
Map 6 - Air, Rail, and Port Facilities 300 Martin Luther King, Jr. Drive, Suite 300Toledo, Ohio 43604 419-241-9155www.tmacog.org
Toledo MetropolitanArea Council of Governments
EBER
Toledo ExpressAir Commerce Park
Toledo ExpressAirport
TurnpikeExit 52Norfolk Southern
LUCASCOUNTY
AIRPORT HWY
OHIO TURNPIKE
AYERS
LEMO
YNE
LUCKEY
PEMB
ERVIL
LEDROUILLARD
MOLINE-MARTIN
CSX
WalbridgeYard (CSX)
ToledoExecutive
Airport
WOOD COUNTY
CSX
795
0 0.5 1Miles
0 0.5 10.25 0.75Miles
WOOD COUNTY
Bowling Green
BGSU
Wood CountyRegional Airport
POE
CSX
MAIN
0 0.5 1
Miles
0 0.25 0.5
Miles
LUCAS CO.
WOOD CO.
Map Inset Locations
ToledoExpressAirport
ToledoExecutive
Airport
Wood CountyRegional Airport
MainMap Area
Source: Toledo-Lucas County Port Authority,ODOT, Lucas County, Wood County, MichiganGeographic Data Library
map data: 9/9/11
Total Number of Employees in2010 by TAZ
0-24 employees25-249 employees250-499 employees500-999 employees>1000 employees
AirportAmtrakBus StationBusiness and IndustryCultural and HistoricalUniversity and CollegeHigh SchoolGovernmentHospital and Medical
Shopping CenterSport and Entertainment
Park, Recreation, orNature Preserve
Port FacilitiesRail YardsAirport Runways
35

TMACOG Multimodal Needs Assessment
September, 2011 37
Connectivity Needs In the context of resource constraints, it is critical to strike a balance between moving goods and people in a manner that integrates all modes of transportation and maximizes the utility of all transportation assets. Provision of public transit, bikeways, pedestrian routes, and passenger rail are as essential to the multimodal system as air, water, roadway, and rail freight facilities. Several existing connections within the region support transfer among modes for both personal users and freight professionals. However, improvements to multimodal connectivity, in both the short and long terms are warranted. The 2035 Plan–Update 2011 calls for numerous multimodal system improvements including four public transit projects, fifteen pedestrian and bikeway projects, and one passenger rail project. It also calls for several projects to improve connectivity between air, water, rail, and truck shipping modes. The Update 2011 projects accomplish key goals of safety and connectivity while also addressing the steps necessary to development of a multimodal freight transportation hub. Efforts towards a fully multimodal transportation system in the TMACOG region serve community needs by improving livability, environmental sustainability, and economic vitality. The numbered projects listed in Table 4 correspond with those labeled on Map 7. These 37 projects are the committed and priority projects of the 2035 Plan–Update 2011, the current Transportation Improvement Program, and other freight studies.

TMACOG Multimodal Needs Assessment
September, 2011 38
Table 4. Summary of Multimodal Needs and Initiatives
Label Description Modal Need Estimated Cost Estimated
Date
1Airport Highway to Holland-Sylvania Road: ped-bikeway bridge across I-475
Connect neighborhoods and commercial areas currently divided by interstate 2,500,000 2018
2Consaul Street, Matzinger Road, Summit Street advance warning signals
Reduce passenger car/freight rail modal conflict by supplying advance information to drivers 1,000,000
3 Hallet Avenue: rail grade separation Eliminate passenger car/freight rail conflict 9,400,000 2013
4I-75 Disalle Bridge: widen to improve South Ave & Miami Street ramps Improve highway connectivity for freight haulers 75,000,000 2035
5 Jackson Blvd: downtown Toledo transit center Provide enhanced pedestrian/passenger connectivity 538,215 2013
6 Liberty Hi Road: rail grade separation Eliminate car/rail conflict Private funding 2011
7Eastside Maumee River Trail: from Craig Bridge to International Park
Improve bike and pedestrian access between downtown Toledo and East Toledo. Reduce motorized/nonmotorized conflicts. 1,600,000 2018
8 McCord Road: rail grade separation Reduce rail to bike/ped/roadway conflict adjacent to Springfield Jr & Sr High Schools 29,300,000 2014
9 Middlegrounds Metropark: pathway construction in park Create access to newly established urban metropark 250,000 2014
10 NHS Connector: Collingwood Avenue to I-75Improve connectivity between Amtrak Station and I-75 for passenger travel *
11 NHS Connector: Front Street to I-280 Improve rail/water/road connectivity for freight haulers at Toledo Seaport *
12 NHS Connector: Hill Avenue to I-75
Improve rail to road freight connectivity at Airline Intermodal Yard and alleviate congestion for passengers *
13 NHS Connector: Oakdale Avenue & Miami Street to I-75 Improve rail/water/road connectivity for freight haulers especially for bulk agricultural products *
14 NHS Connector: Route Alt 20 to Route 2 to Ohio TurnpikeImprove air to surface freight connectivity at Toledo Express Air Commerce Park *
15 NHS Connector: South Avenue to I-75
Improve rail/water/road connectivity for freight haulers especially for bulk agricultural and bulk construction products *
16 NHS Connector: SR 18 from CSX Intermodal Facility to I-75 Improve rail-to-highway connectivity for freight haulers 17,000,000 2016
17Martin Luther King Jr Amtrak Station: Ohio High Speed Passenger Rail implementation
Increase persoanl mobility options by adding and upgrading intercity passenger rail service 105,000,000 2035
18 Oregon: bike network projectEnhance pedestrian and bicycle safety and complete bike/ped network 3,000,000 2035
19Riverside Trail: Phase 1 from downtown Toledo to Craig Bridge
Improve bike and pedestrian access between downtown Toledo and East Toledo. Reduce motorized/nonmotorized conflicts. 1,250,000 2015
20 Riverside Trail: Phase 2 from Craig Bridge to Point Place
Improve bike and pedestrian access between downtown Toledo and Point Place. Reduce motorized/nonmotorized conflicts 500,000 2013
21SR 51 (Woodville Road): Eliminate constricted area from Oak Street to Curtice Road, especially at RR crossing
Improve safety by reducing motorized/non-motorized mode conflict 2,000,000 2035
22SR 65: Add paved berms from Grand Rapids to Rossford excluding curbed sections and areas within City of Perrysburg
Improve passenger safety by reducing motorized/non-motorized mode conflict 5,600,000 2035
23 Stadium Road: bike pathImprove connectivity in bikeway system to facilitate mode shift 440,000 2013
24 Stickney Avenue: rail grade conflict Reduce rail to road conflict, alleviate congestion *
25 Summit Street and Front Street: bike paths Improve bike network connectivity / facilitate mode shift 612,990 2013
26Sylvania: Monroe Street Alexis Road, Main Street improvements Sylvania motorized/non-motorized conflict reduction Combined 2018
27 Sylvania: River Trail multi-use pathCreate connection and improve safety of bike/ped access to key destinations 1,250,000 2018
28Sylvania-Metamora Road: bike path / Kilburn Road to Central Avenue: bike lane Improve connectivity in bikeway system 1,000,000 2018
29 Toledo Seaport: Harbor DredgingPreserve and improve water to surface freight connections * Annual
30
Toledo: Berdan from Martha to Cherry Sts; Detroit & Glendale Aves from Schneider Rd to Harvard Blvd; Detroit Ave from Waggoner Blvd to Lagrange St; Alexis Road from Hagman to Suder
Motorized/non-motorized conflict reduction by eliminating constricted areas for ped/bike 7,500,000 2018
31 Toledo: downtown transit hubImprove efficiency of public transit, encourage mode shift from auto to transit 20,000,000 2035
32 Tracy Road: various pavement and lane improvementsReduce rail to road conflict, improve freight transportation access *
33Upgrade I-75/ Miami Street interchange and straighten curve between Wales Road and Miami Street Improve highway connectivity for freight haulers 100,000,000 2035
34 Wales Road: rail grade separation Reduce rail to highway conflict, alleviate congestion 14,000,000 2012
35 Waterville: US 24 conversion to local streetAdapt former thruway to local street including a bike/ped path 2,500,000 2015
36Westside Rail Corridor: land preservation and multiuse trail project
Preserve rail corridor for future connectivity among multiuse paths and between counties 9,000,000 2018
37 Wooster Street: Bike/pedestrian crossing over I-75Improve ped/bike access between university and key destinations 2,500,000 2035
* Estimate not available at this time Data Sources: 2035 Plan–Update 2011, TMACOG Transportation Improvement Program, and freight studies.
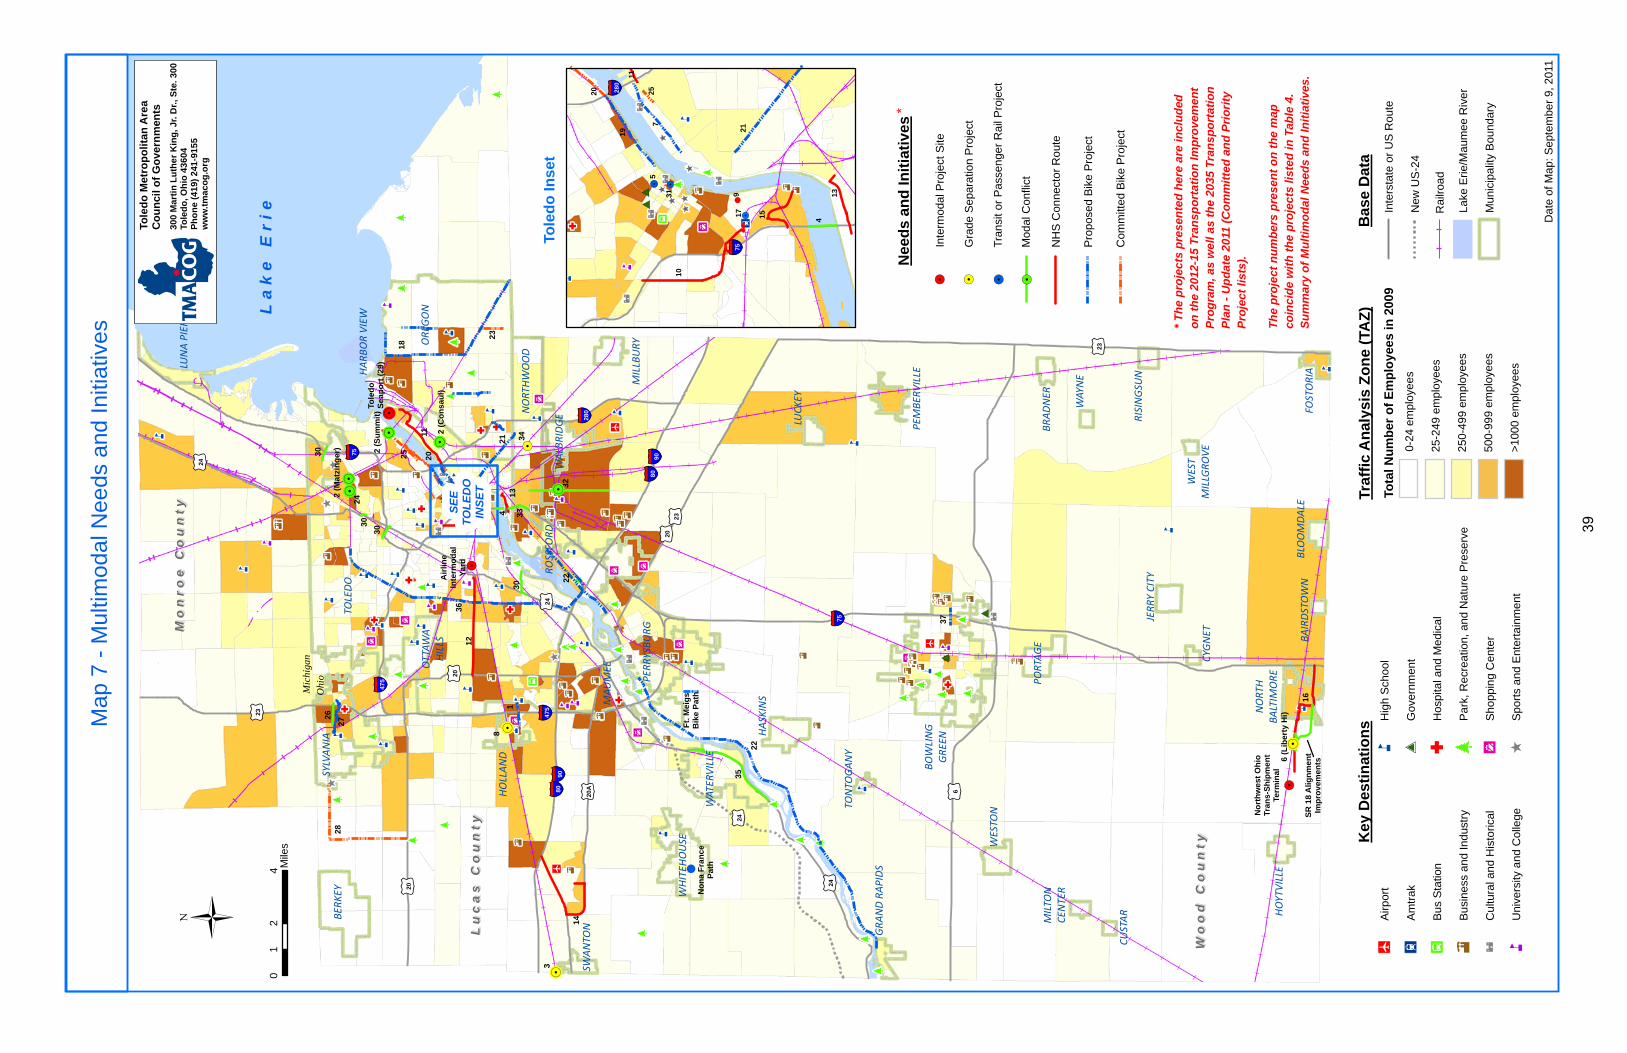
ò
o
^
oo
o
^
^
o
k
J
k
k
# *
# *
ò [[ò [
G
o
G
ò
ò
^
^G
k
k
o
o o
o
o
o
k
^
G
G
G
k
^
GG
G
oo^ I2
o
o
[# *
o
^
^
o
o
[
[
[[
k[# *
k
ok k
o
o
o
o
o
k
k
k
k
k
C
C C
C
C
C
C
C
CC
C
C
C
C
o
k
k
k
k
k
k
k
kk
k k
ko
k
k
k
k
k
k
k
kk
k
k
k
k
k
k
k
C
C
C
CC
C
C
CC C
o
o o
[o
o
C
C C
C
C
C
ò
ò
[
C
CC
C CC C
C
C C
CCC C
C
C C
Ja
Ja
C C
C
C
ooo
o
o
J
J
ò
ò
§ ¦75
§ ¦75
§ ¦475
§ ¦475
§ ¦280
§ ¦80
§ ¦80 t u6
t u23
t u23
t u20
t u23
t u24
t u24
t u20A
t u20
§ ¦90
§ ¦90
Lu
ca
s C
ou
nt
yL
uc
as
Co
un
ty
Wo
od
Co
un
ty
Wo
od
Co
un
ty
La
ke
E
ri
e
Mo
nr
oe
Co
un
ty
Mo
nr
oe
Co
un
ty
t u20
t u24
t u24
SE
ET
OL
ED
OIN
SE
T
!.8
1
11
12
13
14
16
18
20
2123
25
28
!.
!.
!. 2 (C
on
sau
l)
2 (S
um
mit
)
2 (M
atzi
ng
er)
!.3
4
!.6
(L
iber
ty H
i)
!.24
27
26
!.
Tole
do
Sea
po
rt (
29)
30
30
30
30
32
33! .
34
35
36
37
22
22
SR
18
Alig
nm
ent
Imp
rove
men
ts
! .
Air
line
Inte
rmo
dal
Yar
d
! .
No
rth
wes
t O
hio
Tran
s-S
hip
me
nt
Term
inal
Ft.
Mei
gs
Bik
e P
ath
!N
on
a F
ran
ceP
ath
Mic
higa
n
Ohi
o
!.
TOLEDO
OREG
ON
MAUMEE
BOWLING
GREEN
NORTH
WOOD
SYLVANIA
BER
KEY
PER
RYSBURG
ROSSFO
RD
WATERVILLE
WHITEH
OUSE
WALBRIDGE
HASKINS
PORTAGE
OTTAWA
HILLS
LUNA PIER
NORTH
BALTIM
ORE
WESTO
N
HOLLAND
MILLBURY
JERRY CITY
PEM
BERVILLE
FOSTORIA
LUCKEY
HOYTVILLE
SWANTO
N
BRADNER
BLO
OMDALE
GRAND RAPIDS
RISINGSU
N
WAYNE
CYG
NET
CUSTAR
MILTO
NCEN
TER
TONTO
GANY
BAIRDSTOWN
WEST
MILLGROVE
HARBOR VIEW
Ü0
24
1M
iles
Map
7 -
Mul
timod
al N
eeds
and
Initi
ativ
es
ò [[
ò
[
G
ò
o
o
^ I2
[
# *
k
[
# *
k
k
C C C
[
ò
ò
Ja
§ ¦75
§ ¦280
4
!.5
7
!9
10
11
15! .17
19
20
21
25
! .31 13
Tole
do
Inse
t
Da
te o
f M
ap:
Sep
tem
ber
9, 2
011
* T
he
pro
jec
ts p
rese
nte
d h
ere
are
incl
ud
edo
n t
he
2012
-15
Tra
nsp
ort
atio
n I
mp
rove
men
t P
rog
ram
, as
we
ll as
th
e 2
035
Tra
nsp
ort
ati
on
Pla
n -
Up
dat
e 20
11 (
Co
mm
itte
d a
nd
Pri
ori
tyP
roje
ct
lists
).
Th
e p
roje
ct n
um
ber
s p
rese
nt
on
th
e m
apco
inci
de
wit
h t
he
pro
ject
s lis
ted
in T
ab
le 4
.S
um
mar
y o
f M
ult
imo
dal
Nee
ds
and
Init
iati
ves.
New
US
-24
Mun
icip
ality
Bou
nda
ry
Lake
Erie
/Mau
mee
Riv
er
Ba
se D
ata
Inte
rsta
te o
r U
S R
oute
Rai
lroa
d
JA
irpor
t
I 2A
mtr
ak
J aB
us
Sta
tion
CB
usi
ness
and
Ind
ustr
y
òC
ultu
ral a
nd H
isto
rical
kU
nive
rsity
and
Co
llege
kH
igh
Sch
ool
# *G
over
nmen
t
GH
ospi
tal a
nd M
edic
al
oP
ark
, R
ecr
eatio
n, a
nd N
atur
e P
rese
rve
^S
hop
pin
g C
ente
r
[S
por
ts a
nd E
nter
tain
men
t
Key
Des
tin
atio
ns
Tole
do
Met
rop
olit
an A
rea
Co
un
cil o
f G
ove
rnm
ents
300
Ma
rtin
Lu
the
r K
ing
, Jr.
Dr.
, S
te.
300
Tole
do
, Oh
io 4
3604
Ph
on
e (4
19)
241
-91
55
ww
w.t
ma
cog
.org
NH
S C
onne
ctor
Ro
ute
Pro
pos
ed B
ike
Pro
ject
Com
mitt
ed B
ike
Pro
ject
Mod
al C
onfli
ct
Tra
nsi
t or
Pas
sen
ger
Rai
l Pro
ject
Gra
de S
epar
atio
n P
roje
ct
Inte
rmo
dal P
roje
ct S
ite
! .! .! .
Nee
ds
and
Init
iati
ves
*
Traf
fic
An
alys
is Z
on
e (T
AZ
)
Tota
l N
um
ber
of
Em
plo
yees
in 2
009
25-2
49 e
mpl
oye
es
250-
499
em
ploy
ees
500-
999
em
ploy
ees
>10
00 e
mpl
oyee
s
0-24
em
ploy
ees
! .
39


TMACOG Multimodal Needs Assessment
September, 2011 41
Recommendations and Future Work As noted earlier in the methodology section a more up-to-date land use and socio-economic picture of the region will become possible over the next few months and years as 2010 census data become available. Once the 2010 data is released, an analysis to determine where people currently live and where they work as well as demographic characteristics such as age, income, disability, car ownership, etc., is warranted. More current data will support not only this study, but others upon which it relies. For example, as 2010 Cenus data become available the 2004 Transit Study could be updated to discover the post-recession location of transit supportive areas which in turn would provide updated understanding of existing public transit service. A robust passenger system supports the economic vibrancy of the region. Given what is already known about the changing population patterns in the region, the demand for public transit is expected to increase. Investments in the public transit system help to produce sufficient geographic coverage and hours of service. The consequences of the opt-out provision now available to jurisdictions within TARTA’s service area should be closely monitored. This change in law has the potential to negatively impact TARTA financially and to force contractions in service. Updated assessments on the ease with which bike and pedestrian mode-shifting or mode-combining currently occurs would support future multimodal and network planning. For example, it would be useful to know more about how current bicycle commuters use the bikeway system, their ratings of it, and suggestions for improvements. As another example, replicating the 2003 Pedestrian Facilities study with the new sidewalk inventory and crash data could provide useful information for SRTS initiatives and for targeting resources to where they would produce the most benefit. To ensure a comprehensive transportation system it is essential to maintain the existing system and to develop new modal connections. Improving modal connectivity necessarily involves increasing coordination among regional entities such as by synchronizing county and local jurisdiction master plans and zoning plans. Several strategies that have emerged from previous TMACOG efforts would, if fully implemented, serve to reduce modal conflicts and encourage connectivity. Some of these strategies are: Change project selection criteria to reward projects that incorporate multimodal elements
such as bike lanes or paths with street upgrades; street upgrades with transit shelters, bump outs, Park and Ride facilities, and other accommodation.
Reduce the need for driving by creating livable/workable communities. Increase transit-oriented development, which concentrates commercial space and a variety of
housing options around a transit stop. This compact, mixed-use, and pedestrian-oriented development encourages more transit use, reduces congestion, increases property values, and reduces infrastructure costs.
Require multi-use paths in site plans, with connectivity to adjoining development. Make developed areas more conducive to walking. Adopt a regional “complete streets” policy that calls for design of street corridors to serve
multiple transportation modes, including pedestrians, bicycles, and transit. Continue to invest in upgrades to and connections between the major freight transportation
facilities, creating a “Lake Erie West Global Logistics Hub.”

TMACOG Multimodal Needs Assessment
September, 2011 42
It is imperative to ensure safe and equitable access to transport options that connect people to work and education opportunities as well as to shopping centers, medical facilities, and recreation destinations. It is equally crucial to provide for a smoothly functioning freight movement networks. A well-functioning, complete transportation system encourages efficient mobility and is essential to sustaining and growing the region’s economy, reducing sprawl, and improving quality of life. The fates of the the urban, suburban, and rural areas surrounding the urban core of Toledo are tied to the health of the city and vice versa. Planning for and delivering a comprehensively multimodal system provides the best opportunity for balanced regional development.

TMACOG Multimodal Needs Assessment
September, 2011 43
Appendix—Sources Consulted Bicycle Facilities Guide for Recreational Riding in Northwest Ohio and Southeast Michigan, prepared by TMACOG 2008. Missed Opportunity: Transit and Jobs in Metropolitan America, prepared by the Metropolitan Policy Program of the Brookings Institution. May 2011. Ohio County Profiles, prepared by the Office of Policy, Research and Strategic Planning, the Ohio Department of Development. Various releases. On the Move: 2007-2035 Transportation Plan—Update 2011. July 2011. Pedestrian Facilities Inventory, Phase II: Regionwide Survey of School Pedestrian Concerns, prepared by TMACOG. December 2003. Regional Core Circulator Study, prepared for TMACOG by Wilbur Smith Associates. June 2005. Regional Transit Study prepared by TMACOG. February 2004. State of Metropolitan America: On the Frontlines of Demographic Transformation, prepared by the Metropolitan Policy Program of the Brookings Institution. May 2011. TARTA Comprehensive Operations Analysis. Prepared for TARTA by Parsons Brinckerhoff, Nelson Development and Margarita De Leon. March 2009. Toledo Regional Economic Plan: Transportation & Logistics Industry Sector, prepared by TMACOG. September 2009.