multimodal optical diagnostics of the microhaemodynamics ... · technologies in medicine, saratov...
TRANSCRIPT

fphys-10-00416 April 14, 2019 Time: 11:9 # 1
METHODSpublished: 16 April 2019
doi: 10.3389/fphys.2019.00416
Edited by:Antonio Colantuoni,
University of Naples Federico II, Italy
Reviewed by:Claudia Penna,
University of Turin, ItalyDominga Lapi,
University of Pisa, Italy
*Correspondence:Evgeny A. Zherebtsov
[email protected] Goltsov
[email protected];[email protected]
Specialty section:This article was submitted to
Vascular Physiology,a section of the journalFrontiers in Physiology
Received: 01 November 2018Accepted: 27 March 2019
Published: 16 April 2019
Citation:Zherebtsova AI, Dremin VV,Makovik IN, Zherebtsov EA,
Dunaev AV, Goltsov A, Sokolovski SGand Rafailov EU (2019) Multimodal
Optical Diagnostics of theMicrohaemodynamics in Upper
and Lower Limbs.Front. Physiol. 10:416.
doi: 10.3389/fphys.2019.00416
Multimodal Optical Diagnostics ofthe Microhaemodynamics in Upperand Lower LimbsAngelina I. Zherebtsova1, Viktor V. Dremin1, Irina N. Makovik1,Evgeny A. Zherebtsov1,2,3* , Andrey V. Dunaev1, Alexey Goltsov4* , Sergei G. Sokolovski3,5
and Edik U. Rafailov3,5
1 Research and Development Center of Biomedical Photonics, Orel State University, Oryol, Russia, 2 Optoelectronicsand Measurement Techniques Unit, University of Oulu, Oulu, Finland, 3 Optoelectronics and Biomedical Photonics Group,Aston Institute of Photonic Technologies, School of Engineering and Applied Science, Aston University, Birmingham,United Kingdom, 4 School of Applied Sciences, Abertay University, Dundee, United Kingdom, 5 International Center of CriticalTechnologies in Medicine, Saratov State University, Saratov, Russia
The introduction of optical non-invasive diagnostic methods into clinical practice cansubstantially advance in the detection of early microcirculatory disorders in patients withdifferent diseases. This paper is devoted to the development and application of theoptical non-invasive diagnostic approach for the detection and evaluation of the severityof microcirculatory and metabolic disorders in rheumatic diseases and diabetes mellitus.The proposed methods include the joint use of laser Doppler flowmetry, absorptionspectroscopy and fluorescence spectroscopy in combination with functional tests. Thistechnique showed the high diagnostic importance for the detection of disturbancesin peripheral microhaemodynamics. These methods have been successfully tested asadditional diagnostic techniques in the field of rheumatology and endocrinology. Thesensitivity and specificity of the proposed diagnostic procedures have been evaluated.
Keywords: laser Doppler flowmetry, tissue reflectance oximetry, pulse oximetry, fluorescence spectroscopy, skinthermometry, rheumatic diseases, diabetes mellitus
INTRODUCTION
Blood microcirculation plays an important role in the transport of nutrients, oxygen, hormones andthe release of metabolic products. In the last decade, there has been a steady increase in the interestof researchers in the problems of microcirculatory disorders in patients with rheumatological andendocrinological diseases. This is due to the significant role of microcirculation in the pathogenesisof such diseases (Avouac et al., 2011; Sena et al., 2013; Fuchs et al., 2017).
The medical, social and economic significance of rheumatic and endocrinological diseases isdetermined primarily by their prevalence, as well as the development of complications in themajority of patients, which significantly reduce the duration and quality of life, up to disability.According to European League Against Rheumatism (EULAR) statistics, more than 22% of thepopulation already has or had previously rheumatic diseases (Smolen et al., 2017). At the sametime, according to the International Diabetes Federation (IDF), by 2017 the prevalence of diabetesmellitus in the world has reached 8.8% among the adult population (Karuranga et al., 2017).
Rheumatic diseases lead to morphological disturbances of the microcirculatory bed, whichinclude the rarefaction of the capillary network, the asymmetry of the capillaries, and the
Frontiers in Physiology | www.frontiersin.org 1 April 2019 | Volume 10 | Article 416

fphys-10-00416 April 14, 2019 Time: 11:9 # 2
Zherebtsova et al. Multimodal Optical Diagnostics
appearance of megacapillaries (up to 50 µm in diameter)(Gutierrez et al., 2010). Chronic hyperglycemia and insulinresistance in diabetes mellitus cause increased vascularpermeability, disruption of autoregulation of blood flowand vascular tone (Avogaro et al., 2011; Kolluru et al., 2012),leading to the structural and functional changes in capillaries andarterioles (Schramm et al., 2006).
In the absence of adequate therapy, peripheral blood flowdisorders in limbs can lead to painful ulceration, gangrene, andthe development of cardiovascular diseases. Previously publishedstudies have shown that the risk of developing cardiovasculardisease in patients with rheumatic diseases is comparable tothat in patients with type 2 diabetes (Peters et al., 2010;Kerekes et al., 2012).
The earliest, usually reversible manifestation of thesediseases is the development of microcirculatory dysfunction(Vanhoutte et al., 2015; Fuchs et al., 2017) due to endothelialdamage, excessive expression of certain adhesion moleculesand other factors. At present, several invasive and non-invasive methods are used in the clinical practice ofendocrinologists and rheumatologists, including colorimetricduplex dopplerography, angiography, computed tomography,magnetic resonance angiography, transcutaneous oximetry(TcpO2), etc. (Daly Susan and Leahy Martin, 2012).
The methods of optical diagnostics are promising for the studyof early microcirculatory disorders in patients with rheumaticdiseases and diabetes. These methods have several advantages:painless procedures, quick results, lack of expensive consumables,minimal impact on the object and its properties. This articlepresents an overview on recent advances in optical non-invasivediagnostics of the peripheral hemodynamics of the upper andlower limbs in rheumatological and endocrinological profilepatients. Among these are laser Doppler flowmetry (LDF), tissuereflectance oximetry (TRO), pulse oximetry (PO) and fluorescentspectroscopy (FS).
The laser Doppler flowmetry method allows for investigatingthe blood flow in the microcirculatory bed in vivo. Themethod is based on probing the tissue with laser radiationand analyzing back reflected from the tissue radiation partiallyscattered from moving red blood cells (Bonner and Nossal, 1990;Krupatkin and Sidorov, 2013).
The tissue reflectance oximetry method provides informationabout the tissue oxygen saturation (StO2) of the examinedbiological tissue microcirculation and allows for calculation of therelative blood volume (Vb) in the surface layers of soft tissues(skin, mucous membranes). This technology is based on theability of oxygenated and deoxygenated hemoglobin to absorblight in the red and near infrared range (Casavola et al., 1999;Wallace et al., 2009).
Mechanisms that cause abnormal microcirculation inpathological processes can be quantified by use of wavelettransform for the records of LDF and TRO signals. Theamplitude-frequency analysis of oscillations in skin blood flowallows distinguishing five frequency ranges corresponding tometabolic (endothelial) (Kvandal et al., 2003), neurogenic,myogenic (Söderström et al., 2003; Krupatkin, 2006), respiratoryand cardiac (Stefanovska et al., 1999; Krupatkin, 2008) activity.
Optical diagnostics enables not only evaluation of blood flowparameters but registration of associated biochemical changes inthe living tissue under study. The fluorescence spectroscopy isone of such methods allowing for registration metabolic changesin vivo. As an example, the method has promises to be applied indiagnostics of the diabetes mellitus complications. An importantindicator of the viability of tissues is the mitochondrial function.By the parameters of the respiratory chain, one can speak ofnormal or pathological activity of the cells, diagnose the stateof tissue ischemia. One of the estimates of the mitochondrialfunction is the ratio of coenzymes NADH and FAD, which canbe calculated from the intensity of their fluorescence (Bartoloméand Abramov, 2015). In addition, in recent years, it has beenfound that the long-term effects of pathogenic factors such ashyperglycemia and oxidative stress in diabetes mellitus (Tan et al.,2002) and chronic inflammatory diseases (Murdaca et al., 2012)can lead to increased glycation of proteins and accumulationof advanced glycation end products (AGEs), which affect theproperties of collagen and other structural proteins of thecapillary membrane and skin (Gkogkolou and Böhm, 2012).These changes can be quantified by the intrinsic fluorescence ofthe pentosidine residues formed during glycation of collagen (Sellet al., 1991; Takahashi et al., 1995).
To increase the reliability of the results obtained by theoptical spectroscopy methods, an assessment of the measuredparameters changes is carried out with functional tests.Occlusion, heat, cold, respiratory, orthostatic, electrostimulationet al. tests are currently used as an act of provocation. Functionaltests allow for revealing latent hemodynamic disorders andadaptive reserves of the microcirculation system.
The recent studies show that multiparametric approach inthe form of joint measurements by various optical methodssupplemented by functional tests can give complex informationabout the functional state of the microcirculation (Goltsov et al.,2017; Zherebtsov et al., 2017; Zherebtsova et al., 2017).
The aim of this work is to generalize the previously obtainedresults (Dremin et al., 2017; Mizeva et al., 2017, 2018; Zherebtsovet al., 2017; Zherebtsova et al., 2017) and to assess thepossibilities of using optical non-invasive methods in studyingthe microcirculatory bed of patients with disorders in peripheralmicrohemodynamics.
The article provides a review of three methods of combineduse of optical non-invasive technologies for the diagnosticsof blood microcirculation and metabolic disorders. The maindistinctive feature of all described methods is the use of functionaltests, which greatly enhanced the diagnostic capabilities of themethods (Herrick and Clark, 1998).
The first two experimental studies demonstrate thepossibility of using optical non-invasive methods and cutaneoustemperature for detection violations of peripheral blood flowof the upper limbs in rheumatological profile patients. Thecold water exposure, occlusion tests (OT) and cold pressor test(CPT) were selected as a provocative actions. Occlusion test ismost commonly used functional test to investigate and assessmicrovascular function according to post occlusive reactivehyperemia (PORH) response (Roustit and Cracowski, 2012).A cold test is also often used for diagnostic purposes due to
Frontiers in Physiology | www.frontiersin.org 2 April 2019 | Volume 10 | Article 416

fphys-10-00416 April 14, 2019 Time: 11:9 # 3
Zherebtsova et al. Multimodal Optical Diagnostics
vasospasm is characterized by sporadic manifestation andinfluenced by trigger factors like cold exposure, emotional stress,physical exercise etc. (Terada et al., 2007; Ye and Griffin, 2016).The deliberate provocation of vasospasm allows one to increasethe sensitivity of the diagnosis and to assess the severity of thepathological process.
The third experimental study estimates the potential ofsynchronous registering the blood flow parameters and thefluorescence of intrinsic tissue fluorophore with the purposeof diagnosing the stages of complications of lower limbs indiabetes mellitus patients. The local heating stimulation waschosen as test action on the blood microcirculation system. Thelocal heating test allows the assessment of the local regulatorymechanisms of blood flow.
SIMULTANEOUS MEASUREMENTS OFTHE BLOOD PERFUSION AND SKINTEMPERATURE FOR FUNCTIONALDIAGNOSTICS OF INTRADERMALFINGER VESSELS
Materials and MethodsThe aim of this study was evaluation of the combined use ofthe laser Doppler flowmetry and skin thermometry methodsduring the occlusion test to distinguish vasospastic disordersin hands (Zherebtsov et al., 2017). The experimental studiesinvolved 27 healthy volunteers (HV) (mean age 23 ± 5 years)and 41 patients with rheumatic diseases (PRD) (mean age56 ± 12 years) from the Rheumatology Department of the OrelRegional Clinical Hospital (Oryol, Russia). Subjects in the HVgroup did not have diagnosed diseases that are accompaniedby secondary vasospastic syndrome, and did not have signsand symptoms which are indicative for primary vasospasm or
predisposition to vasospasm [e.g., cold hands and feet, lowblood pressure (Flammer et al., 2001)]. Presence of vasospasmof each tested subject in the PRD group was confirmed by theattending physician.
It is well known that microcirculatory abnormalitiescontribute to the pathogenesis and pathophysiology of numerousrheumatic diseases (Murray et al., 2004). Microvascular changestaking place in the early stages of such diseases may not manifestitself. In many cases, vascular problems can remain hidden.Such a high risk factor as aging can significantly contribute tothe vascular state of the volunteers (Abularrage et al., 2005).For this reason, before carrying out measurements in thegroup of patients with diagnosed rheumatic diseases, we havetried to find a control group of people in their 50s withoutclear signs of vascular diseases. Nevertheless, due to the lackof confidence on absence of vascular disorders among theaged volunteers, the younger people who are more likely haveno microcirculatory disorders were intentionally included inthe control group.
The laser analyser of blood microcirculation “LAKK-02” (SPE“LAZMA” Ltd., Russia) and a custom developed multi-channelthermometry device for low inertia thermometry were used forexperimental measurements. The measurements of cutaneoustemperature and the index of microcirculation were performedon the distal phalanx of the third finger of the right hand.The specially designed attachment was used for longitudinalarrangement of the LDF fiber probe. The experimental setupand design features and location of the proposed attachment ispresented in Figure 1.
The stage of heating of the hand at 42◦C was applied for secureequal initial conditions of the experiment. This temperatureensures complete dilatation of vessels and the rate of bloodflow returns to a normal level, even in patients with vasospasticdisorders. The temperature of the main part of experimentwas 25◦C. It was selected from considerations of comfort for
FIGURE 1 | The experimental setup for simultaneous measurements of the blood perfusion and skin temperature (A): 1 – heat-insulated cover; 2 – heat-insulatedwater bath; 3 – specially designed attachment for the LDF fiber probe; 4 – latex glove; 5 – arm cuff; 6 – LDF fiber probe; 7 – manometer; 8 – inflation bulb; 9 –thermometry device; 10 – LDF device; 11 – PC. Design features and location of the proposed attachment for the LDF fiber probe and thermal sensors (B): 1 – thirdfinger; 2 – latex glove; 3 – LDF fiber probe; 4 – housing of the attachment; 5 – mirror; 6 – thermal insulation; 7 – ambient temperature thermal sensor; 8 – skintemperature thermal sensor.
Frontiers in Physiology | www.frontiersin.org 3 April 2019 | Volume 10 | Article 416

fphys-10-00416 April 14, 2019 Time: 11:9 # 4
Zherebtsova et al. Multimodal Optical Diagnostics
patients and maximal potentially possible dynamic range ofthe skin postocclusion temperature response. Occlusion testwas performed on the upper arm using a sphygmomanometerair cuff with a pressure of 200–220 mmHg for 3 min. Theexperiment was conducted according to the study protocol isdescribed in Figure 2.
All measurements were carried out mainly in the morning,2–3 h after meal, in a state of mental and physical rest. Thepatient sat in such a way that the forearm of his right handwas 20 cm below the level of the heart (Figure 1A). Thetotal duration of the experiment was not more than 40 min.Representative record of the cutaneous blood perfusion andtemperature of the conditionally healthy volunteer is shown inFigures 3A,B, respectively.
Data Analysis and Diagnostic CriteriaBased on the results of the study, it was revealedseveral characteristic types of the blood microcirculationsystem response to temperature and occlusion effects(Zherebtsova et al., 2015).
The first type of response is characterized by the absence ofthe spasm, that reflects in temperature and perfusion increasedin post-occlusion period.
In the case of the second type of the response, theinitial parameters of the thermoregulatory system are suchthat at a moderate cooling of fingers the system can rapidlyswitch to state with low temperature. However, the effectof vasodilation induced by the occlusion is higher than thevasoconstriction induced by cooling. Thus, the mechanismof endothelial function for patients with the second type ofresponse remains active.
In the case of the third type of response, vasospasm tendencyremains much high (a tendency to stay in the stationary pointof low temperature) and the vasodilatory effect of the occlusionis minimal. Therefore, the vasodilation does not appear in thiscase against a background of the vasoconstriction of vessels forthe present temperature level.
The analysis of the obtained results showed that forthe reliable identification of the functional state of bloodmicrocirculation in fingers it is advisable to use two parametersbased on the type of response of the cutaneous temperatureand the skin blood flow to the arterial occlusion at alow temperature.
For the assessment of the vasodilation effect on cutaneoustemperature, it was proposed to estimate the ratio of thedifference between the maximum temperature after occlusionand the temperature of cold water to the difference between
the minimum cutaneous temperature during occlusion and thetemperature of cold water. To account for the effect of biologicaltissue heat capacity, the obtained value was normalized to thevolume of the distal phalanx of the finger. Thus, the index oftemperature response (ITR, arb. un.), based on skin temperaturemeasurements, was calculated by the following formula:
ITR =1V
(TPO − TCW)
(TO − TCW)(1)
where TO – the minimum temperature of the biological tissueduring occlusion period, ◦C; TPO – the maximum temperatureof the biological tissue during occlusion period, ◦C; TCW –the temperature of cold water in the heat-insulated water bath;V – the volume of the distal phalanx of the test finger, calculatedas the volume of semi-ellipsoid, cm3.
ITR allows assessing the extent of post-occlusion microvesselsvasodilatation at artificially created low ambient temperature.Vasospasm can be described as a state when thermoregulatorysystem tends to the stable stationary point that is close toambient temperature (“stationary point with low temperature”).Whereas in case of normality the thermoregulation is in astationary point which is characterized by a temperatureabove the ambient temperature (“stationary point withhigh temperature”). Formation of the feedforward triggersystem of switching between the stationary states is causedby the positive non-linear relationship between temperatureand blood perfusion (Nakamura, 2011). Decrease in thetemperature of the biological tissue leads to decrease in theblood perfusion, which in turn contributes to the furthertemperature reduction. The effect of vasoconstriction dueto temperature falling can be compensated by vasodilationeffect of occlusion (Dezfulian et al., 2017), which appearsin normal conditions and characterizes the functional stateof vascular endothelium in norm (Meredith et al., 1996).Decrease of index of the temperature response was observedin the PRD group.
However, the use of parameters from only cutaneousthermometry does not allow the relevant separation of the normand presence of vasospastic disorders. In this connection, wesuggest to use the composite diagnostic criteria, which includesboth LDF and cutaneous thermometry parameters.
For the assessment of adaptation reserves in the bloodmicrocirculation system and for the evaluation the process ofskin blood flow restoration after occlusion, the most commonlyused value is the percentage ratio between the maximum skinblood perfusion after occlusion and the average skin bloodperfusion level in basal conditions. In these experiments, we used
FIGURE 2 | Time chart of the study protocol of simultaneous measurements of the blood perfusion and skin temperature.
Frontiers in Physiology | www.frontiersin.org 4 April 2019 | Volume 10 | Article 416

fphys-10-00416 April 14, 2019 Time: 11:9 # 5
Zherebtsova et al. Multimodal Optical Diagnostics
FIGURE 3 | Representative record of the cutaneous blood perfusion (A) and skin temperature (B) during the study on the conditionally healthy volunteer.
the parameter called blood flow reserve (BFR, %), calculatedaccording to the formula:
BFR =Immax
Imbase100% (2)
where Immax – average index of blood microcirculation in thefirst 60 s after occlusion, PU; Imbase – average index of bloodmicrocirculation during 60 s before occlusion, PU. Averaging ofskin blood flow during 60 s is used to exclude the influence ofmotion artifacts on the results of calculations.
Post occlusive reactive hyperemia is used to investigate andassess microvascular function (endothelial function). Therefore,the BFR parameter characterizing the reaction of microvesselsto arterial occlusion can serve as an effective tool for assessingmicrocirculatory disorders in rheumatic diseases.
In order to synthesize the decision rule for diagnosis, it isnecessary to find a discriminant function that separates classesof the norm and the presence of vasospastic disorders using theITR and BFR parameters.
Experimental studies have shown that PRD have lower valuesof the blood flow reserve, as well as a reduced index oftemperature response after occlusion. There is a statisticallysignificant difference of BFR and ITR parameters between values
calculated for the HV and PRD. Comparison of these parametersbetween studied groups is shown in Figure 4.
The values of BFR and ITR have a two-dimensional normaldistribution. The training sample size n = n1 + n2 = 68 is morethan 20 times larger than the number of variables in the vector ofinformative parameters m = 2.
All these conditions enable us to apply the mathematicalmethod of linear discriminant analysis (Demir and Ozmehmet,2005). Using this method a discriminant function was defined ina linear form
F(BFR, ITR) = 0.022 · BFR+ 1.61 · ITR (3)
that allowed synthesis of the desired decision rule:{healthy if F(BFR, ITR) > 3.7,
vasospastic disorders if F(BFR, ITR) ≤ 3.7.(4)
Substituting the experimental values of the parameters BFRand ITR into eq. (3), one can determine the presence orabsence of vasospastic disorders of studied subject usingdecision rule (4).
Figure 5A shows the scatter plot of parameters ITR and BFRwith the discriminant function (3). Points of the given graphcorrespond to a combination of experimental values BFR andITR for examined persons, and discriminant linear function (3)
Frontiers in Physiology | www.frontiersin.org 5 April 2019 | Volume 10 | Article 416

fphys-10-00416 April 14, 2019 Time: 11:9 # 6
Zherebtsova et al. Multimodal Optical Diagnostics
FIGURE 4 | Comparison of parameters between control (blue bars) and rheumatic (red bars) groups: the index of temperature response ITR (A) and the blood flowreserve BFR (B). In each box, the central line is the median of the group, while the edges are the 25th and 75th percentiles. Statistically significant differencesbetween the comparing groups with ∗ is p < 0.005 (according to Mann–Whitney U-test).
FIGURE 5 | The scatter diagram of parameters ITR and BFR with the applied discriminant function (A) and the ROC-curve for assessing the effectiveness of theclassifier (B).
divides the feature space into two half-planes. According to thedecision rule (4), the area above the discriminant straight linecorresponds to the absence of vasospastic disorders in the fingers,the area below – to the presence of vasospastic disorders.
Leave-one-out cross-validation method was used forverification of the decision rule (Rao et al., 2007). Verificationprocedure reveals the probability of false-negative diagnosisresult at the level of 0.13 (sensitivity 0.87), false-positive at 0.26(specificity 0.74). The receiver operating characteristic curve(ROC-curve) for the suggested method of diagnosis is shown inFigure 5B. It indicates the quality of the suggested method ofbinary classification. The curve shows the sensitivity to specificityratio at various values of the threshold between the domainsof normal state of health and angiospastic disorders. The areaunder the curve is 0.88, which is indicative of a high efficiencyof the classifier.
The proposed decision rule (4) allows us to offer a diagnosticsmethod for the functional state of peripheral vessels, which can becharacterized as reserve possibilities of blood flow using the LDFmethod, and reactivity of peripheral vessels located at a greaterdepth using the cutaneous thermometry method.
Experimental Results and DiscussionThe new diagnostic procedure using methods of laser Dopplerflowmetry and thermometry during combined provocativefactors of cold and ischemia was proposed in the study. It wassuggested to use the measurements of blood microcirculationand skin temperature during the occlusion test in the thermallystabilized environment as a diagnostic approach for identificationdysfunctions of the peripheral blood vasculature in PRD.
Using the experimental values of the parameters of LDF- andthermograms, a simple model for the classification of thepresence or absence of vasospastic disorders in the fingers wasproposed. The resulting classification model showed good resultsof sensitivity (0.87) and specificity (0.74).
The proposed approach of using a combination ofseveral diagnostic technologies makes it possible to conducta comprehensive assessment of the functional state ofmicrocirculation vessels and larger vessels of the fingers. Thecombined effect of low temperature and temporary circulatoryarrest provokes a manifestation of the vasospastic state. Since thevasospasm appears sporadically, this approach allows reducingthe level of false–negative diagnostic results.
Frontiers in Physiology | www.frontiersin.org 6 April 2019 | Volume 10 | Article 416

fphys-10-00416 April 14, 2019 Time: 11:9 # 7
Zherebtsova et al. Multimodal Optical Diagnostics
The results from this conducted research can be used inthe development of multi-functional non-invasive diagnosticsystems for the diagnosis and prevention of diseases associatedwith changes in the functional state of peripheral vessels.
COLD PRESSOR TEST IN DETECTIONOF DISORDERS IN THEMICROCIRCULATORY BED OF UPPERLIMBS
Materials and MethodsTo evaluate the combined use functionality of the laserDoppler flowmetry (LDF), tissue reflectance oximetry(TRO), pulse oximetry (PO) methods and cold pressor test(CPT), experimental studies involved 32 HV (mean age22 ± 2 years) and 60 PRD (mean age 55 ± 14 years) fromthe Rheumatology Department of the Orel Regional ClinicalHospital (Oryol, Russia).
The group of patients includes individuals primarily with therheumatoid arthritis and systemic lupus erythematosus.
As described previously, disorders of upper limbmicrocirculatory bed are most commonly found as one ofthe forms of rheumatological profile disease pathologies. Thesediseases are more common in the elderly. It is thus necessaryto clearly differentiate between a healthy state and one withmicrocirculatory bed disorders. A group of healthy youngvolunteers was recruited as a control to ensure an “extreme”state of good health, as they would present the lowest chance ofexhibiting any undesired physiological conditions.
The experiment was conducted according to the studyprotocol described in Figure 6.
All measurements were performed in conditions of physicaland mental rest 2 h after a meal. Volunteers also underwenta preliminary adaptation to room temperature 24–25◦C for15–20 min in a sitting position, with the right arm on thetable at heart level. The adaptation of volunteers to standardroom temperature and abidance of study protocol during allmeasurements reduces the influence of different factors onresults of diagnosis.
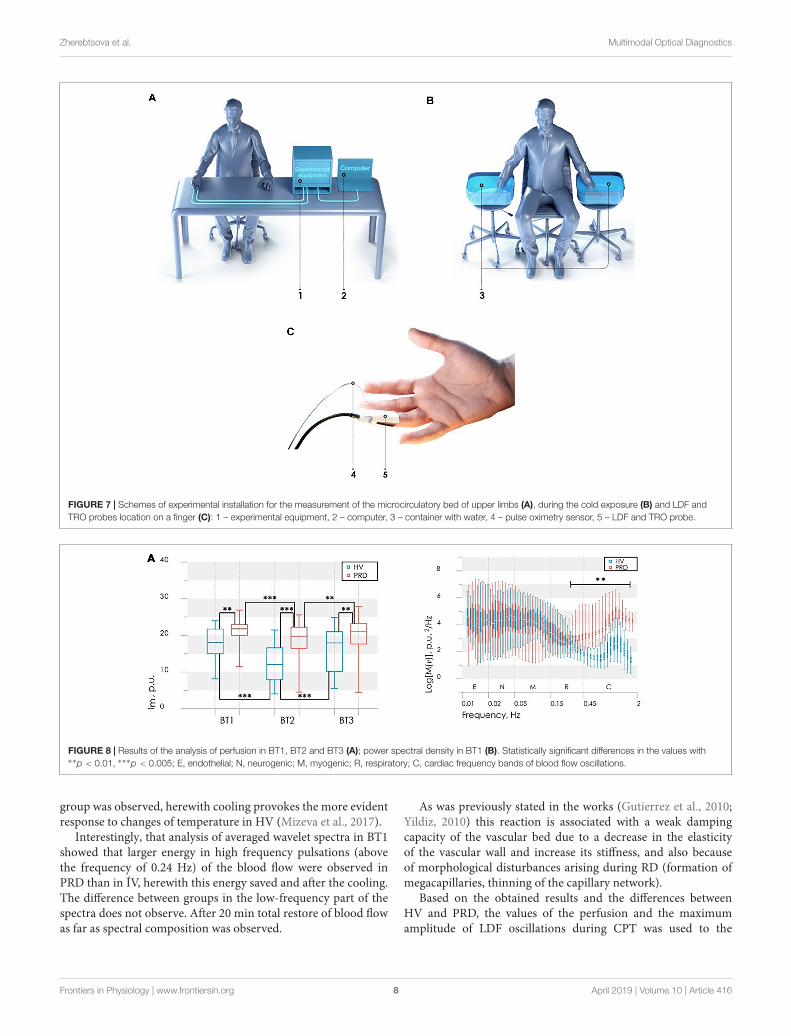
Experimental systems “LAKK-OP” and “LAKK-M” (SPE“LAZMA” Ltd., Russia) were applied for the measurement LDF-,TRO-, and PO-signals. These diagnostic devices utilized identicalmeasurement channels. Temperature of water in a containerduring the cold exposure was controlled by a contactlessdigital thermometer (Sensitec NB401, Netherlands). Schemes
of experimental installation during the measurement, duringthe cold exposure and schematic presentation of the LDF- andTRO-probe and pulse oximetry sensor positioning on a finger areshowed in Figure 7.
The used TRO channel calculates the tissue oxygensaturation, which is defined as the percentage compositionof oxyhaemoglobin in the sum of major fractions of hemoglobinin a tissue volume (Dunaev et al., 2014). The instrumentimplements the computational model based on the modifieddiffuse approximation of the light transfer equation (Spottet al., 1997) and utilizes the differences in the spectralcharacteristics of oxygenated and deoxygenated hemoglobin.The TRO measurements allow for non-invasive monitoring ofmicrohaemodynamics and transport and utilization of oxygenwithin the blood microcirculation system.
Basic microcirculatory bed parameters were registered duringexperimental studies, providing a vast array of information.Index of blood microcirculation (Im), tissue oxygen saturation(StO2) and arterial oxygen saturation (SàO2) were registered byproposed methods.
Wavelet analysis of the registered LDF- and TRO-signals wascarried out to evaluate the regulatory mechanisms. The complexMorlet wavelet was used as the analyzing wavelet (Frick et al.,2015). The calculation of wavelet coefficients for the frequencyrange from 0.01 to 2 Hz was performed with a logarithmicpartitioning into 50 frequency sub-bands. Global wavelet powerspectra were also calculated for both study groups in each BT.Maximum amplitude of peripheral blood flow oscillations inone of the frequency bands [endothelial (Ae), neurogenic (An),myogenic (Am), respiratory (Ar) and cardiac (Ac)] calculatedfrom the wavelet analysis of LDF- and TRO-signals (Goltsovet al., 2017). Based on measured parameters and results ofwavelet analysis of the registered LDF- and TRO-signals usingproposed approach (Makovik et al., 2017) complex parameterswere calculated.
Statistical analysis of the measured and calculatedparameters was performed using non-parametric criteria:the Mann–Whitney test for comparing values between groupsand the Wilcoxon test for comparing values within a single group.
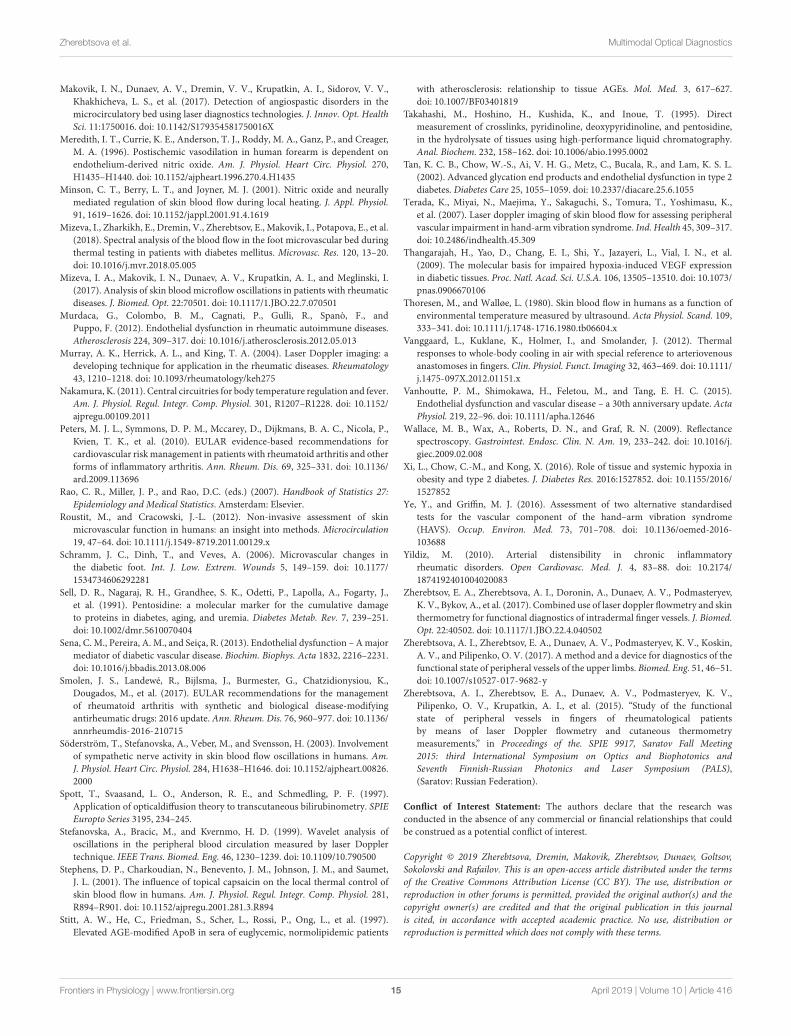
Data Analysis and Diagnostic CriteriaResults of experimental studies showed that CPT evokesdifferent reaction from the microcirculatory bed in each group.In particular, partial or complete recovery of the blood flowparameters after the CPT in some subjects was observed. As itis shown in Figure 8 higher perfusion in basal state in PRD
FIGURE 6 | Time chart of the study protocol for the diagnostics of the microcirculatory bed of upper limbs: BT1, BT2, and BT3 – basic tests before, immediatelyafter and 15 min after the cold exposure.
Frontiers in Physiology | www.frontiersin.org 7 April 2019 | Volume 10 | Article 416
fphys-10-00416 April 14, 2019 Time: 11:9 # 8
Zherebtsova et al. Multimodal Optical Diagnostics
FIGURE 7 | Schemes of experimental installation for the measurement of the microcirculatory bed of upper limbs (A), during the cold exposure (B) and LDF andTRO probes location on a finger (C): 1 – experimental equipment, 2 – computer, 3 – container with water, 4 – pulse oximetry sensor, 5 – LDF and TRO probe.
FIGURE 8 | Results of the analysis of perfusion in BT1, BT2 and BT3 (A); power spectral density in BT1 (B). Statistically significant differences in the values with∗∗p < 0.01, ∗∗∗p < 0.005; E, endothelial; N, neurogenic; M, myogenic; R, respiratory; C, cardiac frequency bands of blood flow oscillations.
group was observed, herewith cooling provokes the more evidentresponse to changes of temperature in HV (Mizeva et al., 2017).
Interestingly, that analysis of averaged wavelet spectra in BT1showed that larger energy in high frequency pulsations (abovethe frequency of 0.24 Hz) of the blood flow were observed inPRD than in ÍV, herewith this energy saved and after the cooling.The difference between groups in the low-frequency part of thespectra does not observe. After 20 min total restore of blood flowas far as spectral composition was observed.
As was previously stated in the works (Gutierrez et al., 2010;Yildiz, 2010) this reaction is associated with a weak dampingcapacity of the vascular bed due to a decrease in the elasticityof the vascular wall and increase its stiffness, and also becauseof morphological disturbances arising during RD (formation ofmegacapillaries, thinning of the capillary network).
Based on the obtained results and the differences betweenHV and PRD, the values of the perfusion and the maximumamplitude of LDF oscillations during CPT was used to the
Frontiers in Physiology | www.frontiersin.org 8 April 2019 | Volume 10 | Article 416

fphys-10-00416 April 14, 2019 Time: 11:9 # 9
Zherebtsova et al. Multimodal Optical Diagnostics
synthesis of the decision rule for diagnose microcirculatorydisorders in RD. These parameters satisfy the principles ofstatistical independence, as well as the significance of thedifferences of their values, calculated for the PRD and HV.A discriminant function of the values of perfusion Im2 andthe maximum amplitude of blood flow oscillation in cardiacfrequency band Ac2 for BT2 (measurement immediately after thecold exposure) was defined in the following linear form
F(Im2,Ac2) = 0.12 · Im2 + 1.93 · Ac2 − 3.25 (5)
Figure 9A shows the scatter plot of parameters Im2 and MT2with the discriminant function (5). Points of the given graphcorrespond to a combination of experimental values Im2 andMT2 for HV and PRD, and discriminant linear function (5)divides the feature space into two half-planes. The area abovethe discriminant straight line corresponds to the absence ofmicrocirculatory disorders in the fingers, the area below – to thepresence of microcirculatory disorders.
Figure 9B shows the ROC curve calculated for the obtaineddiscriminant function. Area under curve (AUC) was usedto compare the quality of different classifying rules. Forthe synthesized decision rule AUC equals 0.92. The resultsdemonstrate that the perfusion and amplitude of the pulsewave can act as independent markers for microcirculatorydisorders in RD.
Additional calculated parameters have been evaluated as itdescribed in Makovik et al. (2017). Analysis of the parametersin each group during experimental study identified differencesin myogenic tone (MT) and rate of oxygen consumption(OC) in BT3 (measurement 15 min after the cold exposure)(Figure 10), namely higher level of MT and lower level of OCin PRD than in HV.
Differences in OC level in PRD and HV (Figure 10B)indicate the possible violations of the microvascular bedsurface of the smallest arterioles and capillaries (Makoviket al., 2017). In PRD a decrease of OC with an increaseof MT compared with the values for HV are observed(Figure 10A). Such result can be interpreted as a sign of
reduction of oxygen diffused through the vessel walls. Theseprocesses can lead to hypoxia, edema of tissues and theappearance of necrobiotic processes at untimely diagnostics andabsence of treatment.
An analysis of the possible causes of these pathologicalchanges revealed their association with an increase in myogenictone, as well as its combination with venous stasis. So MT andOC can be used as an additional diagnostic criteria for detectionof complications associated with microvascular disturbances andtheir possible causes.
Experimental Results and DiscussionExperimental studies have shown that the combined use ofoptical non-invasive technologies (laser Doppler flowmetry andtissue reflectance oximetry) in combination with cold pressortest has a huge diagnostic potential. The described methodallows diagnosing the presence of vasospastic disorders inrheumatic diseases and identifying the possible cause of thepathological condition.
The proposed approach is based on the use of LDF andTRO methods before and after the exposure and subsequentwavelet transform of the signals. The level of the skin blood flowand its spectral properties undergo changes due to violationsin the microcirculation system regulation. The mean level ofthe local microcirculatory blood perfusion and the amplitudeof the pulse oscillations of blood flow immediately after CPTare two proposed diagnostic criteria, which were chosen for thesynthesis of the decision rule. The resulting classification modelprovides excellent results of sensitivity (0.92) and specificity(0.97) in diagnosing microvascular disorders in rheumaticdiseases (see Figure 9B).
In case of detection of microcirculatory disorders, the secondstage of the proposed diagnostic method was implemented. Itconsists in identification of the associated complications and theirpossible causes with the use of additional diagnostic criteria:complex parameters of hemodynamics (myogenic tone, MT)and tissue respiration (rate of oxygen consumption, OC). Theparameters are calculated based on the measured LDF and
FIGURE 9 | The scatter diagram of parameters Ac2 and Im2 with the applied discriminant function (straight line), obtained by LDF method (A) and the ROC-curve(solid line) for assessing the effectiveness of the classifier (B) Dash line shows ROC-curve with area under curve equals of 0.5 and characterizes the unsuitability ofthe classification method.
Frontiers in Physiology | www.frontiersin.org 9 April 2019 | Volume 10 | Article 416

fphys-10-00416 April 14, 2019 Time: 11:9 # 10
Zherebtsova et al. Multimodal Optical Diagnostics
FIGURE 10 | Results of the analysis of the myogenic tone, MT (A) and rate of oxygen consumption, OC (B) in BT3 (measurement 15 min after the cold exposure).Statistically significant differences in the values with ∗∗p < 0.01, ∗∗∗p < 0.005.
TRO parameters before and after CPT. The combination ofparameter values allows assessing the presence of complicationsand identifying myogenic or myogenic-congestion cause oftheir occurrence.
The clinical trail of the method showed a considerablepromise in clinical application for the functional evaluation ofmicrocirculatory blood flow regulation and has good possibilitiesin the diagnosis of microvascular disorders associated withrheumatic diseases.
MULTIMODAL OPTICALMEASUREMENTS UNDER LOCALHEATING TEST TO REVEAL CHANGESIN LOWER LIMBS IN PATIENTS WITHDIABETES MELLITUS
Materials and MethodsThe aim of this study was to estimate experimentally the potentialof co-registering parameters of cutaneous blood flow and theintrinsic tissue fluorophore fluorescence with the object todetermine the stage of lower limb complications of in patientswith diabetes mellitus.
The tissue blood perfusion and the tissue fluorescence wereassessed in the experimental studies by LDF and FS, respectively(Dremin et al., 2017). Parameters of the blood perfusion andthe amplitude of the coenzyme NADH and FAD fluorescencesignals were registered simultaneously in the same tissue volume.The single mode laser module with a wavelength of 1,064 nmwas used in the laser Doppler channel of the system SPE“LAZMA” Ltd., Russia. For the fluorescence excitation, tworadiation sources of 365 and 450 nm were applied. For theassessment of the local regulatory mechanisms of blood flowthe local heating stimulation was selected as a provocativeaction on the blood microcirculation system. A special block“LAZMA-TEST” (SPE “LAZMA” Ltd., Russia) allowed us toestablish and maintain the determined local temperature ofthe investigated area. Specialized software was used to controlthe unit responsible for thermal functional tests, to observe
the real-time course of the experiment and to analyze therecorded parameters.
The experimental study involved 76 patients from theEndocrinology Department of the Orel Regional ClinicalHospital (Oryol, Russia). All patients had type 2 diabetesmellitus. The illness was taking its normal course in 62 patients(Diabetic group 1, mean age 54 ± 10 years). Another 14people among the patients’ group were identified to have amore severe course of the disease (Diabetic group 2, mean age53± 13 years). In each case, the degree of severity was determinedbased on anamnesis analysis, consultation with the attendingphysician and presence of trophic disorders: Diabetic group 1consisted of all patients without trophic ulcers, when Diabeticgroup 2 included diabetics with the presence of visible trophiculcers. The control group consisted of 48 healthy volunteers(mean age 46± 6 years).
The experimental study was conducted under the establishedprotocol. Each experiment consisted of four stages. The firststage included 4 min registration of microcirculatory bloodperfusion under the basal conditions and recording of a pairof fluorescence spectra at the end of the period. This wasfollowed by a consecutive local cold (25◦Ñ) and heat (35 and42◦Ñ) provocations lasting for 4 min each. The duration of oneexperiment was approximately 16 min. Time chart of the studyprotocol is shown in Figure 11.
The dorsal surface of the foot was chosen as an investigatedarea. The probe was secured on a plateau between the 1st and2nd metatarsal bones (Figure 12).
Changes in blood flow of the investigated area of non-glabrousskin are mediated by the vessels themselves and by mechanismsof the sympathetic nervous system (Johnson and Proppe, 2011).The microcirculation assessment in this area may demonstratebetter sensitivity to disease severity in comparison with glabrousor non-hairy skin (with arteriovenous anastomoses) whereblood perfusion may fluctuate substantially (Thoresen andWalløe, 1980; Vanggaard et al., 2012; Fuchs et al., 2017).All measurements were performed in the supine position. Aslocal pressure of the probe on skin influences strongly onthe measurement results of blood perfusion and fluorescenceintensity, a particular attention was paid to minimize the
Frontiers in Physiology | www.frontiersin.org 10 April 2019 | Volume 10 | Article 416

fphys-10-00416 April 14, 2019 Time: 11:9 # 11
Zherebtsova et al. Multimodal Optical Diagnostics
FIGURE 11 | Time chart of the study protocol of multimodal optical measurements under local heating test.
FIGURE 12 | Location of the fiber optic probe (1) with Peltier thermal-pad (2).
parameter. The volunteers were asked to refrain from foodand drink 2 h before the study to exclude the influenceof these factors on the change of microhemocirculationand metabolic processes. Room temperature was maintainedat a steady 24–25◦C. All volunteers underwent preliminaryadaptation to these conditions for at least 10 min. Changeof skin temperature was recorded during the study. Sinceskin temperature of subjects was different in the basalconditions, the studied area was pre-cooled to 25◦C tounify measurements.
Data Analysis and Diagnostic CriteriaAveraged amplitudes of fluorescence were recorded at the basalconditions. Normalized intensities of backscattered excitation
radiation (AF460 at 460 ± 10 nm with excitation at 365 nmand AF525 at 525 ± 10 nm with excitation at 450 nm)were analyzed. The wavelengths were chosen to maximize theprobability of detecting NADH and FAD fluorescence signals(Dunaev et al., 2015). The microcirculatory blood perfusion ofthe investigated tissue was recorded and averaged at each stageof the experiment. Non-parametric methods (Mann–WhitneyU-test and Kruskal–Wallis ANOVA test) were used to confirmthe reliability of differences in the results. The difference wasconsidered significant when p < 0.01.
Taking into account the division of experimental data intothree classes (two diabetic groups and one control), a lineardiscriminant analysis was used to determine the discriminantfunctions, which allow stating the desired decision-making rules.Thus, the obtained classifiers allow the newly appearing object tobe assigned to one of the above classes by the measuring of itsparameters. The quality of the discriminant analysis was assessedusing the ROC-curve.
Experimental studies have shown that patients with diabetesmellitus have increased values of normalized fluorescenceamplitudes at basal conditions and reduced perfusion responseto local heating (up to 35 and 42◦C). It was also noticed that theseparameters in the Diabetic group 2 (patients with diabetic trophiculcers) had significantly difference from the Diabetic group 1 andcontrol group (Figure 13).
Statistically significant differences in parameters may be dueto a number of reasons. Diabetes can cause tissue hypoxia, whichleads to a violation of the aerobic respiration pathway of cells(Ditzel and Standl, 1975; Thangarajah et al., 2009; Xi et al.,2016). In this case, the mitochondrial oxidation of NADH slowsdown, while the glycolysis pathway of NADH formation activates.Therefore, NADH accumulation may be considered as a signof tissue hypoxia, and its contribution to the total fluorescencesignal as a marker of general oxygen deficiency in tissues.
As was mentioned earlier, AGEs are involved in themechanisms of diabetes complications development. The rapidformation of intracellular AGEs contributes to the violationof protein function and can serve as an objective marker ofglycation in tissues (Gkogkolou and Böhm, 2012). Observed inthe study level of skin fluorescence is related to the determinedin vitro standard glycation marker HbA1c. The conventionalmeasure of glycation using HbA1c characterizes the glycation
Frontiers in Physiology | www.frontiersin.org 11 April 2019 | Volume 10 | Article 416

fphys-10-00416 April 14, 2019 Time: 11:9 # 12
Zherebtsova et al. Multimodal Optical Diagnostics
FIGURE 13 | Comparison of the parameters between control (red bars), diabetic (blue bars) and diabetic with ulcers (green bars) groups: the normalizedfluorescence amplitude, AF (A) and the average perfusion, Im, in the stages of heating to 35 and 42◦C (B). Statistically significant differences between Control groupand Diabetic group 1 with ∗p < 0.01 and between Diabetic groups 1 and 2 ∗∗p < 0.01, respectively.
processes that occurs in a short period (around 3 months). Whilelong-term processes in the diabetic skin are reflected by changesin AGE content. In view of the stability of AGEs and the longmolecular lifetime of collagen, it might be supposed that the skinfluorescence would be applied as a measure of the total impact ofhyperglycaemia in the course of life.
The basal level of perfusion does not have a statisticallysignificant differences between the compared groups(Figure 13B). However, the proposed functional thermaltests allow identifying the microvascular disorders. Normally,the increase in perfusion during the local heating occurs mainlydue to two mechanisms. As reported, skin heating to 34–35◦Cleads to activation of peptidergic nerve fibers by activatingheat-sensitive receptors (Stephens et al., 2001). Skin heating to42◦C leads to vasodilation by releasing NO from the vascularendothelium (Minson et al., 2001; Kellogg et al., 2009). In thecase of diabetes, all aspects of the microcirculatory and tissuesystems, including vascular endothelial and perivascular nervefibers, are subject to dysfunction. Therefore, the thermal test is
pathogenically justified for the diagnosis of these disorders indiabetes. The reduction of perfusion growth in patients withdiabetes mellitus when heated to 35◦C is an objective criterion forimpaired function of sensory nerve fibers, which is a componentof diabetic neuropathy. The reduction of perfusion growth whenheated to 42◦C reflects a deficiency of endothelium-dependentvasodilation mechanisms. Differences in perfusion reaction tovarious stimuli can be explained by the fact that NO synthesis canbe suppressed by the accumulation of AGEs in endothelial cells(Bucala et al., 1991; Stitt et al., 1997; Chakravarthy et al., 1998).
For the synthesis of the decision rule, the analyzed parametersof normalized amplitudes of skin fluorescence and perfusionare proposed. The selected parameters satisfy the principles ofstatistical independence and the significance of the differencebetween their values in target groups. Discriminant functionwas synthesized to provide the best combination of sensitivityand specificity. The lowest level of error was obtained bycombining the fluorescence intensity at the excitation wavelengthof 365 nm and the average level of skin blood perfusion
FIGURE 14 | (A) The scatter plot of the values Im42◦C and AF460 obtained by LDA method with the applied discriminant functions (6) shown by solid (D2) and dash(D1) lines. The healthy group is shown by red squares, the diabetic group – blue circles, the diabetic group with ulcers – green triangles. (B) The ROC-curves forassessing the effectiveness of the classifiers (6): red line is Control group vs. Diabetic group 1, the blue line is Diabetic group 1 vs. Diabetic group 2, dash line is theworst case.
Frontiers in Physiology | www.frontiersin.org 12 April 2019 | Volume 10 | Article 416

fphys-10-00416 April 14, 2019 Time: 11:9 # 13
Zherebtsova et al. Multimodal Optical Diagnostics
at 42◦C. Sensitivity and specificity of the first classificationrule (Control group against Diabetic group 1) were 0.92 and0.90, respectively. Sensitivity and specificity of 0.86 and 0.85,respectively, were obtained for the second classification rule(Diabetic group 1 vs. Diabetic group 2). Figure 14A shows thescatter plot of experimental data with applied discriminant linesdividing the experimental points into three groups. Thus, theresulting diagnostic criterion, using two discriminant functions,D1 and D2, and allowing classifying the measured subject to oneof three groups, can be written as:
D1 = −2.55− 0.45 · AF460 + 0.23 · I42 ◦Cm ,
D2 = −1.80+ 1.16 · AF460 − 0.18 · I42 ◦Cm
(6)
Figure 14A shows that the shift of the values Im42 (◦Ñ and AF460towards the top-left corner of the diagram characteriszes thedeterioration of the patient’s condition and increasing the risk offoot ulcers development.
(◦Ñ and AF460 obtained by LDA method with the applieddiscriminant functions (6) shown by solid (D2) and dash(D1) lines. The healthy group is shown by red squares,the diabetic group
The ROC-curves calculated for the obtained discriminantfunctions are shown in Figure 14B. The integralcharacteristic – area under curve (AUC) was used to evaluate andcompare the quality of different classification rules. AUC = 0.93for both found classification rules that means a high level of theclassifiers quality.
Thus, the values of skin fluorescence and level of bloodperfusion during the local heating test can be used effectively forthe analysis the various stages of diabetes, from the initial stage ofthe disease, to the development of trophic ulcers.
Experimental Results and DiscussionThe proposed method, based on the use of optical non-invasivediagnostic methods in combination with local heat test, showsthe high sensitivity and can be an effective marker of metabolicchanges in diabetes mellitus. Both approaches (laser Dopplerflowmetry and fluorescence spectroscopy) individually and incombination have excellent diagnostic potential as they canhelp identify patients at risk of future problems in their lowerlimbs. The obtained experimental results confirm the prospectsof the combined use of these optical non-invasive methods inthe detection of biological tissue disorders in type 2 diabetes.In addition, the method has a good potential in the field ofevaluation of therapeutic interventions aimed at preventing andreducing the progression of diabetic complications, as well as tominimize their negative consequences.
Expanding the number of clinical trials and improving themethodological support of optical non-invasive diagnostics willallow introducing these methods into clinical practice of theattending physician. The use of this methods of diagnosisof the diabetes complications, which is easily implemented,non-invasive convenient and safe for the patient, will make asignificant contribution to the fight against diabetes.
One promising area for further development in this area isthe differentiation and evaluation of the contributions of the
AGEs, NADH, and FAD to the resulting fluorescence signal. Thiswould allow carrying out studies to identify possible pathways ofbiological tissue disturbance.
CONCLUSION
The use of optical non-invasive diagnostic methods has a greatpotential for the detection of concomitant microcirculationdisorders in patients with rheumatic diseases and diabetes.In this review, it was shown that the use of laser Dopplerflowmetry, optical tissue oximetry and fluorescence spectroscopytogether or separately may have important diagnostic valuefor the detection of violations, assessment of their severity,as well as for the analysis of the effectiveness of the therapy.The joint application of the considered technologies with themethods of machine learning (discriminant analysis) can be usedas additional diagnostic criteria in the field of rheumatologyand endocrinology.
Thus, the introduction of optical methods for the assessmentof peripheral hemodynamics and metabolic processes inrheumatic diseases and diabetes makes it possible to earlypreclinical diagnosis of microcirculatory and metabolic disorders,contributing to the improvement of the effectiveness andquality of treatment.
The perspective direction of the development of the opticalnon-invasive diagnostics method is their realization in the formof the wearable compact wireless devices suitable for long-termmonitoring of microcirculation and metabolism parametersaccomplished with the development of methodology of theirapplication. The use of compact wearable devices will allowdiagnosis of arterio-venular anastomoses and investigation of thecompensatory mechanisms and synchronization of blood flowoscillations during functional tests.
ETHICS STATEMENT
These studies were carried out in accordance with the Declarationof Helsinki principles and approved by the Ethics Committee ofthe Orel State University. All patients participated in the trialshave given the full consent on measurements in written and beeninformed of their right to discontinue participation at any time.
AUTHOR CONTRIBUTIONS
AD, SS, and ER designed the study. AZ, VD, IM, and EZ collectedand analyzed researched data and drafted the manuscript.AG contributed to the data analysis and preparation of a finalversion of the article. All authors contributed to the discussionand reviewed and edited manusript.
FUNDING
SS and ER were partially supported by Russian ScienceFoundation (Grant No. 18-15-00172). EZ kindly acknowledges
Frontiers in Physiology | www.frontiersin.org 13 April 2019 | Volume 10 | Article 416

fphys-10-00416 April 14, 2019 Time: 11:9 # 14
Zherebtsova et al. Multimodal Optical Diagnostics
for personal support from the European Union’sHorizon 2020 Research and Innovation Programmeunder the Marie Skłodowska-Curie grant agreementNo. 703145 and Academy of Finland, grant No.318281. AZ (regarding the experimental studies ofthe blood perfusion and skin temperature dynamicsfor functional diagnostics of intradermal finger vessels)was funded by the Russian Science Foundation (GrantNo. 18-79-00237).
ACKNOWLEDGMENTS
We would like to thank all of our volunteers and patients for theircontribution to this research project. Special thanks are extendedto doctors Khakhicheva L. S., Alimicheva E. A., Masalygina G.I., and Muradyan V. F. of the Orel Regional Clinical Hospitalfor providing useful advice and help. AG acknowledges theScottish Informatics & Computer Science Alliance (SICSA)for partly support.
REFERENCESAbularrage, C. J., Sidawy, A. N., Aidinian, G., Singh, N., Weiswasser, J. M., and
Arora, S. (2005). Evaluation of the microcirculation in vascular disease. J. Vasc.Surg. 42, 574–581. doi: 10.1016/j.jvs.2005.05.019
Avogaro, A., Albiero, M., Menegazzo, L., De Kreutzenberg, S., and Fadini, G. P.(2011). Endothelial dysfunction in diabetes: the role of reparatory mechanisms.Diabetes Care 34, S285–S290. doi: 10.2337/dc11-s239
Avouac, J., Fransen, J., Walker, U. A., Riccieri, V., Smith, V., Muller, C.,et al. (2011). Preliminary criteria for the very early diagnosis of systemicsclerosis: results of a delphi consensus study from eular scleroderma trialsand research group. Ann. Rheum. Dis. 70, 476–481. doi: 10.1136/ard.2010.136929
Bartolomé, F., and Abramov, A. Y. (2015). “Measurement of mitochondrial NADHand FAD autofluorescence in live cells,” in Mitochondrial Medicine, eds V.Weissig and M. Edeas (New York, NY: Humana Press), 263–270.
Bonner, R. F., and Nossal, R. (1990). “Principles of Laser-Doppler Flowmetry,” inLaser-Doppler Blood Flowmetry, eds A. P. Shepherd and P. Å. Öberg (Boston,MA: Springer), 17–45. doi: 10.1007/978-1-4757-2083-9_2
Bucala, R., Tracey, K. J., and Cerami, A. (1991). Advanced glycosylationproducts quench nitric oxide and mediate defective endothelium-dependentvasodilatation in experimental diabetes. J. Clin. Invest. 87, 432–438. doi: 10.1172/JCI115014
Casavola, C., Paunescu, L. A., Fantini, S., Franceschini, M. A., Lugarà, P. M.,and Gratton, E. (1999). Application of near-infrared tissue oxymetry tothe diagnosis of peripheral vascular disease. Clin. Hemorheol. Microcirc. 21,389–393.
Chakravarthy, U., Hayes, R. G., Stitt, A. W., Mcauley, E., and Archer, D. B. (1998).Constitutive nitric oxide synthase expression in retinal vascular endothelial cellsis suppressed by high glucose and advanced glycation end products.Diabetes 47,945–952. doi: 10.2337/diabetes.47.6.945
Daly Susan, M., and Leahy Martin, J. (2012). ‘Go with the flow ’: a review ofmethods and advancements in blood flow imaging. J. Biophotonics 6, 217–255.doi: 10.1002/jbio.201200071
Demir, G. K., and Ozmehmet, K. (2005). Online local learning algorithms for lineardiscriminant analysis. Pattern Recognit. Lett. 26, 421–431. doi: 10.1016/j.patrec.2004.08.005
Dezfulian, C., Taft, M., Corey, C., Hill, G., Krehel, N., Rittenberger, J. C., et al.(2017). Biochemical signaling by remote ischemic conditioning of the armversus thigh: is one raise of the cuff enough? Redox Biol. 12, 491–498.doi: 10.1016/j.redox.2017.03.010
Ditzel, J., and Standl, E. (1975). The problem of tissue oxygenation in diabetesmellitus. Acta Med. Scand. Suppl. 578, 59–68.
Dremin, V., Zherebtsov, E., Sidorov, V., Krupatkin, A., Makovik, I.,Zherebtsova, A., et al. (2017). Multimodal optical measurement for studyof lower limb tissue viability in patients with diabetes mellitus. J. Biomed. Opt.22, 1–10. doi: 10.1117/1.JBO.22.8.085003
Dunaev, A. V., Dremin, V. V., Zherebtsov, E. A., Rafailov, I. E., Litvinova, K. S.,Palmer, S. G., et al. (2015). Individual variability analysis of fluorescenceparameters measured in skin with different levels of nutritive blood flow. Med.Eng. Phys. 37, 574–583. doi: 10.1016/j.medengphy.2015.03.011
Dunaev, A. V., Sidorov, V. V., Krupatkin, A. I., Rafailov, I. E., Palmer,S. G., and Stewart, N. A. (2014). Investigating tissue respiration and skinmicrohaemocirculation under adaptive changes and the synchronization ofblood flow and oxygen saturation rhythms. Physiol. Meas. 35, 607–621.doi: 10.1088/0967-3334/35/4/607
Flammer, J., Pache, M., and Resink, T. (2001). Vasospasm, its role in thepathogenesis of diseases with particular reference to the eye. Prog. Retin. EyeRes. 20, 319–349. doi: 10.1016/S1350-9462(00)00028-8
Frick, P., Mizeva, I., and Podtaev, S. (2015). Skin temperature variations as a tracerof microvessel tone. Biomed. Signal Process. Control 21, 1–7. doi: 10.1016/j.bspc.2015.04.014
Fuchs, D., Dupon, P. P., Schaap, L. A., and Draijer, R. (2017). The associationbetween diabetes and dermal microvascular dysfunction non-invasivelyassessed by laser doppler with local thermal hyperemia: a systematic reviewwith meta-analysis. Cardiovasc. Diabetol. 16:11. doi: 10.1186/s12933-016-0487-1
Gkogkolou, P., and Böhm, M. (2012). Advanced glycation end products: keyplayers in skin aging? Dermatoendocrinology 4, 259–270. doi: 10.4161/derm.22028
Goltsov, A., Anisimova, A. V., Zakharkina, M., Krupatkin, A. I., Sidorov, V. V.,Sokolovski, S. G., et al. (2017). Bifurcation in blood oscillatory rhythms forpatients with ischemic stroke: a small scale clinical trial using laser dopplerflowmetry and computational modeling of vasomotion. Front. Physiol. 8:160.doi: 10.3389/fphys.2017.00160
Gutierrez, M., De Angelis, R., Bertolazzi, C., and Grassi, W. (2010).Capillaroscopic scleroderma-like pattern in patients without connectivetissue disorders. Rheumatology 49, 1994–1996. doi: 10.1093/rheumatology/keq172
Herrick, A., and Clark, S. (1998). Quantifying digital vascular disease in patientswith primary Raynaud’s phenomenon and systemic sclerosis. Ann. Rheum. Dis.57, 70–78. doi: 10.1136/ard.57.2.70
Johnson, J. M., and Proppe, D. W. (2011). “Cardiovascular adjustments to heatstress,” in Comprehensive Physiology, ed. R. Terjung (New York, NY: Wiley),215–243.
Karuranga, S., Da Rocha Fernandes, J., Huang, Y., and Malanda, B. (eds) (2017).IDF Diabetes Atlas, 8th Edition. Brussels: International Diabetes Federation.
Kellogg, D. L. J., Zhao, J. L., and Wu, Y. (2009). Roles of nitric oxide synthaseisoforms in cutaneous vasodilation induced by local warming of the skin andwhole body heat stress in humans. J. Appl. Physiol. 107, 1438–1444. doi: 10.1152/japplphysiol.00690.2009
Kerekes, G., Soltész, P., Nurmohamed, M. T., Gonzalez-Gay, M. A., Turiel, M.,Végh, E., et al. (2012). Validated methods for assessment of subclinicalatherosclerosis in rheumatology. Nat. Rev. Rheumatol. 8, 224–234. doi: 10.1038/nrrheum.2012.16
Kolluru, G. K., Bir, S. C., and Kevil, C. G. (2012). Endothelial dysfunction anddiabetes: effects on angiogenesis, vascular remodeling, and wound healing. Int.J. Vasc. Med. 2012:918267. doi: 10.1155/2012/918267
Krupatkin, A. I. (2006). The influence of the sympathetic innervation on the skinmicrovascular tone and blood flow oscillations. Hum. Physiol. 32, 584–592.doi: 10.1134/S0362119706050136
Krupatkin, A. I. (2008). Cardiac and respiratory oscillations of the blood flowin microvessels of the human skin. Hum. Physiol. 34, 323–329. doi: 10.1134/S0362119708030092
Krupatkin, A. I., and Sidorov, V. V. (2013). Functional Diagnostics ofMicrocirculatory-Tissue Systems: Fluctuations, Information, Nonlinearity: aGuide for Doctors. Moscow: Librokom.
Kvandal, P., Stefanovska, A., Veber, M., Désirée Kvermmo, H., and ArvidKirkebøen, K. (2003). Regulation of human cutaneous circulation evaluatedby laser Doppler flowmetry, iontophoresis, and spectral analysis: importanceof nitric oxide and prostaglandines. Microvasc. Res. 65, 160–171. doi: 10.1016/S0026-2862(03)00006-2
Frontiers in Physiology | www.frontiersin.org 14 April 2019 | Volume 10 | Article 416
fphys-10-00416 April 14, 2019 Time: 11:9 # 15
Zherebtsova et al. Multimodal Optical Diagnostics
Makovik, I. N., Dunaev, A. V., Dremin, V. V., Krupatkin, A. I., Sidorov, V. V.,Khakhicheva, L. S., et al. (2017). Detection of angiospastic disorders in themicrocirculatory bed using laser diagnostics technologies. J. Innov. Opt. HealthSci. 11:1750016. doi: 10.1142/S179354581750016X
Meredith, I. T., Currie, K. E., Anderson, T. J., Roddy, M. A., Ganz, P., and Creager,M. A. (1996). Postischemic vasodilation in human forearm is dependent onendothelium-derived nitric oxide. Am. J. Physiol. Heart Circ. Physiol. 270,H1435–H1440. doi: 10.1152/ajpheart.1996.270.4.H1435
Minson, C. T., Berry, L. T., and Joyner, M. J. (2001). Nitric oxide and neurallymediated regulation of skin blood flow during local heating. J. Appl. Physiol.91, 1619–1626. doi: 10.1152/jappl.2001.91.4.1619
Mizeva, I., Zharkikh, E., Dremin, V., Zherebtsov, E., Makovik, I., Potapova, E., et al.(2018). Spectral analysis of the blood flow in the foot microvascular bed duringthermal testing in patients with diabetes mellitus. Microvasc. Res. 120, 13–20.doi: 10.1016/j.mvr.2018.05.005
Mizeva, I. A., Makovik, I. N., Dunaev, A. V., Krupatkin, A. I., and Meglinski, I.(2017). Analysis of skin blood microflow oscillations in patients with rheumaticdiseases. J. Biomed. Opt. 22:70501. doi: 10.1117/1.JBO.22.7.070501
Murdaca, G., Colombo, B. M., Cagnati, P., Gulli, R., Spanò, F., andPuppo, F. (2012). Endothelial dysfunction in rheumatic autoimmune diseases.Atherosclerosis 224, 309–317. doi: 10.1016/j.atherosclerosis.2012.05.013
Murray, A. K., Herrick, A. L., and King, T. A. (2004). Laser Doppler imaging: adeveloping technique for application in the rheumatic diseases. Rheumatology43, 1210–1218. doi: 10.1093/rheumatology/keh275
Nakamura, K. (2011). Central circuitries for body temperature regulation and fever.Am. J. Physiol. Regul. Integr. Comp. Physiol. 301, R1207–R1228. doi: 10.1152/ajpregu.00109.2011
Peters, M. J. L., Symmons, D. P. M., Mccarey, D., Dijkmans, B. A. C., Nicola, P.,Kvien, T. K., et al. (2010). EULAR evidence-based recommendations forcardiovascular risk management in patients with rheumatoid arthritis and otherforms of inflammatory arthritis. Ann. Rheum. Dis. 69, 325–331. doi: 10.1136/ard.2009.113696
Rao, C. R., Miller, J. P., and Rao, D.C. (eds.) (2007). Handbook of Statistics 27:Epidemiology and Medical Statistics. Amsterdam: Elsevier.
Roustit, M., and Cracowski, J.-L. (2012). Non-invasive assessment of skinmicrovascular function in humans: an insight into methods. Microcirculation19, 47–64. doi: 10.1111/j.1549-8719.2011.00129.x
Schramm, J. C., Dinh, T., and Veves, A. (2006). Microvascular changes inthe diabetic foot. Int. J. Low. Extrem. Wounds 5, 149–159. doi: 10.1177/1534734606292281
Sell, D. R., Nagaraj, R. H., Grandhee, S. K., Odetti, P., Lapolla, A., Fogarty, J.,et al. (1991). Pentosidine: a molecular marker for the cumulative damageto proteins in diabetes, aging, and uremia. Diabetes Metab. Rev. 7, 239–251.doi: 10.1002/dmr.5610070404
Sena, C. M., Pereira, A. M., and Seiça, R. (2013). Endothelial dysfunction – A majormediator of diabetic vascular disease. Biochim. Biophys. Acta 1832, 2216–2231.doi: 10.1016/j.bbadis.2013.08.006
Smolen, J. S., Landewé, R., Bijlsma, J., Burmester, G., Chatzidionysiou, K.,Dougados, M., et al. (2017). EULAR recommendations for the managementof rheumatoid arthritis with synthetic and biological disease-modifyingantirheumatic drugs: 2016 update. Ann. Rheum. Dis. 76, 960–977. doi: 10.1136/annrheumdis-2016-210715
Söderström, T., Stefanovska, A., Veber, M., and Svensson, H. (2003). Involvementof sympathetic nerve activity in skin blood flow oscillations in humans. Am.J. Physiol. Heart Circ. Physiol. 284, H1638–H1646. doi: 10.1152/ajpheart.00826.2000
Spott, T., Svaasand, L. O., Anderson, R. E., and Schmedling, P. F. (1997).Application of opticaldiffusion theory to transcutaneous bilirubinometry. SPIEEuropto Series 3195, 234–245.
Stefanovska, A., Bracic, M., and Kvernmo, H. D. (1999). Wavelet analysis ofoscillations in the peripheral blood circulation measured by laser Dopplertechnique. IEEE Trans. Biomed. Eng. 46, 1230–1239. doi: 10.1109/10.790500
Stephens, D. P., Charkoudian, N., Benevento, J. M., Johnson, J. M., and Saumet,J. L. (2001). The influence of topical capsaicin on the local thermal control ofskin blood flow in humans. Am. J. Physiol. Regul. Integr. Comp. Physiol. 281,R894–R901. doi: 10.1152/ajpregu.2001.281.3.R894
Stitt, A. W., He, C., Friedman, S., Scher, L., Rossi, P., Ong, L., et al. (1997).Elevated AGE-modified ApoB in sera of euglycemic, normolipidemic patients
with atherosclerosis: relationship to tissue AGEs. Mol. Med. 3, 617–627.doi: 10.1007/BF03401819
Takahashi, M., Hoshino, H., Kushida, K., and Inoue, T. (1995). Directmeasurement of crosslinks, pyridinoline, deoxypyridinoline, and pentosidine,in the hydrolysate of tissues using high-performance liquid chromatography.Anal. Biochem. 232, 158–162. doi: 10.1006/abio.1995.0002
Tan, K. C. B., Chow, W.-S., Ai, V. H. G., Metz, C., Bucala, R., and Lam, K. S. L.(2002). Advanced glycation end products and endothelial dysfunction in type 2diabetes. Diabetes Care 25, 1055–1059. doi: 10.2337/diacare.25.6.1055
Terada, K., Miyai, N., Maejima, Y., Sakaguchi, S., Tomura, T., Yoshimasu, K.,et al. (2007). Laser doppler imaging of skin blood flow for assessing peripheralvascular impairment in hand-arm vibration syndrome. Ind. Health 45, 309–317.doi: 10.2486/indhealth.45.309
Thangarajah, H., Yao, D., Chang, E. I., Shi, Y., Jazayeri, L., Vial, I. N., et al.(2009). The molecular basis for impaired hypoxia-induced VEGF expressionin diabetic tissues. Proc. Natl. Acad. Sci. U.S.A. 106, 13505–13510. doi: 10.1073/pnas.0906670106
Thoresen, M., and Walløe, L. (1980). Skin blood flow in humans as a function ofenvironmental temperature measured by ultrasound. Acta Physiol. Scand. 109,333–341. doi: 10.1111/j.1748-1716.1980.tb06604.x
Vanggaard, L., Kuklane, K., Holmer, I., and Smolander, J. (2012). Thermalresponses to whole-body cooling in air with special reference to arteriovenousanastomoses in fingers. Clin. Physiol. Funct. Imaging 32, 463–469. doi: 10.1111/j.1475-097X.2012.01151.x
Vanhoutte, P. M., Shimokawa, H., Feletou, M., and Tang, E. H. C. (2015).Endothelial dysfunction and vascular disease – a 30th anniversary update. ActaPhysiol. 219, 22–96. doi: 10.1111/apha.12646
Wallace, M. B., Wax, A., Roberts, D. N., and Graf, R. N. (2009). Reflectancespectroscopy. Gastrointest. Endosc. Clin. N. Am. 19, 233–242. doi: 10.1016/j.giec.2009.02.008
Xi, L., Chow, C.-M., and Kong, X. (2016). Role of tissue and systemic hypoxia inobesity and type 2 diabetes. J. Diabetes Res. 2016:1527852. doi: 10.1155/2016/1527852
Ye, Y., and Griffin, M. J. (2016). Assessment of two alternative standardisedtests for the vascular component of the hand–arm vibration syndrome(HAVS). Occup. Environ. Med. 73, 701–708. doi: 10.1136/oemed-2016-103688
Yildiz, M. (2010). Arterial distensibility in chronic inflammatoryrheumatic disorders. Open Cardiovasc. Med. J. 4, 83–88. doi: 10.2174/1874192401004020083
Zherebtsov, E. A., Zherebtsova, A. I., Doronin, A., Dunaev, A. V., Podmasteryev,K. V., Bykov, A., et al. (2017). Combined use of laser doppler flowmetry and skinthermometry for functional diagnostics of intradermal finger vessels. J. Biomed.Opt. 22:40502. doi: 10.1117/1.JBO.22.4.040502
Zherebtsova, A. I., Zherebtsov, E. A., Dunaev, A. V., Podmasteryev, K. V., Koskin,A. V., and Pilipenko, O. V. (2017). A method and a device for diagnostics of thefunctional state of peripheral vessels of the upper limbs. Biomed. Eng. 51, 46–51.doi: 10.1007/s10527-017-9682-y
Zherebtsova, A. I., Zherebtsov, E. A., Dunaev, A. V., Podmasteryev, K. V.,Pilipenko, O. V., Krupatkin, A. I., et al. (2015). “Study of the functionalstate of peripheral vessels in fingers of rheumatological patientsby means of laser Doppler flowmetry and cutaneous thermometrymeasurements,” in Proceedings of the. SPIE 9917, Saratov Fall Meeting2015: third International Symposium on Optics and Biophotonics andSeventh Finnish-Russian Photonics and Laser Symposium (PALS),(Saratov: Russian Federation).
Conflict of Interest Statement: The authors declare that the research wasconducted in the absence of any commercial or financial relationships that couldbe construed as a potential conflict of interest.
Copyright © 2019 Zherebtsova, Dremin, Makovik, Zherebtsov, Dunaev, Goltsov,Sokolovski and Rafailov. This is an open-access article distributed under the termsof the Creative Commons Attribution License (CC BY). The use, distribution orreproduction in other forums is permitted, provided the original author(s) and thecopyright owner(s) are credited and that the original publication in this journalis cited, in accordance with accepted academic practice. No use, distribution orreproduction is permitted which does not comply with these terms.
Frontiers in Physiology | www.frontiersin.org 15 April 2019 | Volume 10 | Article 416