multinationals and anti-sweatshop · pdf file1 multinationals and anti-sweatshop activism ann...
TRANSCRIPT

1
Multinationals and Anti-Sweatshop Activism
Ann Harrison and Jason Scorse*
During the 1990s, anti-sweatshop activists campaigned to improve conditions for workers in developing countries. This paper analyzes the impact of anti-sweatshop campaigns in Indonesia on wages and employment. Identification is based on comparing the wage growth of workers in foreign-owned and exporting firms in the textiles, footwear, and apparel sectors before and after the initiation of anti-sweatshop campaigns. We find that anti-sweatshop campaigns led to large real wages increases for targeted enterprises. There were some costs in terms of reduced investment, falling profits, and increased probability of closure for smaller plants, but we fail to find significant effects on employment. *Ann Harrison (Corresponding author), Professor, Department of Agricultural and Resource Economics, 329 Giannini Hall, UC Berkeley 94720, [email protected]. Jason Scorse, Assistant Professor, Graduate School of International Policy Studies, Monterey Institute of International Studies, 460 Pierce St., Monterey, CA 93940, [email protected]. The authors would like to thank Garrick Blalock for generously sharing his data and expertise on Indonesia. The authors would also like to thank Jeff Ballinger, Teri Caraway, David Card, Kimberly Elliott, David Lee, Sylvie Lambert, Dara O’Rourke, Sandra Spolaski, seminar participants at DELTA, Georgetown, UC Davis, INSEAD, PPIC, the World Bank, UC Berkeley and Yale, and especially the editor and two anonymous referees for very useful suggestions.

2
Anti-sweatshop campaigns increased dramatically in the 1990s. These campaigns took different
forms: direct pressure to change legislation in developing countries, pressure on firms, newspaper
campaigns, and grassroots organizing. Activists targeted multinational firms in textiles, footwear, and
apparel sectors and helped spread consumer boycotts throughout college campuses. Yet there has been
almost no academic research that analyzes precisely how these anti-sweatshop campaigns affected the
very workers they were designed to assist.
This paper examines the impact of anti-sweatshop activism on labor market outcomes in
Indonesia. Indonesia makes an ideal case study because it was the focus of campaigns introduced in the
1990s to improve conditions for workers. The pressure took several forms. The United States threatened
to withdraw special tariff privileges for Indonesian exports if Indonesia failed to address human rights
issues. The Indonesian government responded by making minimum wage increases a central component
of its labor market policies in the 1990s.1 The nominal minimum wage quadrupled and the real value of
the minimum more than doubled between 1989 and 1996.2 Indonesia was also the target of consumer
awareness campaigns waged against companies such as Nike, Adidas, and Reebok. As a result of activist
pressure, these firms were induced to sign codes of conduct pledging them to raise wages and improve
working conditions in factories producing their products.
We identify the impact of anti-sweatshop campaigns on wages through two approaches. First, we
compare wage growth in textile, footwear, and apparel plants (referred hereafter as TFA plants) relative to
wage growth in the rest of manufacturing. We restrict the treatment group to foreign-owned or exporting
TFA factories. Second, we exploit geographic variation in the anti-sweatshop movement within the TFA
sector in Indonesia. The anti-sweatshop campaign in Indonesia targeted contractors for Nike, Reebok, and
Adidas. Consequently, we compare the real wage growth of TFA plants in districts with contractors
working for Nike, Reebok, and Adidas, relative to TFA plants in other districts. The advantage of this
1 For a discussion of the role of minimum wages in Indonesia, see SMERU Research Institute (2001) or Rama (1996). 2 See Appendix Table 1 for trends in the minimum wage.

3
second approach to identification is that it controls for any changes that affected the TFA sector as a
whole.
To measure the impact of the anti-sweatshop movement, we use a difference-in-difference
methodology, comparing wages before and after the advent of the anti-sweatshop campaigns. Both
approaches indicate that targeted plants increased real wages in response to activist pressure. Compared
to non-TFA plants, foreign-owned and exporting TFA firms increased real wages 10 to 20 percent across
all of Indonesia (Table 2). Comparing wage growth in districts targeted by activists relative to other
districts, the effects are even larger. Real wages increased as much as 30 percent in large foreign-owned
and exporting TFA plants relative to other TFA plants (Table 3). Most of these wage increases are due to
higher compliance with minimum wages on the part of targeted plants.
One question which arises is whether such large real wage increases led to higher unemployment.
Our estimates suggest that there were large, negative effects of the minimum wage increases on aggregate
manufacturing employment. The coefficient on the minimum wage indicates that a ten percent increase
in the real minimum wage reduces production worker employment by 1.2 percent. However, we fail to
find significant negative effects on employment of the additional wage increases at targeted TFA plants.
Employment growth in the TFA sector exceeded growth in other sectors during the sample time period.
Although TFA plants increased wages in large part by increasing compliance with minimum wages,
greater compliance was not associated with additional employment losses relative to non-TFA plants.
One explanation for why the short-run employment costs of the anti-sweatshop campaigns are
difficult to identify is that TFA plants had the flexibility to adjust to higher wages along other dimensions.
Some plants exited the sector; small exporters in regions targeted by activists were more likely to close.
Across all TFA plants, profits fell relative to other sectors. Profit declines were largest in the districts
targeted by anti-sweatshop activities. It appears that the anti-sweatshop movement resulted in a type of
forced profit sharing, where higher wages for TFA workers were financed largely through lower returns
to capital.

4
Our results are robust to a range of alternative specifications. We include controls for
confounding factors that are likely to be correlated with wage growth, including changes in plant size, the
educational attainment of the workforce, region-specific variation in minimum wage changes, foreign-
ownership, export status, investments in technology, productivity growth, different initial wage levels,
differences in output growth, and changes in profitability.3 We also contrast the changes in wages for
unskilled (production) workers with those for skilled (non-production) workers, whose wages generally
exceeded the statutory minimum. Finally, we show that wages in foreign-owned and exporting firms in
our treatment districts, but outside of the TFA sectors, were not affected.
The remainder of the paper is organized as follows. In Section II, we outline the development of
anti-sweatshop campaigns, discuss the identification strategy, and set up a framework for estimation. We
present results on wages in Section III. Section IV examines the impact of anti-sweatshop activism on
employment, profits, investment, plant entry and exit, and explores the extent to which the results reflect
different degrees of compliance with minimum wage laws. Section V concludes.
I. Background, Identification Strategy, and Framework for Estimation
A. Background
The roots of the anti-sweatshop campaign in Indonesia can be traced to a 1989 study
commissioned by the U.S. Agency for International Development. The study, carried out by the Asian
American Free Labor Institute-Indonesia under the direction of Jeff Ballinger, discovered that of all the
factories that produced goods for the export sector, plants that manufactured for Nike paid the lowest
wages.4 Organizations such as Global Exchange, Press for Change (founded by Ballinger), and the
National Labor Committee used the momentum generated from the increasing mainstream media
3 Some robustness tests, such as those controlling for initial wages or adding profit margins, are only reported in the working paper version of this article, available online at the AER website or from the author’s website. 4 In 1992 Ballinger’s work appeared in Harper’s Magazine in a short piece entitled, “The New Free-Trade Hell: Nike’s profits jump on the backs of Asian workers,” and in 1993 CBS featured Ballinger in a report about poor working conditions in Asian factories.

5
attention on poor factory conditions in Nike plants to create an international campaign against sweatshop
conditions in factories contracting for Nike, and to a lesser extent, Adidas and Reebok.5
The campaign against Nike’s contractors in the early 1990s focused almost exclusively on
Indonesia. One major reason is that much of the research documenting poor working conditions and low
minimum wage compliance was completed by Jeff Ballinger while working for the AFL-CIO in
Indonesia; no comparable work was carried out in China (currently the site of the largest number of Nike
contractors). In addition, significant anger was directed against the foreign (primarily East-Asian) owners
of these sub-contracting factories within Indonesia. The relatively more open political atmosphere
(compared to China) also contributed to the ability of U.S. groups to work with local NGOs in Indonesia.
Nike established its own codes of conduct in 1992 in order to comply with labor standards and
establish living wages, but these practices were not fully implemented until 1995-1996.6 During this
period, non-governmental organizations (NGOs) maintained persistent and steady appraisals of working
conditions in and around Nike vendor factories in order to hold the company to account for the treatment
of its workers.
The campaign against Nike, Adidas, and Reebok in Indonesia was essentially a media campaign,
which operated (and continues to operate) through contacts with newspaper columnists, magazine writers,
TV shows, and other outlets. One way to gauge the extent of negative media exposure brought about by
the anti-sweatshop campaigns is to count the dramatic increase in the number of articles about sweatshops
and child labor that appeared in major international newspapers in the 1990s.7 There was a 300 percent
increase in the number of articles regarding child labor and the number of articles focusing on sweatshop
activities increased by more than 400 percent.
5 Coupled with media strategies, including ads that satirized Nike symbols and slogans (e.g. the “swooshtika” in place of the Nike “swoosh” symbol), the anti-sweatshop activists waged a public relations war against Nike and other big clothing retailers. The movement in the U.S. and Europe was assisted by electronic forums where young activists shared information and planned their campaigns. 6 See Murphy and Matthew (2001). 7 The trends in number of articles published about child labor and the anti-sweatshop campaigns discussed in this and the following paragraph are described in more detail in the working paper version of this article, available online at the AER website or from the author’s website. We graph both the number as well as the proportion of articles devoted to the anti-sweatshop movement. Our list of “Major US and World Publications” is available on the website for Lexis-Nexis. Examples include the New York Times, Business Week, The Economist, Newsweek, The Boston Globe, The Times (London), The Christian Science Monitor, The Herald (Glasgow), The Washington Post, Hong Kong Standard, etc. We also

6
If we restrict the analysis to articles about sweatshops in Indonesia alone, the trends are very
similar. The ratio of the number of articles on sweatshops or child labor relative to articles on general
economic issues on Indonesia in major world newspapers increased from zero to a high of ten percent of
all articles at the peak in 1996. In 1997 there was an increasing shift in focus towards the financial crisis,
which erupted at the end of 1997. Interest in child labor and sweatshop labor fell in the late 1990s—at
least relative to other issues of economic interest—but has been increasing again in the last several years.8
While previous studies do not directly address the impact of anti-sweatshop activism on wages,
an excellent overview of foreign ownership and wages can be found in Drusilla K. Brown, Alan V.
Deardorff, and Robert M. Stern (2004).9 A discussion of the links between trade and labor standards is
provided by Brown (2001). Other related work includes Eric V. Edmonds and Nina Pavcnik (2001), who
explore how rice prices affected the use of child labor in Vietnam.10 Previous work has also examined the
rationale for labor standards, as well as the determinants of ratification of ILO conventions. 11
B. Identification and Framework for Estimation
Our identification strategy is two-fold. First, anti-sweatshop activism in Indonesia was uniquely
focused on firms in the TFA sectors. Consequently, we begin by comparing real wage growth in those
sectors versus other sectors, paying particular attention to the foreign-owned and exporting firms most
analyzed the trends for US newspapers alone, available from the authors upon request. The trends are very similar whether we restrict the analysis to US newspapers or use all major international sources. 8 Why did interest in these issues increase so rapidly in the mid 1990s? In 1996-1997, there were a series of high profile exposes on Nike, Gap, Wal-Mart, Disney and others. For instance, in the second quarter of 1996 the Kathie Lee Gifford sweatshop scandal was highlighted in the news. These exposes were picked up by student movements on campuses. Student groups staged protests and sit-ins and subsequently kept these issues in the news, and contributed to the creation of groups designed to respond to sweatshop problems. The convergence of high profile exposes, student activism, and the creation of new groups designed to address anti-sweatshop concerns fueled the increase in newspaper coverage. Post-1996, the shift in focus towards the Asian financial crisis contributed to a decline in interest in these issues. The student movement also weakened and moved on to other issues. This section has benefited greatly from discussions with Kimberly Elliott, Dara O’Rourke, and Sandra Spolaski. 9 For an early paper showing that foreign-owned enterprises in developing countries are more likely to pay higher wages than comparable domestically-owned enterprises, see Aitken, Harrison and Lipsey (1997) 10 Edmonds and Pavcnik find that in rural areas, where most people are both rice producers and consumers, the income effect of higher rice prices has greatly outweighed the higher opportunity costs of not employing children in the work force, and therefore child labor has declined significantly. However, in urban areas, where families are only rice consumers, the effects of the rice exports on price has led to increases in child labor since urban incomes have declined. Since Vietnam is predominantly rural, the overall effect has been a decline in child labor. 11 Chau and Kanbur (2001) postulate that if ratification of these conventions was costless, or if the benefits greatly outweighed the costs, one would expect complete compliance across countries. Given that this is not the case, Chau and Kanbur investigate the determinants of signing. They find little evidence that variables predicted by standard economic theory— such as per capita gross domestic product (GDP), degree of openness to trade, or average education—are determining factors, but rather that countries with higher domestic standards have a higher probability of adoption. Maskus (1996) refutes the argument that a lack of international standards has led to significant erosion of low-skilled wages in developed countries, or is a significant determinant of trade performance and foreign direct investment throughout the developing world.

7
likely to act as suppliers or contractors.12 Real wages are calculated by deflating the nominal wage by the
CPI, where the CPI is equal to 100 in 1996.
Our second treatment exploits the fact that anti-sweatshop activists in Indonesia concentrated on
contractors for the three most highly visible retailers: Nike, Adidas, and Reebok. While Nike, Adidas,
and Reebok did not take equity positions in their contractors, they did source heavily from foreign-owned
and exporting firms whose owners came from other parts of Asia, including Korea, Taiwan, and Japan.
Nike’s primary mode of operation was (and continues to be) through arms-length contracts.
Unfortunately, confidentiality restrictions do not permit us to identify the actual contractors in the census
data (since firm names are withheld in the Indonesian census data made available to researchers). Instead,
we have identified likely contractors using census data on foreign-ownership, export status, and district of
operation. Using information released by all three companies regarding the locations of their contractors
in Indonesia, we have identified the districts in which companies targeted by activists operated in the
1990s. Consequently, our second approach compares the changes in wages and employment in TFA
plants in regions with Nike, Adidas, and Reebok contractors, relative to other regions.
One important limitation is that our list of vendors for Nike, Adidas, and Reebok (available from
the authors upon request) is from 2004. Since the vendor list is more recent than our census data, there
could be a selection bias in our identification of treatment districts. It is difficult to sign the direction of
the bias, since it is equally likely that only the pro-worker or anti-worker vendors have survived.
However, by matching the names of enterprises described in newspaper accounts of sweatshops in
Indonesia with names that appeared in the 2004 list of Nike vendors, we have been able to verify that
many of the companies initially accused of the worst exploitation are still operating in Indonesia.
A proper framework for evaluating a firm’s decision to raise wages in the context of anti-
sweatshop activism would take into account both the costs and benefits of setting wages above the
market-clearing level. In a competitive market with no external pressures, a worker’s wages are set equal
12 Our analysis is focused on real wages; we only refer to nominal wages to contrast the two since inflation was high during the 1990s.

8
to the value of their marginal product. This implies that if log real wages are given by w, the log product
price is p, the marginal product of labor is given by the partial derivative of output (Y) relative to labor
input (L), worker or region-specific characteristics are captured by the vector Z, then a standard log-linear
reduced form wage equation for an establishment i in region r at time t is given by:
logwirt = a1 + a2logpirt + a3log(!Y/!L)irt + "4Zirt +rrt + fi + eit (1)
Since there are likely to be a number of establishment-specific effects (fi) as well as time-varying
regional effects (rrt) that are unobserved, we will estimate (1) in differences, thus eliminating the
establishment-level fixed effects but not the regional effects which are allowed to vary over time. We
model the costs and benefits of setting wages above the market-clearing level as a function of G(u,F)it
where G represents a markup over competitive wages and is a positive function of the probability of
exposure by activists (!) and any official sanctions F associated with violating labor market regulations.
G could, for example, measure the costs in terms of foregone sales or lost contracts due to negative
publicity if the firm failed to adhere to minimum wages. This yields the following equation:
dlogwirt = a2dlogpirt + a3dlog(!Y/!L)irt + "4dZirt + G(u,F)it +r’rt + e’it (2)
Clearly, not all firms face the same probability of detection or the same penalties associated with
operating sweatshop factories; only those with high probability of detection u or costly penalties
associated with detection F are likely to change their wage-setting behavior.
As human rights activism and anti-sweatshop organizations proliferated, the probability of
detection and the penalty for paying low wages or failing to adhere to the minimum wage increased,
particularly for firms with high visibility such as large multinationals or well-established exporters. We
allow the treatment to vary with both export status and foreign-ownership, defined prior to treatment at
the beginning of the sample period. We define export status EXP and foreign-ownership FOR as dummy

9
variables equal to one if the establishment exported 10 percent or more of its output or had 10 percent or
more foreign-ownership in 1990 and continued to do so over the entire sample period.
We explore two alternative treatments. We alternatively define TREATMENT as equal to one if
one of the following is true:
(1) The plant was in a TFA sector at the beginning of the period
(2) The plant operated in a district that had contractors for Nike, Reebok, or Adidas.
Allowing the impact of activism to vary depending on whether the contractor is a foreign-owned
or exporting enterprise leads to the following specification for G(F,u) :
G(F,u)=b1EXPit0+b2FORit0+b3TREATMENTit0+b4(EXP*TREATMENT)it0+b5(FOR*TREATMENT) it0
Consequently, introducing deviations from competitive wage setting due to activism leads to:
dlogwirt = a2dlogpirt + a3dlog(!Y/!L)irt + "4dZirt + b1EXPit0 + b2FORit0+ b3TREATMENT it0 +
b4(EXP*TREATMENT) it0 +b5(FOR*TREATMENT it0)+ rrt +e’it (3)
Equation (3) is essentially a difference-in-difference approach to estimating the impact of anti-sweatshop
campaigns on wage outcomes. We regress log change in real wages (with 1996 as the base year) between
1990 and 1996 on a number of determinants, and then test whether there is any difference for our two
treatment groups. Since firms that sub-contracted for the major TFA multinationals were typically either
foreign-owned or export-oriented or both, we focus primarily on the interaction terms b4 and b5.
We include controls for a number of potentially confounding determinants of the observed wage
changes. We control for price changes using changes in log output and profitability at the level of the
individual establishment. Factors which affect the marginal product of labor are also included in the

10
estimation, including changes in capital stock, changes in material inputs, technology expenditures, total
factor productivity growth, and changes in firm size, defined as the change in the total number of
employees. Other components of the vector dZ include changes in worker characteristics (specifically
education levels) and changes in the statutory minimum wage.
To give the reader an idea of the importance of TFA enterprises for manufacturing employment
in Indonesia in the 1990s, Figure 1 shows the share of TFA employees in total production worker
employment. Employment in the TFA sector as a share of total production worker employment increased
from 25 percent to 35 percent during the period. The percentage of production workers in foreign-owned
TFA plants rose from 2 percent to over 5 percent, while the percentage of production workers in TFA
exporting plants increased from 5 to nearly 20 percent. Figure 1 shows that TFA plants employed a major
share of production workers in the manufacturing sector in Indonesia.
II. Wages and Anti-Sweatshop Activism in Indonesia
A. Data Summary
The data for this analysis comes from the annual manufacturing survey of Indonesia collected and
compiled by the Indonesian government’s statistical agency BPS (Badan Pusat Statistik). The completion
of this survey is mandatory under Indonesian law for firms with more than 20 employees. The number of
observations ranges from approximately 13,000 in 1990 to over 18,000 in 1999. Over the ten year period
there is an average of 4.5 observations per establishment, reflecting either plant closings or changing
reporting requirements.
We begin by reporting mean real wages in (in 1,000’s of 1996 Rupiahs) for the manufacturing
sector in 1990 and 1996 in the first two rows of Table 1A. We focus on this seven-year period because
information on export orientation was not collected before 1990, and the financial crisis which erupted in

11
1997 makes any evaluations post-1996 problematic.13 We define the plant’s average wage for both
production and non-production workers as basic compensation (salary) by type of worker, divided by the
number of workers in that skill category. For the remainder of the analysis, we focus almost exclusively
on production worker wages, which we use as our measure of unskilled wages.
Based on an exchange rate of about 2,000 rupiahs to the dollar, real annual wages for TFA and
non-TFA domestic plants at the onset of the sample period averaged approximately 550 US dollars. If we
compare columns (1) and (4), we see that wages in non-exporting, domestically owned plants were
remarkably similar at the onset of the sample period. Between 1990 and 1996, average annual production
worker wages in both TFA and non-TFA domestic enterprises increased by about 200 US dollars.
However, at the onset of the sample period both foreign-owned and exporting TFA enterprises
paid their unskilled workers significantly less than other enterprises. In 1990, a comparison of columns
(2) and (5) shows that workers in foreign-owned TFA plants were paid half as much as workers at other
foreign-owned plants. In the first row, comparing columns (3) and (6) indicates that exporters in TFA
plants paid their workers 30 percent less than in other exporting plants. These large differences were one
factor that contributed to the focus of anti-sweatshop activists on workers in the TFA sector.
One question which naturally arises is why these workers were paid so little. While one
explanation could be the low level of skill of these workers, the regressions in the remainder of the paper
control for the observed skill composition of workers in each establishment, and firm-level fixed effects
control for unobserved skill differences which remain constant over time. An important consideration
which could explain the wage differences is the high concentration of female production workers in these
sectors. Three of the five most female-intensive sectors (with female production workers accounting for
50 percent or more of total production workers) in Indonesian manufacturing in 1995 were textiles,
footwear, and apparel.14 Even in the United States, Joeseph G. Altonji and Rebecca M. Blank (1999)
13 Nevertheless, we have experimented with adding 1997 and show that the main results presented in Tables 2 and 3 are robust to extending the sample. These results are available from the authors upon request. 14 In Indonesia, the share of female workers in the census is highly inversely correlated with wages. These results are available from the authors upon request.

12
review the existing evidence and report that female-dominated occupations pay significantly less, after
accounting for all observable worker characteristics.
By 1996, the wage gap between exporting and foreign-owned TFA and exporting and foreign-
owned non-TFA plants had narrowed considerably. In 1996, the difference in wages between exporting
TFA and exporting non-TFA plants amounted to only 46,000 rupiahs (23 dollars) per employee per year.
The difference—computed in the last column of Table 1A—is not statistically significant. The gap
between wages in foreign-owned TFA enterprises and foreign-owned non-TFA firms also narrowed, but
by less: foreign-owned non-TFA establishments continued to pay 1,529 thousand rupiahs or 750 dollars
more per worker in total salary in 1996 (second row, column (8)) than foreign-owned TFA firms. The
trends in Table 1A suggest that the wage benefits from anti-sweatshop activism were limited to workers
in export-oriented or foreign-owned plants.
Rows (3) and (4) of Table 1A report wage growth from 1990 to 1996 in levels; rows (5) and (6)
report the wage growth in logs. The difference-in-difference—the difference in wage growth across TFA
and non-TFA plants—is reported in the last three columns of Table1A. The results show that wage
increases for TFA workers were significantly higher in exporting and foreign-owned establishments.
Again, the only exception is for workers in domestically-owned plants selling only locally: in these
plants, wages for TFA workers increased by 7 percentage points less than for unskilled workers in other
sectors. The difference-in-difference between foreign or exporter wage growth in the TFA and non-TFA
sectors is reported in the last two rows and last two columns of Table 1A. Across all plants, exporting
and foreign TFA plants increased real wages by 21 to 27 percent more than other plants. For the balanced
panel, the wage increase for foreign or exporting plants relative to non-TFA plants is between 14 and 19
percent.
To summarize, the trends presented in Table 1A indicate very different patterns of wage growth
for TFA plants in the 1990s. While production workers in most exporting and foreign-owned plants
generally received smaller wage increases than the rest of the manufacturing labor force in the 1990s, the

13
opposite was true for workers in TFA factories. In foreign-owned and exporting TFA plants, unskilled
wages grew 30 to 40 percent in real terms between 1990 and 1996.
Tables 1B&C examine differences in the two treatment groups and the control groups prior to the
onset of the anti-sweatshop movement. We test the difference in means for 1988 through 1990 for wages,
size, profits, and growth in wages, productivity, and output. The pre-treatment period is short due to data
limitations prior to 1988; nevertheless, performing the same tests on wages, size, and output for 1984
through 1989 yielded similar results. Size is defined as total number of employees. Profitability is
defined as value-added less wages as a share of value-added. Total factor productivity growth is defined
as the log change in output less the weighted changes in inputs, where inputs include production and non-
production workers, materials, and capital stock. The weights are equal to an average of the shares of each
of the inputs in total costs in the current and last period. The capital share is the residual, computed after
subtracting the other factor shares and assuming constant returns to scale.
Table 1B provides t-tests of differences between the TFA sector and other non-TFA
manufacturing sectors of both foreign-owned and exporting firms. The results show that TFA
establishments paid lower wages and were larger than establishments in other sectors, but that initial
profits were not significantly different. Variables measured in changes—including log changes in wages,
production workers, material inputs, capital stock, and total factor productivity growth (defined below)
were not significantly different. There are no significant differences between the control and treatment
groups when wages, output, inputs (including production workers) and productivity are measured in
changes. Since the difference-in-difference methodology used in the paper to identify treatment effects
relies on changes rather than levels, the fact that there are no statistically significant differences between
the treatment and control groups when examining growth rates between 1988 and 1990 is reassuring.
Table 1C reports the results of t-tests when the treatment is TFA enterprises in districts with Nike,
Reebok, and Adidas contract establishments (our second treatment group) versus TFA enterprises in other
districts (our second control group), again examining both foreign-owned and exporting firms separately.
As expected, differences between the treatment and control group are even smaller when we compare

14
different sets of firms within the same manufacturing sub-sector. Although treatment firms paid
significantly lower wages prior to the onset of the anti-sweatshop movement than the control group, they
were similar in size and earned almost identical profits prior to treatment. In changes, the differences
between treatment and control groups are never statistically significant, whether we examine wage
growth, output growth, production worker growth, material inputs, capital stock, or productivity growth.
B. Main Results
None of the tests of mean differences in Table 1A control for differences in plant characteristics.
We address this shortcoming in Tables 2 and 3, which present the main results of the paper. Table 2
presents the results of estimating equation (3), with TREATMENT defined as belonging to the TFA
sector. The dependent variable is the change in the log wage between 1990 and 1996. The first column
of Table 2 reports coefficient estimates when we include only ownership dummies for foreign-ownership,
export orientation, and participation in the treatment group, the minimum wage, and interactions between
TREATMENT, foreign-ownership, and export orientation. The minimum wage is defined as the log of
the minimum wage in the district where the plant operated in 1996 less the log of the minimum wage in
1990. If that difference is negative, indicating that the minimum wage was not binding in 1990, then the
minimum wage is set at zero. This definition of minimum wage changes allows the impact of increases in
the minimum wage to be nonlinear, with a zero impact on the firm’s wage if the minimum wage is not
binding and an expected log-linear impact if the minimum wage is binding.15
The results are consistent with the difference-in-difference presented in Table 1A; while wages in
most foreign-owned or exporting plants did not increase faster than in other plants, TFA establishments
were the exception. The coefficient on TREATMENT for foreign-ownership or exporting enterprises is
very similar: .106 for foreign and .119 for exporting. Controlling for the impact of minimum wage
changes, the results suggest that production worker wages in foreign-owned or exporting TFA plants
grew 10.6 to 11.9 percent faster than in other plants.

15
Column (2) in Table 2 adds a number of controls to the basic specification. Plant controls include
log changes between 1990 and 1996 in real material inputs and capital stock, plant size, region controls,
total factor productivity growth, technology expenditures, and output growth. The results in column (2)
also include details on educational attainment for employees at the individual plant (reported in the years
1995 through 1997 and averaged in our estimation across all three years). For production workers, the
annual survey reports number of both male and female workers who have had no school, some primary
school, junior high school, senior high school, and college. The addition of plant characteristics and
educational attainment of the workers does not change the magnitude or significance of the coefficients
on Foreign*TREATMENT and exporting*TREATMENT, which are now .124 and .110 respectively.
These additional controls allow us to reject alternative explanations for the increase in wages for foreign-
owned enterprises, such as the fact that foreign owners may have invested in plants with higher
productivity growth, higher output growth, or better trained workers.
Since the point estimates for foreign*TREATMENT and exporting*TREATMENT are very
close, in column (3) we combine foreign-ownership and exporting status into one variable, FOREXP.
Most foreign-owned enterprises in Indonesia exported a majority of their output, so it is difficult to
separately identify the impact of foreign-ownership and export status on wage growth. The remaining
specifications in Table 2 combine foreign-ownership and export status, although the results are not
dependent on doing so. Column (4) tests whether the results are sensitive to excluding plants whose
primary product is textiles and retaining only plants producing apparel and footwear. The point estimate
on FOREXP in column (4) is now .097, which suggests that wages for unskilled workers in this sector
increased by 9.7 percentage points more than in other sectors, after controlling for worker and plant
characteristics.
In columns (1) through (4) we include the minimum wage as a control. However, both the
decision to comply with the minimum wage and its actual level could be considered endogenous. Later in
15 In the dataset, 73 percent of plants had average wage levels below the 1996 regional minimum wage in 1990; for these plants, the real

16
the paper we explore the determinants of compliance with the minimum wage as a function of anti-
sweatshop activism. In Appendix Tables 2A&B, we show that minimum wage levels in Indonesia during
the sample period were highly correlated with the consumer price index (CPI), lagged wages in the
previous period, and low export shares. Appendix Tables 2A&B show that minimum wages were set at a
higher level in treatment districts with Nike, Reebok, and Adidas contractors. To address this possible
endogeneity, we eliminate the minimum wage as a control in column (5). Now the coefficient on
TREATMENT interacted with FOREXP is equal to .202, suggesting that the net effect of FOREXP and
higher compliance with the minimum wage was to increase real wages by 20.2 percent relative to other
sectors.
Columns (6) and (7) test whether firms cut non-wage benefits to offset the higher wages induced
by minimum wage changes and activist pressure. The results show that treatment firms did not. When
the dependent variable is non-wage benefits in column (6), the coefficient on FOREXP*TREATMENT is
close to zero and not significant. Column (7) reports the results when wages and non-wage benefits are
added together. Since wages account for most of the income for unskilled workers, the results are very
similar in magnitude to those reported in the first six columns. The coefficient estimate, equal to .096,
suggests that real wages and non-wage benefits increased by 9.6 percentage points more for TFA firms
than for other firms.
To demonstrate that the anti-sweatshop movement was primarily focused on unskilled workers, in
column (8) we use log wages for non-production workers as our dependent variable instead of production
wages. As indicated earlier, non-production workers are typically associated with skilled workers.
Since the anti-sweatshop movement focused on poorly paid workers we would expect the impact on
skilled workers to be small; this specification also allows us to test whether we are picking up spurious
effects of positive unobserved demand shocks. The results suggest that there was no significant impact of
minimum wage increased by 70 percent. For the remaining 27 percent of plants with initial wages above the 1996 minimum, the change in the minimum wage was set to zero. Across all plants, the average increase in the (real) minimum wage was 50 percentage points.

17
FOREXP*TREATMENT on non-production worker wage growth. The coefficient estimate is -.057 and
not statistically significant.
The coefficient on the minimum wage is also reported in Table 2. The coefficient is equal to .675
when all controls are added, which suggests that a 1 percent increase in the real value of the minimum
wage was associated with a .675 percent increase in the real unskilled wage. The coefficient is robust to
the addition of plant, worker, and region controls. We note that it is possible to add region controls
because the minimum wage is set at the more disaggregated district level. Given a 50 percentage point
increase in the constructed minimum wage facing the sample firms (see footnote 15), the coefficient
implies that minimum wage increases were associated with a 34 percent increase in real wages.
In Table 3, the sample includes only TFA plants and TREATMENT is defined as being located in
districts with Nike, Adidas, or Reebok contractors. This smaller sample allows us to compare the
evolution of wages within the TFA sector across treatment and control districts—between those that were
the target of anti-sweatshop campaigns and those that were not. The coefficient on FOREXP alone is
generally negative and significant for large firms (those defined as having 100 or more employees),
indicating that on average foreign-owned or exporting enterprises had lower wage growth than other
firms. In addition, the coefficient on TREATMENT alone is also negative and significant for large firms,
indicating lower than average wage growth in the treatment districts. However, foreign-owned or
exporting enterprises in treatment districts—those enterprises targeted by the activists—exhibited
significantly higher wage growth. Large foreign-owned or exporting TFA firms in these districts
exhibited wage growth between 22 and 52 percent higher in real terms than other enterprises, after
controlling for worker and plant characteristics. While the coefficient on FOREXP*TREATMENT is
positive and significant in columns (1), (2), (4), and (6), it is negative for small enterprises.
C. Robustness

18
We perform a test of robustness using nonlinear matching techniques. Additional robustness tests
are reported elsewhere.16 To test whether there is something “special” about the treatment districts which
could lead to spurious results within a chosen sector, we redo our estimation using as TREATMENT the
affected districts (those with Nike, Reebok, or Adidas vendors) for each manufacturing sector separately.
While a number of approaches are possible for estimating treatment effects using non-linear matching
techniques, we adopt a procedure using nearest neighbor matching as outlined by Alberto Abadie, David
Drukker, Jane L. Herr, and Guido W. Imbens (2004).
This approach allows us to estimate sample average treatment effects of anti-sweatshop activism
on wage growth, using as controls those firms which match most closely those firms that have been
treated. To identify the most appropriate control group (the “nearest neighbor”), one must specify a list of
covariates. For the treatment effects reported in Table 4, we include as our set of covariates all the
controls reported in the first six columns of Table 2 except the minimum wage (which is not included
because of our concern about possible endogeneity and is highly collinear with location). Enterprises in
the control group are matched to the treatment group on the basis of foreign ownership and export status,
location, size, output growth, growth in capital stock, growth in material inputs, educational attainment of
the work force, total factor productivity growth, and investments in technology.
It is not possible in the context of our matching estimation to allow for multiple treatment effects
simultaneously. Consequently, in Table 4 TREATMENT is simply defined as being a foreign-owned or
exporting enterprise (FOREXP) located in districts with anti-sweatshop activism. The impact of activism
on wages estimated using nonlinear matching is remarkably similar to the OLS results reported in the first
two columns of Table 3. In the first row of Table 4, anti-sweatshop activism is associated with real wage
increases of between 21 and 22 percent. In the remaining rows of Table 4, we substitute for TFA with all
16 These additional tests are reported in Tables 4 and 5 of the working paper version of this article, available online at the AER website or from the author’s website. Additional robustness tests do the following: (1) we add the long of production workers as an additional control variable (2) we control for low initial wages by adding a dummy variable equal to one if the firm paid below the 1996 minimum wage in 1990 (3) we add profit margins as a control, to address the possibility that differences in product types or export opportunities could account for wage growth differentials (4) we perform a series of “nonsense” regressions by replacing the dummy variable for TFA plants with a dummy variable for other sectors. None of the additional tests alter the main results in Tables 2 and 3.

19
other manufacturing sectors for treatment and show that the effects are only significant and positive for
TFA enterprises.
The results in Tables 1 through 4 suggest that wages increased systematically more for large
exporting and foreign-owned TFA plants in treatment districts relative to other plants with similar
characteristics. Below, we explore whether these wage gains had other potentially adverse effects, such
as employment losses and falling investment, or caused plants to shut down operations in Indonesia.
III. Other Outcomes
A. Employment
The classic approach to minimum wages suggests that an increase in mandated wages should lead
to a fall in employment, as employers are driven up their labor demand curve. Prior to the 1990s,
standard textbook treatments of minimum wages reported that imposing a wage floor would lead to
adverse consequences for employment. However, David D. Card and Alan B. Krueger (1994, 1995,
1997) argue that the imposition of a minimum wage need not have negative employment consequences if
there are imperfections in the labor market. These imperfections include the following possibilities: (1)
the existence of monopsony employers (2) search costs for employers and (3) efficiency wages. If any of
these three imperfections characterize the local labor market, an increase in the minimum wage (or an
increase in compliance with the existing minimum wage) could lead to an increase or no change in
employment.
This unorthodox finding, which has caused an enormous debate among labor economists, has
interesting implications for labor market policies in developing countries. If policy makers can raise
wages by increasing the statutory minimum or encouraging compliance with the existing minimum
without increasing unemployment, then minimum wage policies could become a powerful tool for
combating poverty. This was precisely the thinking behind a 1995 World Bank Report which strongly
recommended the introduction of a national minimum wage to reduce poverty in Trinidad and Tobago.

20
A number of papers test the impact of minimum wages on employment in developing countries
(see, for example, (Eric Strobl and Frank Walsh (2000), Linda A. Bell (1997), William F. Maloney and
Jairo A. Nunez (2000), Martin Rama (1999) and SMERU (2001)). All these studies suggest there is a
widespread lack of compliance with the legislated minimum wage.
In Table 5, we repeat the type of analysis presented in Tables 1A-C and use the same type of
difference-in-difference approach adopted by Card and Krueger (1994) to examine the impact of
minimum wages and anti-sweatshop activism on employment in Indonesia. The first row reports the
number of production workers in 1990, and the second row reports the number of production workers in
1996. The third row reports the difference for all plants, while the fourth row reports the difference in
employment between 1990 and 1996 only for plants with data on employment in both years. Columns (1)
through (3) report employment for TFA establishments, columns (3) through (6) for other establishments,
and the last three columns compare the two groups.
Across domestic TFA enterprises, the mean number of employees fell slightly, from an average
of 95 employees per plant to an average of 90 employees per plant. Columns (2) and (3) show that TFA
employment growth was concentrated in foreign-owned and exporting enterprises. Between 1990 and
1996, foreign-owned and exporting plants added nearly 400 production workers on average. In contrast,
establishments in other sectors grew very little. Columns (7) through (9) report the difference-in-
difference, which is the difference in the change in employment across TFA and non-TFA firms between
1990 and 1996. Focusing on rows (3) and (4) and columns (8) and (9), we see that exporting and foreign-
owned TFA plants increased employment by 300 to 400 workers more than other plants. The results in
Table 5 suggest that anti-sweatshop activism vis-à-vis TFA enterprises did not appear to hurt their
employment, at least relative to growth in employment of other types of enterprises.
Tables 6A&B repeat the analysis in a regression context. We replace the log of production
worker wages with the log of production worker employment as the dependent variable. The coefficients
on FOR*TREATMENT and EXP*TREATMENT are positive and sometimes significant. With or
without controls, the results are consistent across specifications. There is no evidence that either

21
treatment is associated with employment declines. In fact, employment growth was generally higher for
TFA exporters and foreign-owned enterprise, including those operating in districts where anti-sweatshop
activists targeted Nike, Reebok, and Adidas.
However, the results in Tables 6A&B show a robust and negative impact of the minimum wage
increase on employment growth. In column (3), the coefficient on the minimum wage increase is -.123,
which suggests that a 100 percentage point increase in the minimum wage would be accompanied by a
12.3 percentage point decline in employment. In our sample, the mean increase in the minimum wage
measure was 50 percent, indicating an employment loss of 6 percent. The different specifications
presented in columns (3) & (4) of Table 6A and columns (1) through (5) of Table 6B suggest that a 100
percentage point increase in the real minimum wage would be accompanied by employment declines of
12 to 36 percent. The significant negative impact on employment needs to be seriously considered in any
campaign to increase the mandated minimum wage or to increase compliance with the minimum wage.17
B. Other Outcomes: Output Growth, Investment, Productivity, Profits, and Exit
The evidence in Tables 1 through 6 points to strong positive effects of anti-sweatshop campaigns
on wage growth for production workers and insignificant effects on employment. We would, however,
expect other outcomes to be adversely affected. Table 7 reports the impact of treatment on output growth,
investment, productivity, and profits. Consistent with the insignificant effects on employment, the first
two columns of Table 7 show that output growth for the two treatment groups was not significantly
different than for other enterprises. However, profits were significantly and negatively affected. Growth
in profitability for foreign-owned TFA firms in the treatment districts was 14 to 16 percentage points (of
value-added) lower than for other similar plants. Lower growth in profits appeared to be linked to lower
growth in capital stock and lower productivity growth, at least for foreign-owned TFA plants in treatment
districts.
17 Indonesia, however, is an unusual case: most countries do not experience 100 percent real increases in the value of the minimum wage over a five year period.
22
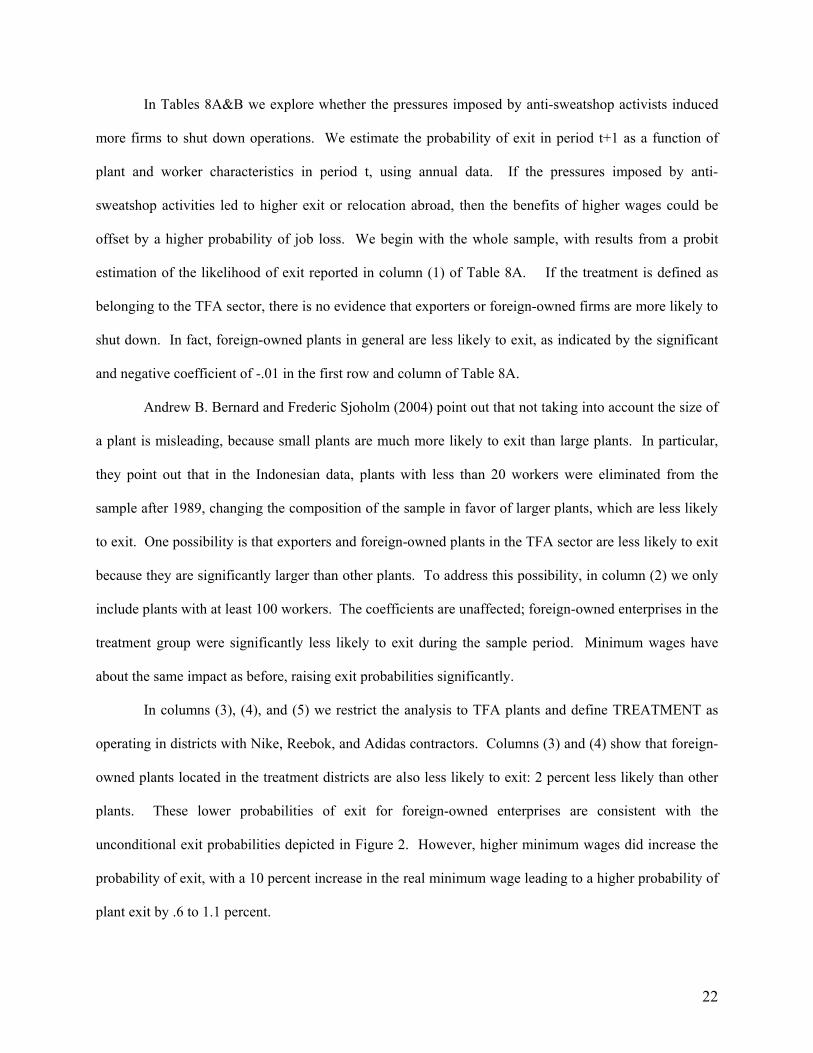
In Tables 8A&B we explore whether the pressures imposed by anti-sweatshop activists induced
more firms to shut down operations. We estimate the probability of exit in period t+1 as a function of
plant and worker characteristics in period t, using annual data. If the pressures imposed by anti-
sweatshop activities led to higher exit or relocation abroad, then the benefits of higher wages could be
offset by a higher probability of job loss. We begin with the whole sample, with results from a probit
estimation of the likelihood of exit reported in column (1) of Table 8A. If the treatment is defined as
belonging to the TFA sector, there is no evidence that exporters or foreign-owned firms are more likely to
shut down. In fact, foreign-owned plants in general are less likely to exit, as indicated by the significant
and negative coefficient of -.01 in the first row and column of Table 8A.
Andrew B. Bernard and Frederic Sjoholm (2004) point out that not taking into account the size of
a plant is misleading, because small plants are much more likely to exit than large plants. In particular,
they point out that in the Indonesian data, plants with less than 20 workers were eliminated from the
sample after 1989, changing the composition of the sample in favor of larger plants, which are less likely
to exit. One possibility is that exporters and foreign-owned plants in the TFA sector are less likely to exit
because they are significantly larger than other plants. To address this possibility, in column (2) we only
include plants with at least 100 workers. The coefficients are unaffected; foreign-owned enterprises in the
treatment group were significantly less likely to exit during the sample period. Minimum wages have
about the same impact as before, raising exit probabilities significantly.
In columns (3), (4), and (5) we restrict the analysis to TFA plants and define TREATMENT as
operating in districts with Nike, Reebok, and Adidas contractors. Columns (3) and (4) show that foreign-
owned plants located in the treatment districts are also less likely to exit: 2 percent less likely than other
plants. These lower probabilities of exit for foreign-owned enterprises are consistent with the
unconditional exit probabilities depicted in Figure 2. However, higher minimum wages did increase the
probability of exit, with a 10 percent increase in the real minimum wage leading to a higher probability of
plant exit by .6 to 1.1 percent.

23
In column (5) we turn to an analysis of plants with less than 100 employees. Small TFA
exporters in treatment districts are 4.5 percentage points more likely to exit than other small TFA
exporters. These results are statistically significant and suggest that TREATMENT is associated with a
higher probability of plant shutdown for small exporters. Table 8B excludes controls for worker
characteristics and minimum wages. Since worker characteristics are only recorded for three years in the
1990s, including worker characteristics restricts the sample to surviving plants or plants exiting after
1995, when worker characteristics were first recorded. In this larger sample, the evidence is consistent
with a lower probability of exit for foreign-owned enterprises, including both TFA and non-TFA foreign
plants.18
However, the evidence is consistent with higher exit probabilities for small TFA exporters in the
treatment group, as indicated in the last columns of both Tables 8A&B. While exporters in general were
less likely to exit, small TFA exporters operating in the treatment districts were significantly more likely
to exit than other small TFA exporters, with a 15.5 percent higher probability of exiting compared to
other enterprises. This significantly higher probability of exit is consistent with the unconditional exit
probabilities depicted in Figure 2.
One possibility is that TFA exporters are simply more volatile, exhibiting higher rates of entry as
well. However, we find that this is not the case. Unreported results show that during the 1990s, not only
were TFA plants more likely to exit, but entry rates also dropped as well. Higher rates of entry by TFA
plants relative to other sectors were followed by a fall in entry rates, which by the end of the 1990s were
comparable to non-TFA plants. Additional unreported probit regressions confirm that there was less
entry into the TFA sector, particularly among exporters.
If entry fell and exit rates rose for exporting TFA plants, how can we account for the fact that
total employment in TFA plants did not fall? In other words, how can we explain that TFA production
18 Our results are somewhat different from Bernard and Sjoholm (2004), who find that foreign-owned plants in Indonesia are more footloose than other plants. Our results suggest that foreign-owned plants are less footloose. This could be because the number of foreign-owned enterprises in Indonesia in the 1980s—Bernard and Sjoholm examine data which ends in 1989—was small and consequently a few plants could lead to large rates of entry and exit. Our data focuses on the 1990s, when there were many more foreign-owned plants in Indonesia.

24
worker employment as a percentage of total manufacturing employment increased at the same time that
exit became proportionately higher? The reason, as shown in Table 7, is that remaining TFA plants—
particularly exporters and foreign-owned plants—increased production worker employment by as much
as 50 percent. Employment increases within surviving plants compensated for higher exit by some TFA
enterprises.
C. Does Better Compliance with Minimum Wage Laws Explain the Observed Wage Gains?
An important question remains: Were the wage increases in treatment firms simply a result of
better compliance with the rising minimum wage? We address this question in Table 9. The first three
columns report the change in compliance with the statutory minimum wage as a function of treatment,
controlling for plant and worker characteristics. The dependent variable is the change in compliance
between 1990 and 1996, where compliance is a dummy variable equal to 1 if the firm’s average
production worker wage exceeded the statutory minimum wage in that district. The results in column (1)
show that if TREATMENT is defined as the TFA sector, then foreign or exporting treatment firms
increased compliance with the minimum wage by 15.1 percentage points relative to the control (firms in
other sectors). If TREATMENT is defined as operating in districts targeted by anti-sweatshop activism,
then the results in columns (2) and (3) indicate that TREATMENT led to increased compliance by 12.4 to
37.1 percent relative to other TFA firms. The first three columns of Table 9 suggest that the anti-
sweatshop movement was associated with a large and significant increase in compliance with the
minimum wage.
The next four columns of Table 9 measure the contribution of higher minimum wage compliance
to the wage increases associated with TREATMENT. To do this, we add a triple interaction term
between foreign-ownership or export status FOREXP, TREATMENT, and the minimum wage gap. If
activism led to higher wages by increasing compliance with the minimum wage, then this interaction term
should capture that effect and the coefficient on FOREXP*TREATMENT should become small in
magnitude and insignificant. The results presented in columns (4) through (7) show that this is indeed the
case.

25
The coefficient on FOREXP*TREATMENT becomes insignificant and close to zero, while the
coefficient on the triple interaction is large in magnitude and significant. These results suggest that anti-
sweatshop activism led to higher wages primarily by increasing compliance with the minimum wage. In
columns (8) and (9) we add the triple interaction to the employment regressions from Tables 8A&B. The
inclusion of the additional term does not affect the results, suggesting that while anti-sweatshop activism
was associated with additional wage growth it was not associated with greater employment declines, or
with falling employment stemming from more vigilant compliance with the minimum wage. While on
average the large minimum wage increases were associated with falling employment, the increasing
compliance of establishments targeted by anti-sweatshop activism was not. Combining the results
presented in Tables 6 through 9 suggests that plants targeted by the campaigns either raised wages, cut
profits, and maintained employment, or simply exited the industry.
IV. Conclusion
During the 1990s, anti-sweatshop activists increased their efforts to improve working conditions
and raise wages for workers in developing countries. Indonesia, which had more Nike contractors than
any other country apart from China during this period, was a primary target for these activists. The
Indonesian government also greatly increased the minimum wage throughout the 1990s. This paper
analyzes the impact of these twin interventions on labor market outcomes in Indonesian manufacturing.
The results suggest that on top of the large wage increases induced by minimum wage changes, real
production worker wages rose an additional 10 to 20 percent for TFA relative to non-TFA establishments.
Within the TFA sector plants targeted by anti-sweatshop activists experienced even larger real wage
increases. Large TFA establishments in treatment districts increased production worker wages by as
much as 30 percent relative to other plants. As we show in the paper, much of the wage increases within
targeted plants reflected higher compliance with the minimum wage relative to non-TFA or non-treatment
plants after the onset of the anti-sweatshop campaigns.
26
One question which naturally arises is how such large real wage increases could be sustained
without adverse consequences for employment.19 We examine whether these higher wages led firms to
cut employment or shut down operations. Our results suggest that the minimum wage increases led to
employment losses for production workers across all sectors in manufacturing. While anti-sweatshop
activism did not have additional adverse effects on employment within the TFA sector, it did lead to
falling profits, reduced productivity growth, and plant closures for smaller exporters.
It is important to note that the wage gains documented in this paper could be temporary. In the
late 1980s and early 1990s, the TFA sector in Indonesia was booming as suppliers from higher cost East-
Asian locations shifted operations to lower cost locations nearby. Yet in the last ten years, footwear and
apparel companies such as Nike have shifted to vendors in other low-wage countries, including China,
Vietnam, and Cambodia. Vietnam has now replaced Indonesia as the second largest vendor location
(after China), as measured by the number of workers employed in Nike supplier factories. While Nike
continues to use Indonesian contract factories to source 20 percent of its footwear operations, this share
will continue to fall if factories in Vietnam produce lower cost and higher quality goods.
Many research and policy questions remain unanswered. Designing anti-sweatshop campaigns in
such a way as to make wage gains and better factory conditions sustainable, without endangering
employment or leading plants to relocate elsewhere, is challenging. The new anti-sweatshop activism
emphasizes the introduction of “living wages”, which are significantly harder to define and consequently
to implement, compared to codes of conduct focused on compliance with minimum wages. Extending the
type of analysis presented in this paper to other countries would also be informative.
19 It is important to keep in mind that for a well-known brand name such as Nike, labor costs from developing country factories in 1998 only accounted for about 4 percent of the total cost of a ninety dollar shoe. The internet link is http://cbae.nmsu.edu/~dboje/NIKfaqcompensation.html This interview with Nike is from 1998, but is no longer part of Nike’s “official” website.

27
Bibliography
Abadie, Alberto, Drukker, David, Herr, Jane L., Guido W. Imbens. (2004), “Implementing Matching Estimators for Average Treatment Effects in Stata”, The Stata Journal, Vol. 4, No. 3, pages 290- 311.
Aitken, Brian, Ann Harrison and Robert Lipsey (1996), "Wages and Foreign-ownership: A Comparative Study of Mexico, Venezuela, and the United States", Journal of International Economics, Vol. 40, Nos. 3/4, pages 345-371.
Altonji, Joseph G. and Rebecca M. Blank (1999), “Race and Gender in the Labor Market”, in Handbook of Labor Economics, Volume Three, edited by Orley Ashenfelter and David Card, Elsevier Science B.V. Ashenfelter, Orley and Robert S. Smith (1979), “Compliance with Minimum Wage Law”, The Journal of Political Economy, Vol. 87, No. 2, pages 333-350. Bell, Linda A. (1997), “The Impact of Minimum Wages in Mexico and Colombia”, Journal of Labor Economics, Vol. 15, No. 3, pt.2, pages S102-S135. Bernard, Andrew B., and Fredrik Sjoholm, (2004), “Foreign Owners and Plant Survival”, National Bureau of Economic Research, Working Paper Number 10039. Brown, Drusilla K, (2001), “Labor Standards: Where Do They Belong on the International Trade Agenda?”, Journal of Economic Perspectives, Vol. 15, No. 3, pages 89-112. Brown, Drusilla K., Alan V. Deardorff, and Robert M. Stern (2004), “The Effects of Multinational
Production on Wages and Working Conditions in Developing Countries”, in Robert E. Baldwin and L. Alan Winters, editors, Challenges to Globalization: Analyzing the Economics, National Bureau of Economic Research.
Card, David D. and Alan B. Krueger (1994), “Minimum Wages and Employment: A Case Study of the Fast-Food Industry in New Jersey and Pennsylvania”, American Economic Review, Vol. 84, No. 4, pages 772-793. Card, David, and Alan Krueger (1997), Myth and Measurement: The New Economics of the Minimum Wage, Princeton University Press, Princeton. Chau, Nancy H. and Kanbur, Ravi (2002), “The Adoption of International Labor Standard Conventions: Who, When, and Why?” in Brookings Trade Forum 2001 (Rodrik, Dani and Collins, Susan M. eds), The Brookings Institution, Washington D.C. Currie, Janet and Ann Harrison (1997), “Sharing the Costs: The Impact of Trade Reform on Capital and Labor in Morocco”, The Journal of Labor Economics, Volume 15, No. 3, pages 485-500. Edmonds, Eric V. and Nina Pavcnik (2001), “Does Globalization Increase Child Labor? Evidence from Vietnam”, Dartmouth College, Working Paper. Elliott, Kimberly Ann (1998a), “Preferences for Workers? Worker Rights and the US Generalized System of Preferences”, Institute for International Economics.

28
Elliott, Kimberly Ann (1998b), “International Labor Standards and Trade: What Should Be Done?” in Launching New Global Trade Talks: An Action Agenda, Jeffrey Schott, editor. Washington: Institute for International Economics Elliott, Kimberly Ann and Richard Freeman (2003), Can Labor Standards Improve Under Globalization? Washington, DC: Institute for International Economics. Eskeland, Gunnar S., and Ann E. Harrison (2003), “Moving to Greener Pastures? Multinationals and the Pollution Haven Hypothesis”, Journal of Development Economics, Vol. 70, No. 1, pages 1-23. Maloney, William F. and Jairo A. Nuñez (2001). Measuring the Impact of Minimum Wages: Evidence
from Latin America, Mimeo, World Bank. Maskus, Keith (1996), “Should Core Labor Standards be Imposed Through International Trade Policy?”, World Bank, Working Paper. Rama, Martin (1996), “The Consequences of Doubling the Minimum Wage: The Case of Indonesia”, World Bank, Working Paper. SMERU Research Report, Wage and Employment Effects of Minimum Wage Policy in the Indonesian Urban Labor Market, SMERU Research Report, SMERU Research Institute, Indonesia, October 2001. Strobl, Eric and Frank Walsh (2000), “Minimum Wages and Compliance: The Case of Trinidad and Tobago”, University College Dublin, Working Paper. Udomsaph, Charles C. (2002), “Premiums to Employment in Establishments with Foreign Direct Investment: Evidence from Thai manufacturing”, UC-Berkeley, Working Paper.

29
Figure 1: Share of Total Production Workers Employed in Foreign and Exporting TFA in Indonesia 1988-1996
0
5
10
15
20
25
30
35
40
1988 1989 1990 1991 1992 1993 1994 1995 1996
Year
% o
f Tot
al P
rodu
ctio
n W
orke
rs
Foreign TFA Firms Exporting TFA Firms All TFA Firms
Figure 2: Percentage of Firms Exiting in Years 1988-1999
0
5
10
15
20
25
30
35
1988 1989 1990 1991 1992 1993 1994 1995 1996 1997
Year
% E
xitin
g
All Firms
Foreign Firms
Exporting Firms
Foreign TFA Firms
Exporting TFA Firms
Domestic Non-Exporting TFA

30
Tabl
e 1A
: Mea
n Pr
oduc
tion
Wor
ker
Wag
es in
199
0 an
d 19
96
Con
tras
ting
Text
iles,
Foot
wea
r, a
nd A
ppar
el (T
FA) v
ersu
s Oth
er S
ecto
rs
Te
xtile
s, Fo
otw
ear,
and
App
arel
O
ther
Est
ablis
hmen
ts
D
iffer
ence
(1)
(2)
(3)
(4)
(5)
(6)
(7)
(8)
(9)
Dom
estic
a
Alw
ays
Fore
ignb
Alw
ays
Expo
rting
c
Dom
estic
a
Alw
ays
Fore
ignb
Alw
ays
Expo
rting
c (1
)-(4
) (2
)-(5
) (3
)-(6
)
1. M
ean
Wag
e in
199
0,
A
ll O
bser
vatio
ns
1078
.2
(15.
5)
1775
.1
(112
.1)
1462
.4
(122
.8)
1134
.2
(13.
2)
3560
.8
(182
.1)
1934
.6
(102
.7)
56.0
(2
7.9)
-1
805.
6 (4
19.1
) -4
72.2
(2
05.2
) 2.
Mea
n W
age
in 1
996,
All
Obs
erva
tions
1441
.2
(19.
6)
2268
.8
(79.
2)
2079
.2
(100
.0)
1552
.4
(14.
4)
3798
.6
(137
.8)
2125
.2
(54.
6)
-111
.1
(32.
1)
-152
9.7
(280
.0)
-46.
0 (1
15.6
) 3.
Cha
nge
in M
ean
W
age,
199
0-19
96
363.
0 (2
5.7)
513.
7 (1
51.2
)
616.
8 (1
87.1
)
418.
1 (2
0.2)
237.
8 (2
41.1
)
190.
6 (1
11.2
)
-54.
9 (3
6.7)
275.
9 (4
97.6
)
426.
2 (1
88.5
) 4.
Cha
nge
in M
ean
Wag
e,
B
alan
ced
Sam
pled
349.
4 (3
3.4)
740.
1 (1
96.3
)
474.
2 (1
70.0
)
374.
7 (2
6.6)
814.
9 (3
18.8
)
259.
4 (1
35.2
)
-25.
3 (4
7.4)
-74.
8 (4
97.6
)
214.
8 (1
88.5
) 5.
Mea
n C
hang
e in
Log
Wag
e, 1
990-
1996
.30
(.03)
.2
9 (.0
9)
.40
(.05)
.3
7 (.0
1)
.08
(.05)
.1
3 (.0
4)
-.07
(.02)
.2
1 (.1
1)
.27
(.07)
6. M
ean
Cha
nge
in L
og
W
age,
Bal
ance
d S
ampl
e .3
0 (.0
3)
.36
(.10)
.3
5 (.0
6)
.28
(.02)
.2
2 (.0
7)
.16
(.05)
.0
2 (.0
2)
.14
(.10)
.1
9 (.1
0)
Not
es:
Stan
dard
Err
ors i
n pa
rent
hese
s D
efin
ition
s:
(a) A
pla
nt th
at is
nei
ther
fore
ign-
owne
d no
r exp
orts
the
entir
e pe
riod.
(b
) Inc
lude
s at l
east
10%
fore
ign
equi
ty o
ver t
he e
ntire
per
iod.
(c
) Exp
orts
at l
east
10%
of o
utpu
t ove
r the
ent
ire p
erio
d.
(d) D
efin
ed a
s est
ablis
hmen
ts p
rese
nt in
bot
h 19
90 a
nd 1
996.

31
T
able
1B
Com
pari
son
of T
reat
men
t Gro
ups r
elat
ive
to C
ontr
ols P
rior
to T
reat
men
t (19
88-1
990)
Tr
eatm
ent i
s Tex
tiles
, Foo
twea
r and
App
arel
(TFA
) Exp
ortin
g or
Fo
reig
n En
terp
rises
Rel
ativ
e to
Oth
er S
ecto
rs
Res
ults
of T
-test
diff
eren
ce in
Mea
ns fo
r the
Con
trol
rela
tive
to T
reat
men
t for
the
Follo
win
g V
aria
bles
: Fo
reig
n-O
wne
d En
terp
rises
Ex
porte
rs
Tr
eat-
men
t C
ontro
l T-
test
of
Dif-
fere
nce
Trea
t-m
ent
Con
trol
T-te
st o
f D
if-fe
renc
e A
vera
ge P
rodu
ctio
n W
orke
r Wag
es
2029
38
47
5.76
**
1656
26
18
6.51
**
(‘00
0s o
f Rea
l Rup
iahs
per
wor
ker)
(1
24.9
) (1
27.8
)
(92.
49)
(66.
64)
Si
ze (T
otal
num
ber o
f em
ploy
ees)
97
5.7
374.
1 -1
0.1*
* 61
6.5
442.
3 -4
.61*
*
(80.
33)
(20.
39)
(3
8.11
) (1
5.67
)
Prof
its (V
alue
-add
ed le
ss p
aym
ents
to w
orke
rs a
s a sh
are
of
0.34
3 0.
349
0.26
0.
364
0.34
8 -1
.22
Val
ue-a
dded
) (.0
19)
(.009
)
(.011
) (.0
05)
Lo
g ch
ange
in P
rodu
ctio
n W
orke
r Wag
es
0.06
1 -0
.004
-0
.88
0.07
9 0.
033
-1.1
6
(.076
) (.0
26)
(.0
35)
(.016
)
Log
chan
ge in
num
ber o
f pro
duct
ion
wor
kers
0.
065
0.07
2 0.
15
0.13
6 0.
117
-0.6
3
(.023
) (.0
18)
(.0
23)
(.013
)
Log
chan
ge in
mat
eria
l inp
uts
0.08
0 0.
141
0.65
0.
212
0.14
4 -1
.09
(.0
69)
(.035
)
(.061
) (.0
25)
Lo
g ch
ange
in c
apita
l sto
ck
0.25
5 0.
245
-0.0
5 0.
142
0.27
2 1.
24
` (.2
05)
(.071
)
(.097
) (.0
44)
To
tal F
acto
r Pro
duct
ivity
Gro
wth
0.
038
0.06
3 0.
36
0.00
5 0.
052
1.25
(.056
) (.0
25)
(.0
40)
(.015
)
Out
put G
row
th
0.09
7 0.
123
0.36
0.
229
0.14
6 -1
.65
(.0
61)
(.026
)
(.049
) (.0
21)
St
anda
rd e
rror
s in
par
enth
eses
. A
* in
dica
tes
the
diff
eren
ce in
mea
ns is
sta
tistic
ally
sig
nific
ant a
t the
5 p
erce
nt le
vel;
a **
indi
cate
s th
e di
ffer
ence
in m
eans
is s
tatis
tical
ly s
igni
fican
t at t
he 1
per
cent
le
vel.
Val
ues c
alcu
late
d fo
r the
198
8 th
roug
h 19
90 p
erio
d, e
xcep
t for
tota
l fac
tor p
rodu
ctiv
ity g
row
th (T
FPG
) and
cap
ital s
tock
whe
re w
e us
e 19
88 a
nd 1
989
only
. A
ll va
lues
in re
al R
upia
hs a
re d
efla
ted
by th
e C
PI, b
ased
in 1
996.
Pro
duct
ivity
gro
wth
is d
efin
ed a
s th
e lo
g ch
ange
in o
utpu
t les
s th
e w
eigh
ted
chan
ges
in in
puts
, whe
re in
puts
incl
ude
prod
uctio
n an
d no
n pr
oduc
tion
wor
kers
, mat
eria
ls, a
nd
capi
tal s
tock
. The
wei
ghts
are
equ
al to
an
aver
age
of th
e sh
ares
of e
ach
of th
e in
puts
in to
tal c
osts
in th
e cu
rren
t and
last
per
iod,
exc
ept c
apita
l whi
ch is
equ
al to
1 le
ss o
ther
inpu
t sha
res.

32
T
able
1C
C
ompa
riso
n of
Tre
atm
ent G
roup
s rel
ativ
e to
Con
trol
s Pri
or to
Tre
atm
ent (
1988
-199
0)
Trea
tmen
t is T
FA E
nter
pris
es in
Tre
atm
ent R
egio
ns v
ersu
s oth
er
TFA
Ent
erpr
ises
Res
ults
of T
-test
diff
eren
ce in
Mea
ns fo
r the
Con
trol
rela
tive
to T
reat
men
t for
the
Follo
win
g V
aria
bles
: Fo
reig
n-O
wne
d En
terp
rises
Ex
porte
rs
Tr
eat-
men
t C
ontro
l T-
test
of
Dif-
fere
nce
Trea
t-m
ent
Con
trol
T-te
st o
f D
if-fe
renc
e A
vera
ge P
rodu
ctio
n W
orke
r Wag
es
1577
23
81
3.35
**
1371
18
13
2.30
* (‘
000s
of R
eal R
upia
hs p
er w
orke
r)
(106
.6)
(194
.9)
(6
2.9)
(1
37.9
)
Size
(Tot
al n
umbe
r of e
mpl
oyee
s)
810.
9 11
04.2
-1
.83
683.
9 57
9.6
-1.3
1
(128
.4)
(99.
9)
(6
7.6)
(4
5.8)
Prof
its (V
alue
-add
ed le
ss p
aym
ents
to w
orke
rs a
s a sh
are
of
0.34
5 0.
342
-0.0
7 0.
338
0.37
8 -0
.07
Val
ue-a
dded
) (.0
35)
(.020
)
(.014
) (.0
14)
Lo
g ch
ange
in P
rodu
ctio
n W
orke
r Wag
es
-0.0
24
0.10
8 0.
83
0.08
0 0.
078
-0.0
2
(.073
) (.1
12)
(.0
51)
(.046
)
Log
chan
ge in
num
ber o
f pro
duct
ion
wor
kers
0.
105
0.04
2 -1
.32
0.10
9 0.
148
0.77
(.056
) (.0
18)
(.0
40)
(.029
)
Log
chan
ge in
mat
eria
l inp
uts
0.14
5 0.
043
-0.7
09
0.23
1 0.
203
-0.2
11
(.1
15)
(.086
)
(.088
) (.0
79)
Lo
g ch
ange
in c
apita
l sto
ck
-0.0
15
0.37
3 0.
867
-0.0
65
0.22
3 1.
344
` (.5
79)
(.164
)
(.203
) (.1
08)
To
tal F
acto
r Pro
duct
ivity
Gro
wth
0.
084
0.01
8 -0
.52
0.01
2 0.
003
-0.1
0
(.072
) (.0
76)
(.0
32)
(.055
)
Out
put G
row
th
0.21
5 0.
032
-1.4
6 0.
279
0.20
7 -0
.68
(.1
06)
(.072
)
(.073
) (.0
63)
St
anda
rd e
rror
s in
par
enth
eses
. A
* in
dica
tes
the
diff
eren
ce in
mea
ns is
sta
tistic
ally
sig
nific
ant a
t the
5 p
erce
nt le
vel;
a **
indi
cate
s th
e di
ffer
ence
in m
eans
is s
tatis
tical
ly s
igni
fican
t at t
he 1
per
cent
le
vel.
Val
ues c
alcu
late
d fo
r the
198
8 th
roug
h 19
90 p
erio
d, e
xcep
t for
tota
l fac
tor p
rodu
ctiv
ity g
row
th (T
FPG
) and
cap
ital s
tock
whe
re w
e us
e 19
88 a
nd 1
989
only
. A
ll va
lues
in re
al R
upia
hs a
re d
efla
ted
by th
e C
PI, b
ased
in 1
996.
Pro
duct
ivity
gro
wth
is d
efin
ed a
s th
e lo
g ch
ange
in o
utpu
t les
s th
e w
eigh
ted
chan
ges
in in
puts
, whe
re in
puts
incl
ude
prod
uctio
n an
d no
n pr
oduc
tion
wor
kers
, mat
eria
ls, a
nd
capi
tal s
tock
. The
wei
ghts
are
equ
al to
an
aver
age
of th
e sh
ares
of e
ach
of th
e in
puts
in to
tal c
osts
in th
e cu
rren
t and
last
per
iod,
exc
ept c
apita
l whi
ch is
equ
al to
1 le
ss o
ther
inpu
t sha
res.

33
Tab
le 2
O
LS
Lon
g D
iffer
ence
-in-D
iffer
ence
s Est
imat
ion:
Reg
ress
ing
Prod
uctio
n W
orke
r W
age
Diff
eren
ces f
or 1
990-
1996
on
the
Min
imum
Wag
e G
ap, P
lant
Cha
ract
eris
tics,
and
Oth
er C
ontr
ols
(T
reat
men
t is E
stab
lishm
ents
in T
extil
es, F
ootw
ear,
and
App
arel
Sec
tors
) D
epen
dent
Var
iabl
e: L
og P
lant
Uns
kille
d W
age
in 1
996
– Lo
g Pl
ant U
nski
lled
Wag
e in
199
0
(1
) O
wne
rshi
p D
umm
ies
Onl
y
(2)
Add
ing
plan
t, w
orke
r, an
d re
gion
co
ntro
ls
(3)
Com
bini
ng
Fore
ign
and
Expo
rting
En
terp
rises
(4)
Sam
e as
(3)
but e
xclu
ding
Te
xtile
s as
Trea
tmen
t
(5)
Excl
udin
g
Min
imum
W
age
as a
C
ontro
l and
ex
clud
ing
Text
iles
(6)
Dep
ende
nt
varia
ble
is
non-
wag
e be
nefit
s for
pr
oduc
tion
wor
kers
(7)
Dep
ende
nt
Var
iabl
e is
w
ages
plu
s no
n-w
age
Ben
efits
, All
Con
trols
(8)
Dep
ende
nt
Var
iabl
e is
log
wag
es fo
r no
n-pr
oduc
tion
wor
kers
Fo
reig
n (a
) 0.
094
0.06
1 --
--
--
--
--
--
(1.8
7)
(0
.97)
Expo
rter (
b)
-0.0
57
-0.0
52
--
--
--
--
--
--
(1
.35)
(0.9
8)
Fore
ign
or E
xpor
ter
--
--
0.01
0 -0
.001
-0
.097
-0
.006
0.
010
-0.0
36
(FO
REX
P)
(0
.32)
(0
.03)
(3
.85)
**
(0.4
3)
(0.3
3)
(0.9
7)
TREA
TMEN
T -0
.059
-0
.039
-0
.049
-0
.037
-0
.031
0.
002
-0.0
49
0.04
5 (c
) (1
.57)
(1.9
9)
(2.1
2)*
(1.7
6)
(0.9
8)
(0.2
9)
(2.1
9)*
(1.7
2)
Fore
ign*
0.
106
0.12
4 --
--
--
--
--
--
TR
EATM
ENT
(2.2
5)*
(3
.18)
**
Expo
rting
* 0.
119
0.11
0 --
--
--
--
--
--
TR
EATM
ENT
(2.3
0)*
(2
.21)
*
FOR
EXP*
--
--
0.
097
0.10
2 0.
202
-0.0
34
0.09
6 -0
.057
TR
EATM
ENT
(2
.43)
* (2
.92)
**
(5.6
7)**
(0
.77)
(2
.41)
* (1
.13)
Min
imum
0.
554
0.67
5 0.
667
0.66
9 --
-0
.023
0.
667
0.15
0 W
age
(d)
(9.7
9)**
(7.5
3)**
(7
.41)
**
(7.3
0)**
(1.1
1)
(7.4
2)**
(3
.42)
**
Obs
erva
tions
61
65
5920
59
20
5920
59
20
5335
59
20
5099
R
-squ
ared
0.
12
0.23
0.
23
0.23
0.
13
0.03
0.
23
0.07
R
obus
t t st
atis
tics i
n pa
rent
hese
s, w
ith *
indi
catin
g si
gnifi
canc
e at
5 %
and
**
indi
catin
g si
gnifi
canc
e at
1 %
. C
onst
ant t
erm
incl
uded
in a
ll sp
ecifi
catio
ns b
ut n
ot re
porte
d he
re.
Not
es:
(a) I
nclu
des s
ome
fore
ign
equi
ty o
ver t
he e
ntire
per
iod.
(b
) Exp
orts
som
e sh
are
of o
utpu
t ove
r the
ent
ire p
erio
d.
(c) T
REA
TMEN
T is
def
ined
as a
n es
tabl
ishm
ent i
n th
e te
xtile
s, fo
otw
ear,
or a
ppar
el (T
FA) s
ecto
r.
(d) D
efin
ed a
s the
log
of th
e m
inim
um w
age
in 1
996
less
the
log
of th
e m
inim
um w
age
in 1
990,
unl
ess t
he p
lant
pay
s abo
ve th
e 19
96 m
inim
um w
age
in 1
990,
in w
hich
cas
e th
e m
inim
um w
age
chan
ge is
set e
qual
to z
ero.

34
T
able
3
O
LS
Lon
g D
iffer
ence
-in-D
iffer
ence
s Est
imat
ion:
Reg
ress
ing
Prod
uctio
n W
orke
r W
age
Diff
eren
ces f
or 1
990-
1996
on
the
Min
imum
W
age
Gap
, Pla
nt C
hara
cter
istic
s, an
d O
ther
Con
trol
s Te
xtile
s, Fo
otw
ear
and
App
arel
Onl
y
Tre
atm
ent i
s Est
ablis
hmen
ts in
Dist
rict
s with
Nik
e, R
eebo
k, a
nd A
dida
s Con
trac
tors
Dep
ende
nt
Var
iabl
e:
Log
Plan
t U
nski
lled
Wag
e in
19
96 –
Log
Pla
nt U
nski
lled
Wag
e in
199
0
(1)
All
Firm
s
(2)
Larg
e Fi
rms
(At L
east
100
Em
ploy
ees)
(3)
Smal
l Firm
s (L
ess t
han
100
Empl
oyee
s)
(4)
Larg
e Fi
rms
App
arel
and
Fo
otw
ear
Onl
y
(5)
Smal
l Firm
s A
ppar
el a
nd
Foot
wea
r O
nly
(6)
Larg
e Fi
rms
App
arel
and
Fo
otw
ear
Incl
udin
g M
inim
um
Wag
es
(7)
Smal
l Firm
s A
ppar
el a
nd
Foot
wea
r In
clud
ing
Min
imum
W
ages
Fo
reig
n o
r Exp
orte
r
-0
.071
-0
.152
0.
098
-0
.346
0.
091
-0
.282
0.
071
(FO
REX
P) (a
)
(1.0
4)
(2.3
0)*
(1.2
5)
(2.1
0)
(0.9
9)
(-2.
04)
(0.6
5)
TREA
TMEN
T (b
) 0.
024
-0.0
14
0.05
1 -0
.218
0.
088
-0.1
82
0.06
1
(0.3
6)
(0.1
6)
(1.6
4)
(3.3
7)*
(1.2
4)
(2.8
6)*
(1.0
0)
FOR
EXP*
TREA
TMEN
T 0.
216
0.29
5 -0
.209
0.
518
-0.0
70
0.43
4 -0
.165
(1.7
8)
(2.3
6)*
(2.6
5)*
(2.4
9)*
(0.6
4)
(2.6
8)*
(1
.33)
Min
imum
-
--
--
--
--
1.00
1 0.
686
Wag
e (c
)
(7
.31)
**
(3.0
1)*
Obs
erva
tions
1123
53
5 58
8 21
4 28
6 21
4 28
6
R-s
quar
ed
0.
20
0.17
0.
32
0.20
0.
31
0.36
0.
39
Rob
ust t
sta
tistic
s in
par
enth
eses
, with
* in
dica
ting
sign
ifica
nce
at 5
% a
nd *
* in
dica
ting
sign
ifica
nce
at 1
%.
Con
stan
t ter
m in
clud
ed in
all
spec
ifica
tions
but
not
repo
rted
here
. N
otes
: (a
) Inc
lude
s som
e fo
reig
n eq
uity
ove
r the
ent
ire p
erio
d or
exp
orts
som
e sh
are
of o
utpu
t ove
r the
ent
ire p
erio
d.
(b) A
n es
tabl
ishm
ent i
n th
e te
xtile
s, fo
otw
ear,
and
appa
rel (
TFA
) sec
tor i
n a
dist
rict w
here
Nik
e/R
eebo
k/A
dida
s con
tract
ors o
pera
te.
(c)
The
min
imum
wag
e is
def
ined
as
the
log
of th
e m
inim
um w
age
in 1
996
less
the
log
of th
e m
inim
um w
age
in 1
990,
unl
ess
the
plan
t pay
s ab
ove
the
1996
min
imum
wag
e in
199
0, in
whi
ch c
ase
the
min
imum
wag
e ch
ange
is se
t equ
al to
zer
o.

35
Tab
le 4
A
n A
dditi
onal
Tes
t of R
obus
tnes
s: A
Mat
chin
g E
stim
ator
by
Sect
or
D
epen
dent
Var
iabl
e: L
og P
lant
Uns
kille
d W
age
in 1
996-
Log
Pla
nt U
nski
lled
Wag
e in
199
0
Indu
stry
(I
SIC
Cla
ssifi
catio
n)
Es
timat
ing
Sam
ple
Ave
rage
Tre
atm
ent E
ffec
t Usi
ng M
atch
ing
Estim
atio
n Tr
eatm
ent d
efin
ed a
s for
eign
or e
xpor
ting
ente
rpris
es lo
cate
d in
dis
trict
s with
N
ike,
Ree
bok,
or A
dida
s con
tract
ors
C
oeff
icie
nt o
n TR
EATM
ENT
La
rge
Ente
rpris
es(a
t lea
st 1
00 w
orke
rs)
All
Ente
rpris
es
Text
iles,
Foot
wea
r, an
d A
ppar
el
0.21
2 0.
224
Onl
y (2
.30)
*
(2.6
8)**
Food
, Bev
erag
es,
0.16
9 0.
121
And
Tob
acco
(0.5
5)
(0.4
0)
Woo
d an
d fu
rnitu
re
-0.1
62
-0.0
86
(0
.73)
(0.5
0)
Pape
r Pro
duct
s -0
.072
-0
.085
(0.2
4)
(0
.28)
Che
mic
als a
nd
-0.0
14
-0.1
22
Petro
leum
Pro
duct
s
(0.1
1)
(0.9
2)
Non
-met
allic
min
eral
0.
057
0.17
3 Pr
oduc
ts
(0.1
9)
(0
.44)
Bas
ic M
etal
Indu
strie
s -0
.094
0.
011
(0
.25)
(0.0
3)
Fabr
icat
ed m
etal
-0
.110
0.
024
Prod
ucts
and
mac
hine
ry
(0
.87)
(0
.18)
Oth
er M
anuf
actu
ring
-0.6
18
-0.3
65
(2
.96)
**
(1.3
5)
Not
es: Z
-sta
tistic
s in
().
We
use
near
est n
eigh
bor m
atch
ing
as o
utlin
ed b
y A
badi
e, D
rukk
er, H
err,
and
Imbe
ns (2
004)
. En
terp
rises
mat
ched
to th
e tre
atm
ent g
roup
on
the
basi
s of e
xpor
t and
fore
ign
stat
us, l
ocat
ion,
size
, out
put g
row
th, g
row
th in
ca
pita
l sto
ck, g
row
th in
mat
eria
l inp
uts,
educ
atio
nal a
ttain
men
t of t
he w
ork
forc
e, to
tal f
acto
r pro
duct
ivity
gro
wth
, and
in
vest
men
ts in
tech
nolo
gy. T
REA
TMEN
T de
fined
as a
fore
ign-
owne
d or
exp
ortin
g en
terp
rise
loca
ted
in tr
eatm
ent d
istri
cts.

36
T
able
5: A
vera
ge P
rodu
ctio
n W
orke
r E
mpl
oym
ent p
er E
stab
lishm
ent i
n 19
90 a
nd 1
996
Text
iles,
Foot
wea
r, an
d A
ppar
el
Esta
blis
hmen
ts
Oth
er E
stab
lishm
ents
D
iffer
ence
(1
) (2
) (3
) (4
) (5
) (6
) (7
) (8
) (9
)
Dom
estic
(a
)
A
lway
s Fo
reig
n (b
)
A
lway
s Ex
porti
ng
(c)
Dom
estic
(a
)
A
lway
s Fo
reig
n (b
)
A
lway
s Ex
porti
ng
(c)
(1
)-(4
)
(2)-
(5)
(3
)-(6
)
1. M
ean
Empl
oym
ent i
n 19
90
A
ll A
vaila
ble
Obs
erva
tions
94.8
2 (5
.53)
73
7.75
(9
7.87
) 40
3.64
(4
5.99
) 62
.39
(1.6
0)
288.
67
(24.
43)
399.
60
(24.
71)
43.4
2 (4
.24)
44
9.08
(7
0.26
) 4.
04
(52.
75)
2. M
ean
Empl
oym
ent i
n 19
96
A
ll A
vaila
ble
Obs
erva
tions
90.0
0 (4
.74)
11
26.9
7 (1
09.7
9)
765.
97
(66.
37)
61.6
0 (1
.60)
35
3.50
(1
9.73
) 29
7.14
(1
2.73
) 28
.40
4.08
) 77
3.47
(6
7.44
) 46
8.82
(4
2.65
)
3. C
hang
e in
Mea
n Em
ploy
men
t, 19
90-1
996
-4
.82
(7.3
) 38
9.22
(1
97.7
0)
362.
33
(118
.17)
-0
.79
(2.3
1)
64.8
3 (3
3.99
) -1
02.4
6 (2
6.18
) -4
.03
(4.2
3)
324.
39
(70.
5)
464.
79
(52.
9)
4. C
hang
e in
Mea
n Em
ploy
men
t
Bal
ance
d S
ampl
e (d
)
14.6
9 (1
5.51
) 56
1.99
(2
37.7
6)
432.
67
(143
.82)
12
.17
(4.0
9)
119.
68
(54.
88)
117.
98
(49.
59)
2.48
(5
.3)
442.
3 (9
1.5)
31
4.69
(6
0.0)
5. C
hang
e in
Mea
n Lo
g Em
ploy
men
t,
All
Obs
erva
tions
.03
(.03)
.2
3 (.2
0)
.22
(.10)
-.0
2 (.0
1)
.19
(.08)
-.3
7 (.0
6)
.05
(.02)
.0
4 (.1
1)
.59
(.07)
6. C
hang
e in
Mea
n Lo
g Em
ploy
men
t,
B
alan
ced
Sam
ple
.08
(.05)
.5
4 (.1
7)
.45
(.19)
.0
9 (.0
2)
.30
(.11)
.1
8 (.0
9)
-.01
(.02)
.2
4 (.1
6)
.12
(.12)
N
otes
: Sta
ndar
d er
rors
in p
aren
thes
es
(a) A
pla
nt th
at is
nei
ther
fore
ign-
owne
d no
r exp
orts
the
entir
e pe
riod.
(b
) Inc
lude
s som
e fo
reig
n eq
uity
ove
r the
ent
ire p
erio
d.
(c) E
xpor
ts so
me
shar
e of
out
put o
ver t
he e
ntire
per
iod.
(d
) Def
ined
as e
stab
lishm
ents
pre
sent
in b
oth
1990
and
199
6.
(e) A
vera
ge o
f ann
ual c
hang
es in
est
ablis
hmen
ts p
rese
nt in
bot
h 19
90 a
nd 1
996.
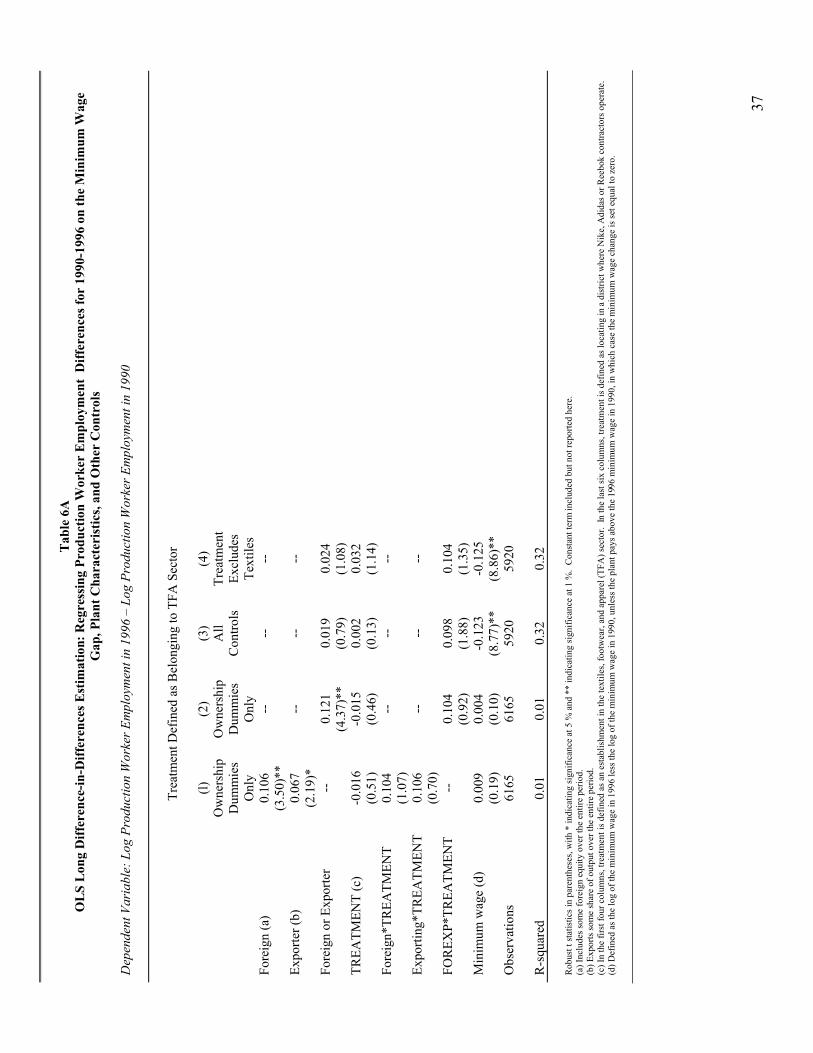
37
T
able
6A
O
LS
Lon
g D
iffer
ence
-in-D
iffer
ence
s Est
imat
ion:
Reg
ress
ing
Prod
uctio
n W
orke
r Em
ploy
men
t D
iffer
ence
s for
199
0-19
96 o
n th
e M
inim
um W
age
Gap
, Pla
nt C
hara
cter
istic
s, an
d O
ther
Con
trol
s
Dep
ende
nt V
aria
ble:
Log
Pro
duct
ion
Wor
ker E
mpl
oym
ent i
n 19
96 –
Log
Pro
duct
ion
Wor
ker E
mpl
oym
ent i
n 19
90
Trea
tmen
t Def
ined
as B
elon
ging
to T
FA S
ecto
r
(l)
O
wne
rshi
p D
umm
ies
Onl
y
(2)
Ow
ners
hip
Dum
mie
s O
nly
(3)
All
Con
trols
(4)
Trea
tmen
t Ex
clud
es
Text
iles
Fore
ign
(a)
0.10
6 --
--
--
(3.5
0)**
Expo
rter (
b)
0.06
7 --
--
--
(2.1
9)*
Fo
reig
n or
Exp
orte
r --
0.
121
0.01
9 0.
024
(4.3
7)**
(0
.79)
(1
.08)
TR
EATM
ENT
(c)
-0.0
16
-0.0
15
0.00
2 0.
032
(0
.51)
(0
.46)
(0
.13)
(1
.14)
Fo
reig
n*TR
EATM
ENT
0.10
4 --
--
--
(1.0
7)
Ex
porti
ng*T
REA
TMEN
T 0.
106
--
--
--
(0
.70)
FOR
EXP*
TREA
TMEN
T --
0.
104
0.09
8 0.
104
(0.9
2)
(1.8
8)
(1.3
5)
Min
imum
wag
e (d
) 0.
009
0.00
4 -0
.123
-0
.125
(0.1
9)
(0.1
0)
(8.7
7)**
(8
.86)
**
Obs
erva
tions
61
65
61
65
5920
59
20
R-s
quar
ed
0.01
0.
01
0.32
0.
32
Rob
ust t
stat
istic
s in
pare
nthe
ses,
with
* in
dica
ting
sign
ifica
nce
at 5
% a
nd *
* in
dica
ting
sign
ifica
nce
at 1
%.
Con
stan
t ter
m in
clud
ed b
ut n
ot re
porte
d he
re.
(a) I
nclu
des s
ome
fore
ign
equi
ty o
ver t
he e
ntire
per
iod.
(b
) Exp
orts
som
e sh
are
of o
utpu
t ove
r the
ent
ire p
erio
d.
(c) I
n th
e fir
st fo
ur c
olum
ns, t
reat
men
t is d
efin
ed a
s an
esta
blis
hmen
t in
the
text
iles,
foot
wea
r, an
d ap
pare
l (TF
A) s
ecto
r. In
the
last
six
colu
mns
, tre
atm
ent i
s def
ined
as l
ocat
ing
in a
dis
trict
whe
re N
ike,
Adi
das o
r Ree
bok
cont
ract
ors o
pera
te.
(d) D
efin
ed a
s the
log
of th
e m
inim
um w
age
in 1
996
less
the
log
of th
e m
inim
um w
age
in 1
990,
unl
ess t
he p
lant
pay
s abo
ve th
e 19
96 m
inim
um w
age
in 1
990,
in w
hich
cas
e th
e m
inim
um w
age
chan
ge is
set e
qual
to z
ero.

38
T
able
6B
OL
S L
ong
Diff
eren
ce-in
-Diff
eren
ces E
stim
atio
n: R
egre
ssin
g Pr
oduc
tion
Wor
ker
Empl
oym
ent
Diff
eren
ces f
or 1
990-
1996
on
the
Min
imum
Wag
e G
ap, P
lant
Cha
ract
eris
tics,
and
Oth
er C
ontr
ols
D
epen
dent
Var
iabl
e: L
og P
rodu
ctio
n W
orke
r Em
ploy
men
t in
1996
– L
og P
rodu
ctio
n W
orke
r Em
ploy
men
t in
1990
Tr
eatm
ent d
efin
ed a
s Ope
ratin
g in
Tre
atm
ent D
istri
cts,
TFA
Ent
erpr
ises
Onl
y
(1)
All
TFA
Fi
rms
(2)
No
Min
imum
W
age
as
a co
ntro
l
(3)
Larg
e Fi
rms
Onl
y
(4)
Foot
wea
r an
d A
ppar
el
Firm
s O
nly
(5)
FA
Ente
rpris
es;
Larg
e Fi
rms
Onl
y
(6)
FA
Ente
rpris
es,
Larg
e Fi
rms
Onl
y
Fore
ign
(a)
--
--
--
--
--
--
Ex
porte
r (b)
--
--
--
--
--
--
Fore
ign
or E
xpor
ter
0.04
4 0.
074
-0.0
12
0.07
7 0.
086
0.11
3
(1.6
9)
(2.3
9)*
(0.6
0)
(1.5
2)
(1.2
2)
(1.7
6)
TREA
TMEN
T (c
) 0.
006
0.01
1 -0
.031
0.
083
0.04
4 0.
059
(0
.16)
(0
.35)
(0
.94)
(3
.07)
* (0
.91)
(1
.21)
Fo
reig
n*TR
EATM
ENT
--
--
--
--
--
--
Ex
porti
ng*T
REA
TMEN
T --
--
--
--
--
--
FOR
EXP*
TREA
TMEN
T 0.
156
0.12
5 0.
162
0.09
1 0.
056
0.02
8
(2.8
7)**
(2
.55)
* (3
.21)
**
(1.1
3)
(0.5
6)
(0.3
4)
Min
imum
wag
e (d
) -0
.179
--
-0
.116
-0
.345
-0
.357
--
(3.9
9)**
(6.0
9)**
(5
.32)
**
(3.5
8)**
Obs
erva
tions
11
23
1123
53
5 50
0 21
4 21
4 R
-squ
ared
0.
47
0.46
0.
54
0.60
0.
66
0.65
R
obus
t t st
atis
tics i
n pa
rent
hese
s, w
ith *
indi
catin
g si
gnifi
canc
e at
5 %
and
**
indi
catin
g si
gnifi
canc
e at
1 %
. C
onst
ant t
erm
incl
uded
but
not
repo
rted
here
. (a
) Inc
lude
s som
e fo
reig
n eq
uity
ove
r the
ent
ire p
erio
d.
(b) E
xpor
ts so
me
shar
e of
out
put o
ver t
he e
ntire
per
iod.
(c
) In
the
first
four
col
umns
, tre
atm
ent i
s def
ined
as a
n es
tabl
ishm
ent i
n th
e te
xtile
s, fo
otw
ear,
and
appa
rel (
TFA
) sec
tor.
In th
e la
st si
x co
lum
ns, t
reat
men
t is d
efin
ed a
s loc
atin
g in
a d
istri
ct w
here
Nik
e, A
dida
s or R
eebo
k co
ntra
ctor
s ope
rate
. (d
) Def
ined
as t
he lo
g of
the
min
imum
wag
e in
199
6 le
ss th
e lo
g of
the
min
imum
wag
e in
199
0, u
nles
s the
pla
nt p
ays a
bove
the
1996
min
imum
wag
e in
199
0, in
whi
ch c
ase
the
min
imum
wag
e ch
ange
is se
t equ
al to
zer
o.

39
T
able
7
T
he Im
pact
of T
reat
men
t on
Oth
er O
utco
mes
(Out
put G
row
th, C
hang
e in
Cap
ital S
tock
, TFP
G, a
nd P
rofit
s)
Dep
ende
nt V
aria
ble
is in
dica
ted
in c
olum
ns b
elow
(1)
Out
put G
row
th
(2)
Out
put G
row
th
(Tex
tiles
, Fo
otw
ear a
nd
App
arel
Onl
y)
(3)
Gro
wth
in
Cap
ital S
tock
(4)
Gro
wth
in
Cap
ital S
tock
(T
extil
es,
Foot
wea
r, an
d A
ppar
el O
nly)
(5)
TFPG
(6
) TF
PG
(Tex
tiles
, Fo
otw
ear,
and
App
arel
Onl
y)
(7)
Cha
nge
in
Prof
its
(8)
Cha
nge
in
Prof
its
(Tex
tiles
, Fo
otw
ear,
and
App
arel
Onl
y)
Fo
reig
n (a
) 0.
038
0.15
6 0.
266
0.02
2 -0
.044
0.
140
0.03
4 -0
.008
(0.9
2)
(2.7
5)**
(4
.09)
**
(0.1
8)
(1.3
2)
(3.3
1)**
(2
.77)
**
(0.5
4)
Expo
rter (
b)
-0.0
10
0.06
6 -0
.111
0.
174
-0.0
20
-0.0
18
-0.0
14
0.03
3
(0.3
9)
(0.6
2)
(2.3
6)*
(1.5
6)
(1.3
8)
(0.2
6)
(1.5
8)
(1.2
1)
TREA
TMEN
T -0
.011
0.
075
0.00
5 0.
174
-0.0
15
0.04
4 0.
006
0.03
5 (c
)
(0.6
7)
(1.9
0)
(0.1
5)
(4.9
8)**
(1
.99)
(2
.03)
(0
.83)
(9
.67)
**
Fore
ign*
0.
100
-0.0
82
-0.2
44
-0.0
77
0.09
5 -0
.172
-0
.062
-0
.05
TREA
TMEN
T
(2.6
2)**
(1
.02)
(2
.67)
**
(0.6
3)
(3.7
7)**
(3
.84)
**
(3.8
0)**
(2
.13)
*
Expo
rting
* 0.
023
-0.0
92
0.13
3 -0
.248
-0
.007
-0
.019
0.
018
-0.0
39
TREA
TMEN
T
(0.5
7)
(0.8
8)
(1.9
0)
(1.6
7)
(0.1
9)
(0.2
5)
(0.8
5)
(1.8
8)
Obs
erva
tions
61
65
1173
61
65
1173
59
20
1123
59
15
1135
R
-squ
ared
0.71
0.79
0.24
0.31
0.05
0.10
0.20
0.28
R
obus
t t st
atis
tics i
n pa
rent
hese
s, w
ith *
indi
catin
g si
gnifi
canc
e at
5 %
and
**
indi
catin
g si
gnifi
canc
e at
1 %
. C
onst
ant t
erm
incl
uded
but
not
repo
rted
here
. Def
initi
ons f
or
TFPG
and
pro
fits g
iven
in T
able
s 1B
&C
. N
otes
: (a
) Inc
lude
s som
e fo
reig
n eq
uity
ove
r the
ent
ire p
erio
d.
(b) E
xpor
ts so
me
shar
e of
out
put o
ver t
he e
ntire
per
iod.
(c
) In
colu
mns
(1),
(3),
(5),
and
(7) t
reat
men
t is d
efin
ed a
s an
esta
blis
hmen
t in
the
text
iles,
foot
wea
r, an
d ap
pare
l (TF
A) s
ecto
r. In
the
othe
r col
umns
(2),
(4),
(6) a
nd (8
) tre
atm
ent i
s def
ined
as l
ocat
ing
in a
dis
trict
whe
re N
ike,
Adi
das o
r Ree
bok
cont
ract
ors o
pera
te.

40
Dep
ende
nt v
aria
ble
is a
dum
my
varia
ble
equa
l to
1 if
the
plan
t exi
ts a
nd e
qual
to z
ero
if th
e pl
ant s
urvi
ves i
n pe
riod
t+1.
All
inde
pend
ent v
aria
bles
are
from
per
iod
t. O
bser
vatio
ns a
re a
nnua
l dat
a ta
ken
from
the
full
unba
lanc
ed p
anel
for 1
990
thro
ugh
1996
. R
obus
t z st
atis
tics i
n pa
rent
hese
s. A
“*”
indi
cate
s sig
nific
ance
at 5
%; *
* si
gnifi
canc
e at
the
1% le
vel.
Rep
orte
d co
effic
ient
s are
the
chan
ge in
the
prob
abili
ty o
f exi
t, ev
alua
ted
at th
e sa
mpl
e m
ean.
All
spec
ifica
tions
incl
ude
the
full
set o
f con
trols
from
the
prev
ious
tabl
es.
(a
) Inc
lude
s som
e fo
reig
n eq
uity
ove
r the
ent
ire p
erio
d. (
b) E
xpor
ts so
me
shar
e of
out
put o
ver t
he e
ntire
per
iod.
(c) I
n co
lum
ns (1
) and
(2) t
reat
men
t is d
efin
ed a
s an
esta
blis
hmen
t in
the
text
iles,
foot
wea
r, an
d ap
pare
l (TF
A) s
ecto
r. In
the
othe
r col
umns
trea
tmen
t is d
efin
ed a
s loc
atin
g in
a d
istri
ct w
here
Nik
e, A
dida
s, an
d R
eebo
k op
erat
e.
Tab
le 8
A
Det
erm
inan
ts o
f Exi
t: Pr
obit
Est
imat
es
1988
-199
6 (C
oeff
icie
nts a
re D
eriv
ativ
es)
Incl
udes
Con
trols
for E
duca
tiona
l Atta
inm
ent o
f Em
ploy
ees
(1
) (2
) (3
) (4
) (5
)
A
ll Fi
rms
Larg
e Fi
rms w
ith
at le
ast
100
empl
oyee
s
TFA
Fi
rms
Onl
y
Larg
e TF
A
Firm
s
Smal
l TF
A
Firm
s
Fo
reig
n (a
) -0
.010
-0
.002
-0
.006
0.
001
-0.0
19
(2
.18)
* (0
.68)
(1
.47)
(0
.16)
(0
.52)
Expo
rter (
b)
0.00
6 -0
.000
0.
001
0.00
0 0.
020
(0
.81)
(0
.11)
(0
.13)
(0
.07)
(1
.34)
TREA
TMEN
T 0.
009
0.01
0 -0
.005
-0
.000
-0
.015
(c
) (4
.48)
**
(3.0
1)**
(0
.77)
(0
.00)
(1
.47)
Fore
ign*
-0
.007
-0
.007
-0
.021
-0
.015
--
TR
EATM
ENT
(0.8
4)
(1.3
0)
(2.0
0)*
(2.6
8)**
Expo
rting
* -0
.005
-0
.002
0.
005
0.00
1 0.
045
TREA
TMEN
T (0
.98)
(0
.59)
(0
.33)
(0
.08)
(3
.48)
**
Cha
nge
in
0.07
5 0.
059
0.08
7 0.
056
0.10
8 M
inim
um
Wag
e (2
.61)
* (3
.37)
**
(2.3
6)*
(2.9
8)**
(1
.96)
*
Obs
erva
tions
81
840
2843
8 15
847
7004
87
48
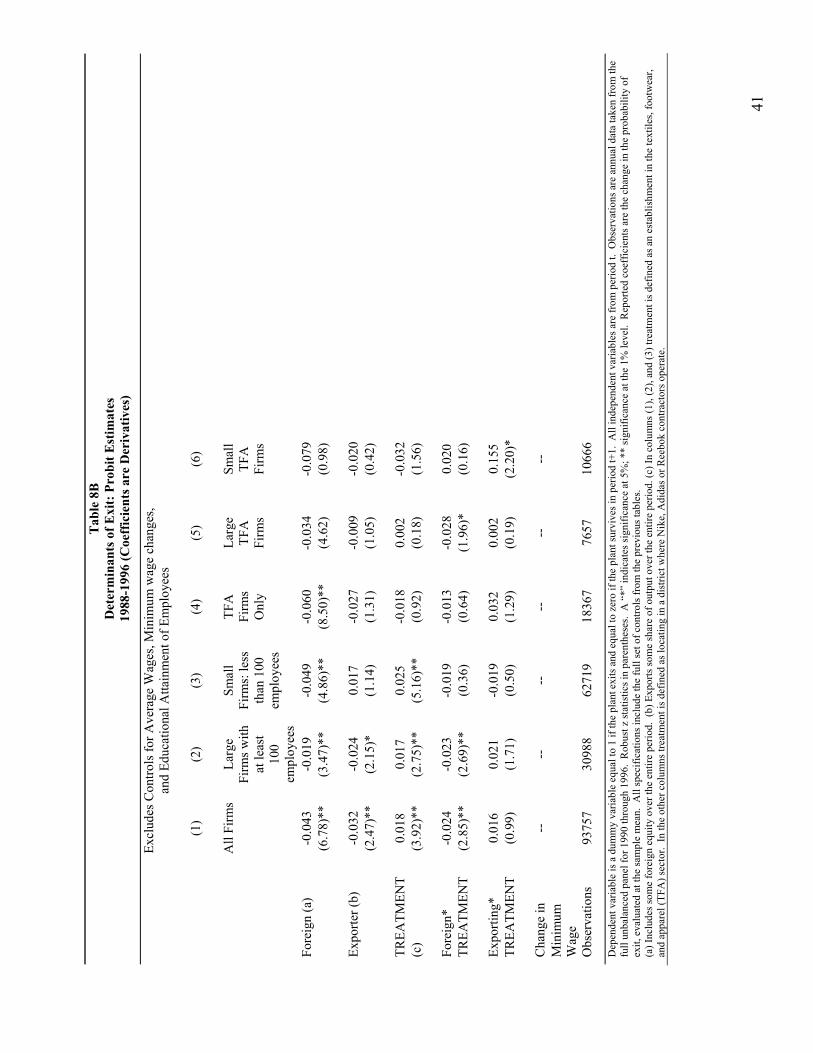
41
Tab
le 8
B D
eter
min
ants
of E
xit:
Prob
it E
stim
ates
19
88-1
996
(Coe
ffic
ient
s are
Der
ivat
ives
)
Ex
clud
es C
ontro
ls fo
r Ave
rage
Wag
es, M
inim
um w
age
chan
ges,
and
Educ
atio
nal A
ttain
men
t of E
mpl
oyee
s
(1
) (2
) (3
) (4
) (5
) (6
)
A
ll Fi
rms
Larg
e Fi
rms w
ith
at le
ast
100
empl
oyee
s
Smal
l Fi
rms:
less
th
an 1
00
empl
oyee
s
TFA
Fi
rms
Onl
y
Larg
e TF
A
Firm
s
Smal
l TF
A
Firm
s
Fore
ign
(a)
-0.0
43
-0.0
19
-0.0
49
-0.0
60
-0.0
34
-0.0
79
(6
.78)
**
(3.4
7)**
(4
.86)
**
(8.5
0)**
(4
.62)
(0
.98)
Expo
rter (
b)
-0.0
32
-0.0
24
0.01
7 -0
.027
-0
.009
-0
.020
(2.4
7)**
(2
.15)
* (1
.14)
(1
.31)
(1
.05)
(0
.42)
TREA
TMEN
T 0.
018
0.01
7 0.
025
-0.0
18
0.00
2 -0
.032
(c
) (3
.92)
**
(2.7
5)**
(5
.16)
**
(0.9
2)
(0.1
8)
(1.5
6)
Fore
ign*
-0
.024
-0
.023
-0
.019
-0
.013
-0
.028
0.
020
TREA
TMEN
T (2
.85)
**
(2.6
9)**
(0
.36)
(0
.64)
(1
.96)
* (0
.16)
Expo
rting
* 0.
016
0.02
1 -0
.019
0.
032
0.00
2 0.
155
TREA
TMEN
T (0
.99)
(1
.71)
(0
.50)
(1
.29)
(0
.19)
(2
.20)
*
Cha
nge
in
--
--
--
--
--
--
Min
imum
W
age
Obs
erva
tions
93
757
3098
8 62
719
1836
7 76
57
1066
6
Dep
ende
nt v
aria
ble
is a
dum
my
varia
ble
equa
l to
1 if
the
plan
t exi
ts a
nd e
qual
to z
ero
if th
e pl
ant s
urvi
ves i
n pe
riod
t+1.
All
inde
pend
ent v
aria
bles
are
from
per
iod
t. O
bser
vatio
ns a
re a
nnua
l dat
a ta
ken
from
the
full
unba
lanc
ed p
anel
for 1
990
thro
ugh
1996
. R
obus
t z st
atis
tics i
n pa
rent
hese
s. A
“*”
indi
cate
s sig
nific
ance
at 5
%; *
* si
gnifi
canc
e at
the
1% le
vel.
Rep
orte
d co
effic
ient
s are
the
chan
ge in
the
prob
abili
ty o
f ex
it, e
valu
ated
at t
he sa
mpl
e m
ean.
All
spec
ifica
tions
incl
ude
the
full
set o
f con
trols
from
the
prev
ious
tabl
es.
(a
) Inc
lude
s som
e fo
reig
n eq
uity
ove
r the
ent
ire p
erio
d. (
b) E
xpor
ts so
me
shar
e of
out
put o
ver t
he e
ntire
per
iod.
(c) I
n co
lum
ns (1
), (2
), an
d (3
) tre
atm
ent i
s def
ined
as a
n es
tabl
ishm
ent i
n th
e te
xtile
s, fo
otw
ear,
and
appa
rel (
TFA
) sec
tor.
In th
e ot
her c
olum
ns tr
eatm
ent i
s def
ined
as l
ocat
ing
in a
dis
trict
whe
re N
ike,
Adi
das o
r Ree
bok
cont
ract
ors o
pera
te.

42
Ta
ble
9 Im
pact
of C
ompl
ianc
e w
ith M
inim
um W
ages
on
Wag
e an
d Em
ploy
men
t Out
com
es
Dep
ende
nt V
aria
ble
is C
hang
e in
Com
plia
nce
with
M
inim
um W
age
Dep
ende
nt V
aria
ble
is C
hang
e in
the
Log
of
Prod
uctio
n W
ages
D
epen
dent
Var
iabl
e is
Cha
nge
in th
e Lo
g of
Pro
duct
ion
Wor
kers
A
ll En
terp
rises
an
d A
ll C
ontro
ls
Text
iles,
Foot
wea
r and
A
ppar
el O
nly
Foot
wea
r and
A
ppar
el O
nly
A
ll En
ter-
pris
es a
nd
All
Con
trols
All
Ente
r-pr
ises
with
at
leas
t 10
0 Em
ploy
ees
Text
iles,
Foot
wea
r, an
d A
ppar
el
Onl
y
Foot
wea
r an
d A
ppar
el
Onl
y
All
Ente
rpris
es
Text
iles,
Foot
wea
r, an
d A
ppar
el
Onl
y
Fore
ign
or E
xpor
ter
0.02
7 0.
082
-0.1
13
-0.0
02
-0.0
68
0.04
4 -0
.130
0.
019
0.04
1 FO
REX
P (a
)
(1.4
3)
(0.9
7)
(1.0
7)
(0.0
8)
(1.6
5)
(1.1
3)
(1.1
8)
(0.8
0)
(1.5
5)
TREA
TMEN
T -0
.105
0.
106
0.00
9 -0
.049
0.
020
0.19
4 0.
239
0.03
0 -0
.026
(b
)
(7.1
4)**
(7
.43)
(0
.48)
(1
.60)
(0
.37)
(2
.62)
* (4
.06)
**
(0.9
7)
(0.2
7)
FOR
EXP*
TREA
TMEN
T 0.
151
0.12
4 0.
371
0.00
7 -0
.047
-0
.021
0.
111
0.00
3 0.
159
(2
.90)
* (1
.47)
(3
.44)
**
(0.0
8)
(0.4
3)
(0.3
1)
(1.1
4)
(0.0
4)
(1.1
0)
Min
imum
Wag
e (c
) -0
.082
-0
.142
0.
027
0.65
9 0.
678
0.69
6 0.
999
-0.1
21
-0.1
97
(1
.10)
(1.2
3)
(0.1
2)
(6.9
5)**
(5
.75)
**
(9.4
6)**
(5
.45)
**
(8.0
0)**
(3
.54)
**
TREA
TMEN
T*M
inim
um
--
--
--
0.02
0 -0
.077
-0
.223
-0
.375
-0
.044
0.
046
Wag
e
(0
.47)
(0
.72)
(3
.57)
**
(3.3
8)**
(1
.58)
(0
.55)
TREA
TMEN
T*
--
--
--
0.l7
7 0.
287
0.16
5 0.
271
0.16
4 -0
.002
FO
REX
P*M
in W
age
(1.6
1)
(2.0
7)*
(6.4
9)**
(2
.67)
* (2
.61)
* (0
.01)
Obs
erva
tions
5875
11
14
494
5920
24
31
1123
50
0 59
20
1123
R-s
quar
ed
0.10
0.
13
0.16
0.
23
0.23
0.
29
0.34
0.
32
0.47
R
obus
t t s
tatis
tics
in p
aren
thes
es, w
ith *
indi
catin
g si
gnifi
canc
e at
5 %
and
**
indi
catin
g si
gnifi
canc
e at
1 %
. C
onst
ant t
erm
incl
uded
but
not
rep
orte
d he
re. C
ompl
ianc
e is
a z
ero-
one
dum
my
varia
ble
equa
l to
one
if th
e es
tabl
ishm
ent’s
ave
rage
pro
duct
ion
wor
ker w
age
is ab
ove
the
dist
rict s
tatu
tory
min
imum
wag
e.
Not
es: (a
) In
clud
es so
me
fore
ign
equi
ty o
r exp
orts
ove
r the
ent
ire p
erio
d (b
) In
col
umns
(1)
, (4)
, (5)
, and
(8)
trea
tmen
t is
defin
ed a
s an
est
ablis
hmen
t in
the
text
iles,
foot
wea
r, an
d ap
pare
l (TF
A)
sect
or.
In th
e re
mai
ning
col
umns
, tre
atm
ent i
s de
fined
as
loca
ting
in a
dis
trict
whe
re N
ike,
A
dida
s or R
eebo
k co
ntra
ctor
s ope
rate
. (c
) D
efin
ed a
s th
e lo
g of
the
min
imum
wag
e in
199
6 le
ss th
e lo
g of
the
min
imum
wag
e in
199
0, u
nles
s th
e pl
ant p
ays
abov
e th
e 19
96 m
inim
um w
age
in 1
990,
in w
hich
cas
e th
e m
inim
um w
age
chan
ge is
set
equ
al to
ze
ro.

43
App
endi
x T
able
1: M
inim
um W
ages
in In
done
sia
1988
-199
9 Y
ear
Con
sum
er
Pric
e In
dex
with
19
96=
100
Min
imum
W
age
in
Nom
inal
V
alue
s
Min
imum
W
age
in
1996
V
alue
s
Min
imum
W
age
in
US
dolla
rs
Exch
ange
R
ate
in
Rup
iahs
pe
r dol
lar
1988
0.
527
351
667
388
1717
19
89
0.56
1 35
5 63
4 35
5 17
87
1990
0.
604
503
833
443
1882
19
91
0.66
1 63
3 95
7 48
4 19
82
1992
0.
711
717
1008
49
2 20
51
1993
0.
780
832
1066
50
9 20
95
1994
0.
846
1193
14
09
652
2160
19
95
0.92
6 14
18
1531
68
4 22
39
1996
1.
000
1560
15
60
644
2348
19
97
1.06
7 16
99
1592
53
9 29
53
1998
1.
680
1963
11
67
118
9875
19
99
2.02
7 23
08
1138
14
6 78
09

44
A
ppen
dix
Tab
le 2
A: F
irm
-spe
cific
and
Dis
tric
t-spe
cific
Det
erm
inan
ts o
f the
Min
imum
Wag
e fo
r 19
90-1
996
Dep
ende
nt V
aria
ble:
Log
of t
he M
inim
um W
age
(1
) (2
) (3
) (4
) (5
)
D
umm
y fo
r Loc
atio
n in
0.
073
0.13
8 0.
073
--
0.10
3 Tr
eatm
ent D
istri
ct
(1.6
9)
(4.2
5)**
(1
.69)
(2.1
0)*
TFA
Sec
tor D
umm
y -0
.006
-0
.000
4 --
-0
.005
-0
.033
(0.2
8)
(0.0
2)
(0
.26)
(1
.13)
O
utpu
t Gro
wth
0.
002
0.00
2 0.
002
0.00
2 0.
004
(1
.28)
(0
.90)
(1
.28)
(1
.28)
(1
.29)
To
tal F
acto
r Pro
duct
ivity
-0
.009
-0
.005
-0
.009
-0
.009
-0
.018
G
row
th
(1.8
4)
(1.0
9)
(1.8
4)
(1.8
5)*
(2.1
9)*
Lag
log
prod
uctio
n w
ages
--
--
--
--
--
W
hole
sale
Pric
e In
dex
-0.0
71
-0.0
74
-0.0
70
-0.0
89
-0.1
51
(1
.70)
(1
.72)
(1
.70)
(2
.46)
**
(2.6
1)**
C
onsu
mer
Pric
e In
dex
0.66
9 0.
802
0.66
0 0.
661
0.69
0
(14.
13)*
* (1
6.03
)**
(14.
15)*
* (1
3.74
)**
(11.
76)*
* Fo
reig
n-ow
ners
hip
-0.0
001
-0.0
001
-0.0
001
0.00
0 0.
000
(0
.49)
(0
.79)
(0
.49)
(0
.31)
(0
.10)
Ex
port
shar
e of
sale
s -0
.000
1 --
-0
.000
1 -0
.000
1 -0
.000
2 (0
to 1
00)
(2.8
2)**
(2.8
2)**
(2
.54)
**
(2.4
6)*
Tarif
fs
--
--
--
--
0.00
1
(0.4
9)
Num
ber o
f Obs
erva
tions
84
,204
89
,247
84
,204
84
,204
42
,047
R
-squ
are
0.61
0.
66
0.61
0.
60
0.62
N
otes
: T-s
tatis
tics
in p
aren
thes
es.
All
regr
essi
ons
estim
ated
taki
ng in
to a
ccou
nt f
ixed
eff
ects
at th
e le
vel o
f th
e in
divi
dual
est
ablis
hmen
t, w
ith e
rror
s cl
uste
red
at th
e di
stric
t lev
el a
nd r
obus
t sta
ndar
d er
rors
. Y
ear
dum
mie
s in
clud
ed in
all
spec
ifica
tions
. Es
tabl
ishm
ent-s
peci
fic d
eter
min
ants
of t
he lo
g m
inim
um w
age
incl
ude
outp
ut g
row
th, t
otal
fact
or p
rodu
ctiv
ity g
row
th a
s de
fined
in T
able
s 1B
&C
, TFA
Sec
tor D
umm
y, p
rodu
ctio
n w
ages
, for
eign
-ow
ners
hip,
and
the
expo
rt sh
are
of sa
les.
In
colu
mn
(5) t
he n
umbe
r of o
bser
vatio
ns is
cut
in h
alf d
ue to
the
fact
that
tarif
f inf
orm
atio
n is
ava
ilabl
e fo
r onl
y ha
lf th
e ob
serv
atio
ns.

45
A
ppen
dix
Tab
le 2
B: F
irm
-spe
cific
and
Dis
tric
t-spe
cific
Det
erm
inan
ts o
f the
Min
imum
Wag
e fo
r 19
90-1
996
Dep
ende
nt V
aria
ble:
Log
of t
he M
inim
um W
age
(1
) (2
) (3
) (4
) (5
)
D
umm
y fo
r Loc
atio
n in
0.
074
0.13
8 0.
073
--
0.10
3 Tr
eatm
ent D
istri
ct
(1.7
0)
(4.2
5)**
(1
.70)
(2.2
0)*
TFA
Sec
tor D
umm
y -0
.006
-0
.000
4 --
-0
.006
-0
.034
(0.2
9)
(0.0
2)
(0
.27)
(1
.15)
O
utpu
t Gro
wth
0.
003
0.00
2 0.
003
0.00
3 0.
005
(1
.58)
(1
.38)
(1
.58)
(1
.58)
(1
.45)
To
tal F
acto
r Pro
duct
ivity
-0
.009
-0
.005
-0
.009
-0
.009
-0
.018
G
row
th
(1.8
1)
(1.0
5)
(1.8
1)
(1.8
2)
(2.1
5)*
Lag
log
prod
uctio
n w
ages
0.
007
0.01
0 0.
007
0.00
7 0.
009
(2
.37)
* (3
.40)
**
(2.3
7)*
(2.3
7)*
(1.4
5)
Who
lesa
le P
rice
Inde
x -0
070
-0.0
73
-0.0
70
-0.0
71
-0.1
50
(1
.69)
(1
.72)
(1
.69)
(1
.68)
(2
.59)
* C
onsu
mer
Pric
e In
dex
0.65
9 0.
800
0.65
8 0.
659
0.68
7
(14.
15)*
* (1
6.08
)**
(14.
17)*
* (1
4.05
)**
(11.
80)*
* Fo
reig
n-ow
ners
hip
0.00
0 0.
000
0.00
0 0.
000
0.00
0
(0.5
1)
(0.8
1)
(0.5
1)
(0.5
1)
(0.1
1)
Expo
rt sh
are
of sa
les
-0.0
001
--
-0.0
001
-0.0
001
-0.0
002
(0 to
100
) (2
.80)
**
(2
.80)
**
(2.7
8)**
(2
.44)
* Ta
riffs
--
--
--
--
0.
0001
(0.4
8)
Num
ber o
f Obs
erva
tions
84
,204
89
,247
84
,204
84
,204
42
,047
R
-squ
are
0.62
0.
67
0.62
0.
81
0.63
N
otes
: T-s
tatis
tics
in p
aren
thes
es.
All
regr
essi
ons
estim
ated
taki
ng in
to a
ccou
nt f
ixed
eff
ects
at th
e le
vel o
f th
e in
divi
dual
est
ablis
hmen
t, w
ith e
rror
s cl
uste
red
at th
e di
stric
t lev
el a
nd r
obus
t sta
ndar
d er
rors
. Y
ear
dum
mie
s in
clud
ed in
all
spec
ifica
tions
. Es
tabl
ishm
ent-s
peci
fic d
eter
min
ants
of t
he lo
g m
inim
um w
age
incl
ude
outp
ut g
row
th, t
otal
fact
or p
rodu
ctiv
ity g
row
th a
s de
fined
in T
able
s 1B
&C
, TFA
Sec
tor D
umm
y, p
rodu
ctio
n w
ages
, for
eign
-ow
ners
hip,
and
the
expo
rt sh
are
of sa
les.
In c
olum
n (5
) the
num
ber o
f obs
erva
tions
is c
ut in
hal
f due
to th
e fa
ct th
at ta
riff i
nfor
mat
ion
is a
vaila
ble
for o
nly
half
the
obse
rvat
ions
.