multiple event analysis of injuries using adaptations …
TRANSCRIPT
REPORT NO
AD
TN98-1
MULTIPLE EVENT ANALYSIS OF INJURIES USING ADAPTATIONS TO
THE COX PROPORTIONAL HAZARDS MODEL
U S ARMY RESEARCH INSTITUTE OF
ENVIRONMENTAL MEDICINE
Natick, Massachusetts
September 1997
19971222 003 f " Approved (or public release: distribution unlimited
UNITED STATES ARMY MEDICAL RESEARCH AND MATERIEL COMMAND

REPORT DOCUMENTATION PAGE Form Approved
OMB No. 0704-0188
Public reporting burden for this collection of information is estimated to average 1 hour per response, including the time for reviewing instructions searching ^< stmq data sources i gathering and maintaining the data needed, and completing and reviewing the collection of information Send comments regarding this burden estimate or an, -;her -ispe't o* 'his " collection of information, including suggestions for reducing this burden, to Washington Headquarters Services. Directorate for Information Operations and Per/ns ' 12 1 5 "je"erson DavisHighway. Suite 1204, Arlington, VA 22202-4302, and to the Office of Management and Budget, Paperwork Reduction Project (0704-0188) Washington ~C 23503
1. AGENCY USE ONLY (Leave blank) 2. REPORT DATE jj 3. RnPORT TYPE AND DATES COVERED
Technical Note 4. TITLE AND SUBTITLE
Multiple event analysis of injuries using adaptations to the Cox proportional hazards model
5. FUNDING NUMBERS
6. AUTHOR(S)
Schneider, Gary A.
7. PERFORMING ORGANIZATION NAME(S) AND ADDRESS(ES)
US Army Research Institute of Environmental Medicine Natick, MA 01760-5007
9. SPONSORING/MONITORING AGENCY NAME(S) AND ADDRESSEES)
US Army Medical Research and Materiel Command Ft. Detrick, Frederick, MD 21702-5012
PERFORMING ORGANIZATION REPORT NUMBER
TN98-1
10. SPONSORING/MONITORING AGENCY REPORT NUMBER
11. SUPPLEMENTARY NOTES
Masters Thesis University of Massachusetts, Amherst School of Public Health and Health Sciences
12a. DISTRIBUTION/AVAILABILITY STATEMENT
Approved for public release; distribution is unlimited.
12b. DISTRIBUTION CODE
13. ABSTRACT (Maximum 200 words) _
Understanding the epidemiology of injuries is of great importance to the United States Military. However, there is presently limited information regarding statistical methodology, as it pertains to a setting where an individual can experience multiple injuries. This thesis explores the use of three statistical models, each with distinctive underlying assumptions, that are commonly used in recurrent failure time settings. Each was applied to the same data set of United States Army Airborne soldiers (n=1214). The outcome of interest was lower extremity or low back injury, and only the first and second injury events were examined. The methods employed were two Cox Proportional Hazards Models, each representing a separate injury event; the Andersen-Gill (AG) Multiplicative Hazards Model, which employs a counting process formulation; and the Prentice, Williams and Petersen (PWP) Model, where the multiple events are modelled via stratification. The final results for the Cox Model to first injury and the first strata of the PWP Model are equivalent. The final AG Model, yielded coinciding covariates to the first injury event in the other models, with minimal differences between the parameter estimates. Similarly, the final Cox Model for the second injury event and the second strata of the PWP Model are equivalent; however, they produce different risk factors than the Cox Model for first event and the first strata of the PWP Model. The comparison of the different methodologies demonstrate that the PWP Model is best suited for the multiple injury setting. The facts that both the baseline hazard and the parameter estimates alter by event, and that it allows for easy comparison between strata (injury events), justifies this claim.
14. SUBJECT TERMS .--——-„ „™,_™,,
airborne, injuries, Cox proportional hazards model I 15. NUMBER OF PAGES
! 62 I IS. P R! C E~CODE~
17. SECURITY CLASSIFICATION OF REPORT
UNCLASSIFIED
N'SN 7540-01-280-5500
18. SECURITY CLASSIFICATION OF THIS PAGE
UNCLASSIFIED
19. SECURITY CLASSIFICATION OF ABSTRACT
UNCLASSIFIED
20. LIMITATION OF ABSTRACT i
) UL i j
Standa'c I'rCbCrioec 2!)«-:j2

MULTIPLE EVENT ANALYSIS OF INJURIES USING ADAPTATIONS TO
THE COX PROPORTIONAL HAZARDS MODEL
A Thesis Presented
by
GARY A. SCHNEIDER
Submitted to the Graduate School of the University of Massachusetts Amherst in partial fulfillment
of the requirements for the degree of
MASTER OF SCIENCE
September 1997
School of Public Health and Health Sciences

1 Copyright by Gary A. Schneider 1997
All Rights Reserved
MULTIPLE EVENT ANALYSIS OF INJURIES USING ADAPTATIONS TO
THE COX PROPORTIONAL HAZARDS MODEL
A Thesis Presented
by
GARY A. SCHNEIDER
Approved as to style and content by:
Carol Bigelow, Chair
Penny Pekow, Member
Harris Pastides, Chair Biostatistics and Epidemiology School of Public Health and Health Sciences
DEDICATION
To the memory of my grandfather, Seymour Samuels, whose unparalleled support, motivation, and non- judgmental attitude has and will continue to be of the utmost influence in all of my accomplishments, no matter how large or small.

ACKNOWLEDGMENTS
I wish to thank the following people:
Dr. Paul Amoroso, for his belief in my capabilities, for providing the opportunity to manage the collection and entry of the data used for this thesis, for bis encouragement on this and other research projects, and for serving on my thesis committee.
Dr. Carol Bigelow, for her constant aid and support during my time as a graduate student at the University of Massachusetts, Amherst, culminating with her acting as the chair of my thesis committee.
Dr. Penelope Pekow, for serving on my thesis committee.
Dr. David Hosmer for his inspirational and educational course on survival analysis at the New England Epidemiology Institute that inspired my thesis topic.
Drs. Bruce Jones, Katy Reynolds, Everett Harmon, Michael Smutok and John Patton for there constant support during my time at USARIEM as well as Michelle Yore and Shari Hallas for their various contributions toward the completion of this thesis.
The student interns and enlisted soldiers who aided in the painstaking tasks of the collection and entry of the data used for this thesis.
And last but not least, my wife, Karen, for her encouragement and for her tolerance while 1 was both in the military and a part time graduate student.
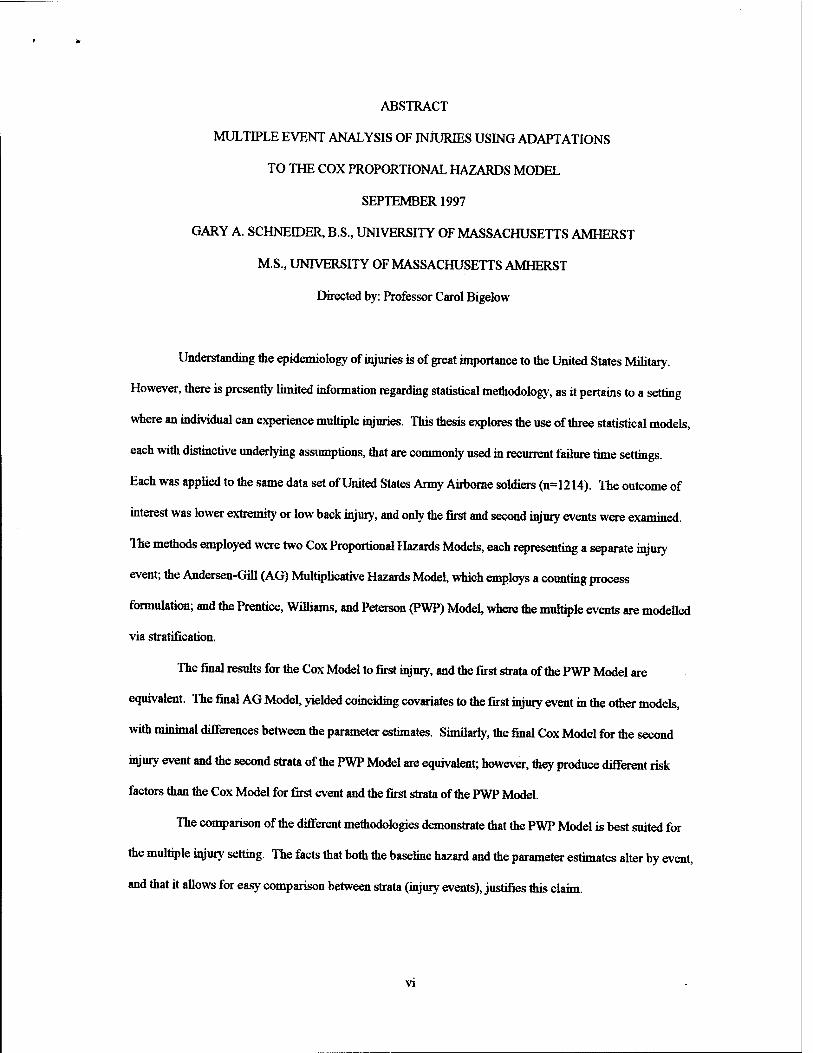
ABSTRACT
MULTIPLE EVENT ANALYSIS OF INJURIES USING ADAPTATIONS
TO THE COX PROPORTIONAL HAZARDS MODEL
SEPTEMBER 1997
GARY A. SCHNEIDER, B.S., UNIVERSITY OF MASSACHUSETTS AMHERST
M.S., UNIVERSITY OF MASSACHUSETTS AMHERST
Directed by: Professor Carol Bigelow
Understanding the epidemiology of injuries is of great importance to the United States Military.
However, there is presently limited information regarding statistical methodology, as it pertains to a setting
where an individual can experience multiple injuries. This thesis explores the use of three statistical models,
each with distinctive underlying assumptions, that are commonly used in recurrent failure time settings.
Each was applied to the same data set of United States Army Airborne soldiers (n=1214). The outcome of
interest was lower extremity or low back injury, and only the first and second injury events were examined.
The methods employed were two Cox Proportional Hazards Models, each representing a separate injury
event; the Andersen-Gill (AG) Multiplicative Hazards Model, which employs a counting process
formulation; and die Prentice, Williams, and Peterson (PWP) Model, where the multiple events are modelled
via stratification.
The final results for the Cox Model to first injury, and the first strata of the PWP Model are
equivalent. The final AG Model, yielded coinciding covariates to the first injury event in the other models,
with minimal differences between the parameter estimates. Similarly, the final Cox Model for the second
injury event and the second strata of the PWP Model are equivalent; however, they produce different risk
factors than the Cox Model for first event and the first strata of the PWP Model.
The comparison of the different methodologies demonstrate that the PWP Model is best suited for
the multiple injury setting. The facts that both the baseline hazard and the parameter estimates alter by event,
and that it allows for easy comparison between strata (injury events), justifies this claim.
VI
TABLE OF CONTENTS
Page
ACKNOWLEDGMENTS
ABSTRACT VI
LIST OF TABLES
LIST OF FIGURES
CHAPTER
1. INTRODUCTION !
2. REVIEW OF THE LITERATURE 3
Preface ., Section 1 - Injury in the Military 4
Background 4 Nonhostile Casualties 5 Disabilities * Hospitalizations -- Outpatient Visits -, Conclusion o
Section 2 - Time Dependant Single Event Analysis Using the Cox Proportional Hazards Model 10
Derivation of the Likelihood : 10
Heuristic of the Cox Proportional Hazards Model ZZZ. 11 The Cox Proportional Hazards Model and the Underlying Partial Likelihood 12
Section 3 - Time Dependent Multiple Event Models 15
The Andersen-Gill Model I5
The Prentice, Williams and Peterson (PWP) Model ZZZZZZZZ. 17
3. METHODS 21
Data Collection -.
Parent File 2- Medical Records 2, Dental Records -4 Physical Fitness Data 24 Personnel Data 2-
DataEnny Database Construction for Failure Time Analysis 26 Analysis ZZZZZZZZZZ... ?8
vu

4. RESULTS 32
E)emographics 32 Injury 33 Failure Time Regression Analyses 37
Cox Model to First Event 38 Cox Model to Second Event 39 Andersen-Gill (AG) Model 41 Prentice Williams and Peterson (PWP) Model 42 Cox Model of Time to Last Injury 42 Proportional Hazards Assumption 45
5. DISCUSSION 49
Comparison of Results 49 Benefits of the PWP Model 51 Benefits of the Cox Model of the Time to Last Injury 54 Comparison of the Multiple Event Models: Summary 54
APPENDIX: SAMPLE OF DATA 59
BIBLIOGRAPHY 61
vui

LIST OF TABLES
Table Page
1. Descriptive Data
2. Injury Events Avaüable for Analyses (I) and Distribution of Multiple Injuries (II) 34
3. Contribution of the Analysis of Time to Event by Battalion 35
4. Injury Type and Diagnosis for Total Lower Extremity/Low Back Musculoskeletal Injuries and by Event (Injury) Number 35
5. Body Part Affected for Total Lower Extremity/Low Back Musculoskeletal Injuries and by Event (Injury) Number 37
6. Parameter Estimates for Final Cox Regression Model: First Injury 39
7. Parameter Estimates for Final Cox Regression Model: Secondlnjury 40
8. Parameter Estimates for Final Andersen-Gill Model 41
9. Parameter Estimates for Final PWP Model 42
10. Crude and Adjusted Parameter Estimates for History of Previous Injury and Other Covariates from Cox Regression Model for Last Injury 44
11. Log-Rank Test for Equality of Survivor Functions for Previous Injury History 44
12. Comparison of Parameter Estimates Between Three Models 49
13. Parameter Estimates for Final and "Comparison" PWP Models 52
14. Log Rank Test for Equality of Survivor Functions between the Two Strata (Injury Events) in the PWP Model 54
15. Comparisons of the Three Methods of Time Dependent Multiple Event Analysis 57
IX

LIST OF FIGURES
Fi^e Page
1. The Army Injury Pyramid g
2. Kaplan-Meier Survivor Estimates of Time to First Injury Event, by Battalion 38
3. Log-Cumulative Hazard Plots for Cox Model to First Injury 46
4. Log-Cumulative Hazard Plots for Cox Model to Second Injury 47
5. Log-Cumulative Hazard Plots for Andersen-Gill Model 47
6. Log-Cumulative Hazard Plots for Cox Model to Last Injury 48
7. Kaplan-Meier Survivor Estimates for the Two Strata (Injury Events) in the PWP Model 53

CHAPTER 1
INTRODUCTION
Individuals in the military, by virtue of their occupation and demographic
profile, are at high risk for injury. The reduction in productivity and economic effects
of injury are profound: however, there is limited understanding regarding associated
risk factors. A recent effort by the Armed Forces Epidemiology Board culminated in
the publication of Injuries in the Military - A Hidden Epidemic This report provides a
comprehensive review of the extent of the injury problem for the United States Military
(Jones and Hanson, 1996). Within this report it is suggested that "previous injury
history" and the "late effects of injury" have an effect on subsequent risk of injury.
These conclusions resulted from review of hospitalization data and results from
epidemiologic risk factor studies in which previous injury history was determined by
self report. Additionally, the two cited epidemiological studies in which previous injury
history was examined have contradictory findings. One suggests that previous injury
history is a risk factor for later injury (Jones et al., 1993). The other suggests a
protective effect (Brodine and Shaffer, 1995). Such disagreement suggests further
inquiry concerning the effect of previous injury on subsequent injury is needed.
Increasing the understanding regarding the effect of previous injury history is therefore
one of the objectives of this thesis.

The most comprehensive way to examine previous injury history as a potential
risk factor for injury would be to prospectively follow a cohort of individuals for a time
interval of adequate duration so that there would be a subgroup of subjects who
experienced two or more injuries. Comprehensive collection of all injury data should
be extracted from the individual's medical record in order to ensure maximum
ascertainment of injury events. There have been no published risk factor studies
conducted on military populations in which previous injury history was determined
from the individual's medical records.
Prospective examination of the population would provide many benefits. Both
type and severity of previous injury could be evaluated, as well as multiple aspects of
the medical care provided. These possible risk factors can be examined concurrently
with previously identified risk factors. Additionally, the effect of elapsed time since
previous injury on subsequent injury can be explored.
Unfortunately, the statistical tools needed for the proper analysis of recurrent
injury data require sophisticated techniques that are largely untested for this purpose.
This is primarily because the addition of the medical record review to assess previous
injury history necessitates the study of a dynamic cohort of individuals, some of which
may not have an injury during the study interval. This analysis is further complicated by
the multiple injury setting. Therefore an additional focus of this thesis is to examine
different analytical approaches to model risk factors for injury in a recurrent event
setting.
CHAPTER 2
REVIEW OF THE LITERATURE
Preface
In order to understand the intricacies of fitting different regression models to
recurrent injury data in military populations, the extent of the injury problem in the
military should first be examined. The first section of the literature review provides the
reader with an appreciation of the magnitude of this problem while providing a sense of
the extent of the surveillance and epidemiologic investigation that has been used to
examine injury in the military.
This is followed by a comprehensive explanation of the Cox Proportional
Hazards Model, which is often used for survival analysis in epidemiologic studies. An
adaption of this model will be one of the three used for the analyses conducted for this
thesis. Specifically, in this analysis, two separate Cox models will be fit. The first will
include the entire cohort and will model time to first injury. The second will include
only those individuals who had an event of interest in the first model and will model
time from first injury to second injury.
The final section of this literature review will focus on the Anderson-Gill
Multiplicative Hazard (AG) Model, and the Prentice, Williams and Peterson (PWP)
Model. These techniques permit the modelling of multiple events per individual within
one regression model. The mechanisms used are a counting process and a stratification
approach in the AG model and PWP model, respectively. In both cases these models
reduce to the single event Cox model in the absence of multiple events.
Section 1 - Injury in the Military
Background
Until recently the extent of the problem of physical injuries in the United States
Military was not widely appreciated. However, in 1994, at the request of the Office of
the Surgeon General of the Army, the Armed Forces Epidemiology Board formed the
Injury Prevention and Control Work Group. The primary objectives of this work
group were to determine how large a problem personal injury in the military is, what
information/databases currently exist that can be used to explore this problem and to
develop strategies to prevent injuries. This work led to the publication of a report
entitled, "Injuries in the Military - A Hidden EpiritW " in November 1996.
Personal injury can vary in severity. Recognizing this, the Injury Prevention and
Control Work Group examined the problem of injury in four primary categories:
nonhostile casualties, disabilities, hospitalizations, and outpatient visits. The following
section of this literature review is a synopsis of only the segments of this report
describing the magnitude of the problem of personal injury in the military in each of
these four categories.

Nonhostile Casualties
During the time interval from 1980 to 1992, the leading cause of nonhostile
(not battle related) casualties in the U.S. Army was physical injury, accounting for 80%
of these deaths. The incidence rate for these "injury related deaths" was approximately
80 individuals per 100,000 person years. The mechanisms for injury were accidents,
suicide, and homicide which were responsible for 62%, 12% and 6% of all nonhostile
casualties, respectively. Illness was the cause of the remaining 20% of nonhostile
casualties. This clearly demonstrates that physical injury, regardless of the mechanism,
is the most prominent cause of non-battle related deaths in the Army.
Disabilities
The extent of the problem of injuries resulting in disability can be best described
by its economic impact. All disability claims are reviewed by a Physical Evaluation
Board (PEB) charged with determining an individuals fitness for continued service.
These decisions are based on input from medical evaluation boards and line of duty
determination reports. The lifetime cost of all new disability claims awarded by Army
PEBs in 1993 is estimated to be 485 million dollars. The annual cost to the
government for individuals receiving either permanent or temporary disability is
immense. In 1990 the cost of disability to the Department of Defense was nearly 1.5
billion dollars. However, individuals often collect disability claims from the Veterans

Administration. This agency has an annual cost of approximately 12 billion dollars for
disability claims (Amoroso, 1997).
Medical complaints associated with musculoskeletal injury constituted the five
leading reasons for disability cases reviewed by Army PEBs in 1994. This accounted
for 16.7% of all disability claims for this year. Between 1989 and 1993 the Navy
conducted approximately 75,000 PEBs, of these 22,125 (29.5%) had ICD-9 codes that
corresponded to either musculoskeletal or injury categories, both of which are likely to
be the result of injury.
Hospitalizations
The lifetime cost of all injuries resulting in hospitalization during 1985 for the
entire United States population is estimated at 80.1 billion dollars. The age group that
is responsible for the largest fraction of this cost is the 15-44 year old group. This cost
of injuries in this age group is approximately twice that of fatal injuries and three times
that of non-hospitalized injuries. While similar data do not currently exist for the
military, the majority of the military is in the 15-44 year old bracket: thus hospitalized
injuries are considered to be a major medical problem in the military.
Desert Storm data suggest that unintentional injury, other acute injuries and
other musculoskeletal conditions accounted for 43% of all hospitalizations during this
operation; there were very few hospitalizations due to combat during Desert Storm.
Approximately 14% of all hospitalizations during Desert Storm were due to

musculoskeletal and connective tissue disorders, many of which were the effects of
previous injury.
The leading causes of injury that resulted in hospitalization among Army active
duty personnel in 1992 were the late effects of injury and athletics/sports-related
injuries. These accounted for 18% and 13.3% of the 15,365 injury-related
hospitalizations that received an external cause code, respectively. There were an
additional 76,423 injury-related hospitalizations to active duty Army personnel that
occurred during 1992, of which the causes are unknown.
Outpatient Visits
Injuries resulting in outpatient medical visits have the largest impact on military
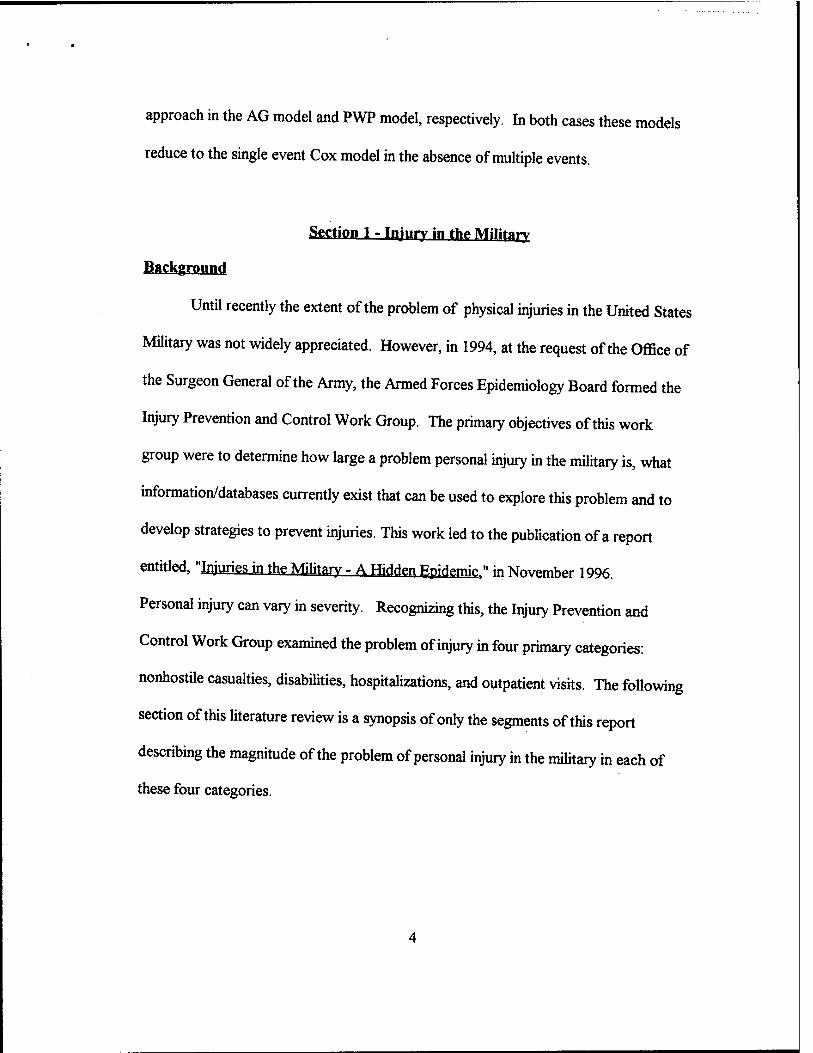
readiness. It is estimated that in 1994 there were 400,000 injury-related outpatient
visits in the Army that resulted in 1.2 million limited duty days. For comparison
purposes, the estimated number of nonhostile deaths, disabilities and hospitalizations
that were the result of injury in the same time interval were 350, 4,500 and 20,000,
respectively (Figure 1). There is not yet a comprehensive source of data in which
injuries that result in outpatient medical visits can be examined. However, the
magnitude of this problem has been studied in epidemiologic studies that have primarily
examined cohorts of soldiers in controlled training environments.
In one such study the extent of the problem of "outpatient injuries" was
compared to "outpatient illnesses" in 124 male and 186 female Army recruits. The
number of injury visits was similar to the number of illness visits, with injury to illness
ratios of 0.8 and 1.1 for males and females, respectively. Injuries, however, resulted in
5.1 times more limited duty days than illnesses for the male recruits, and 21.5 times
more limited duty days in the female recruits (Jones et al. 1988). This illustrates the
magnitude of the problem of outpatient injuries in terms of military readiness in
comparison to other medical complaints.
Most of these studies sought to determine risk factors for injury. While there is
some variation in the results of these studies, some common risk factors have been
identified. The most common of these are lower level physical fitness and lower level
past physical activity. Other agreed upon risk factors are younger age, and selected
behaviors such as cigarette or alcohol use. Other studies suggest that high amounts of
weekly exercise, high running mileage, and previous injury history effect the risk of
injury.
l^OI/NB
Figure 1-The Army Injury Pyramid
Conclusion
As a result of the efforts of the Injury Control Work Group, the Armed Forces
Epidemiology Board recognizes injury as the leading medical problem that effects
military readiness. It recommends that numerous improvements be made in many
aspects of injury surveillance and prevention efforts. This would include the
establishment of a database linking hospitalization, disability and fatality data sources at
a central site and the development of an outpatient surveillance system. Additionally, it
recommends that these systems should be standardized and compatible between the
separate military branches and with civilian surveillance systems. This would in turn
improve the capabilities of injury prevention research, which is recognized as
instrumental in developing an increased understanding of the causes of injury as well as
improving prevention strategies.
Section 2 - Time Dependant Single Event Analysis Using the Cox Proportional Hazards Model
Derivation of the Likelihood
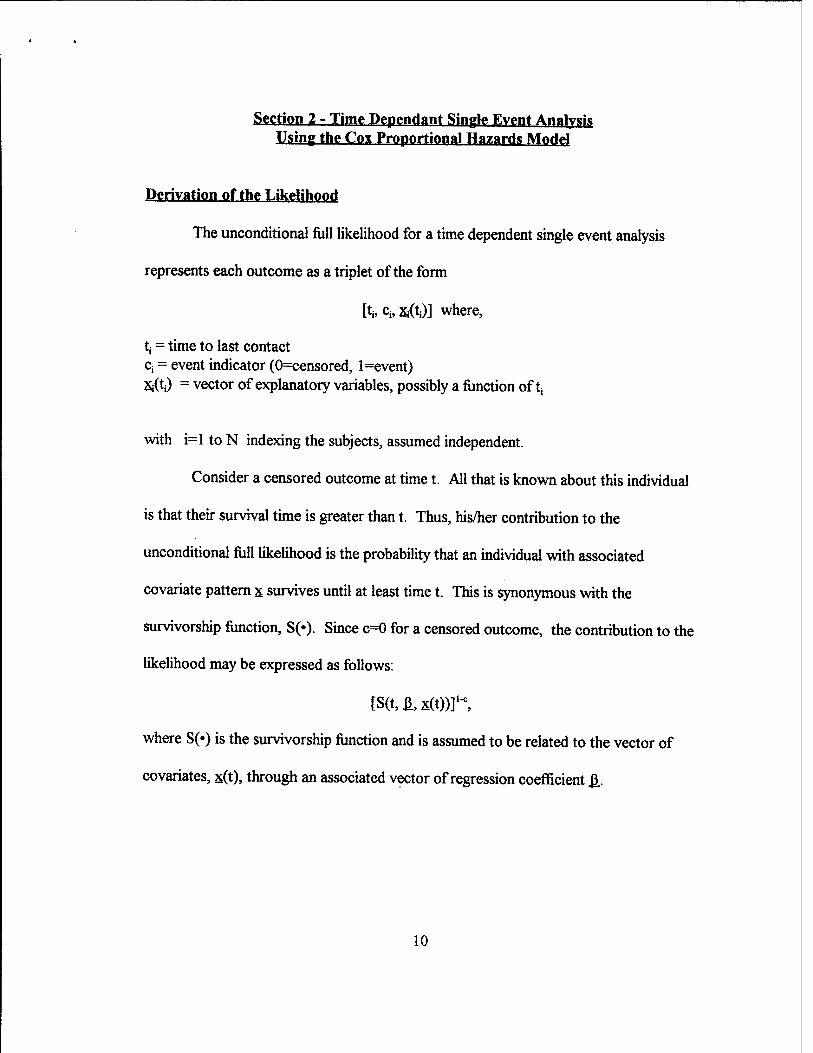
The unconditional full likelihood for a time dependent single event analysis
represents each outcome as a triplet of the form
fc> % XiOi)] where,
tj = time to last contact C; = event indicator (0=censored, l=event) XiOi) = vector of explanatory variables, possibly a function of t;
with i=l to N indexing the subjects, assumed independent.
Consider a censored outcome at time t. All that is known about this individual
is that their survival time is greater than t. Thus, his/her contribution to the
unconditional full likelihood is the probability that an individual with associated
covariate pattern x. survives until at least time t. This is synonymous with the
survivorship function, S(»). Since c=0 for a censored outcome, the contribution to the
likelihood may be expressed as follows:
[S(t, fl. xO))]1«,
where S(«) is the survivorship function and is assumed to be related to the vector of
covariates, s(t), through an associated vector of regression coefficient £.
10

Consider next an actual event occurring at time t. Here, the contribution to the
likelihood is identically the density function, f(«). Thus with c=l for an actual event,
the contribution to the likelihood function becomes the following:
[f(t,.a,x.(t))]c
Again, f(«) is assumed to be related to the vector of covariates, x(t), through an
associated vector of regression coefficients.
For a sample of N individuals, the unconditional full likelihood is the product of
the N independent contributions. Thus,
Uß) = IL-i «ON [S(t, ji. x(t))]'- [f(t, £, X(t))]c
This unconditional full likelihood is completely general. No assumptions have been
made about the form of S(») and fl», the link between x(t) and S(«) and fl», nor the
relationship between the event and censoring mechanisms. Thus, further assumptions
and a model are needed in order to make inferences about ß (Hosmer, 1996).
Heuristic of the Cox Pronortional Hasard« Mortal
Cox's (1972) formulation of the Proportional Hazard Model derives from a
partial likelihood function that conditions on the set of actual event times and exploits
two assumptions:
(1) The censoring mechanism is independent of the event mechanism. (2) The hazard function h(t, £, x.) is linked to the explanatory variables via the model
h(t,£,x) = h0(t)exp[x.(t),£]
where ^(t) is an arbitrary baseline hazard function that is independent of x.(t) for all t.
11
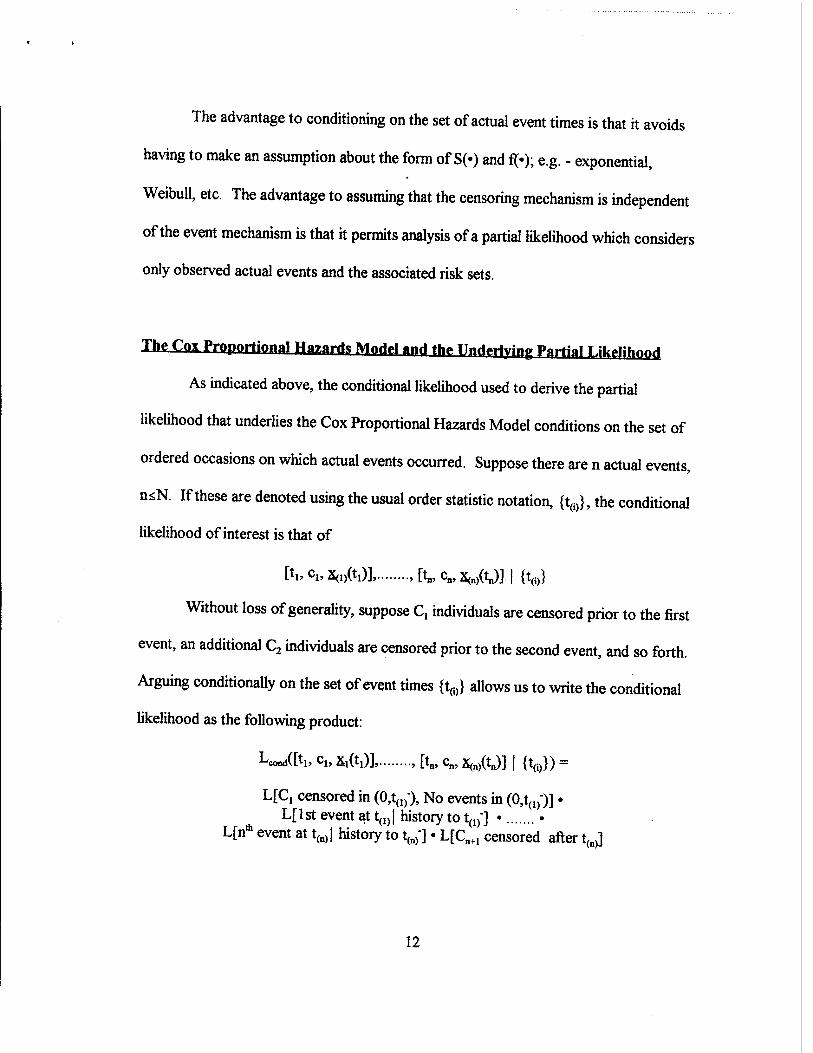
The advantage to conditioning on the set of actual event times is that it avoids
having to make an assumption about the form of S(») and fi»; e.g. - exponential,
Weibull, etc. The advantage to assuming that the censoring mechanism is independent
of the event mechanism is that it permits analysis of a partial likelihood which considers
only observed actual events and the associated risk sets.
The COT Proportional Hazards Mode» and the ünrierivinp Partial F JkoHhn^
As indicated above, the conditional likelihood used to derive the partial
likelihood that underlies the Cox Proportional Hazards Model conditions on the set of
ordered occasions on which actual events occurred. Suppose there are n actual events,
n*N. If these are denoted using the usual order statistic notation, {t(i)}, the conditional
likelihood of interest is that of
[t„ c„ xpjfo)], , [tn, cn, 2^(0] I {t(i)}
Without loss of generality, suppose C, individuals are censored prior to the first
event, an additional C2 individuals are censored prior to the second event, and so forth.
Arguing conditionally on the set of event times {tfl)} allows us to write the conditional
likelihood as the following product:
Lcondtft,, C„ fcft)], , [t,,, Cn, 2^(01 | {t(i)}) =
L[C, censored in (O,^/), No events in (0,t(1/)] • L[ 1 st event at ta) | history to ta)"] • •
Lfn* event at t(n)| history to t(n/] • L[Cn+1 censored after t(n)]
12

where for ease of notation, "history to t(1)"," is shorthand for "no events in (0, ta)'),"
"history to t(2)7' is shorthand for "no events in (0, t(1)'), one event at t(1), no events in
V> t(2)")," etc. Following Andersen et al (1993, page 49), these "histories" are
denoted ^ . Thus •£", represents the available data at time t, and &\- represents the
available data at time t". Thus, the conditional likelihood can be constructed
incrementally over the occasions of censoring and event times by exploiting the
theorem of total probabilities. The first term represents the likelihood of the first Ct
censorings, the second term represents the likelihood of the first event at time t(1),
conditional on the history to time t(1)_, and so on. This is analogous to the lifetable
approach to estimating survival probabilities, Further inspection reveals that this
conditional likelihood contains two types of terms: one corresponding to the occasions
of censoring and the other corresponding to occasions of the actual events. When
these are regrouped, the full conditional likelihood is seen to be of the following form:
Lecrftft,, cu x^t,)], , [t„, cn, UQ] I {t(i)}} =
IIH,on LD* event at time tö) | &iQ;] • r^, ton L[C, censored in (t^, Vl«*W • LfC^, censored at t(n) |^t(n)]
Here the subscript j indexes the n actual event times and by definition, t(0)+= 0.
The Cox Proportional Hazards Model partial likelihood is extracted from the
conditional likelihood by dropping the censoring likelihood terms. Justification is the
assumption that the censoring mechanism is independent of the event mechanism and
that the censoring likelihood terms contain no information about £. We then obtain:
Lift, c„ x.,^)], , [tN, CN, x.N(tN)] I {t&}}vaM = IX.=1 ton Lü* event at time t^l^"]
13

The conditional likelihood, Lfj* event at time tö)| SnQ)'] can then be seen to be
equal to the following:
LI]* event at time tö)| yt0)"] =
Lfj01 event at time t^lj* survives to time tö)'] "J" £u:Rj Lfu* event at time tö)|u* survives to time tö)"]
where Rj is the subset remaining at risk at time t^".
Notice that the assumption of independence of the event and censoring
mechanisms permits replacing the condition" history to time tö)"" with the risk set at
time tfi)", which is denoted Rj. Finally, noting that Lfu"1 event at time tö) | u* survives to
time ta)"] is by definition the hazard function, yields the following partial conditional
likelihood:
LtttLC,,^,)], , [tN, CN, XNON)] I {t(i)}}partial =
IL-1 ton [h(V P, Xj) + Zu:* KV ß, 2Ü3
As in lifetable methods of estimation, censored observations are retained in the
likelihood as long as they are at risk.
Finally, substitution of the Cox Proportional Hazards Model assumption yields:
L{[ti, c,, x»(t,)], , ft,, cn, ^(Ol | {t®}},^ =
Ilri ton { W exp[x.(tö)m] -s- lu:Sj h,^) exp[u(t(j))^]} =
UN*. {expWWfiJ + Eu:Rj exptuCt^'fi]}
Maximum likelihood based inference for Q. is based on this function.
14
Section 3 - Time Dependent Multiple Event M^ffr
The Anderson-Gill Mnripi
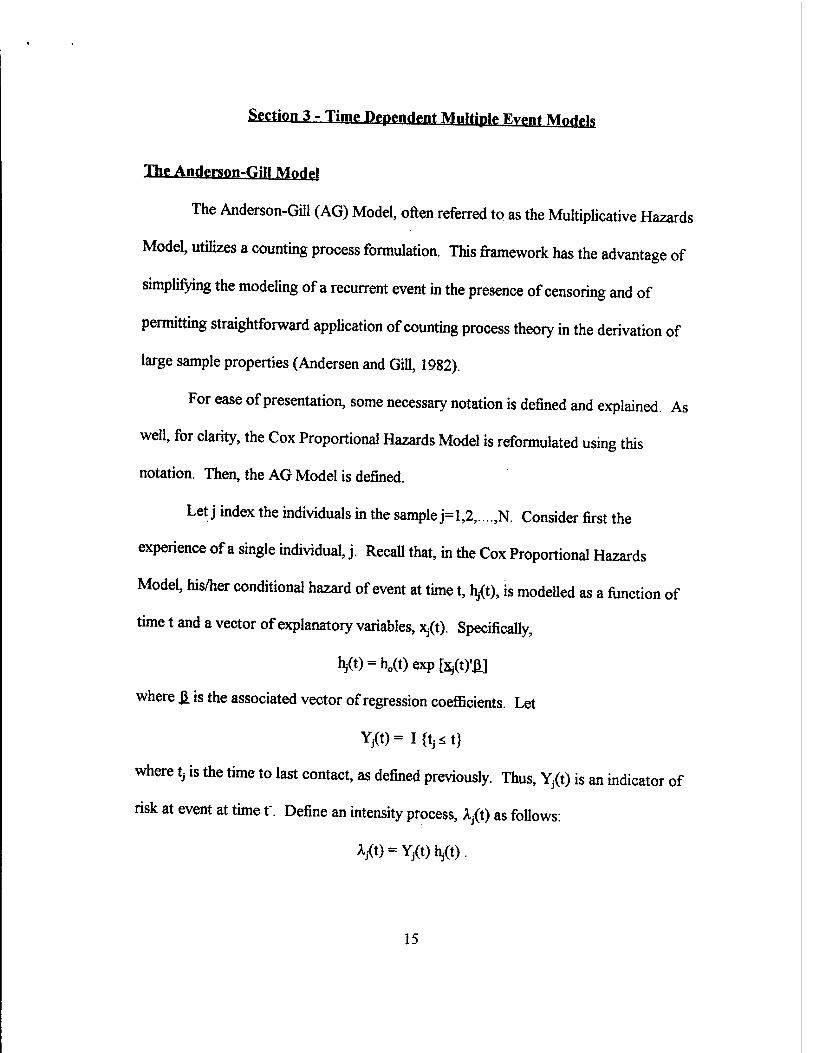
The Anderson-Gill (AG) Model, often referred to as the Multiplicative Hazards
Model, utilizes a counting process formulation. This framework has the advantage of
simplifying the modeling of a recurrent event in the presence of censoring and of
permitting straightforward application of counting process theory in the derivation of
large sample properties (Andersen and Gill, 1982).
For ease of presentation, some necessary notation is defined and explained. As
well, for clarity, the Cox Proportional Hazards Model is reformulated using this
notation. Then, the AG Model is defined.
Let j index the individuals in the sample j=l,2,....,N. Consider first the
experience of a single individual, j. Recall that, in the Cox Proportional Hazards
Model, his/her conditional hazard of event at time t, h/t), is modelled as a function of
time t and a vector of explanatory variables, x/t), Specifically,
hj(t) = h0(t)expfcj(t)'.&]
where £ is the associated vector of regression coefficients. Let
Yj(t)=I{tj^t}
where t, is the time to last contact, as defined previously. Thus, Y/t) is an indicator of
risk at event at time f. Define an intensity process, A/t) as follows:
Aj(t) = Yfi) hj(t).
15
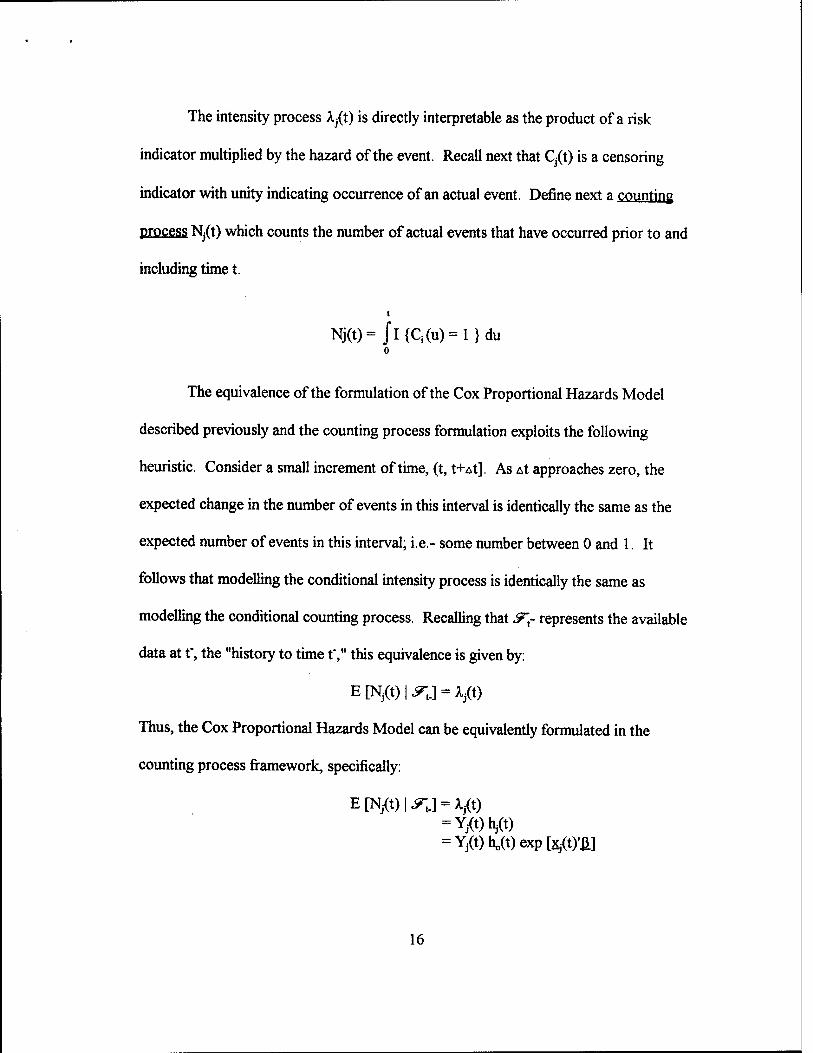
The intensity process A,j(t) is directly interpretable as the product of a risk
indicator multiplied by the hazard of the event. Recall next that C/t) is a censoring
indicator with unity indicating occurrence of an actual event. Define next a counting
process Nj(t) which counts the number of actual events that have occurred prior to and
including time t.
t
Nj(t)= Jl{Ci(u)=l}du 0
The equivalence of the formulation of the Cox Proportional Hazards Model
described previously and the counting process formulation exploits the following
heuristic. Consider a small increment of time, (t, t+At]. As At approaches zero, the
expected change in the number of events in this interval is identically the same as the
expected number of events in this interval; i.e.- some number between 0 and 1. It
follows that modelling the conditional intensity process is identically the same as
modelling the conditional counting process. Recalling that &~r represents the available
data at t", the "history to time t",M this equivalence is given by:
EtN/Ol^y-A/t)
Thus, the Cox Proportional Hazards Model can be equivalently formulated in the
counting process framework, specifically:
= Y/t) h/t) = Yj(t)hc(t)exp[xj(t)
,£]
16

In this thesis, the AG Model that is considered is an extension of this model to
the setting where a person can experience 0, 1, or 2 events. The AG model has the
same definition. Specifically.
E [N/t) | ^.] = Y/t) h^t) exp foCtyji]
The distinction between the AG Model and the Cox Proportional Hazards Model is
that, in the AG model, ^"t. captures possibly one or more prior events (Andersen et al.,
1993).
Implicit in this AG Model are three strong assumptions:
1) multiple event times for a single individual are mutually independent; 2) the baseline hazard does not vary by event; and 3) the values of the regression parameters do not vary by event.
Let i index the n actual event times {t;: i=l,2,....,n}. In a sample of N
individuals in which there are n^N actual events occurring at times tjit2i t„, the
partial likelihood that is to be maximized is given by :
LAG(£.) = IU«on IIi-itoNUYjCtOexpb^lO'ß]}^!,,:« {YftfcKptofid'M
Where Rj is the risk set at time tf (Andersen and Gill, 1982).
The Prentice. Williams and Peterson fPWPl Model
The Prentice, Williams, and Peterson (PWP) Model is an alternative to the Cox
Proportional Hazards Model that has less stringent assumptions than the AG Model.
Specifically, it allows both the baseline hazard and the values of the regression
parameters to vary by event. This is accomplished through the use of stratification.
17
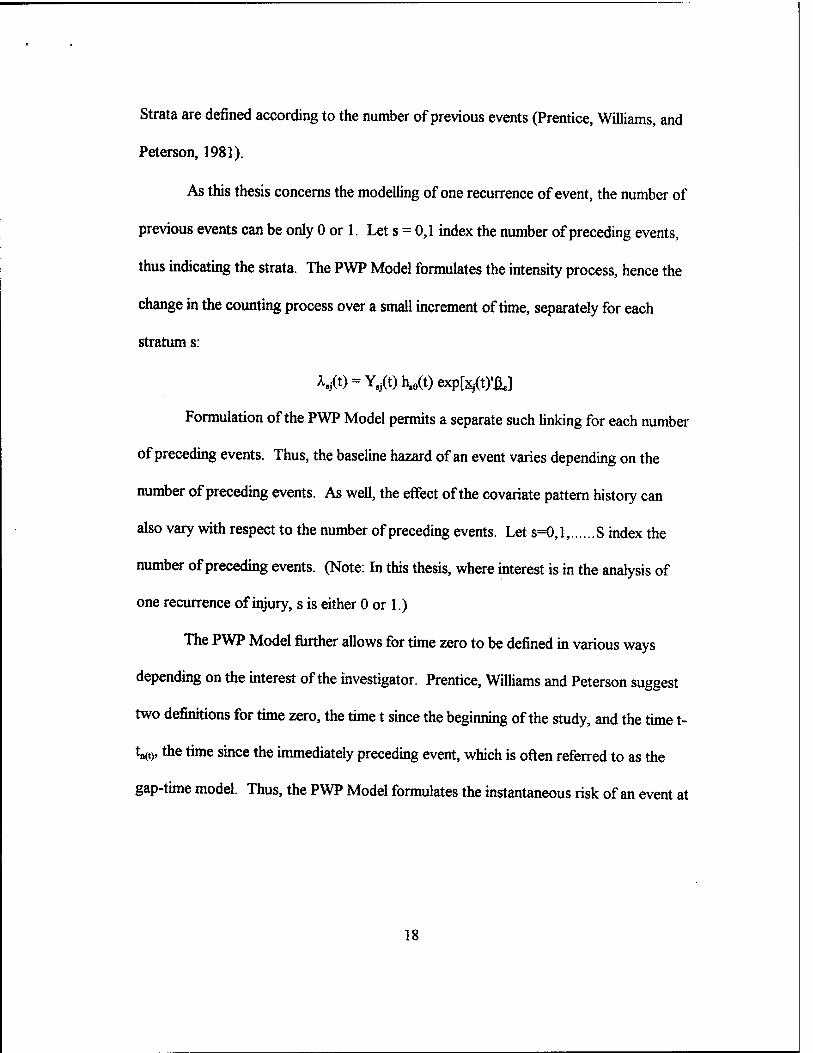
Strata are defined according to the number of previous events (Prentice, Williams, and
Peterson, 1981).
As this thesis concerns the modelling of one recurrence of event, the number of
previous events can be only 0 or 1. Let s = 0,1 index the number of preceding events,
thus indicating the strata. The PWP Model formulates the intensity process, hence the
change in the counting process over a small increment of time, separately for each
stratum s:
A./t^Y./Oh.o^exptx/ty&j
Formulation of the PWP Model permits a separate such unking for each number
of preceding events. Thus, the baseline hazard of an event varies depending on the
number of preceding events. As well, the effect of the covariate pattern history can
also vary with respect to the number of preceding events. Let s=0,1, S index the
number of preceding events. (Note: In this thesis, where interest is in the analysis of
one recurrence of injury, s is either 0 or 1.)
The PWP Model further allows for time zero to be defined in various ways
depending on the interest of the investigator. Prentice, Williams and Peterson suggest
two definitions for time zero, the time t since the beginning of the study, and the time t-
Wtne time since the immediately preceding event, which is often referred to as the
gap-time model. Thus, the PWP Model formulates the instantaneous risk of an event at
18

time t as a function of the number of events history and the covariate pattern history as
follows:
h(t. ß, x(t) | n(t)=s) = h08(t)exp(x.(t)'&) and h(t, ß, x(t) | n(t>=s) = hfa(t-tB<H)expG£(t)'JU
for the time since the beginning of the study and the time since the immediately
preceding event respectively, where,
s=0,1... S = the number of preceding events hos(t) and h^t-t^) = the corresponding baseline hazard functions for the two possible
time scales 0* = the vector of stratum specific regression coefficients.
The formulation of the PWP Model is most easily understood in the context of
the derivation of the Cox Proportional Hazards Model. Recall first the Cox
proportional Hazards Model link of the hazard function, h(»), to the explanatory
variables x. and the associated regression parameters Q.:
h(t,a,x) = h0(t)exp[2c(t)^]
Recall next that the partial likelihood for the Cox Proportional Hazards Model
is defined:
LP»1ial = IL-llon {«pkO^'ß] + £n:Rj expfotft^'Ji] }
The PWP Model adapts this partial likelihood, employing the stratification of number
of previous events, where all individuals in a given strata are homogeneous with respect
19

to the number of preceding events. The corresponding partial likelihood equation for
the time since the beginning of the study is therefore:
Lpwpi = EU to s IL-i to a» (exp&kOJ'ßJ -*- £u e mK oexp^tj'^]} where,
d8 = number of actual events occurring in the s* stratum defined by the number of preceding events.
R(t8k) = the subset at risk in the s* stratum just prior to time tsk.
For the gap-time choice of time scale, the PWP partial likelihood is expressed:
Lpwp2 = H=o to s IL-i to * {expfekCtJ'^,] -5- £u 6 R(vsk, s)exp[2Su(^"u+vJ'^]} where,
&~u = the last failure time on subject u prior to entry into stratum s. v8k = the gap time from the immediately preceding event.
Maximum likelihood based inference for & are based on these partial likelihood
equations.
20
CHAPTER 3
METHODS
Data Collection
The objective of this study was to collect retrospective data from a variety of
sources on a dynamic population of Army Airborne soldiers in order to conduct a
comprehensive morbidity evaluation. In order to accomplish this a relational database
was designed and tested using Epilnfo prior to data collection. A parent file was
constructed during October 1994 by obtaining an electronic roster of one brigade in the
82nd Airborne (n=2147) from the 82nd Airborne headquarters. A four digit unique
identifier was created for each individual.
Abstraction of study data occurred during seven trips that occurred between
November 1994 and March 1996. Different data sources were housed in different
locations. Information in the Annual Health Questionnaires for Dental Treatment was
located in the dental clinic: however, each battalion had its own medical clinic where
individual medical records were located. Army Physical Fitness Test (APFT) score
cards were housed in the company area, of which there were five per battalion.
Data were abstracted by making photocopies of each individuals' record from
each data source. These photocopied records were then entered into Epilnfo and
linked electronically to the parent file via the four digit unique identifier. Data sources
were each individuals' outpatient medical records, Annual Health Questionnaire for
Dental Treatment, and APFT score card. Additionally, demographic data were
21
extracted from the Total Army Injury and Health Outcomes Database (TAIHOD).
Details on the data collection for each data source are given below.
Parent File
The parent file was constructed during October 1994 by obtaining an electronic
roster of one brigade in the 82nd Airborne (n=2147). This brigade consisted of three,
671-person, battalions and a 134-person headquarters company. The original intent of
this research was to conduct a comprehensive morbidity evaluation of the entire
brigade: however logistical, budgetary and personnel constraints forced the medical
record reviews to be conducted on only two battalions (n=1342). Therefore the
available size of the parent file was limited to the individuals in these two battalions.
The dynamic nature of this population made it necessary to make some changes
in the target population. Ninety-four (n=94) subjects were added to the parent file
because information was found on these persons from at least one of the data sources.
There were 162 subjects for whom data were unavailable from all data sources. These
subjects were considered "non-arrivals" and were thus deleted from the parent file.
This further reduced the functional size of the parent file (n=1274).
For the calculation of survival times, a roster of each individual's arrival date to
the brigade was constructed by the Brigade Headquarters during March 1995. This
enabled the calculation of each subject's time contribution to the study as the number of
days between an individual's arrival date and January 31, 1995, the last day of the study
22

interval. Each individual's time contribution was limited by the length of the medical
record review which was 396 days (13 months) for first battalion and 549 days (18
months) for second battalion. If an individual's arrival date occurred prior to the
beginning date of the medical record review, their person time was truncated to the
maximum allotted for their respective battalion. The arrival date to the brigade was
available on all but 60 (4.7%) of the 1274 individuals on the parent file. Thus, the final
analysis sample size for this thesis is n=1214.
Medical Records
The original intent of a February 1995 data collection trip was to conduct
outpatient medical record reviews on the entire brigade for the 18 month interval,
ending on January 31, 1995. However, logistical, budgetary and personnel constraints
limited the review of the medical records to 2 of the 3 battalions. Additionally, the
medical record review of one of these battalions was limited to 13 months.
Information specific to a medical problem was recorded on a pre-designed data
collection form that included diagnosis; body part, if an injury, or physiological system,
if an illness; number of follow-up visits; and highest level of medical provider seen for
the problem.
Nine hundred-eighty (n=980, 80.7%) individuals' medical records were
reviewed of the 1214 subjects in the functional parent file, during February 1995. An
additional 185 (15.2%) of the medical records were reviewed during one of four data
23

collection trips that occurred between March and July of 1995, yielding a total of 1165
(96.0%) reviewed medical records.
Dental Record,«
Within each individual's dental record is a Health Questionnaire for Dental
Treatment that is updated annually at the time of the individual's dental checkup. This
questionnaire consists of 33 questions in which the individual can answer yes, no, or
unknown. Two of these questions pertain to cigarette use and alcohol use and were
the primary reason for abstracting these data.
One thousand five hundred ninety (n=l,590) dental questionnaires, representing
approximately 74.0% of the brigade, were initially collected in November 1994. An
additional 398 (18.5% of the brigade) dental questionnaires were found during one of
four additional data collection trips between February and July of 1995, yielding a total
of 1988 collected dental questionnaires. Of the 1214 subjects in the functional parent
file, dental questionnaire data were collected on 1163 (95.8%).
Physical Fitn«^ ^atn
The APFT score card is maintained for each individual at the company level.
The APFT consists of a 2-minute timed push-up test, a 2-minute timed sit-up test and a
2-mile timed run. In addition to these data, information regarding the individual's
height and weight are typically recorded on the APFT score card.
24

One thousand three hundred eighty three (n=l,383) APFT score cards,
representing approximately 64.4% of the brigade, were initially collected in November
1994. An additional 262 APFT score cards (21.6% of the functional cohort) were
found for individuals in either first or second battalions during one of three data
collection trips between May 1995 and March 1996, yielding a total of 1645 collected
APFT score cards. Of the 1214 subjects in the functional parent file, APFT score
cards were collected on 1019 (83.9%).
The 1214 subjects in the functional parent file represent ten companies, each of
which apparently had a different operating procedure regarding the recording of
individuals' height and weight at the time of the APFT. Some recorded this information
on the APFT score card, while some companies constructed separate rosters of these
data. Of the 1214 subjects in the functional parent file, height and weight data were
collected on 799 (65.8%).
Personnel Data
The Defense Manpower Data Center (DMDC) has been building a historical
archive on all active duty soldiers since 1974. This database primarily contains
demographic information on each individual. Much of these data were not available at
either the brigade, battalion or company level on the population being studied and were
thus extracted from this database. This personnel data is one of six databases that have
been merged at the individual level to create TAIHOD (Amoroso, 1997). Of the 1214
25

subjects in the functional parent file, personnel files were successfully abstracted on
1202 (99.0%).
Data Entry
The medical review forms and the photocopied records from the dental
questionnaires, jump logs and physical fitness score cards were entered into a pre-
designed data entry system. After a computerized search for a subject within the parent
file, a menu was utilized directing the data clerk to the appropriate data entry screen.
The relevant data were entered and the data clerk returned to the parent file where a
search could be conducted on the next individual. All data were entered in this manner
two times, by two different individuals. After data entry was complete for a specific
data source, the two entries of the data were compared electronically via either Epilnfo
or SAS®. Discrepancies between the two data entries were corrected by checking the
photocopy of the original data source.
Database Construction for Failure Time Analysis
The primary objective of this research was to investigate the risk factors for
injury in the recurrent event setting. For this thesis interest is on injuries that occurred
to either the lower extremity or low back and that were musculoskeletal (not poisoning
or environmental) in nature, as these were the most common category of injury in the
study population. As well, we were specifically interested in investigating if an injury
26

to a specific body part, increased the risk of a subsequent injury to either the same or
adjacent body part. Five models were compared
1) Cox Proportional Hazards Model of the time of the first injury event 2) Cox Proportional Hazards Model of the time of the first injury event to
the time of the second injury event. 3) Prentice, Williams, and Peterson (PWP) Model of recurrent events in the
two event setting. 4) Andersen-Gill Multiplicative Hazards (AG) Model of recurrent events in the
two event setting. 5) Cox Proportional Hazards Model of the time of the last injury event.
Potential explanatory variables were extracted from the dental questionnaires,
physical fitness score cards and personnel data sources. Self reported binary data
regarding cigarette and alcohol use were taken from the dental questionnaire. The
continuous variables corresponding to an individual's performance in the 2-minute
timed push-up test, 2-minute timed sit-up test and 2-mile timed run were extracted
from the physical fitness score card. Additionally, body mass index, a measure of body
density, was calculated from each individual's anthropometric data.
Using the demographic information from the TAIHOD, age at entry to the
study was calculated and was used as a covariate in the Cox Model for first injury
event, the Cox model for final injury, the first stratum (first injury event) in the PWP
model, and in the AG Model. Age at day of the first injury was also calculated, and
was used as a covariate in the Cox Model for second injury and the second stratum
(second injury event) in the PWP Model. A binary variable describing marital status
and design variables, representing ethnicity were also constructed from the TAIHOD.
27

The referent group for ethnicity was Caucasian, and the design variables were
representative of Blacks, Hispanics, and Other Ethnicity.
Selected potential explanatory variables were extracted from the medical
records and were used in both the Cox Model for second injury and the second stratum
(second injury event) in the PWP Model. These included type of first injury and
highest level of medical provider seen. They were not used in the models specific to
the first injury event because this information were measures of the sequelae of the first
injury. We note that these variables could not be implemented in the AG Model
because this model does not allow the list of covariates to differ by event.
A binary variable describing previous injury history during the study interval
was created for the Cox Model for last injury.
Analysis
Preliminary analysis included the calculation of descriptive data for both the
potential explanatory variables and the outcome of interest. Means and standard
deviations were calculated for all continuous variables. Frequency and relative
frequency distributions were computed for all discrete variables. The number of total
traumatic, overuse, and unspecified pain injuries were calculated, as well as the number
of specific injury diagnosis (i.e. fracture) in each of these groups. This information was
also calculated separately for the first and second injury events. Chi-square tests were
performed to test the differences in the proportion of injury type and specific diagnosis
28
between the first and second injury events. Similarly, the number of injuries to specific
body parts were calculated, and chi-square tests were performed to test the differences
in the proportion of affected body parts between the first and second injury
events.
We hypothesized that the differing length of follow-up between the two
battalions might necessitate that all regressions be stratified by battalion. Therefore,
prior to model building, Kaplan-Meier estimates of the survivor function, as well as
log-rank tests were computed to determine if there were significant differences in these
distributions by battalion.
The approach used for model building was similar for all three models. A
stepwise procedure was implemented so that the number of independent variables
would be reduced to only those that may be statistically significant. The stepwise
procedure implemented a p-value for entry at 0.25 and a p-value for removal at 0.80.
The high p-value for removal was used so that potential confounders would not be
prematurely removed from the analysis. If a design variable remained in the model
after the execution of the stepwise procedure, all design variables associated with the
original categorical variable were retained. Starting with the remaining independent
variable with the largest Wald Chi-square p-value, variables were individually removed
from the model. The log-likelihood test was implemented to determine model
improvement. If the removal of a variable created a change of greater than 20% to the
coefficient of another covariate, that variable was considered to be a confounder and
29
was retained in the model. Design variables associated with a single categorical
variable that were non-significant and non-confounding were removed from the model
as a group. After ascertainment of the best main effects model, the scale of continuous
variables was assessed using smoothed scatter plots of the Martingale residual for the
model against the continuous variable of interest. Clinically plausible interactions were
explored and added to the model if statistically significant.
After the best model was determined for each analysis of interest, the
proportional hazards assumption was tested for each predictor in each model. The
proportional hazards assumption was tested by adding a variable representing the
interaction of the predictor with the logarithm of the time. Significance levels less than
0.05 suggested tentatively a violation of the proportional hazards assumption. For
predictors violating the proportional hazards assumption according to this test, a log-
cumulative hazard plot, a plot of the negative logarithm of the estimated survivor
function against the logarithm of the survival time, was constructed (Collett, 1994). In
order to construct these plots for continuous variables, the variable was divided into
quartiles. Near parallel curves suggested that the violation of proportionality was not
severe and could be reasonably ignored.
In developing a Cox Model of the time to last injury, we sought to determine if
previous injury history within the study interval was a risk factor for subsequent
history. Initially, a crude hazard ratio was calculated by having only the variable
representing previous injury history as a dependant variable. This hazard ratio was then
30
adjusted with respect to explanatory variables that were significant in either the Cox
Model to first event, the Cox Model to second event, the PWP Model, or the AG
Model. The rational for this alternative approach to model development was to
calculate the increased risk for injury that was attributable to having a recent (within
the study interval), previous injury. Additionally the effect of previous injury history on
predictors from the other models could be examined.
31
CHAPTER 4
RESULTS
Demographics
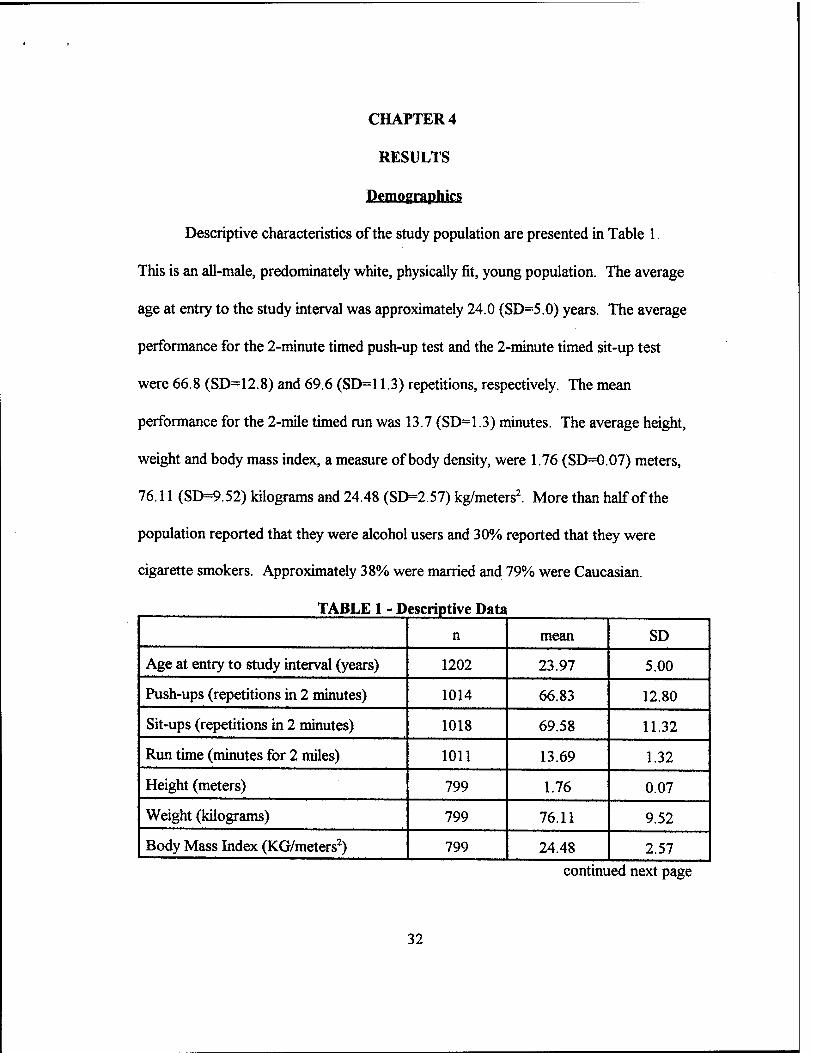
Descriptive characteristics of the study population are presented in Table 1.
This is an all-male, predominately white, physically fit, young population. The average
age at entry to the study interval was approximately 24.0 (SD=5.0) years. The average
performance for the 2-minute timed push-up test and the 2-minute timed sit-up test
were 66.8 (SD=12.8) and 69.6 (SD=11.3) repetitions, respectively. The mean
performance for the 2-mile timed run was 13.7 (SD=1.3) minutes. The average height,
weight and body mass index, a measure of body density, were 1.76 (SD=0.07) meters,
76.11 (SD=9.52) kilograms and 24.48 (SD=2.57) kg/meters2. More than half of the
population reported that they were alcohol users and 30% reported that they were
cigarette smokers. Approximately 38% were married and 79% were Caucasian.
TABLE 1 - Descriptive Data
n mean SD
Age at entry to study interval (years) 1202 23.97 5.00
Push-ups (repetitions in 2 minutes) 1014 66.83 12.80
Sit-ups (repetitions in 2 minutes) 1018 69.58 11.32
Run time (minutes for 2 miles) 1011 13.69 1.32
Height (meters) 799 1.76 0.07
Weight (kilograms) 799 76.11 9.52
Body Mass Index (KG/meters2) 799 24.48 2.57
continued next page
32
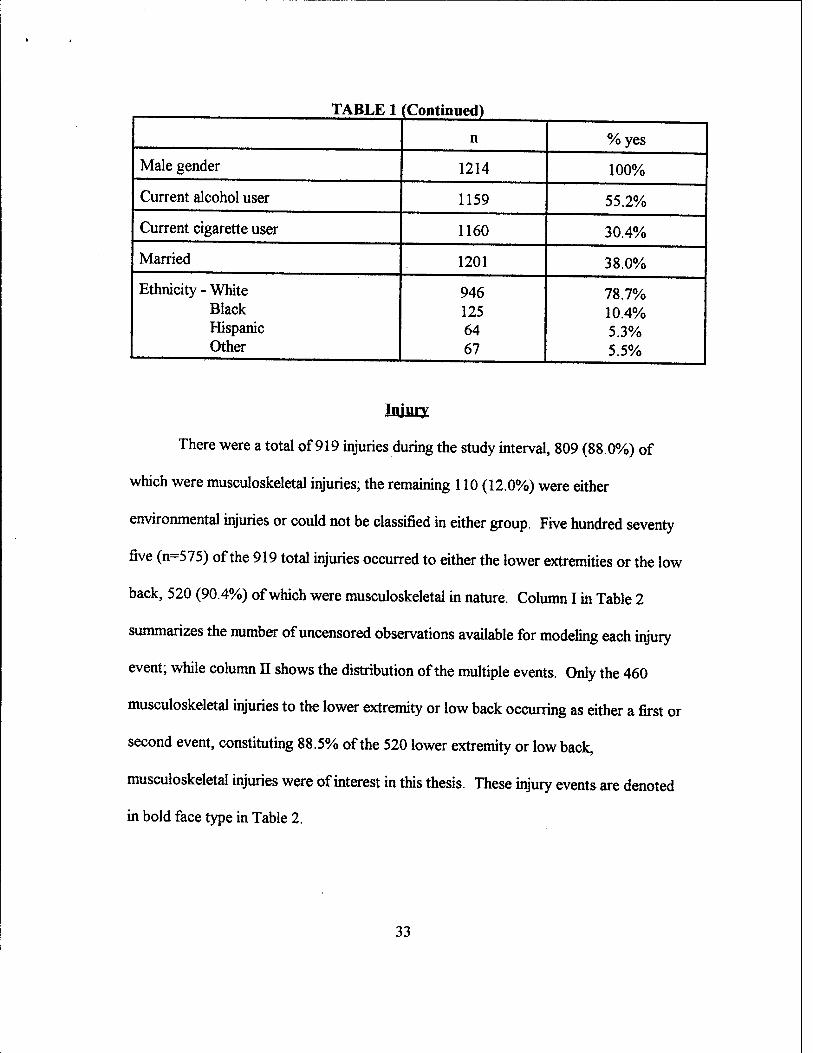
TABLE 1 (Continued)
n %yes
Male gender 1214 100%
Current alcohol user 1159 55.2%
Current cigarette user 1160 30.4%
Married 1201 38.0%
Ethnicity - White Black Hispanic Other
946 125 64 67
78.7% 10.4% 5.3% 5.5%
Injury
There were a total of 919 injuries during the study interval, 809 (88.0%) of
which were musculoskeletal injuries; the remaining 110 (12.0%) were either
environmental injuries or could not be classified in either group. Five hundred seventy
five (n=575) of the 919 total injuries occurred to either the lower extremities or the low
back, 520 (90.4%) of which were musculoskeletal in nature Column I in Table 2
summarizes the number of uncensored observations available for modeling each injury
event; while column II shows the distribution of the multiple events. Only the 460
musculoskeletal injuries to the lower extremity or low back occurring as either a first or
second event, constituting 88.5% of the 520 lower extremity or low back,
musculoskeletal injuries were of interest in this thesis. These injury events are denoted
in bold face type in Table 2.
33
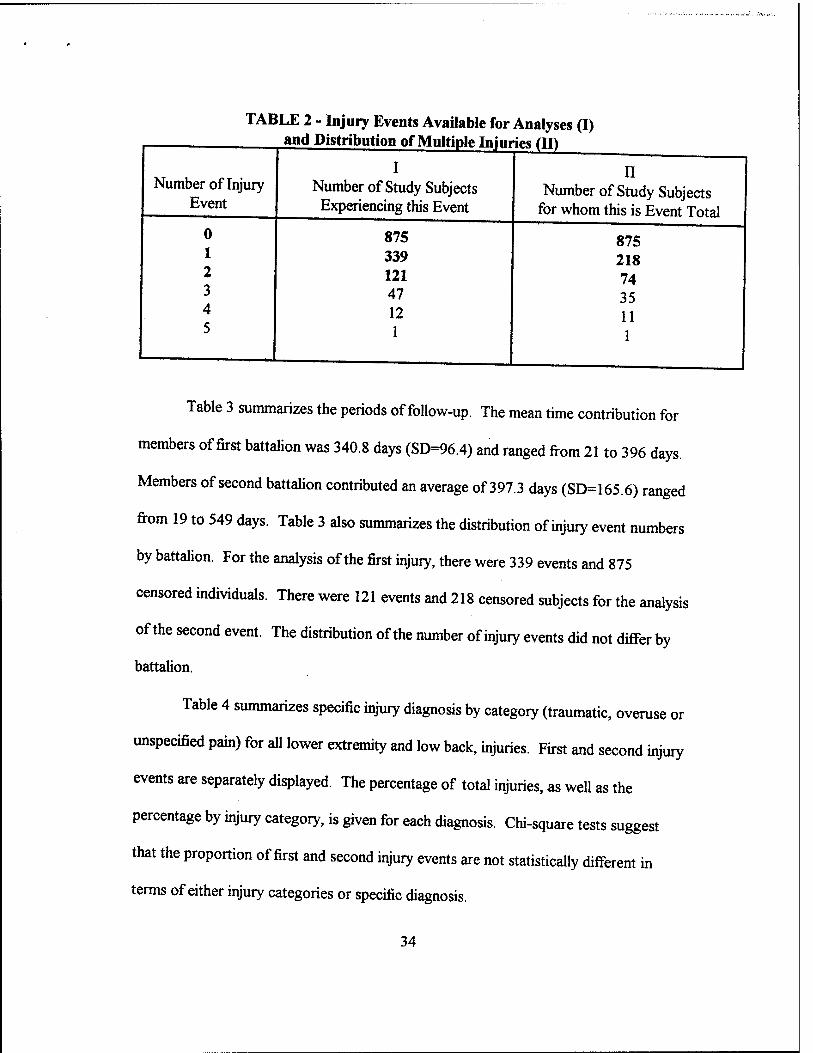
TABLE 2 - Injury Events Available for Analyses (I) and Distribution of Multiple Injuries (II)
I Number of Injury
Event
0 1 2 3 4 5
Number of Study Subjects Experiencing this Event
875 339 121 47 12
1
II Number of Study Subjects
for whom this is Event Total
875 218 74 35 11 1
Table 3 summarizes the periods of follow-up. The mean time contribution for
members of first battalion was 340.8 days (SD=96.4) and ranged from 21 to 396 days.
Members of second battalion contributed an average of 397.3 days (SD=165.6) ranged
from 19 to 549 days. Table 3 also summarizes the distribution of injury event numbers
by battalion. For the analysis of the first injury, there were 339 events and 875
censored individuals. There were 121 events and 218 censored subjects for the analysis
of the second event. The distribution of the number of injury events did not differ by
battalion.
Table 4 summarizes specific injury diagnosis by category (traumatic, overuse or
unspecified pain) for all lower extremity and low back, injuries. First and second injury
events are separately displayed. The percentage of total injuries, as well as the
percentage by injury category, is given for each diagnosis. Chi-square tests suggest
that the proportion of first and second injury events are not statistically different in
terms of either injury categories or specific diagnosis.
34

TABLE 3 - Contribution of the Analysis of Time to Event by Battalion
1st Battalion 2nd Battalion Total
Person Time (days)
n 614 600 1214
mean 340.8 397.3 368.7
SD 96.4 165.6 138.0
min 21 19 19
max 396 549 549
Analysis of 1st Injury
# of Events 170 169 339
# Censored 444 431 875
Total 614 600 1214
Analysis of 2nd Injury
# of Events 60 61 121
# Censored 110 108 218
Total 170 169 339
Information regarding the frequency of injuries to specific joints or muscle
groups is in Table 5. The most common body parts injured were the ankle, knee, low
back, and foot (including the toes), and together accounted for 402 (87.4%) of the 460
injuries of interest. The proportions of all injuries that occurred to the lower leg (shin
and calf) were not homogeneous between the first and second injury events (Chi-
squarep=.026), with 24 of the 26 injuries (92.3%) occurring to this region as the first
35

injury. There were no significant difference in the proportions of injuries between first
and second injury events for all other body parts.
TABLE 4 - Injury Type and Diagnosis for Total Lower Extremity/ Musculoskeletal Injuries and by Event (Injury) Niimhor
Low Back
Injury Category
Traumatic
Overuse
Pain
Totals
Diagnosis
Sprain/Strain
Contusion
Fracture
Abrasion/Laceration
Other
TOTAL
Unspecified
Strain
Stress Fx/Rxn
Tendinitis
Other
TOTAL
Unspecified
Total n (% of total inj)
(% of inj type)
203(44.1) (70.7)
35 (7.6) (12.2)
20 (4.3) (7.0)
10 (2.2) (3.5)
19(4.1) (6.6)
287(62.4)
41 (8.9) (37.7)
31 (6.7) (28.4)
14 (3.0) (12.8)
11(2.4) (10.1)
12 (2.6) (HO)
109(23.0)
64 (13.9)
460
1st Event n (% of total inj)
(% of inj type)
151 (44.5) (71.9)
23 (6.8) (11.0)
13 (3.8) (6.2)
9 (2.7) (4.3)
14(4.1) (6.7)
210 (61.9)
28 (8.3) (35.9)
25 (7.4) (32.0)
11(3.2) (14.1)
6(1.8) (7.7)
8(2.4) (10.3)
78(23.0)
51 (15.0)
339
2nd Event n (% of total inj)
(% of inj type)
52 (43.0) (68.4)
11(9.1) (14.5)
7 (5.8) (9.2)
1 (0.8) (13)
5(4.1) (6.6)
76 (62.8)
13 (10.7) (41.9)
6(5.0) (19.4)
3 (2.5) (9.7)
5(4.1) (16.1)
4(3.3) (12.9)
31 (25.6)
13 (10.7)
121
36
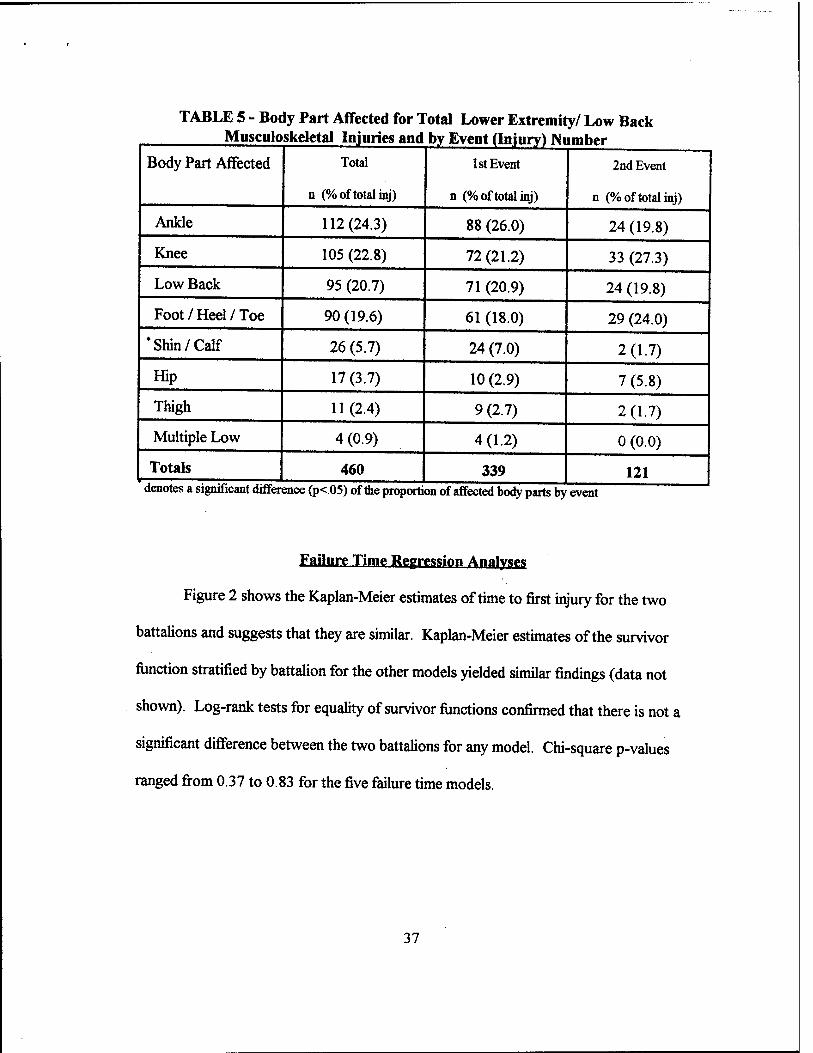
TABLE 5 - Body Part Affected for Total Lower Extremity/ Low Back Musculoskeletal Injuries and by Event (Injury) Number
Body Part Affected Total
n (% of total inj)
1st Event
n (% of total inj)
2nd Event
n (% of total inj)
Ankle 112(24.3) 88 (26.0) 24 (19.8)
Knee 105 (22.8) 72(21.2) 33 (27.3)
Low Back 95 (20.7) 71 (20.9) 24 (19.8)
Foot / Heel / Toe 90 (19.6) 61 (18.0) 29 (24.0)
"Shin/Calf 26 (5.7) 24 (7.0) 2(1.7)
Hip 17 (3.7) 10 (2.9) 7 (5.8)
Thigh 11(2.4) 9 (2.7) 2(1.7)
Multiple Low 4 (0.9) 4(1.2) 0 (0.0)
Totals 460 339 121 denotes a significant differ ence (p<.05) of the proportion of affected body parts by event
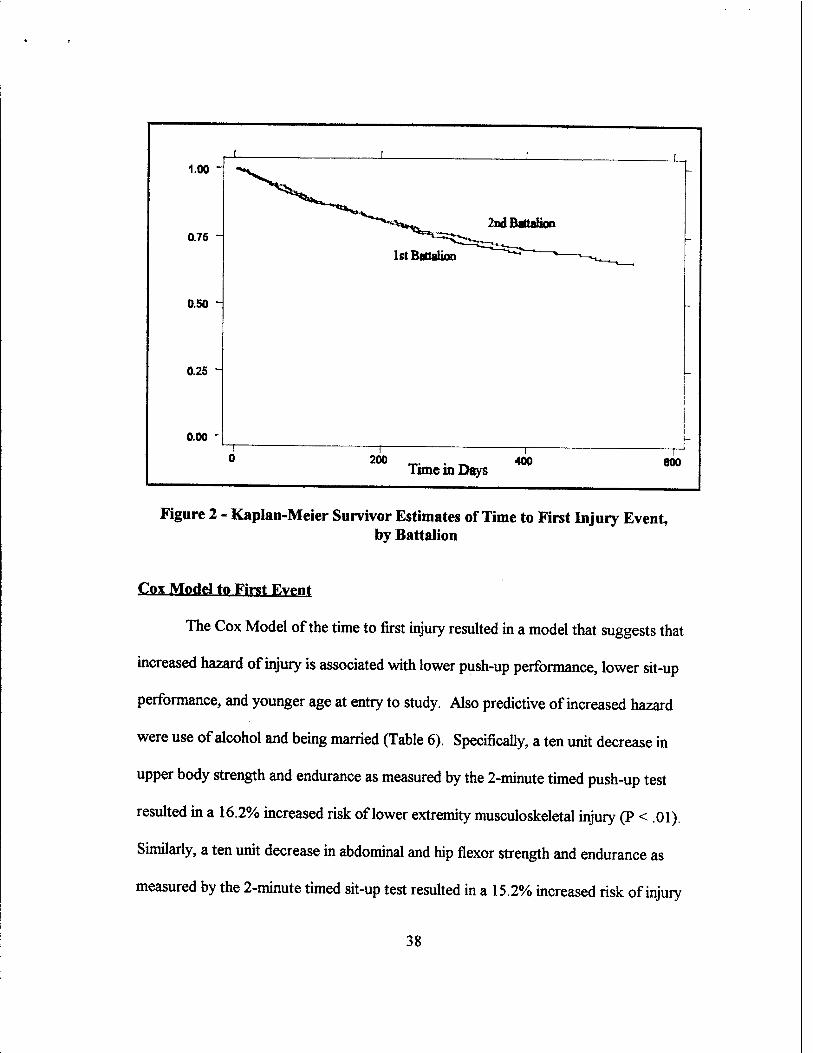
Failure Time Regression Analyse^
Figure 2 shows the Kaplan-Meier estimates of time to first injury for the two
battalions and suggests that they are similar. Kaplan-Meier estimates of the survivor
function stratified by battalion for the other models yielded similar findings (data not
shown). Log-rank tests for equality of survivor functions confirmed that there is not a
significant difference between the two battalions for any model. Chi-square p-values
ranged from 0.37 to 0.83 for the five failure time models.
37
1.00 -
0.75 -
0.50 -
0.25 ^
0.00
1st Battalion
—1 _ ,_ 200 400
Tune in Days —r 600
Figure 2 - Kaplan-Meier Survivor Estimates of Time to First Injury Event, by Battalion
Cox Model to First Event
The Cox Model of the time to first injury resulted in a model that suggests that
increased hazard of injury is associated with lower push-up performance, lower sit-up
performance, and younger age at entry to study. Also predictive of increased hazard
were use of alcohol and being married (Table 6). Specifically, a ten unit decrease in
upper body strength and endurance as measured by the 2-minute timed push-up test
resulted in a 16.2% increased risk of lower extremity musculoskeletal injury (P < .01).
Similarly, a ten unit decrease in abdominal and hip flexor strength and endurance as
measured by the 2-minute timed sit-up test resulted in a 15.2% increased risk of injury
38
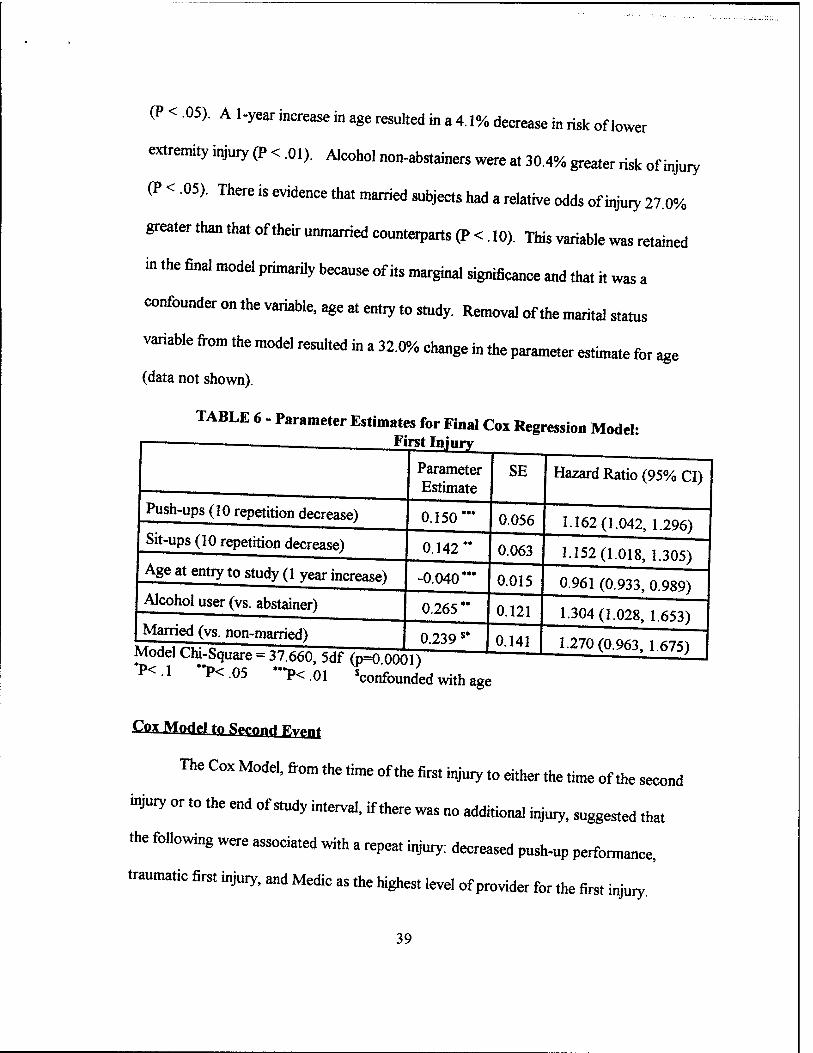
(P < .05). A l-year increase in age resulted in a 4.1% decrease in risk of lower
extremity injury (P < .01). Alcohol non-abstainers were at 30.4% greater risk of injury
(P < .05). There is evidence that married subjects had a relative odds of injury 21.0%
greater than that of their unmarried counterparts (P < . 10). This variable was retained
in the final model primarily because of its marginal significance and that it was a
confounder on the variable, age at entry to study. Removal of the marital status
variable from the model resulted in a 32.0% change in the parameter estimate for age
(data not shown).
TABLE 6 - Parameter Estimates for Final Cox Regression Model: — . First Injury
Push-ups (10 repetition decrease)
Sit-ups (10 repetition decrease)
Parameter Estimate
0.150
SE
Age at entry to study (1 year increase)
Alcohol user (vs. abstainer)
Married (vs. non-married)
0.142
-0.040 **•
0.265'
0.056
Hazard Ratio (95% CI)
0.063
0.015
0.121
1.162(1.042, 1.296)
1.152(1.018, 1.305)
0961 (0,933, 0.989)
0.239 $*
Model Chi-Square = 37.660, 5df (p=0 0001) P<.1 "P<05 *"P<.oi Wounded with age
0.141
1.304(1.028, 1.653)
1.270(0.963, 1.675)
Cox Model to Spmnff fiyf ^t
The Cox Model, from the time of the first injury to either the time of the second
injury or to the end of study interval, if there was no additional injury, suggested that
the following were associated with a repeat injury: decreased push-up performance,
traumatic first injury, and Medic as the highest level of provider for the first injury.
39

Hispanics were at increased risk and individuals in the "Other" ethnicity category were
at lower risk (Table 7). A ten unit decrease in upper body strength and endurance as
measured by the 2-minute timed push-up test resulted in a 24.9% increased risk of
subsequent injury (P < .01). If the subject's first injury was categorized as a traumatic
injury, there was an 83.4% increased risk of subsequent injury than if the first injury
was categorized as overuse or unspecified pain (P < .01). Subjects who saw only a
Medic, the lowest level of medical provider, for the preceding injury were 71.6% more
likely to undergo a subsequent injury (P < .05). Hispanic individuals had greater than
four times the risk of experiencing a second lower extremity injury than did Caucasian
individuals (P < .001). Two thirds of the Hispanic subjects who were at risk to
experience a second lower extremity injury did so, compared to 34.3% of the
remainder of the subjects (data not shown).
TABLE 7 - Parameter Estimates for Final Cox Regression Model: __ Second Injury
Push-ups (10 repetition decrease)
Previous Traumatic Injury
Highest level of Medical Provider from Previous Injury: Medic (vs all others)
Ethnicity (referent = White): Black Hispanic Other
Parameter Estimate
SE
0.223
0.607
0.540
0.037 1.446*** -1.243*
Model Chi-Square = 31.629, 6df (p=0 0001) *P<1 **P<.05 ***P<.01 ****P<.001
Hazard Ratio (95% CI)
0.083
0.217
0.251
0.374 0.368 0.726
1.249(1.062, 1.470)
1.834(1.200,2.804)
1.716(1.049,2.808)
4.246 (2.023, 8.738) 0.289(0.070,1.120)
40

Andersen-Gill (AG\ Mortal
Associated with increased hazard of injury in the AG Model were decreased
push-up performance, decreased sit-up performance, younger age at entry to study,
current use of alcohol, and being married. Table 8 shows that a ten unit decrease in
the 2-minute timed push-up test resulted in a 18.1% increased risk of lower extremity
musculoskeletal injury (P < .001). Similarly, a ten unit decrease in the 2-minute timed
sit-up test resulted in a 11.5% increased risk of injury (P < .05). A 1-year increase in
age resulted in a 3.7% decrease in risk of injury (P < .01). Married subjects were at
27.1% greater risk of injury (P < .05). There is evidence that alcohol users were
marginally more likely (18.6%) to be injured than the subjects that were alcohol
abstainers (P < . 10); however this variable was retained in the final model because it
was a confounder on the effect of sit-up performance. Removal of the alcohol use
variable from the model resulted in a 24.0% change in the parameter estimate for sit-up
performance.
TABLE 8 - Parameter Estimates for Final Andersen-Gill Model
Parameter Estimate
SE Hazard Ratio (95% CI)
Push-ups (10 repetition decrease) 0.167"" 0.048 1.181 (1.076, 1.296)
Sit-ups (10 repetition decrease) 0.109" 0.054 1.115(1.003,1.241)
Age at entry to study (1 year increase) -0.036"* 0.013 0.964 (0.941, 0.988)
Married (vs. non-married) 0.240 " 0.120 1.271(1.005, 1.608)
Alcohol user (vs. abstainer) jfnAa.] r<u: e„..„ At TOO e m , « ««,
0.171s* 0.104 1.186(0.968,1.455)
*P<1 "P<.05 *"P<.01 ""P<.001 'confounded with sit-ups
41

Prentice Williams and Peterson (PWP1 Model
The PWP resulted in a model that was identical to the combination of the Cox
Model of the first event and the Cox Model of the second event (Table 9). The first
stratum included persons with a history of zero events; the second stratum included
only those persons with a first injury.
TABLE 9 - Parameter Estimates for Final PWP Model
Stratum=l (1st Injury)
Push-ups (10 repetition decrease)
Sit-ups (10 repetition decrease)
Age at entry to study (1 year increase)
Alcohol user (vs. abstainer)
Married (vs. non-married)
Stratum=2 (2nd Injury)
Push-ups (10 repetition decrease)
Previous Traumatic Injury
Highest level of Medical Provider from Previous Injury: Medic (vs all others)
Ethnicity (referent = White): Black Hispanic
Parameter Estimate
0.150
0.142
-0.040"
0.265'
0.239 $*
0.223
0.607
0.540
0.037 1.446"
SE
0.056
0.063
0.015
0.121
0.141
0.083
0.217
0.251
0.374 0.368
Hazard Ratio (95% CI)
1.162(1.042,1.296)
1.152(1.018, 1.305)
0.961 (0.933, 0.989)
1.304(1.028,1.653)
1.270(0.963,1.675)
1.249(1.062,1.470)
1.834(1.200,2.804)
1.716(1.049,2.808)
4.246 (2.023, 8.738) Other I -1.243* [ 0.726 | 0.289(0.070, 1.120)
Model Chi-Square = 69.289, 1 ldf (p=0.0001) *P<.1 "P<,05 ***P<.01 **"P<.001 Confounded with age (1st stratum)
Cox Model of Time to last l^.ry
The purpose of the Cox Model of time to last injury was to determine the
magnitude of the increased hazard associated with previous injury history. Table 10
42

shows both crude and adjusted values of parameter estimates, standard errors and
hazard ratios for the history of previous injury, as well as for significant variables in any
of the multiple event modelling strategies previously conducted. The adjusted value is
adjusted for variables that were statistically significant in any one of these models,
which included push-up performance, sit-up performance, age at entry to study, alcohol
user (vs. abstainer), marital status and ethnicity. The variables describing previous
traumatic injury, and highest level of provider for the previous injury that were included
in the Cox Model for second injury and the second stratum (second injury event) in the
PWP Model were not included in this model. This is because the last injury event is not
the second injury event for all individuals. The crude and adjusted parameter estimate
values corresponding to previous injury history did not differ considerably, suggesting
that its effect is independent of those of the other predictors of recurrent injury and that
individuals with a history of one injury are at approximately seven times greater risk of
a second injury.
The effect of previous injury history is perhaps easier to interpret by
examination of a log-rank test for equality of the survivor functions between those with
a prior injury history versus those without a prior injury history. Table 11 illustrates
that if previous injury history was not a risk factor for subsequent injury, only 25 of the
339 injury events would have been a second injury event. The actual number of second
injury events (individuals with a previous injury history) was 121, a value that is almost
five times greater than the expected number of subjects with previous injury history.
43
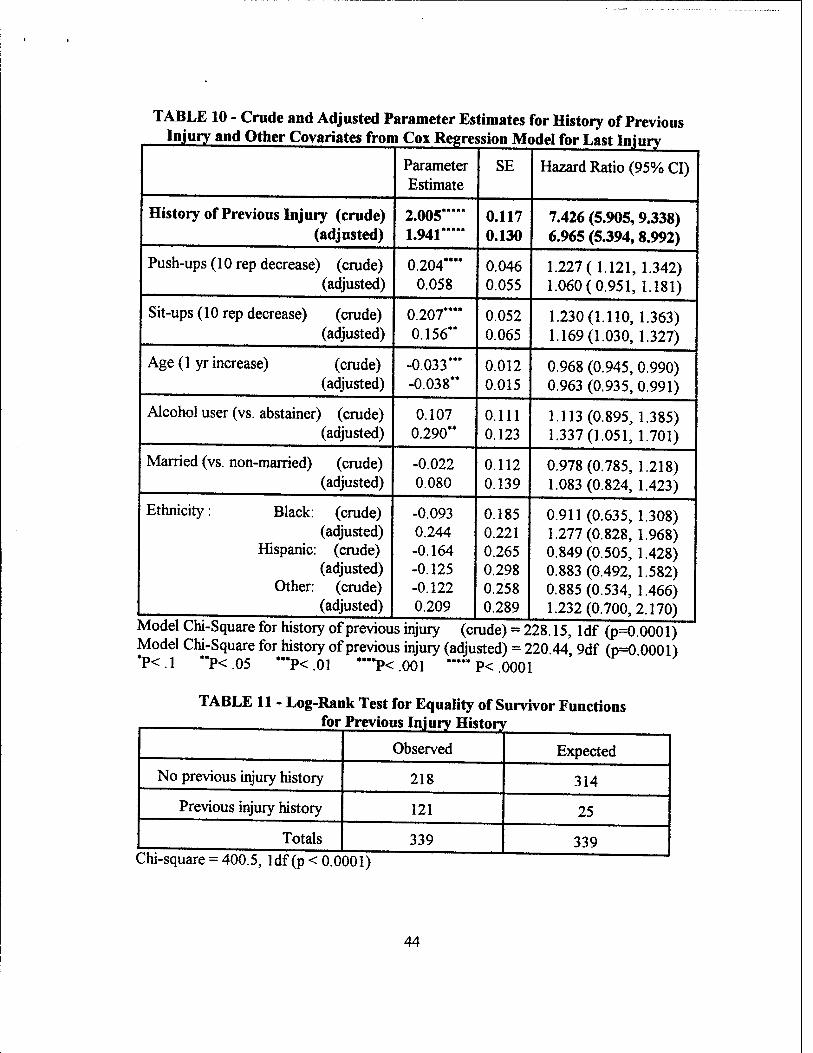
TABLE 10 - Crude and Adjusted Parameter Estimates for History of Previous Injury and Other Covariates from Cox Regression Model for Last Iniurv
Parameter Estimate
SE Hazard Ratio (95% CI)
History of Previous Injury (crude) (adjusted)
2.005 1.941
0.117 0.130
7.426 (5.905,9.338) 6.965 (5.394,8.992)
Push-ups (10 rep decrease) (crude) (adjusted)
0.204**" 0.058
0.046 0.055
1.227(1.121, 1.342) 1.060(0.951,1.181)
Sit-ups (10 rep decrease) (crude) (adjusted)
0.207**** 0.156**
0.052 0.065
1.230(1.110,1.363) 1.169(1.030,1.327)
Age (1 yr increase) (crude) (adjusted)
-0.033*** -0.038**
0.012 0.015
0.968 (0.945, 0.990) 0.963 (0.935, 0.991)
Alcohol user (vs. abstainer) (crude) (adjusted)
0.107 0.290**
0.111 0.123
1.113(0.895,1.385) 1.337(1.051, 1.701)
Married (vs. non-married) (crude) (adjusted)
-0.022 0.080
0.112 0.139
0.978(0.785, 1.218) 1.083(0.824, 1.423)
Ethnicity: Black: (crude) (adjusted)
Hispanic: (crude) (adjusted)
Other: (crude) (adjusted)
-0.093 0.244 -0.164 -0.125 -0.122 0.209 1
0.185 0.221 0.265 0.298 0.258 0.289
0.911(0.635,1.308) 1.277(0.828,1.968) 0.849(0.505,1.428) 0.883(0.492, 1.582) 0.885(0.534,1.466) 1.232(0.700,2.170)
] 4
Model Chi-Square for history of previous injury (crude) = 228.15, ldf (p=0.0001) Model Chi-Square for history of previous injury (adjusted) = 220 44 9df (p=0 0001) P<.1 **P<.05 ***P<.01 ****P<.001 —P<.0001
TABLE 11 - Log-Rank Test for Equality of Survivor Functions for Previous Injury History
Observed Expected
No previous injury history 218 314
Previous injury history 121 25
Totals 339 339 ( :hi-square = 400.5, ldf (p < 0.0 001)
44

Proportional Hazards Assumption
An underlying assumption of the Cox Model is that the survival time among
individuals in two or more different groups of a significant variable are proportional to
one another. Since the multiple event models reduce to the Cox Model in the absence
of more than one event, it is reasonable to examine this assumption for all of the above
statistical models that were used to examine injury risk factors in a setting where
individuals may have sustained more than one injury. One method of testing this
assumption is by adding a covariate to the final model that is representative of the
interaction between the covariate of interest and the logarithm of the time variable. If
this interaction term has a corresponding small P-value (< .05), one would conclude
that the survival time between individuals with different values of this covariate are not
proportional. In other words, the effect of this covariate is not the same at all points in
time.
Variations of the effect of a covariate with time may, however, not be of
concern. The parameter estimates for a significant covariate represents the average
effect ofthat covariate over the range of time observed in the data (Allison et al.,
1995). Apparent violations of the proportional hazards assumption were therefore
checked via log-cumulative hazard plots for each of the above models. This is a plot of
the negative logarithm of the estimated survivor function on the vertical axis against the
logarithm of the time variable on the horizontal axis (Collett, 1994). Figures 3, 4, 5,
and 6 are the log-cumulative hazard plots for all significant variables in the Cox Model
45
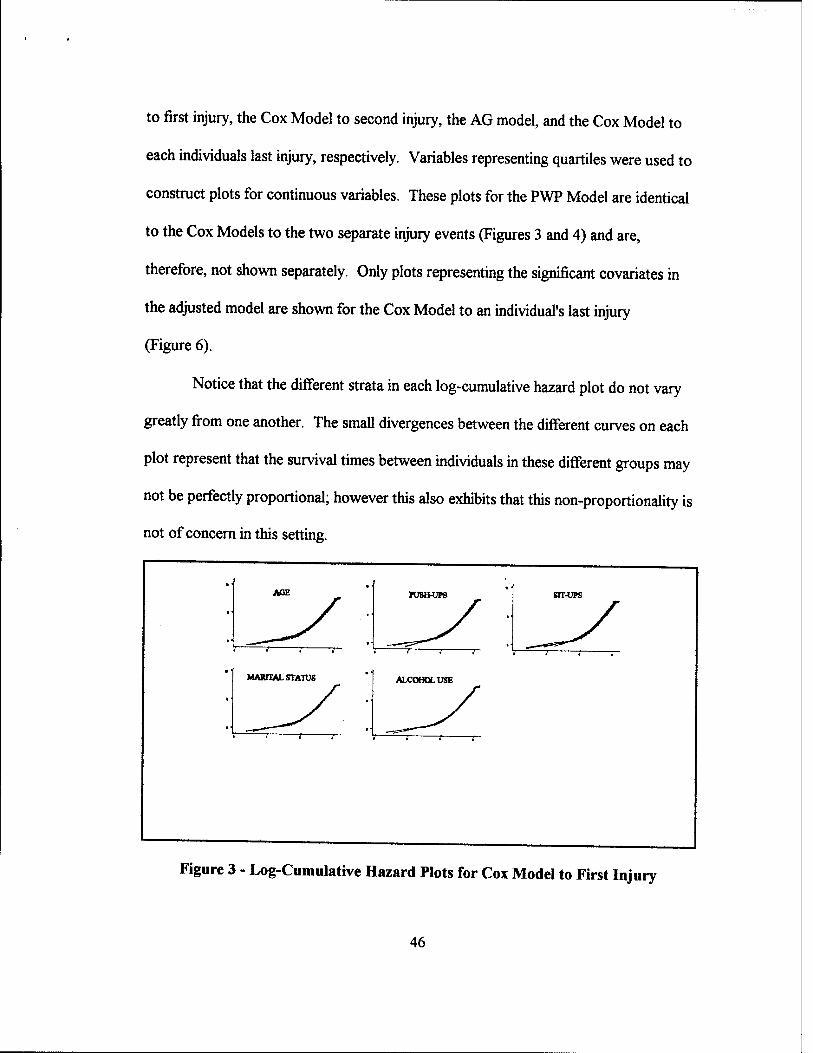
to first injury, the Cox Model to second injury, the AG model, and the Cox Model to
each individuals last injury, respectively. Variables representing quartiles were used to
construct plots for continuous variables. These plots for the PWP Model are identical
to the Cox Models to the two separate injury events (Figures 3 and 4) and are,
therefore, not shown separately. Only plots representing the significant covariates in
the adjusted model are shown for the Cox Model to an individual's last injury
(Figure 6).
Notice that the different strata in each log-cumulative hazard plot do not vary
greatly from one another. The small divergences between the different curves on each
plot represent that the survival times between individuals in these different groups may
not be perfectly proportional; however this also exhibits that this non-proportionality is
not of concern in this setting.
AQE Tumvn BIT-UPS
MARITAL STATUS ALCOHOL USE
Figure 3 - Log-Cumulative Hazard Plots for Cox Model to First Injury
46
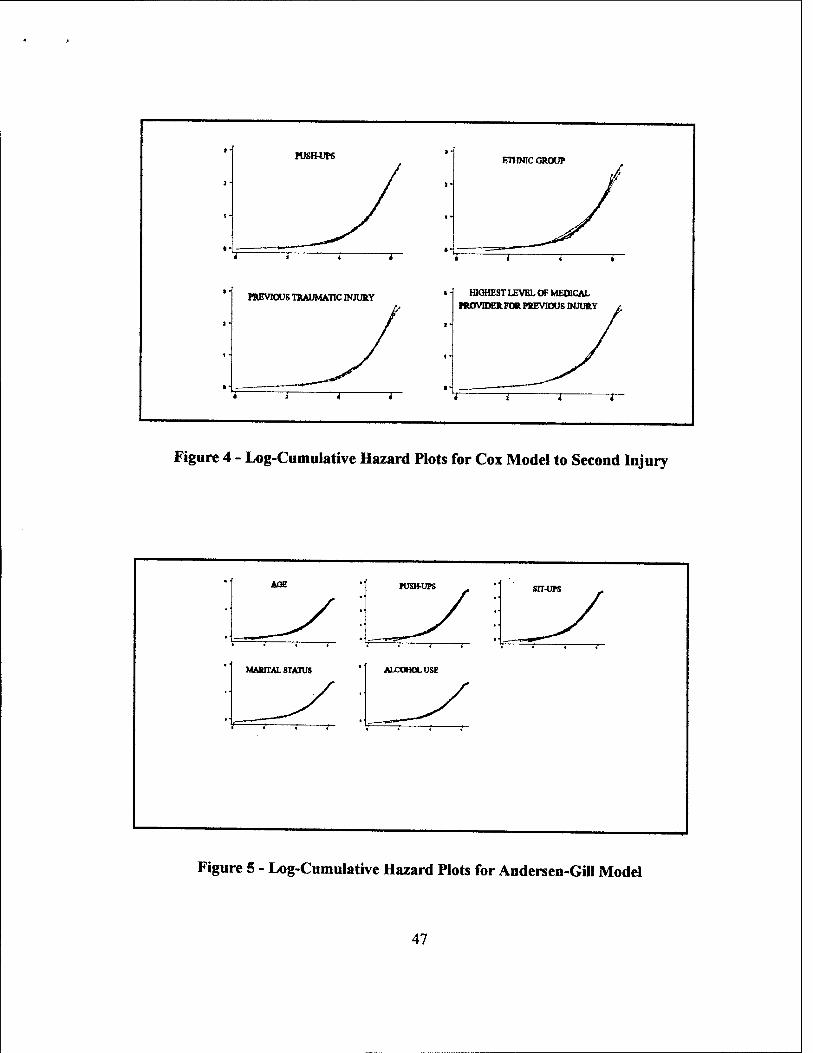
rusimps
1 r
ETHNIC GROUP
PREVIOUS TRAUMATIC INJURY HIGHEST LEVEL OF MEDICAL
ntOVIDERFOR PREVIOUS INJURY
Figure 4 - Log-Cumulative Hazard Plots for Cox Model to Second Injury
AOE PUSHUPS srr-ups
MARITAL STATUS ALCOHOL USE
Figure 5 - Log-Cumulative Hazard Plots for Andersen-Gill Model
47
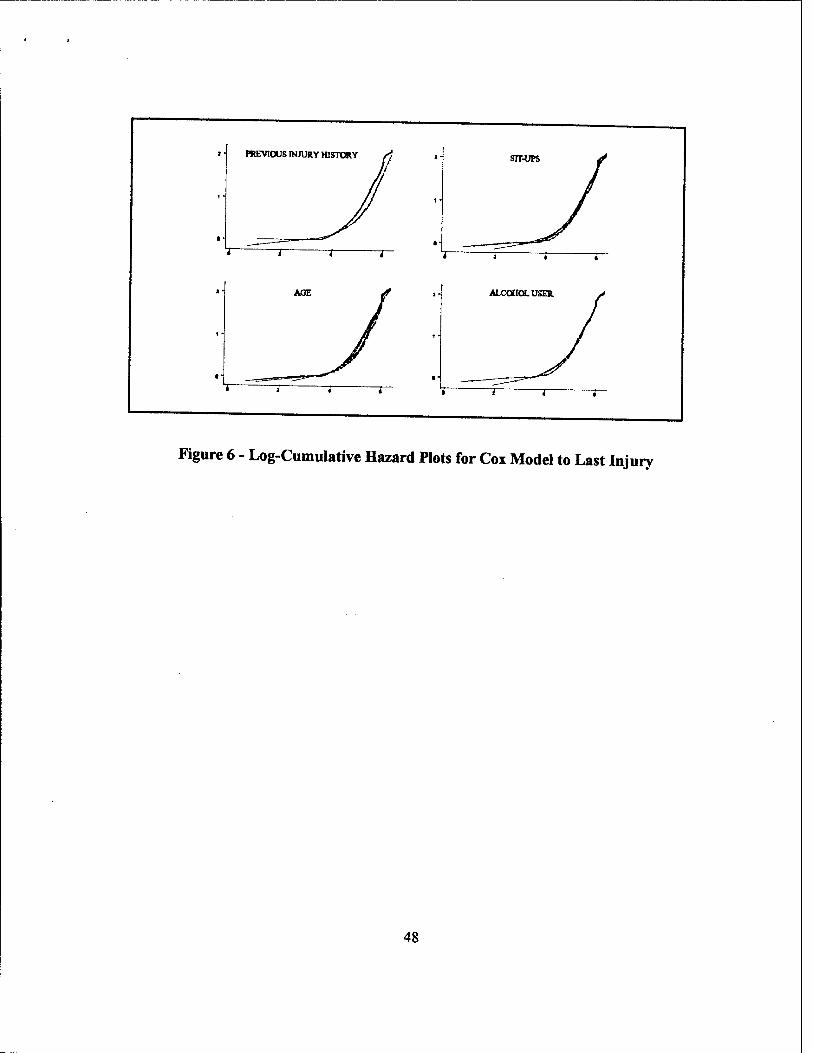
Figure 6 - Log-Cumulative Hazard Plots for Cox Model to Last Injury
48
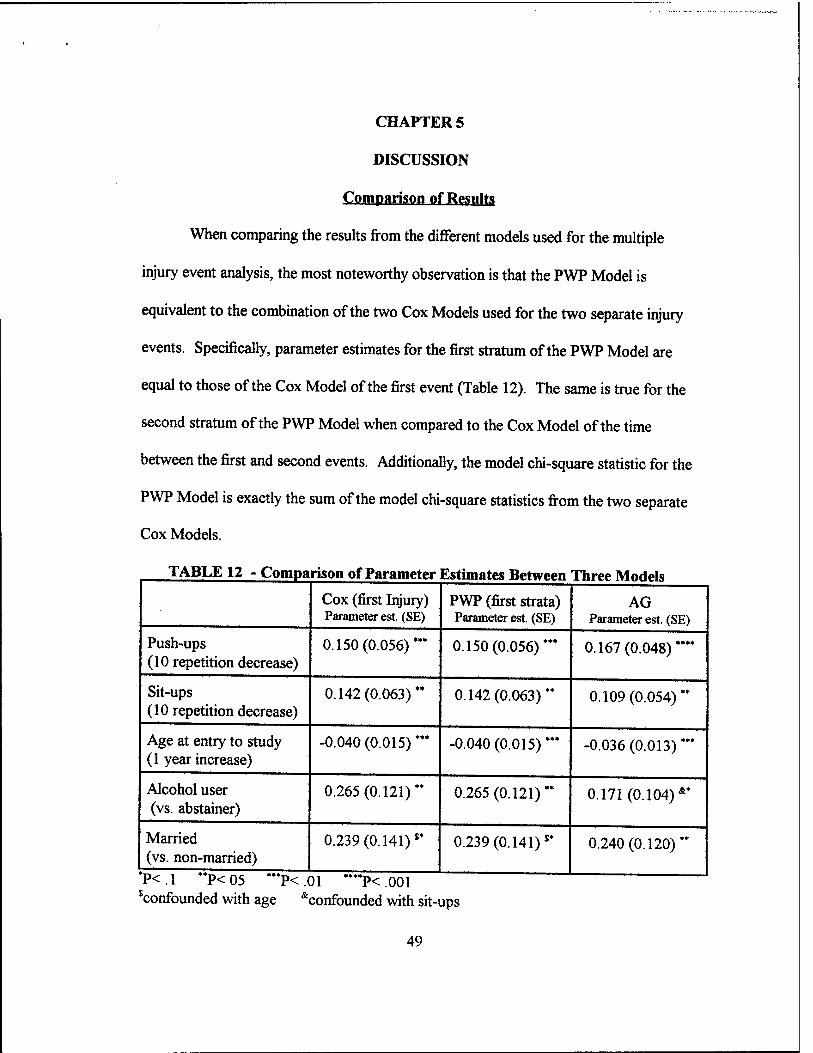
CHAPTER 5
DISCUSSION
Comparison of Results
When comparing the results from the different models used for the multiple
injury event analysis, the most noteworthy observation is that the PWP Model is
equivalent to the combination of the two Cox Models used for the two separate injury
events. Specifically, parameter estimates for the first stratum of the PWP Model are
equal to those of the Cox Model of the first event (Table 12). The same is true for the
second stratum of the PWP Model when compared to the Cox Model of the time
between the first and second events. Additionally, the model chi-square statistic for the
PWP Model is exactly the sum of the model chi-square statistics from the two separate
Cox Models.
TABLE 12 - Comparison of Parameter Estimates Between Three Models
Push-ups (10 repetition decrease)
Sit-ups (10 repetition decrease)
Age at entry to study (1 year increase)
Alcohol user (vs. abstainer)
Married (vs. non-married)
Cox (first Injury) Parameter est. (SE)
0.150(0.056)
0.142(0.063)
-0.040(0.015)
0.265(0.121)
0.239 (0.141) $*
PWP (first strata) Parameter est. (SE)
0.150(0.056)
0.142(0.063)
-0.040(0.015)
0.265(0.121)
0.239 (0.141) J*
*P<1 "P<05 "*P<01 "**P<.001 $confounded with age &confounded with sit-ups
AG Parameter est. (SE)
0.167(0.048)
0.109(0.054)
-0.036 (0.013)
0.171(0.104) &*
0.240(0.120)
49
Having determined that the PWP Model is equivalent to the combination of the
two Cox Models, the AG model can now be compared to either of these. For
simplicity it will be compared to only the PWP Model. In this data set, development of
an AG Model yielded the same set as predictors as obtained from the first stratum of
the PWP model. This is consistent with a study that implemented the AG Model to
determine if exercise reduced the occurrence of falls experienced by elderly individuals.
In this study the AG Model was compared to a Cox Model of time to first fall to ensure
that multiple fallers did not unduly influence the results (Province et al., 1995). Table
12 displays the parameter estimates for these models. Recall that push-up performance
was the only independent variable that remained in both strata of the PWP Model. The
influence of this covariate on injury, regardless of the event number, is evident by both
the increased parameter estimate and increased significance of the corresponding p-
value as compared to those from a model that looks at only the first injury event. The
rest of the parameter estimates in the AG Model, with the exception of marital status,
are closer to zero than the parameter estimates in the first stratum of the PWP Model.
Recall that none of these variables were significant risk factors for the second injury
event. Thus in this data set, the parameter estimates from the AG Model are primarily
influenced by the first event. This is likely true because of the substantial decline in the
number of subjects having a second injury as compared to those with a first injury. In a
setting where virtually all individuals had multiple events or where risk factors are
50
equivalent from one event to the next, the AG Model would perhaps be more useful,
provided the assumption of the common baseline hazard is reasonable.
Benefits of the PWPMndri
The PWP Model is the most useful of the three methods employed to analyze
these data and perhaps, more generally, data in the multiple injury event setting. This
model has the benefit of permitting a different baseline hazard function for each event.
Table 13 displays the parameter estimates for the final PWP Model, as well as for a
"comparison" model that includes, in both strata, all covariates that were significant in
either stratum. In this manner, changes in the parameter estimates from one injury to
the next can be easily compared. Table 13 also shows the percentage of change in the
parameter estimates between the final and comparison model where applicable. There
was no significant confounding of parameter estimates between the two models.
A practical advantage of the PWP model is inherent within the structure of the
database. Specifically, Kaplan-Meier survivor estimates to the time of injury can easily
be plotted on the same axis. Figure 7 shows that the estimated survivor function for
the first injury is consistently less than that of the second injury. This suggests that
once an individual experiences a traumatic injury to the lower extremity or low back, he
is at greater risk to undergo a similar subsequent injury. The results of the log-rank for
the equality of the survivor function between the two strata in the PWP Model are
shown in Table 14. This specifies that of the 460 injuries of interest, 55 of them are
51
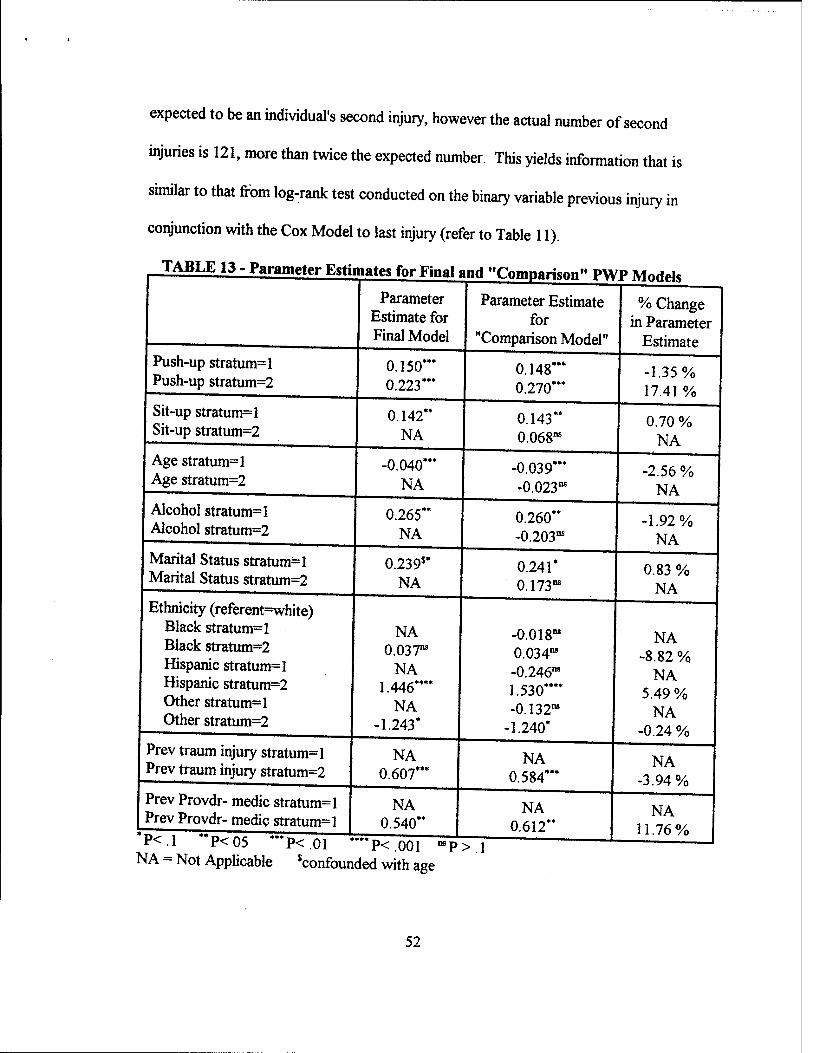
expected to be an individual's second injury, however the actual number of second
injuries is 121, more than twice the expected number. This yields information that is
similar to that from log-rank test conducted on the binary variable previous injury in
conjunction with the Cox Model to last injury (refer to Table 11).
TABLE 13 - Parameter Estimates for Final and "Cnmpariw PWP MndrH
Parameter Estimate for Final Model
Parameter Estimate for
"Comparison Model"
% Change in Parameter
Estimate Push-up stratum=l Push-up stratum=2
0.150*" 0.223*"
0.148*" 0.270***
-1.35% 17.41 %
Sit-up stratum=l Sit-up stratum=2
0.142" NA
0.143" 0.068"
0.70 % NA
Age stratum=l Age stratum=2
-0.040*** NA
-0.039*** -0.023"
-2.56 % NA
Alcohol stratum=l Alcohol stratum=2
0.265" NA
0.260" -0.203"
-1.92% NA
Marital Status stratum=l Marital Status stratum=2
0.239$* NA
0.241* 0.173"
0.83 % NA
Ethnicity (referent=white) Black stratum=l Black stratum=2 Hispanic stratum=l Hispanic stratum=2 Other stratum=l Other stratum=2
NA 0.037"
NA 1.446*"*
NA -1.243*
-0.018" 0.034" -0.246" 1.530"" -0.132"
-1.240*
NA -8.82 %
NA 5.49 %
NA -0.24 %
Prev traum injury stratum=l Prev traum injury stratum=2
NA 0.607"*
NA 0.584"*
NA -3.94%
Prev Provdr- medic stratum=l Prev Provdr- medic stratum=l
NA 0.540"
NA 0.612"
NA 11.76%
F<-1 P<05 "P<01 ""P<001 "P NA = Not Applicable Confounded with age
52
>.l

•
r ■ r r r 1.00 -
0.75 -
0.50 ~
0.25 -
0.00 -
^v ^"^^--^^Firet Injury Event
Second Injury Even! ^H_I_^
6 2"> ThueinDo* '-«* "°
Figure 7 - Kaplan-Meier Survivor Estimates for the Two Strata (Injury Events) in the PWP Model
53

TABLE 14 - Log-Rank Test for Equality of Survivor Functions between the Two Strata (Injury Events) in the PWP Model
Observed Expected
Stratum 1 (first injury) 339 405
Stratum 2 (second injury) 121 55
Totals 460 460
Benefits of the Cox Model of the Time to Last Injury
While the PWP model is the best for analyzing recurrent injuries, it does have
one limitation. Specifically, the increase in hazard attributable to having a previous
injury is not directly estimable. The PWP model does allow for verification that there is
an increased risk for injury having had a previous injury by way of Kaplan-Meier
estimates of the survivor function and log-rank tests of the different strata (injury
events). However, the Cox Model of the time to the last injury event is needed to fully
understand the effect of previous injury history on subsequent injury, as it is the only
model that was examined in this thesis in which the increase hazard associated with
having had a previous injury can be estimated.
Comparison Of the Multiple Event Models: Summary
Table 15 compares many aspects of the three methods of multiple event failure
time analysis employed in this thesis. The prominent component in the comparisons of
the three methods is that the underlying process of the PWP Model is the same as using
two Cox Models, where to be included in the second model, a subject must have
54
experienced a prior event. The PWP Model accomplishes this by stratifying the model
by the event number. In both of these approaches, the baseline hazard differs by event.
The AG Model is different from the other models in its assumptions of a common
baseline hazard and covariate effects across strata.
Each of these models has some unique qualities with respect to the construction
of the respective databases required. The Cox Model is the simplest; the primary need
is a well defined dichotomous censoring variable, which in this thesis, was the absence
or presence of a traumatic lower extremity or low back injury. In order to be in the
following model, an individual must have had an event of interest in the preceding
model. The database needed for the PWP model is easy to construct by concatenating
the two separate Cox Models. Prior to joining these, a variable specifying the event
number must be added to the respective databases; this becomes the stratification
variable. Additionally, all variables that occur in more than one stratum must be
renamed so that there are no explanatory variables that have coinciding names between
strata. After the databases are appended, assure that all variables that do not
correspond with the strata do not have missing data. In other words, a variable that is
specific to the first stratum must have a value in the second stratum. This prevents the
subject from being unnecessarily discarded in the analysis. It is simple to place a
common value, such as "0" for all variables that are in this state. The AG Model is
complicated due to the database management involved with the counting process.
Each event is considered independent; therefore, in the presence of multiple events, the
55

time contribution of an event other than the first begins at the time of the immediately
preceding event. Samples of the databases used for these analysis can be found in
Appendix 1. Included in these samples are the following variables: ID, Status (the
censoring variable), Time (Time start and Time stop for the Andersen-Gill data), and
the independent variables Age and Alcohol drinker. Age for the Cox Model to second
injury event and for the second strata of the PWP Model is the age at the time of the
preceding injury, not the age at entry to the study.
There are no obstacles in the construction of the best statistical model in any of
the methods discussed. In all cases, model building can proceed in the same manner as
in other types regression analysis. Statistical software enables model building to be
performed manually, or stepwise, and best subsets options are also available for all
three models. For the PWP Model, regardless of the method of model building chosen,
failure to stratify by event number will produce erroneous results.
The interpretation of the final models, as well as the inferences drawn, appear to
be logical for the two separate Cox Models as well as the PWP Model. This is because
of the separate baseline hazard and parameter estimate for each event. The AG Model
is limited by the facts that all events share the same baseline hazard, the list of
covariates cannot vary by event, and that only one parameter estimate is produced.
Additionally, this parameter estimate is strongly influenced by the first event in a
multiple injury setting. Specifically, in a multiple injury setting where the number of
first events is disproportonally larger than the number of second events,
56
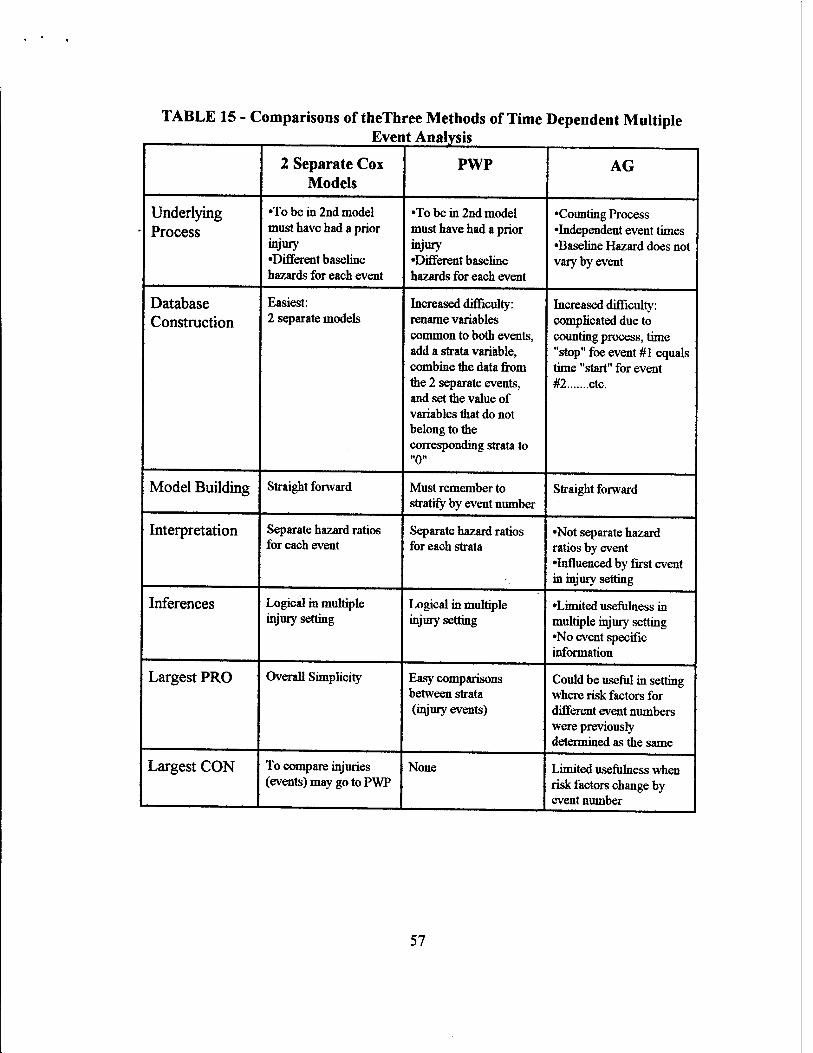
TABLE 15 - Comparisons of theThree Methods of Time Dependent Multiple
2 Separate Cox PWP AG Models
Underlying •To be in 2nd model •To be in 2nd model •Counting Process
Process must have had a prior must have had a prior •Independent event times injury injury •Baseline Hazard does not •Different baseline •Different baseline vary by event hazards for each event hazards for each event
Database Easiest: Increased difficulty: Increased difficulty: Construction 2 separate models rename variables complicated due to
common to both events, counting process, time add a strata variable, "stop" foe event #1 equals combine the data from time "start" for event the 2 separate events, #2 etc. and set the value of variables that do not belong to the corresponding strata to "0"
Model Building Straight forward Must remember to stratify by event number
Straight forward
Interpretation Separate hazard ratios Separate hazard ratios •Not separate hazard for each event for each strata ratios by event
•Influenced by first event in injury setting
Inferences Logical in multiple Logical in multiple •Limited usefulness in injury setting injury setting multiple injury setting
•No event specific information
Largest PRO Overall Simplicity Easy comparisons Could be useful in setting between strata where risk factors for (injury events) different event numbers
were previously determined as the same
Largest CON To compare injuries None Limited usefulness when (events) may go to PWP risk factors change by
1 event number
57

In conclusion, the PWP Model appears to be the choice model for analysis of
these data and perhaps more generally in settings where a single subject may experience
multiple injuries. The assumptions inherent in this model are justifiable in the multiple
injury setting. Additionally, this model is unlike the others as it allows for easy
comparisons between the different strata (injury events). The Cox modelling approach
will yield identical results to the PWP Model, however, it does not allow for easy
comparisons between injury events. The AG Model is the most limited, primarily
because the underlying assumptions do not correspond to the multiple injury setting.
58

APPENDIX
SAMPLE OF DATA
Data for Cox Model to First Event
ID STATUS TIME AGE ALCOHOL
700 1 69 27.8439 0 703 1 312 30.6119 1 704 0 396 22.1136 . 705 0 396 19.3320 0 707 0 396 33.6810 0 708 0 396 30.7187 1 709 0 396 24.9637 1 710 0 396 30.8939 0 711 0 396 28.3231 1 712 0 396 29.8316 1 714 0 396 23.0938 1
Data for Cox Model to Second Event
ID STATUS TIME AGE ALCOHOL
700 0 327 28.0329 0 703 0 84 31.4661 1
Data for PWP Model
ID STATUS TIME STRATA AGE ALCOHOL Str 1 Str 2 Str 1 Str 2
700 1 69 1 27.8439 0 0 0 703 1 312 1 30.6119 0 1 0 704 0 396 1 22.1136 0 0 705 0 396 1 19.3320 0 0 0 707 0 396 1 33.6810 0 0 0 708 0 396 1 30.7187 0 1 0 709 0 396 1 24.9637 0 1 0 710 0 396 1 30.8939 0 0 0 711 0 396 1 28.3231 0 1 0 712 0 396 1 29.8316 0 1 0 714 0 396 1 23.0938 0 1 0 700 0 327 2 0 28. 0329 0 0 703 0 84 2 0 31. 4661 0 1
59
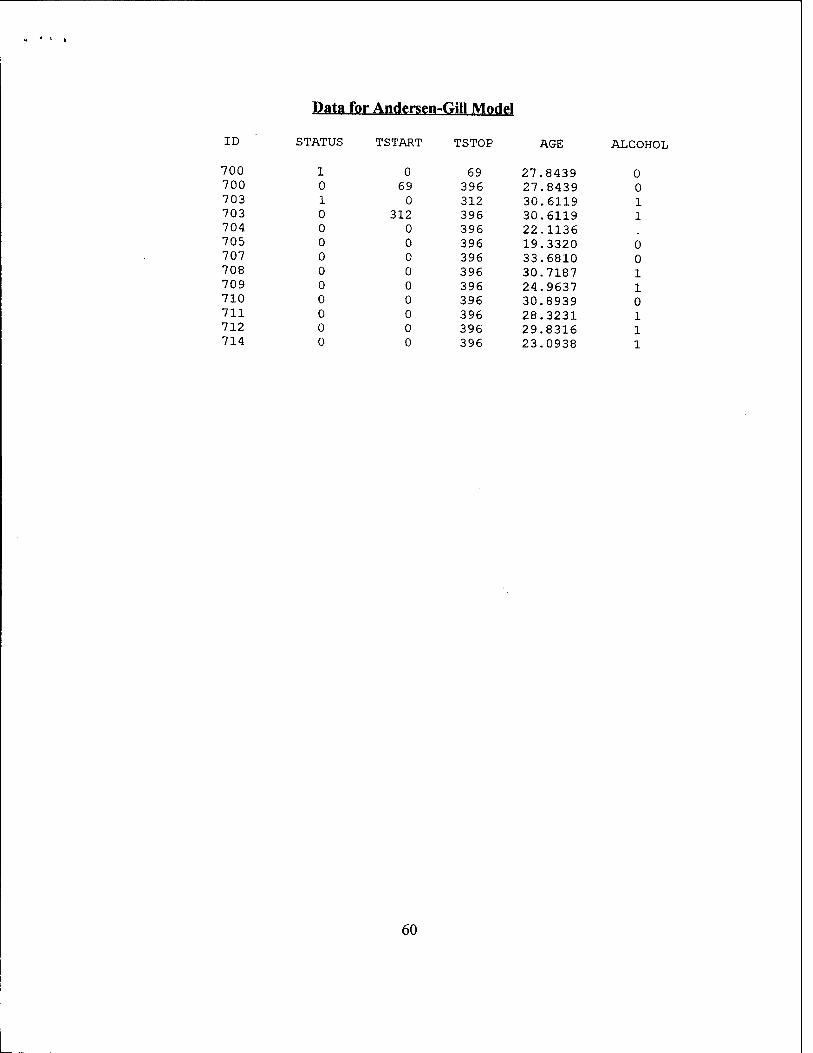
Data for Andersen-Gill Model
ID STATUS TSTART TSTOP AGE ALCOHOL
700 1 0 69 27.8439 0 700 0 69 396 27.8439 0 703 1 0 312 30.6119 1 703 0 312 396 30.6119 1 704 0 0 396 22.1136 705 0 0 396 19.3320 0 707 0 0 396 33.6810 0 708 0 0 396 30.7187 1 709 0 0 396 24.9637 1 710 0 0 396 30.8939 0 711 0 0 396 28.3231 1 712 0 0 396 29.8316 1 714 0 0 396 23.0938 1
60
BIBLIOGRAPHY
Allison, P. D. (1995), Survival Analysis Using the SAS® System: A Practical Guide. Cary, NC: SAS Institute Incorporated.
Amoroso, P. J., Swartz, W. G, Hoin, F. A., and Yore, M. M. (1997), Total Army Injury and Health Outcomes Database: Description and Capabilities, USARIEM Technical Report TN97-2.
Andersen, P. K., Borgan, O., Gill, R. D., and Keilding, N. (1993), Statistical Models Based on Counting Processes. New York: Springer-Verlag.
Andersen, P. K., and Gill, R. D., (1982), "Cox's Regression Model for Counting Processes: A Large Sample Study," The Annals of Statistics. 10, 1100-1120.
Brodine, S. K., and Shaffer, R. A., (1995), Unpublished data.
Collett, D. (1994), Modelling Survival Data in Medical Research. New York: Chapman and Hall.
Cox, D. R. (1972), "Regression Models and Life Tables (with discussion)," Journal of the Royal Statistical Society. Series B, 34,187-220.
Hosmer, D. (1996), Survival Analysis in Epidemiology. Lectures given at New England Epidemiology Institute, 24-28 June, at Tufts University, Massachusetts.
Jones, B. H., and Hanson, B.C., (1996), Injuries in the Military - A Hidden Epidemic, A report by the Armed Forces Epidemiology Board Injury Work Group, USACHPPM.
Jones, B. H., Cowan, D. N, Tomilson, J. P., Polly, D. W., and Frykman, P.N. (1993), "Epidemiology of Injuries associated with Physical Training Among Young Men in the Army," Medicine and Science in Sports and Exercise. 25,197-203.
Jones, B. H., Manikowski, J. H., Harris, J. H, Dziados, J., Norton, S., Ewart, T., and Vogel, J. A. (1988), Incidence of and Risk Factors for Injury and Illness among Male and Female Army Basic Trainees, USARIEM Technical Report T19-88.
Prentice, R. L., Williams, B. J, and Peterson, A. V. (1981), "On the Regression Analysis of Multivariate Failure Time Data," Biometrica, 68, 373-379.
61

Province, M. A., et al., (1995), "The Effects of Exercise on Falls in Elderly Patients," Journal of the American Medical Association. 273, 1341-1347.
62