multiple jet study - nasa · iiasa cr 121217.. multiple jet study w final report case file copy by...
TRANSCRIPT

IiASA CR 121217
..
MULTIPLE JET STUDY
w
FINAL REPORT
CASE FILEcOPY
by
R. E. Walker
and
D. L. Kors
Aerojet Liquid Rocket CompanySacramento, California 95812
!
Prepared for
National Aeronautics and Space Administration
NASA Lewis Research CenterContract NAS3-15703
J. O. Holdeman, Project Manager
I-
https://ntrs.nasa.gov/search.jsp?R=19730017559 2018-08-21T14:02:54+00:00Z


1, Report No.IiASA CR-121217
4. Title and Subtitle
7, Author(s)
2. Government AccessionNo. 3. Recipient'sCatalog No.
5. Report Date
June 1973MULTIPLE JET STUDY - FINAL REPORT
R. E. Walker and D. L. Kors
9. _rforming OrganizationName and Addre_
kerojet Liquid Rocket CompanyP. O. Box 13222Sacramento, California 95813
12. Sponsoring Agency Name and Address
National Aeronautics and Space AdministrationWashington, D. C. 20546
15. Supplementary Notes
6. Performing Organization Code
8. PerformingOrganization Report No,
10. Work Unit No.
11, Contract or Grant No,
NAS 3-15703
13. Type of Report and Period Covered
Contractor Report
14.SponsoringAgency Code
Project ),ianager, James O. Holaeman, Air Ereathing Engines Division,I_ASA Lewis Research Center, Cleveland, Ohio 44135
16. AbstractTest data is presented which allows determination of jet penetration and mixing of multiple
cold air jets into a ducted subsonic heated mainstream flow. Jet-to-mainstream momentum fluxratios ranged from 6 to 60. Temperature profile data is presented at various duct locations upto 24 orifice diameters downstream of the plane of jet injection. Except for two configurations,all geometries investigated had a single row of constant diameter orifices located transverse tothe main flow direction. Orifice size and spacing between orifices were varied. Both of thesewere found to have a sig,ificant effect on jet penetration and mixing. The best mixing of thenot and cold streams was achieved with spacing between the orifices equal to one half of the ductheigi_t. For this spacing, variation in orifice size changed the mean exit temperature level, butdid not significantly alter the shape of the distributions. The mixing at the various test con-ditions was evaluateG using an energy exchange parameter developed in this program. Comparisonof the results of this study with existing single jet data indicates that single jet correlations
do not adequately describe the multiple jet results.
17. Key Words (Suggested by Author(s))
Jet Mixing; Jet Penetration; Jets in Crossflow;Combustion Gas Oilution; Temperature Distributior
18. Distribution Statement
Unclassified - Unlimited.
19. S_urity Classif. (of this report)
Unclassified
20. SecurityCla_if. (of this _)
Unclassified
21. No. of Pages
104
' For sale by the National Technical Information Service, Springfield, Virginia 22151
22, Price*
$3.00
NASA-C-I_)a (R_'_ h-71)
FOREWORD
The work described herein was conducted by the Aerojet
Liquid Rocket Company under r_ASA Contract NAS3-15703; the period of
performance was 31 March 1972 through 31 I,iarch 1973. Dr. J. D.
Loldeman, i_ASA-Lewis Research Center, was the _ASA Project Hanager.
_r. U. M. Campbell and Mrs. N. M. Kosko of the Engineering
Con_puter Services Department, ALRC provided invaluable assistence
in setting up tile computerized data reduction and plotting routines used
throughout this program.
Messers u. M. Jassowski, G. Chin and A. R. Keller of the
ALRC Aerophysics Laboratory provided the technical expertise in the
areas of test facility design, data acquisition/instrumentation and test
facility buildup upon which the success of the program depended.
iii

TABLE OF CONTENTS
I
II
Ill
IV
BI
C.
REFERENCES
APPENDIX A.
APPENDIX B
APPENDIX C
APPENDIX D
TABLES
FIGURES
SUMMARY
INTRODUCTION
TECHNICAL DISCUSSION
A. TEST FACILITY DESCRIPTION
B. ORIFICE PLATE CONFIGURATION
C. DATA REDUCTION AND ANALYSES PROCEDURES
D. DEFINITIONS OF DINENSIONLESS PARAMETERS
E. TEST RESULTS
CONCLUSIONS
A. MIXING PARAMETERS
OPERATING PARAMETERS
DESIGN PARAMETERS
SYMBOLS
DETAILED TEST FACILITY DESCRIPTION
FLOW SYSTEM CHECKOUT, CALIBRATION ANDTEST PROCEDURE
DATA A_LYSIS PROGRAM
Page
l
3
6
6
7
9
16
33
33
33
35
36
38
44
48
5O
64
iv

TABLE LIST
TableNo.
I •
II.
Ill.
IV.
Ve
VI.
Orifice Plate Configurations
Comparison of Multiple Jet Study MixingParameters
Test Data Summary for Orifice Plates 1/02/16,4/02/16, and 2/92/16
Test Data Summary for Preselected OrificePlate Test Series
Test Data Summary for Final Orifice PlateTest Series
Sample Test Data Analysis Output
Paqe
5O
51
52
54
56
57
V

FIGURE LIST
FigureNo.
l ,
2.
3.
4.
5.
6.
7.
8.
9.
lO.
II.
12.
13.
14.
15.
16.
17.
18.
19.
20
21
22
23
24
25
26.
27.
Multiple Jet Study Test Apparatus Schematic
Multiple Jet Study Test Facility
Multiple Jet Study Test Duct
Multiple Jet Study Instrumentation Rake
Multiple Jet Study Orifice Plates & Turbulence Grids
Computerized Data Acquisition, Reduction & Analysis System
Multiple Jet Study Coordinate System
Comparison of Mixing Efficiencies & Temperature Profiles
Comparison of Pressure Distribution at J=14 & J=57
Effect of Momentum Flux Ratio on Temperature Profile
Effect of X/D on Energy Exchange Efficiency, Orifice
Plate 1/04/08
Effect of Momentum Flux Ratio on Temperature Contours
Effect of Absolute Momentum Level on Temperature Profiles
Effect of Density Ratio on Temperature Profiles
Effect of X/D on Energy Exchange Efficiency, Orifice
Plate 2/02/16
Effect of X/D on Energy Exchange Efficiency, Orifice
Plate 1/02/08
Effect of X/D on Energy Exchange Efficiency, Orifice
Plate 1/04/12
Effect of Turbulence Grid on Temperature Profiles
Temperature Profiles for Constant Orifice Area
Effect of Orifice Diameter on Temperature Profiles,
Constant S/D
Effect of X/D on Energy Exchange Efficiency, Orifice
Plate 1/02/16
Effect of X/D on Energy Exchange Efficiency, Orifice
Plate 1/02/12
Effect of X/D on Energy Exchange Efficiency, Orifice
Plate 1/02/06
Effect of X/D on Energy Exchange Efficiency, Orifice
Plate 1/02/04
Comparison of Temperature Profiles at Constant S/H
Effect of X/D on Energy Exchange Efficiency, Orifice
Plate 1/03/06n
Effect of Spacing on Temperature Profiles for J=60,
Constant Orifice Dia.
Page
64
65
66
67
68
69
70
71
72
73
74
75
76
77
78
79
80
81
82
83
84
85
86
87
88
89
90
vi

Figure List (cont.)
FigureNo.
28.
29.
30.
31.
32.
33.
36.
37.
38.
39.
40.
41.
Effect of Spacing on Temperature Profiles for J=6& J--26, Constant Orifice Dia.
Effect of X/D on Energy ExchangeEfficiency, OrificePlate 1/03/08
Effect of X/D on Energy ExchangeEfficiency, OrificePlate 1/06/08
Effect of Orifice Shapeon Temperature Profiles
Effect of Double Orifice Rowson Temperature Profile
Effect of X/D Energy ExchangeEfficiency, OrificePlate 1/04/08d
Effect of Mixed Orifice Size on Temperature Profile
Effect of X/D on Energy ExchangeEfficiency, OrificePlate 1/03/06m
Effect of X/D on Energy ExchangeEfficiency, OrificePlate 1/04/04
Comparisonof Multiple Jet and Single Jet TemperatureCenterline Data
Comparisonof Multiple Jet and Single Jet VelocityCenterline Data
Air Flow Facility Capability
Test Duct Reynolds Number
Test Duct Boundary Layer Developmentand Trip Location
91
92
93
9495
96
97
98
gg
100
IOl
I02
I03
I04
vii
I SUMMARY
The objective of this study was to determine empirically the pene-
tration and mixing characteristics of multiple jets of ambient air injected
normally into a heated uniform flow between parallel walls. The range
of geometric and flow variables for this program were selected to make the
experimental data relevant to the design of combustors for gas turbine
engines.
Primary independent test variables were the orifice plate configura-
tion (16 orifice plate configurations were tested) and the ratios of jet-
to-mainstream momentum flux. The orifice plates contained sharp edged
orifices ranging in diameter from 0.63 cm (0.25 in.) to 2.54 cm (I.0 in.)
with the dimensionless orifice spacing, S/D, varied between 2 and 6. Momentum
flux ratios were varied by changing mainstream temperature and velocity, and
jet velocity in a prescribed manner. The mainstream flow field temperatures
surveyed were 450°K (810°R), 600°K (I080°R), and 750°K (1350°R), and the
mainstream velocity was varied from 15 m/sec (50 ft/sec) to 40 m/sec (155
ft/sec). Jet velocities, at the jet vena contracta, ranged from 25 m/sec
(83 ft/sec) to 121 m/sec (396 ft/sec). The jet penetration and mixing
characteristics were determined by total pressure and temperature surveys
throughout the flow downstream of the plane of secondary injection.
The results of this study are based on experimental observations.
No tasks to model the jet penetration and mixing processes were within the
scope of this program. A mixing parameter, ET, derived from observations
of the experimental data,expresses the mixing effectiveness as a percent
of the ideal energy exchanged between the cool jets and the hot mainstream.
The correlation of ET with the operating and design variables surveyed during
this study, in graphical form, was an end product of the investigation. In
addition to these ET correlatiors, isometric and contour plots of a non-
dimensional temperature parameter are presented for a variety of test condi-
tions and orifice geometries. These plots show the temperature profiles in
the test duct at several locations and clearly illustrate the penetration and
I Summary (cont.)
mixing characteristics of the secondary jets under a variety of conditions.
Based on evaluation of these data, the jet-to-mainstream momentum
flux ratio is the most important operating variable influencing jet pene-
tration and mixing. Neither the absolute momentum flux level of the two
streams nor the jet-to-mainstream density ratio appeared to influence jet
penetration or mixing significantly, except for the density ratio contri-
bution to the momentum flux ratio. At a given momentum flux level and dis-
tance from the injection plane, jet penetration and mixing increased with
increasing orifice diameter. However, the increase in jet penetration with
increased orifice diameter was influenced strongly by the orifice spacing.
Closely spaced orifices tended to inhibit penetration of the jet into the
mainstream. The use of slotted orifices appears to offer no significant
change in penetration when compared to circular orifices. Under some con-
ditions double orifice rows or mixed orifice sizes in a single row yield
better jet penetration and mixing compared to a single orifice row with
the same total flow area. Finally, the multiple jet results of this study,
when compared with single jet data, show that the interaction of adjacent
jets influences the temperature and velocity centerline trajectories.
-2-
II INTRODUCTION
The Multiple Jet Study was conducted under NASA Lewis Research
Center Contract NAS 3-15703. The purpose of the study was to determine
experimentally the penetration and mixing characteristics of multiple jets
of ambient temperature air injected perpendicularly into a bounded main-
stream of hot combustion gases. Data on the penetration and mixing of jets
in a crossflow has application to many problems of current interest, such as:
(1)
(2)
(3)
(4)
Cooling of hot gas streams in numerous industrial and military
devices.
Film cooling of combustion chamber walls, turbine blades,
and reentry vehicle nose cones.
The aerodynamics of STOL and VTOL aircraft.
The concentration and paths of pollutants downstream of
industrial chimneys or downstream from discharge lines leading
into rivers or streams.
The results of this investigation apply most directly to Item (I)
above. In particular, the results of the Multiple Jet Study have application
to combustion devices which use air dilution to cool combustion products and
quench reactions. The development of valid correlations for the mixing process
between cool multiple jets and a hot primary gas stream has two principal
benefits: (I) Through proper design of secondary air admission ports, the
combustor lengths required to achieve uniform temperature and mass flux profiles
can be minimized, and (2) the decreased combustor length required for complete
mixing will result in minimum residence time for production of nitrogen oxides.
Although the interaction of subsonic circular and noncircular jets
injected normally into a subsonic mainstream flow has been the subject of
numerous analytical and experimental studies, Ref. 1 - 5, the published works
to date have dealt with single jets rather than multiple jets in a bounded
cross flow as required for the cooling problem. The data of References 1 through
5 are for heated or ambient temperature jets directed upward into a mainstream
flow. In addition to pressure and/or temperature measurements in the flow field,
-3-

II Introduction (cont.)
the studies of References l, 2 and 4 also employed visual techniques to
define jet trajectories. The photographic data from Reference 6 showed
the ambient temperature jet path to be essentially the same, whether the
jet entered the mainstream vertically from the top or the bottom. The test
conditions of the current work more closely approximates the real gas
turbine combustor case than the conditions tested in the references cited
above; since (1) the use of cold jets exiting into a hot primary stream
is a better simulation of the combustion quenching process than studies of
interactions between hot jets and a cold primary flow, and (2) the use of
multiple injection ports provides a better characterization of a combustor
than does single jet injection.
The current work, through the use of 3800 stagnation pressure
and temperature probe measurements in the flow field at five axial stations,
has resulted in detailed temperature and pressure data at each axial meas-
urement plane. These data provide a quantitative measure of the mixing achieved.
Also when these data are presented in three-dimensional plots, they provide
a qualitative evaluation of the penetration and mixing. In order to process
the large quantity of data from each of the I05 tests conducted during the
program (over 8000 data values were measured for each test), all data reduc-
tion, analysis and flow field temperature and pressure plots were done by com-
puter.
Sixteen orifice plates were tested at a minimum of four operating
conditions each. The basic operating conditions were at a nominal mainstream
to jet temperature ratio of 2.0 and nominal jet to mainstream momentum flux
ratios of 6, 14, 25 and 60. On some tests other effects were evaluated; abso-
lute momentum level was changed and several tests were conducted with mainstream
to jet temperature ratios of 1.5 and 2.5. Turbulence generating grids were
used on some tests and a secondary air crossflow component was introduced on
some tests by the use of baffles.
-4-
II Introduction (cont.)
Due to the large volume of data collected during this study, not
all the data are shownin this report. A ComprehensiveData Report (CDR)
was compiled which contains a complete reduced data listing and complete
temperature and pressure plots. Copies of this documentare in the possessionof the NASAProject Manager.
-5-
III TECHNICAL DISCUSSION
A. TEST FACILITY DESCRIPTION
The principal test apparatus consists of an air supply system,
hydrogen-fired vitiated air heater for the primary flow, primary air plenum,
main air duct (10.16 cm (4 in) by 30.48 cm (12 in) by 88.9 cm (35 in) long),
secondary air plenum, orifice plates (16), pressure and temperature rake with
traversing system, and the instrumentation and data acquisition system. A
schematic illustration of the test facility is shown in Figure I, and a photo-
graph showing the overall facility setup, before thermal insulation was applied,
is shown in Figure 2. A portion of the main air test duct with orifice plates
being installed is shown in Figure 3. The pressure probe/ thermocouple rake
shown in Figure 4 was traversed at five axial locations to determine flow
field mass flux and temperature distributions. The facility was designed to
minimize the effects of thermal expansion of the test duct on measurement pre-
cision. Also, the facility was designed and calibration tested to produce a
uniform velocity and temperature profile (within _2%) 5.08 cm (2.0 in) up-
stream of the secondary injector plane. A more detailed description of the
test facility and measuring apparatus is contained in Appendix B.
Prior to conducting tests with the various orifice plates,
system checkout and calibration tests were made to demonstrate system opera-
tion, measurement precision and uniformity of pressure and temperature in the
test duct flow field. A discussion of these tests and a review of orifice
plate test procedures is contained in Appendix C.
B. ORIFICE PLATE CONFIGURATIONS
The design features of the sixteen orifice plate configurations
which were tested during the Multiple Jet Study, are shown on Table I. Each
plate is identified by a configuration number which consists of one single
digit number and two 2-digit numbers separated by a slash and followed by
an alpha character for special identification. The first number is the aspect
ratio of the orifice, (I for circular orifices). The second number is the
nondimensional orifice spacing, orifice center to center dimension, S, divided
-6-

III Technical Discussion (cont.)
by the orifice diameter, D; and the third number is the nondimensional orifice
size, the duct height, H, divided by the orifice diameter, D. When an alpha
character is appended, an "n" indicates a nominal orifice size,an "m" indicates
mixed orifice sizes in a single row and "d" indicates a double orifice row
plate. The 13 predrilled orifice plates (ll of these were subsequently tested)
are shown in Figure 5. One of the orifice plates is shown with downstream
orifice static pressure taps installed. The two turbulence generating grids
which were used on selected tests also are shown in the figure.
C. DATA REDUCTION AND ANALYSIS PROCEDURES
A large quantit# of data was generated from each of the 105
tests conducted during this program (8035 data values were measured during
each test.) In order to process this large quantity of data all data
reduction, analysis, and flow field temperature and pressure plots were done
by computer. The steps involved in the data acquisition, reduction, and
analysis for the Multiple Jet Program are shown schematically in Figure 6.
The pressure and temperature probe signals were fed through signal conditioning
equipment (i.e., amplifiers, balance and range circuits, etc.) to a digital
printer and magnetic tape recorder. The printer provided a quick readout of
the data for monitoring purposes whereas the magnetic tape provides permanent
storage for subsequent reduction and analysis. After the test or series of tests
were completed, the magnetic tape was sent from ALRC by courier to the data
processing center where the magnetic tape was read into a hi-speed digital
computer, upon demand from the timeshare console located at ALRC. This pro-
cess was executed by inputting a data reduction program which read the tape
into the Program Complex File (PCF). The output was a computer listing of the
data as a function of time and a magnetic tape file of the reduced data. The
computer data listing was used to check the data for inconsistencies and/or
errors. The magnetic tape file was used for subsequent data analysis.
Data analysis was accomplished by inputting a data analysis
computer program and a directive to read the magnetic tape data file into the PCF.
The program output consisted of a computer listing of the calculated correlation
-7-

III Technical Discussion (cont.)
parameters and a magnetic plot tape of the selectea currelations. Data
plots were made by sending the plot tape to ALRC where it was processed on
a microfilm printer/plotter. This machine is a high-speed electronic printer/
plotter which has the capability to produce either microfilm or hard copies
of the data plots. The plotter operates by projecting the plots on a cathode
ray tube (CRT) and then photographing the display with either a microfilm
or a hard copy camera. The machine can read the tape data at a peak rate
of 20,000 bits/second and is capable of producing well over 200 plots/hour.
This data system is capable of producing a complete analysis and set of data
plots within three working days from receipt of the raw data tape.
I . Data Reduction Program
The objective of the data reduction program was to take
the raw digital data from the test data tapes, convert the data into engineering
units, and format the data to facilitate the mathematical computation which
was performed with the data analysis program. To achieve this objective, the
data reduction program used the various scale factors for each channel to
convert from raw input to engineering unit output. Since the test data was
recorded on the test tape in sequence of channel numbers and Scanivalve and
thermocouple stepper switch locations, the program reformated the data to place
like parameters in consecutive array positions. An interlaced array of alter-
nating integer and real numbers was used for program output. The integer
number represents the original location in the input data array and the real
number represents the value of the parameter in engineering units.
An EDIT subroutine was utilized to edit the incoming
data. In order for the test data reduction program to function properly,
the sequence of data acquisition had to be well defined so that the various
test parameters were identified correctly. Problems developed if input data
had an incorrect channel number assigned or if data values were repeated
or skipped. In order to eliminate these problems, the data editing subprogram
prescanned the data prior to execution of the data analysis program and iden-
tified and/or corrected data sequencing anomalies.
-8-
III Technical Discussion (cont.)
, Data Analysis Program
The objective of the data analysis program was to use
the output from the data reduction program to calculate test run conditions
(weight flow rates,velocities, Mach numbers, momentum fluxes, densities, and
temperature), dimensionless temperature and pressure profiles, and correlating
parameters (pattern factors and energy exchange (ET)Values). The output from
the analysis program was a paper listing of the run conditions, correlating
parameters, and temperature and pressure values. In addition to the paper
listing, the temperature and pressure profile data were output on a magnetic
drum for use as input to the computer plotting routines. When the plot program
was executed, the output data was stored on magnetic tape which was then input
to the microfilm printer/plotter. Details of the methods of calculation used
in the data analysis program are contained in Appendix D.
D. DEFINITIONS OF DIMENSIONLESS PARAMETERS
The data resulting from tests conducted during this program were
evaluated in terms of nondimensional geometry, temperature, pressure and mixing
parameters.
l ° Nondimensional Orifice Plate and Test Duct GeometryParameters
a. Orifice Plate
Although the nondimensional orifice plate para-
meters S/D and H/D have been introduced in a previous section, some further
discussion is warranted. With multiple jet injection, the spacing between
adjacent orifices may be defined by either of two nondimensional parameters;
(I) the orifice center to center distance, S, divided by the orifice diameter,
D, or (2) orifice spacing S, divided by duct height H. For this study, the
duct height was held constant.
-9-
III Technical Discussion (cont.)
b. Test Ouct
The coordinate system used for the Multiple
Jet Study is orthogonal, with the X axis defined as the longitudinal axis
along the test duct axis, the Y axis as the vertical axis (in the direction
of the orifice centerlines) and the Z axis as the horizontal axis. The
coordinate system is illustrated on Figure 7. The X = 0 station is the jet
injection plane, Y = 0 station is at the jet orifice exit plane, and Z = 0
is the vertical plane at the first lateral measurement station, usually
the midplane between two orifices.
The downstream distances from the plane of the
secondary injection may be evaluated either in terms of the downstream dis-
tance to orifice diameter ratio, X/D, or in terms of the ratio of downstream
distance to duct height, X/It. If the ratio of duct height to orifice dia-
meter is large and jet to mainstream momentum flux ratio low, opposite wall
influences should be small and X/D would be expected to be the best correlating
parameter. However, if the ratio of duct height to orifice diameter is small
and jet to mainstream momentum flux ratio is high, then opposite wall influences
probably should not be neglected and X/H as well as X/D should be considered
as a correlating parameter. This is particularly evident when over penetration
of the jet occurs and the correlation between penetration depth and downstream
distance, X/D, deviates from the expected exponential relationship. A sample
of the dimensionless temperature profile at the X/H = .25 plane is shown in
the inset of Figure 7. The data was plotted over an orifice spacing of 2S,
beginning at the midpoint between two orifices. The relative jet orifice sizes
are shown on the figure and jet and mainstream velocity vectors are shown as
Vj and U._ , respectively. The vertical duct axis is labeled Y/H with values
from 0 at the top of the duct to 1.0 at the bottom of the duct. The Z axis
is unlabeled, however, its length is always 2S and twenty-one equally spaced
temperature profiles are shown in the Z direction. The value of the non-
dimensional temperature,_, at a point in the Y/Z plane is indicated by the scale
on the third axis at the top of the figure. (High values of & indicate the cool
region while low values of_indicate the hot region).
-I0-

Ill Technical Discussion (cont.)
. Nondimensional Temperature
The nondimensional temperature difference in the flow field
downstream of jet injection, _, is defined as:
T_ - Tx ,y,z
_x,y,z = T_ - Tj
(1)
where:
oo _-_
TJ
T =x,y,z
Theta, nondimensional temperature difference at a pointin the flow field
primary flow stagnation temperature
jet stagnation temperature
stagnation temperature at a point in the flow field
Theta is a measure of the temperature suppression in the flow field compared
to the maximum possible suppression. The value of theta can vary from one,
when measured temperature equals the jet temperature, to zero, when the
measured temperature equals the mainstream temperature.
If complete mixing of jet and mainstream flows occurs,
the value of theta will be constant and T will be everywhere equal tox,y,z
the ideal equilibrium temperature between jet and mainstream; thus,
T _ - T EB (2)
T oo - TJ
where: _I =
TEB =
ideal equilibrium theta
stagnation temperature resulting from complete
thermal energy exchange
The average value of theta, _ave' is defined as,
_ave
where: #ave :
T =x,ave
Too Tx, ave (3)
Too - TJ
average value of theta
arithmetic average of temperatures measuredin a plane at distance X from the injectionplane
-ll-
III Technical Discussion (cont.)
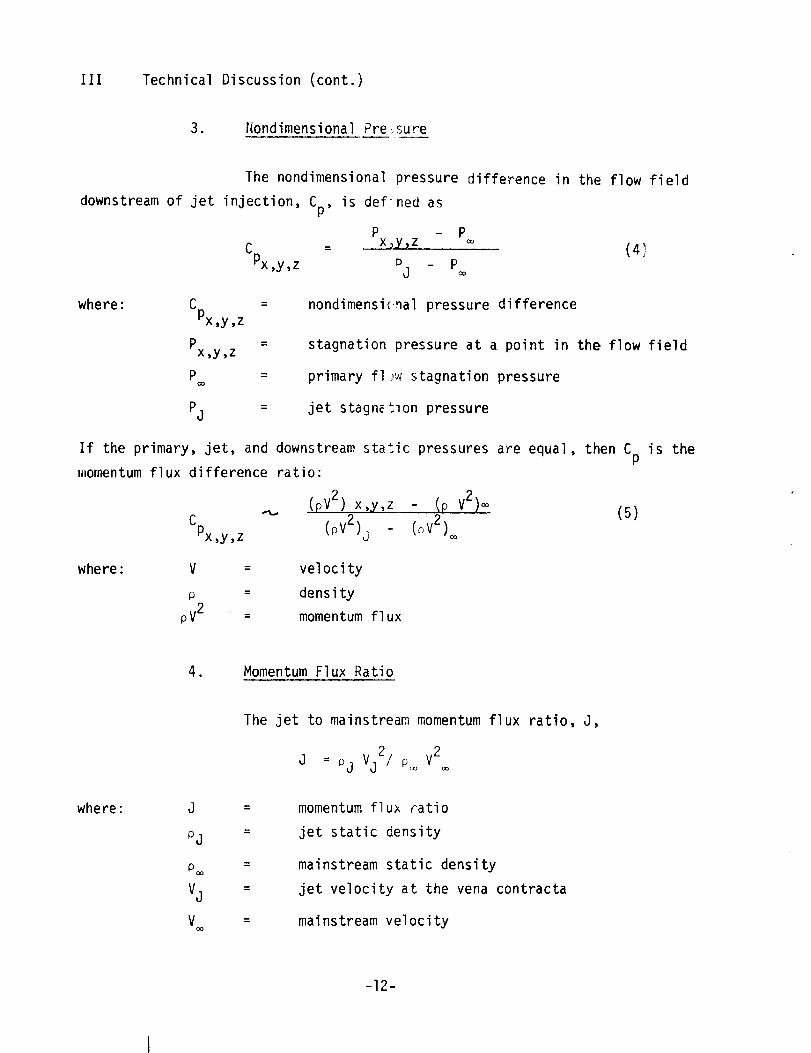
. Nondimensional Pressure
The nondimensional pressure difference in the flow field
downstream of jet injection, Cp, is def ned as
p - p
Cpx = x_y,z co (4 _,_,y,z D _ p
J co
where: C
Px,y,z
p =x,y,z
p =CO
nondimensicnal pressure difference
stagnation pressure at a point in the flow field
primary fl ,w stagnation pressure
Pj = jet stagn_tlon pressure
If the primary, jet, and downstream static pressures are equal, then CP
momentum flux difference ratio:
-_ (pV2) x,y,z - IP V2)rV2
Cpx,y,z (pV2)j (o )CO
(5)
is the
where: V = velocity
p = dens ity
pV2 = momentum flux
. Momentum Flux Ratio
The jet to mainstream momentum flux ratio, J,
= Vj2/ V2J pj P_ CO
where : j __.
pj =
(Z)CO
Vj =
VCO
momentum flux ratio
jet static density
mainstream static density
jet velocity at the vena contracta
mainstream velocity
-12-
III Technical Discussion (cont.)
is the most important operating variable influencing jet penetration and
mixing• It is the best measure of the ability of the jet flow to penetrate
the mainstream flow field.
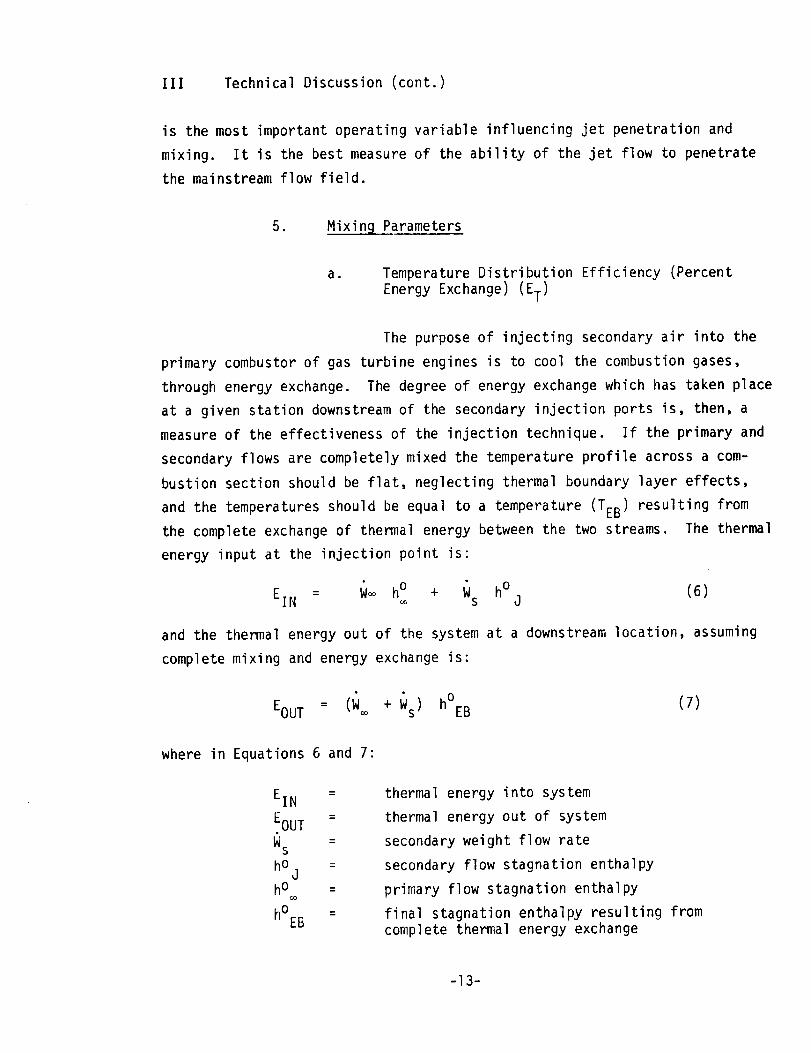
o Mixin 9 Parameters
al Temperature Distribution Efficiency (Percent
Energy Exchange) (ET)
The purpose of injecting secondary air into the
primary combustor of gas turbine engines is to cool the combustion gases,
through energy exchange• The degree of energy exchange which has taken place
at a given station downstream of the secondary injection ports is, then, a
measure of the effectiveness of the injection technique. If the primary and
secondary flows are completely mixed the temperature profile across a com-
bustion section should be flat, neglecting thermal boundary layer effects,
and the temperatures should be equal to a temperature (TEB) resulting from
the complete exchange of thermal energy between the two streams. The thermal
energy input at the injection point is:
= _ h° (6)EIN W_ h° + Ws j
and the thermal energy out of the system at a downstream location, assuming
complete mixing and energy exchange is:
EOUT = (W_ + Ws) h°EB (7)
where in Equations 6 and 7:
EIN =
EOUT =
Ws =
hO =d
h 0 =
h0 =EB
thermal energy into system
thermal energy out of system
secondary weight flow rate
secondary flow stagnation enthalpy
primary flow stagnation enthalpy
final stagnation enthalpy resulting fromcomplete thermal energy exchange
-13-

III Technical Discussion (cont.)
Assuming an adiabatic system, the energy
gained by the secondary flow should equal the energy lost by the primary
flow, or for complete energy exchange:
W h° + Ws h° = =j (W + Ws) h° ho® _ EB WT EB (8)
Equation (8) applies if the exit enthalpy is uniform. In the real case,
temperature and mass flux gradients will exist in the exit flow, and the
energy balance is expressed as:
N
W h° + Ws h° =_ j _ h°i (9)
i=l
The incremental mass flow at any location,
Wi' may be considered to have originated in the free stream, the jet, or
both. Thus let
Wi = (Wsi + W_ i) (lO)
where: N
Wsi = Ws
i=l
and N
W i = W
i=l
Wi = WT
Equation (9) can now be written as:
N N
_l Wsi (h°i - h°J) + _l W_ i (h°i - h° ) = 0(ll)= _"
-14-
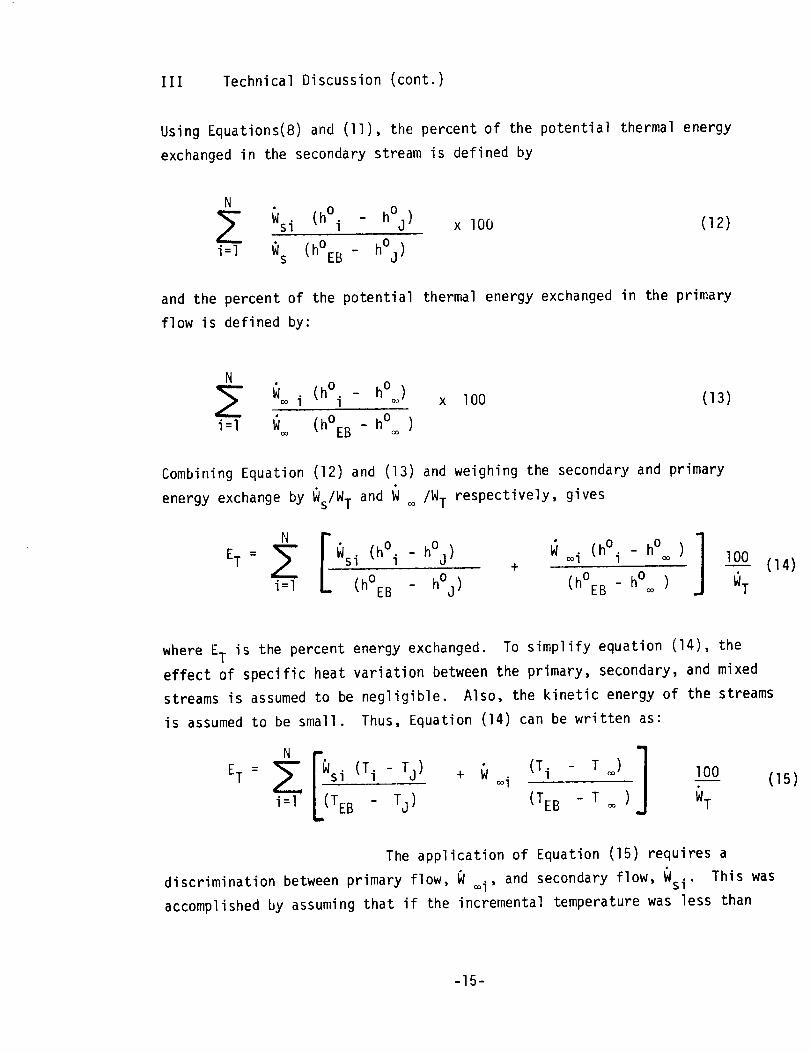
III Technical Discussion (cont.)
Using Equations(8) and (ll), the percent of the potential therma] energy
exchangedin the secondary stream is defined by
N
Z Wsi (h°i - h°J }
i:1 Ws (h°EB - h°J )
x lO0 (12)
and the percent of the potential thermal energy exchanged in the primary
flow is defined by:
N
Q i (h°i- h° )Oo o.1
i=1 W_ (h°EB - h°_o )
x lO0 (13)
Combining Equation (12) and (13) and weighing the secondary and primary
energy exchange by Ws/WT and W _ /WT respectively, gives
i=l (h°EBho]- h°J ) W _i (h°i _ ) lO0 (14)
+ _ ho- h°J ) (h°EB _ ) WT
where ET is the percent energy exchanged. To simplify equation (14), the
effect of specific heat variation between the primary, secondary, and mixed
streams is assumed to be negligible. Also, the kinetic energy of the streams
is assumed to be small. Thus, Equation (14) can be written as:
ET : Z si (Ti- Tj) + _ (Ti - T ) 100(]5)
The application of Equation (15) requires a
discrimination between primary flow, W _i' and secondary flow, Wsi" This was
accomplished by assuming that if the incremental temperature was less than
-15-

III Technical Discussion (cont.)
the energy balance temperature, the incremental flow was part of the secondary
flow; i.e., if Ti<TEB then Wsi = Wi and W_i = O. Similarly if the
incremental temperature was greater than the energy balance temperature, the
incremental flow was part of the primary flow; i.e., if Tt> TEB then W®i : Wiand Wsi = O. While this is an implicit method for determining the flowsources, it results in a mixing efficiency parameter which yields realisticvalues when comparedwith the plotted temperature profiles.
b. Pattern Factor
A parameter often used to characterize the
exit temperature distribution in combustors is the pattern factor definedas:
6 = T - Tmax ave
Tav e - Tj
Since the maximum temperature which can be present in the flow is T
maximum pattern factor, 6*, is
6* = T - Tave : ve
Tav e - Tj l - Oav e
, the
This parameter may be calculated for each of the tests from the average theta
results presented. For many of the conditions examined, this parameter is
small due to small cooling flow rates, even though the mixing is very incomplete.
E. TEST RESULTS
Results from the multiple jet study are discussed in the
following paragraphs. Comparisons of the two mixing parameters, the energy
exchange efficiency and the pattern factor, are presented along with summaries
of test run conditions and mixing data. A discussion of the influence of test
operating and design parameters on jet penetration and mixing concludes the
section.
-16-
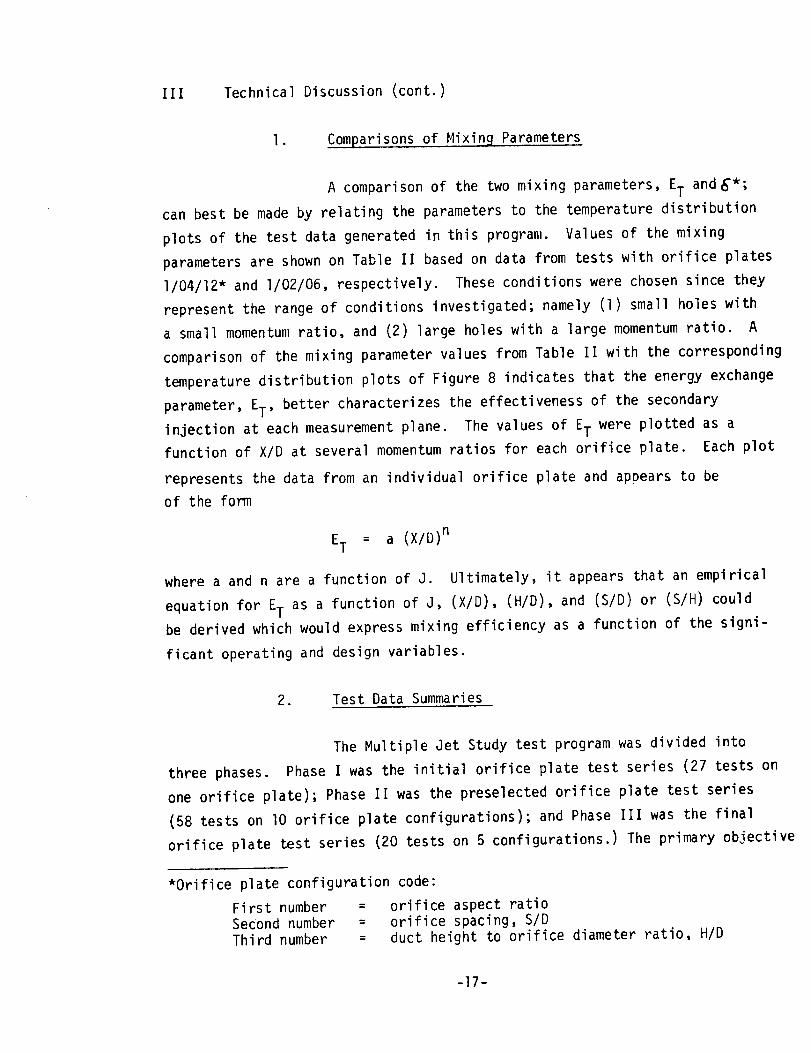
III Technical Discussion (cont.)
I • Comparisons of Mixing Parameters
A comparison of the two mixing parameters, ET andG*;
can best be made by relating the parameters to the temperature distribution
plots of the test data generated in this program. Values of the mixing
parameters are shown on Table II based on data from tests with orifice plates
1/04/12" and 1/02/06, respectively. These conditions were chosen since they
represent the range of conditions investigated; namely (1) small holes with
a small momentum ratio, and (2) large holes with a large momentum ratio. A
comparison of the mixing parameter values from Table II with the corresponding
temperature distribution plots of Figure 8 indicates that the energy exchange
parameter, ET, better characterizes the effectiveness of the secondary
injection at each measurement plane. The values of ET were plotted as a
function of X/D at several momentum ratios for each orifice plate. Each plot
represents the data from an individual orifice plate and apoears to be
of the form
ET : a (X/D) n
where a and n are a function of J. Ultimately, it appears that an empirical
equation for ET as a function of J, (X/D), (H/D), and (S/D) or (S/H) could
be derived which would express mixing efficiency as a function of the signi-
ficant operating and design variables.
2. Test Data Summaries
The Multiple Jet Study test program was divided into
three phases. Phase I was the initial orifice plate test series (27 tests on
one orifice plate); Phase II was the preselected orifice plate test series
(58 tests on lO orifice plate configurations); and Phase Ill was the final
orifice plate test series (20 tests on 5 configurations.) The primary objective
*Orifice plate configuration code:
First number = orifice aspect ratio
Second number = orifice spacing, S/D
Third number = duct height to orifice diameter ratio, H/D
-17-
III Technical Discussion (cont.)
of the Phase I tests was to determine the influence of certain operating
conditions on jet mixing and penetration. The operating variables surveyed
during the initial orifice plate test series were:
(i)
(2)
(3)
(4)
(5)
Jet to mainstream momentum flux ratio, J
Momentum flux level
Jet to mainstream density ratio
Turbulence level
Orifice inlet (cross velocity) conditions
With the exception of the momentum flux ratio the influence of these operating
parameters were found to be negligible. The Phase II testing included a further
survey of the effect of jet to mainstream density ratio but did not include a
survey over a range of the other non-sensitive variables. Tests Bt other than
the nominal density ratio of 2.0 were deleted from the Phase Ill testing.
a. Phase I Tests - Initial Orifice Plate Test Series
All initial orifice plate series tests were
conducted using orifice plate 1/02/16. The data from these tests, plus data
from tests of plates 2/02/16 and 4/02/16, are summarized on Table Ill. These
configurations had the smallest holes and the smallest orifice spacings tested.
The data presented on Table Ill consists of test
number, orifice plate configuration data, run conditions (mainstream Mach no.,
momentum flux ratio, density ratio, velocity ratio, flow ratio, turbulence
grid and baffle configuration, and momentum flux level) and jet/mainstream
mixing data. For the initial orifice plate test series, the mixing data pre-
sented consists of the ideal theta values and the average theta values at X/H
stations of .125, .250, .5 and l.O. Except for tests 22, 24, and 28 the
energy exchange efficiency, ET values, were not calculated during the initial
test series. (ET values calculated for tests 22, 24, 26 and 77, 78, 79 and 82
are shown on Figures 21 and 15 respectively).
-18-

III Technical Discussion (cont.)
A comparison of the average values of theta
at each of the four X/H planes shows that the average theta values are
higher than the ideal theta values. This result is expected since_-av e is
an arithmetic average, and, as can be been from the pressure data shown
in Figure 9, the mass flux distribution is not uniform. Since high local
theta values often occur with low velocities near the injection wall, the
average theta values are larger than the ideal theta values.
For low momentum ratios, the rather constant
average theta values indicate that mixing does not increase appreciably
with downstream distance. However, for high momentum ratios, the average
theta increases with downstream distance. This occurs since for these cases
the jet penetration increases with downstream distance, and thus higher than
average theta values occur with lower than average velocities over an in-
creasing percentage of the duct as distance increases.
b* Phase II Tests - Preselected Orifice Plate Design
Phase II tests were conducted with the remaining
ten predrilled orifice plates. Summarized test data for these tests are shown
in Table IV. For the majority of these tests the energy exchange parameter,
ET_as calculated. The general trend of this data shows increasing energy
exchange with increasing momentum flux ratio, orifice size and orifice spacing.
Test data for orifice plate 1/03/16 was invalid due to anomalous thermocouple
readings. Therefore, theta values and ET values were not tabulated for that
test series.
C. Phase III Tests - Final Orifice Plate Designs
Based on the mixing and temperature profile
data generated during the initial orifice plate test series and during the
preselected orifice plate test series, five design selections were made for
the orifice plate configurations to be tested during Phase Ill. Four of these
plates have the same open area as plate 1/02/08. The following is a brief
summary of the basis for the designs.
-19-
III Technical Discussion (cont.)
(1) Plate Configuration 1/04/04
Plate 1/04/04 contains the combination
of the largest diameter orifice, 2.54 cm (l.O0 in), and widest orifice spacing,
I0.2 cm (4.00 in), designed for the Multiple Jet Study. The design was selected
as a limit study based on observations from previous Multiple Jet test data
that penetration tends to increase with increasing orifice diameter and orifice
spacing. The area of this plate is equal to that of 1/02/08.
(2) Plate Configuration 1/02/04
Plate 1/02/04 has the same orifice diameter
as plate 1/04/04, but has I/2 the orifice spacing and hence twice the orifice
area. The orifice spacing of plate 1/02/04 is identical with the spacing on
predrilled plate 1/04/08 and thus provided data for the assessment of the
relative importance of S/D compared to S/H.
(3) Plate Configuration 1/03/06n
Plate 1/03/06n (n designates a nominal
orifice diameter, D= 1.8 cm (.707 in)) has the same spacing, S, as plate
1/02/04, however the reduced orifice diameter results in an orifice area that
is identical to the orifice area of plates 1/04/08d, 1/03/06m, 1/04/04 and
1/02/08.
(4) Plate Configuration 1/04/08d
Plate 1/04/08d (d designates a double orifice
row) was chosen in order to investigate the effect on jet penetration of closely
spaced multiple orifice rows. The data from tests of this plate will be com-
pared with the data from plate 1/04/08 which previously was tested.
(5) Plate Configuration 1/03/06m
Plate 1/03/06m (m designates mixed orifice
-20-

III Technical Discussion (cont.)
size) was designed in order to determine if alternating large widely space
orifices with smaller orifices between them will provide a combination of
high jet penetration from the large jets coupled with good back filling and
lateral spreading from the small jets.
The test data from the final orifice plate
test series are summarized in Table V.
. Influence of Operatin 9 and Design Parameters on JetPenetration and Mixin 9
The influence of the operating parameters, momentum
flux ratio, absolute momentum flux level, density ratio, turbulence
level, and orifice inlet conditions are discussed in the following paragraphs.
With the exception of the orifice inlet condition, these parameters are de-
fined independently from jet/mainstream mixing considerations. The momentum
flux ratio, density ratio, and flow ratio are dependent on the combustor
design criteria. Thus for a given combustor, the secondary admission design
parameters which may be varied to influence mainstream/jet mixing are the
secondary orifice diameter, spacing, and shape. However, since the flow con-
ditions for a given combustor determine the required orifice open area, the
orifice size and spacing must be correctly coupled. The results of this study
presented in the following paragraphs are based on experimental observations.
No tasks to model the jet penetration and mixing processes were within the
scope of this program.
a . Operating Parameters
(I) Momentum Flux Ratio
The jet to mainstream momentum flux
Vj2/p_ratio ( pj V ) is the single most important operating parameter
inf|uencing secondary jet penetration and mixing. The influence of momentum
flux ratio on jet/mainstream int_:action can be illustrated by the dimensionless
-2i -
III Technical Discussion (cont.)
temperature profile data presented on Figure I0 and the energy exchange data
of Figure II. The data presented in Figure I0 are from tests of orifice plate
1/04/08 at a nominal density ratio of 2.0 and momentum ratios of 61.9 and
6.3. The temperature data are shown at four axial stations: 0.25, 0.50, 1.0
and 2.0 duct heights downstream from the plane of injection. The better pene-
tration of the high momentum jet into the primary flow field is evident.
A Gaussian type vertical distribution
of the temperature parameter about its maximum value is evident at the first
measuring plane. The temperature centerline at the first station for the
J = 61.9 case is at a penetration depth, Y/H, of approximately 0.6, while
for the J = 6.3 case, the temperature centerline is at a Y/H of approximately
0.25. The energy exchange efficiencips, ET, for J = 61.9 and J = 6.3 are 66%
and 45% respectively, at X/H = 0.25 (Figure II). The temperature profile data
at the X/H = 0.5 plane shows the jet penetration depth has not increased sig-
nificantly for either the J = 61.9 case or the J = 6.3 case. However, the
amount of mixing has increased by 13%, from 66% to 79%, for J = 61.9, while
the percent mixing has increased only 5%, from 45% to 50%, for J = 6.2. At
the higher momentum, Figure I0 shows that the entire primary flow field
has been influenced by the secondary injection at X/H = 0.5, while with the
lower jet momentum, over two-thirds of the primary flow field is still unaffected
by the secondary injection. The data of Figure I0 indicate that, for both
the low and high momentum flux ratios, temperature centerline penetration depth
does not increase significantly with increasing X/H beyond X/H = 0.25 (X/D = 2).
However, a flattening of the vertical temperature profile occurs with increasing
X/H for both momentum flux ratios. Apparently the criterion for effective jet/
mainstream mixing is jet penetration to approximately I/2 the duct height
within approximately two jet diameters downstream, and the establishing of a
symmetrical vertical temperature distribution profile at this point. If these
conditions are met, then the spreading of the temperature profile, which is
noted on all tests, will result in the flattened temperature distribution at
downstream stations. Also, the data of Figure I0 indicates that if a flat
temperature profile is desired, over penetration of the jets into the main-
stream is preferable to under penetration-
-22-

III Technical Discussion (cont.)
Similar trends can be inferred from the@
contour plots of l u_=ve which are shown in Figure 12 for the same tests
and conditions shown in Figure lO. These plots show the differences in
temperature gradients within the jets and difference in jet boundaries for
th high and low momentum flux ratios.
(2) Absolute Momentum Level
The absolute momentum flux level does
not significantly influence jet penetration or jet/mainstream mixing over
the range tested. The similarity of the temperature difference ratio,_,
profiles at X/H = 0.25 and l.O for mainstream velocities of 25 and 50 m/sec
at J = 6.1 and at mainstream velocities of 16 and 23 m/sec at J = 58 for
orifice plate 1/02/16 can be seen from the data presented in Figure 13.
(3) Density Ratio
The jet to mainstream density ratio does
not appear to influence jet penetration or mixing significantly over a range
from 1.6 to 2.6, except for the density ratio contribution to the momentum
flux ratio. The similarity of the dimensionless temperature profile curves
for density ratios of 1.6, 2.1 and 2.6 is shown in Figure 14. The data in
Figure 14 were from orifice plate 1/02/08 at a nominal momentum flux ratio
of 25. Profiles are shown at axial stations corresponding to 0.50,
l.O and 2.0 duct heights downstream from the injection plane. The energy
exchange efficiency data shown in Figures II, 15, 16 and 17 also indicate
that momentum flux ratio, rather than an independent density ratio, is the most
significant operating variable controlling jet/mainstream mixing.
(4) Turbulence Level (Use of Turbulence
Generating Grids)
Although no direct measurements of flow
field turbulence intensity were made, a comparison has been made of the effect
-23-

III Technical Discussion (cont.)
on jet penetration and mixing resulting from use of turbulence generating
grids. Two grid designs were used: 0.795 cm (0.313 in) diameter rods with
2.54 cm (l.O in) spacing and 0.41 cm (0.162 in) diameter rods with 1.27 cm
(0.5 in.) spacing. Both grids were mounted I0.4 cm (4 in) upstream of the jet
injection plane. The highest level of turbulence would be expected with the
larger grid cross rods. The use of this turbulence generating grid tends to
reduce the maximum value of_slightly, compared to tests without the grid,
but the jet penetration depth was not altered significantly. A comparison
of_values with and without turbulence grids can be made by inspection of
Figure 18.
bo Design Parameters
The difference in temperature distribution
obtained by varying orifice diameter and spacing so as to maintain a constant
orifice area are shown in Figure 19. Temperature profile data at X/H = l
for momentum ratios of 6 and 60 are shown for plates 1/02/08, 1/03/06n and
1/04/04 which all have jet area to cross-stream area ratios of 0.049. The
lack of similarity in the profiles is evident, indicating that for a given
operating condition considerable variations in the downstream temperature
distributions can be effected by changes in orifice diameter and spacing.
(1) Effect of Varying Orifice Diameter
at Constant S/D
For a constant S/D and constant momentum
flux ratio, secondary jet penetration into the mainstream at any given down-
stream distance, X/H, increases with increasing orifice diameter. This trend
is evident from an examination of Figure 20 which shows the dimensionless
temperature profiles at a station one duct height downstream of the injection
plane for tests with nominal momentum flux ratios of 14 and 25 and a nominal
temperature ratio of 2. The data are presented for orifice plate configura-
tions with S/D = 2, and with duct height to orifice diameter ratios of 16, 12,
8, 6 and 4, moving left to right across the figure at each momentum flux level.
The date of Figure 20 ape presented at a constant distance downstream of the
-24-
Ill Technical Discussion (cont.)
injection plane of X/H = I. If the data had been presented at equivalent
downstream distance to orifice diameter ratios, X/D, the better penetration
of the large orifices would be even more significant.
The effect of orifice diameter on jet/
mainstream energy exchange, ET, at several momentum flux ratios and downstream
distances can best be illustrated by the ET data of Figures 2l, 22, 16, 23
and 24. The data on these figures are for duct height to diameter ratios of
16, 12, 8, 6 and 4, respectively, all with an S/D of 2. These data show
the increase in efficiency as orifice diameter increases. Also the data from
these figures indicate that the exponential nature of the ET versus X/D
relationship is valid except with large orifices at high momentum flux ratios.
For large orifices and high momentum flux ratios, overpenetration of the jets
occurs and causes this deviation from a constant exponential dependency of
ET on X/D.
(2) Effect of Varying Orifice Diameterat Constant S/H
If the ratio of orifice spacing to duct
height, S/H, and the momentum and density ratios are held constant, the result
of increasing orifice diameter is to increase the orifice area and hence in-
crease the jet to mainstream flow ratio. Temperature profiles at X/H = l
for orifice plates 1/04/08 and 1/03/06n (S/H = .5) for momentum ratios from
6 to 60 are shown in Figure 25. The similarity of the temperature distribu-
tion for the two plates is evident. The result of increasing orifice diameter
at constant S/H is to shift the temperature distribution to higher theta
values consistent with the larger cooling air flow without altering the shape
of the distributions. The similarity of the energy exchange coefficients for
the two configurations can be seen from the data presented in Figures II and
26.
This is perhaps the most significant result
of present investigation since it suggests that for a given momentum ratio
there exists an optimum value of S/H. Thus the orifice size can then be selected
to provide the desired jet to mainstream mass flow split.
-25-
III Technical Discussion (cont.)
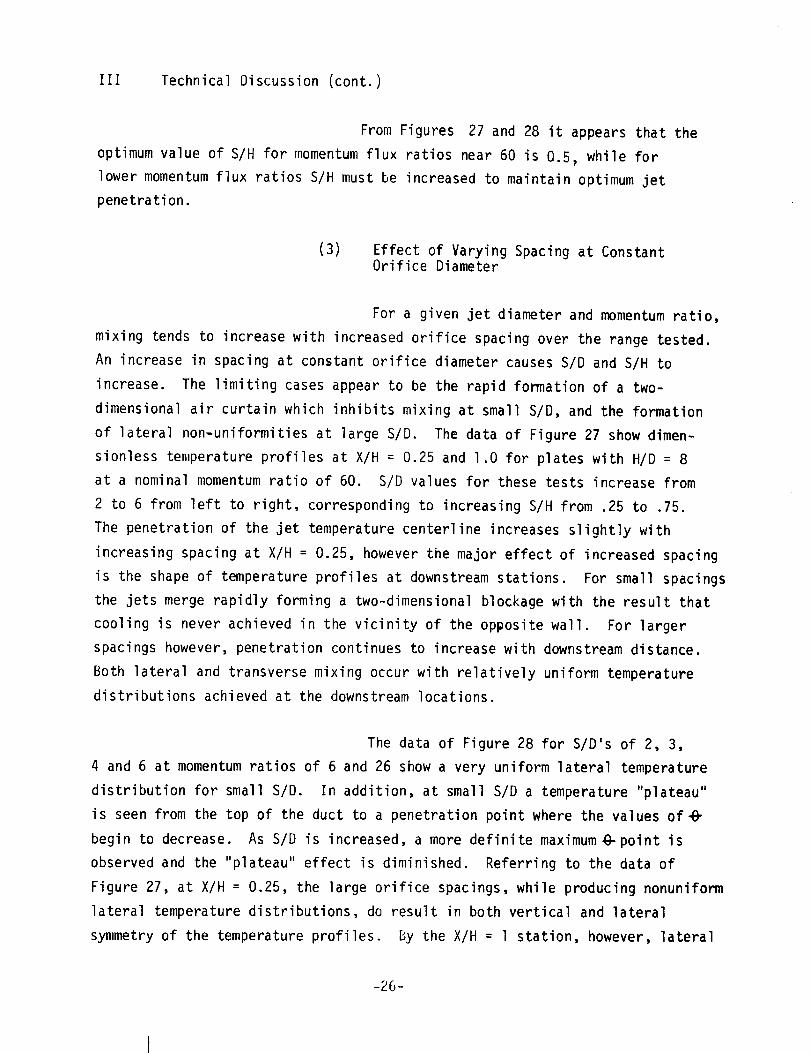
From Figures 27 and 28 it appears that the
optimum value of S/H for momentum flux ratios near 60 is 0.5, while for
lower momentum flux ratios S/H must be increased to maintain optimum jet
penetration.
(3) Effect of Varying Spacing at ConstantOrifice Diameter
For a given jet diameter and momentum ratio,
mixing tends to increase with increased orifice spacing over the range tested.
An increase in spacing at constant orifice diameter causes S/D and S/H to
increase. The limiting cases appear to be the rapid formation of a two-
dimensional air curtain which inhibits mixing at small S/D, and the formation
of lateral non-uniformities at large S/D. The data of Figure 27 show dimen-
sionless temperature profiles at X/H = 0.25 and 1.0 for plates with H/D = 8
at a nominal momentum ratio of 60. S/D values for these tests increase from
2 to 6 from left to right, corresponding to increasing S/H from .25 to .75.
The penetration of the jet temperature centerline increases slightly with
increasing spacing at X/H = 0.25, however the major effect of increased spacing
is the shape of temperature profiles at downstream stations. For small spacings
the jets merge rapidly forming a two-dimensional blockage with the result that
cooling is never achieved in the vicinity of the opposite wall. For larger
spacings however, penetration continues to increase with downstream distance.
Both lateral and transverse mixing occur with relatively uniform temperature
distributions achieved at the downstream locations.
The data of Figure 28 for S/D's of 2, 3,
4 and 6 at momentum ratios of 6 and 26 show a very uniform lateral temperature
distribution for small S/D. In addition, at small S/D a temperature "plateau"
is seen from the top of the duct to a penetration point where the values of_
begin to decrease. As S/D is increased, a more definite maximumS-point is
observed and the "plateau" effect is diminished. Referring to the data of
Figure 27, at X/H = 0.25, the large orifice spacings, while producing nonuniform
lateral temperature distributions, do result in both vertical and lateral
symmetry of the temperature profiles. By the X/H = 1 station, however, lateral
-26-
III Technical Discussion (cont.)
spreading of the jets has taken place and results in a uniform lateral
temperature profile. Also, at large S/D, the symmetrical Gaussian type
vertical distribution of temperature has decayed in a symmetrical manner
to yield a fairly uniform vertical temperature distribution.
The decay of the unsymmetrical vertical
distribution of the closely spaced jets results in a nonuniform vertical
temperature profile at the downstream location. In addition to the temp-
-rature profile data presented in Figures 27 and 28, the energy exchange
efficiency data of Figures 16, 29, II and 30 from orifice plates 1/02/08,
1/03/08, 1/04/08 and 1/06/08, respectively, show a trend of increasing mixing
efficiency with increasing S/D. These data also indicate that the optimum
value of S/D is dependent on the momentum flux ratio. Mixing efficiency data
for plates 1/02/12 and 1/04/12 (S/D's = 2 and 4, respectively; H/D = 12)
presented in Figures 22 and 17 also show an increase in mixing with increased
SID.
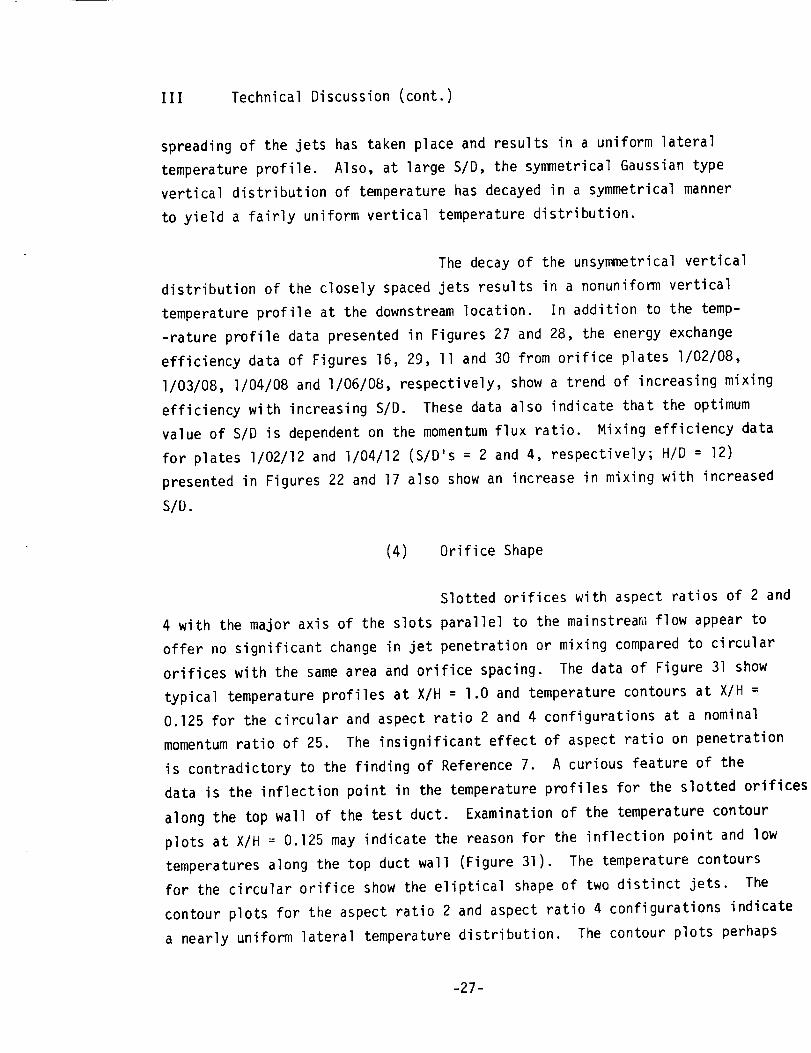
(4) Orifice Shape
Slotted orifices with aspect ratios of 2 and
4 with the major axis of the slots parallel to the mainstream flow appear to
offer no significant change in jet penetration or mixing compared to circular
orifices with the same area and orifice spacing. The data of Figure 31 show
typical temperature profiles at X/H = l.O and temperature contours at X/H =
0.125 for the circular and aspect ratio 2 and 4 configurations at a nominal
momentum ratio of 25. The insignificant effect of aspect ratio on penetration
is contradictory to the finding of Reference 7. A curious feature of the
data is the inflection point in the temperature profiles for the slotted orifices
along the top wall of the test duct. Examination of the temperature contour
plots at X/H = 0.125 may indicate the reason for the inflection point and low
temperatures along the top duct wall (Figure 31). The temperature contours
for the circular orifice show the eliptical shape of two distinct jets. The
contour plots for the aspect ratio 2 and aspect ratio 4 configurations indicate
a nearly uniform lateral temperature distribution. The contour plots perhaps
-27-
III Technical Discussion (cont.)
indicate that the jet major cross-section axis has turned 90° (major axis
perpendicular to the mainstream flow) and the jet has been deflected nearly
parallel to the mainstream.
(5) Injection Orifice Cross Flow (Use of Baffles)
The effect of a cross flow component on the
upstream side of the secondary injection orifice was evaluated using baffles
in the secondary plenum for several tests on orifice plate 1/02/16. The
ratio of orifice cross flow to orifice axial velocity at the maximum cross
flow condition was 0.13. At this condition, no significant change was noted
in either the orifice discharge coefficient or the_profiles, compared to
the no cross flow case.
(6) Double Orifice Rows
During the final orifice plate test
series, one double row orifice plate, plate 1/04/08d, was tested. Tempera-
ture profile data for this plate is shown at X/H = l and nominal momentum
flux ratios of 6 and 60 (Figure 32). Also shown in Figure 32 are profile
data for the following comparable configurations:
(a) Plate 1/04/08 - A single row plate
of the same diameter and lateral spacing as 1/04/08d but with one-half the
total flow area.
(b) Plate 1/04/04 - A single row plate
of the same total flow area and S/D as plate 1/04/08d but with fewer orifices
of larger diameter.
(c) Plate 1/03/06n - A single row plate
of the same total orifice area and S/H as plate 1/04/08d but with fewer
orifices of larger diameter.
-28-
III Technical Discussion (cont.)
For orifice plate 1/04/08d two
rows of 1.27 cm (0.5 in.) orifices were spaced two orifice diameters apart
in the streamwise direction and the X = 0 point was taken as the plane
through the center of the orifices in the upstream row. Comparison of the
data for plate 1/04/08d with the data presented for plate 1/04/08 shows
a significant increase in jet penetration with the double row configuration
at both the low and the high momentum flux ratios. At the high momentum flux
ratios the jets from plate 1/04/08d have overpenetrated and the temperature
distribution is not as uniform as for plate 1/04/08. For X/D less than 8,
the mixing efficiencies for 1/04/08d (Figure 33) are less than for 1/04/08
(Figure II). However the increase in ET with distance is greater for the
double row than for the single row, thus for X/D greater than 8 the mixing
efficiency for plate 1/04/08d is greater than for 1/04/08.
A comparison of the data from plate
1/04/08d with data from plate 1/04/04 shows the temperature profile of the
former to be more uniform than the profile from plate 1/04/04. The large
orifices of plate 1/04/04 provide much better penetration than does the
double row of smaller orifices but at the expense of increased lateral non-
uniformity and more severe overpenetration at high momentum ratios.
When the data from plate 1/04/08d are
compared with data from plate 1/03/06n, the latter configuration appears
to yield a more uniform lateral temperature profile and slightly better
penetration at the low momentum flux ratios. At the high momentum flux ratio,
the two plates yield very similar temperature profiles.
(7) Single Row of Mixed Orifice Size
In addition to the double orifice row
plate tested during the final orifice plate test series, a single orifice row
plate with mixed orifice sizes was also tested. Temperature profile data
from tests of this plate, plate 1/03/06m, are shown in Figure 34 at nominal
momentum flux ratios ofl4and 60 at an X/H of 1.0. The orifice configuration
used on plate 1/03/06m was a single row of orifices with alternating diameters
-29-

III Technical Discussion (cont.)
of 2.39 cm (0.94 in.) and 0.838 cm (0.33 in.) with adjacent holes spaced
5.08 cm (2 in.) apart. The profile data were taken from the center of a
small orifice to the center of a small orifice across two large orifices.
In addition to the data from plate 1/03/06m, temperature profile data are
presented in Figure 34 for two comparable configurations: (1) plate 1/03/06n,
which has the same total flow area and S/H (S/H = .5) as plate 1/03/06m but
with a single row of 1.78 cm (0.7 in.) diameter orifices, and (2) plate
1/04/04, which has the same total flow area as plate 1/03/06m but which
has an S/H of l.O and orifice diameters of 2.54 cm (l.O in.). Plates 1/03/06n
and 1/04/04 provide the limiting cases for the mixed size geometry. That is,
if the hole sizes in 1/03/06m were to approach equality, plate 1/03/06n would
be the result. At the other limit, plate 1/04/04 would be formed if the
small holes in 1/03/06m were made infinitely small with the orifice area
held constant.
The data presented in Figure 34 indicate
that alternating orifice sizes in a single row increases jet penetration
compared to a row of constant diameter orifices of the same total area and
hole spacing. This increased penetration is from the jets issuing from the
large orificesl as expected the jets from the small orifices do not penetrate
far into the mainstream. The mixed orifice size configuration 1/03/06m,
causes a more nonuniform lateral temperature profile than does configuration
1/03/06n. The energy exchange efficiency data presented in Figures 26 and 35
for the constant orifice size plate and the mixed orifice size plate, res-
pectively, show energy exchange efficiency for the mixed orifice size con-
figuration to be less dependent on momentum flux ratio than is a constant
orifice size configuration. (For the mixed orifice size plate the larger
of the two orifice diameters was selected as the base for the X/D parameter)
The temperature profiles for the mixed
orifice size plate may also be compared to those from the other limiting case,
1/04/04. This comparison shows that the two configurations have similar
lateral temperature profiles but that the constant orifice diameter plate
penetrates further at the low momentum. This greater penetration is most
-30-
III Technical Discussion (cont.)
likely due to the larger orifice diameters of plate 1/04/04. At high momentum
flux ratio, the two configurations yield similar temperature profiles. The
mixing efficiency data from plate 1/04/04 (Figure 36) when compared to the
data from plate 1/03/06m (Figure 35) show the two plates to yield similar
mixing efficiencies at equal momentum flux ratios at X/D's greater than 4.
The mixed orifice size configuration shows less dependence of ET or X/D.
. Comparison of Multiple Jet Stud_ Data Trends withSingle Jet Data
a • Temperature Centerline
A comparison of the equation for the
temperature centerline location for a single jet, based on the analysis of
Reference 8, with multiple jet data is shown in Figure 37. The analysis of
Reference 8 was for hot jets entering a cold mainstream while the current
data is for cold jets entering a hot mainstream. The multiple jet data pre-
sented on the figure are from orifice plates 1/02/16 and 1/06/08. These
two configurations represent the most closely spaced orifice pattern tested
and the most widely spaced pattern tested (based on S/D), respectively. The
multiple jet data for both configurations show less increase in penetration
distance with increasing downstream distance than would be predicted based on
the single jet analysis. Furthermore, the multiple jet data indicate that,
beyond an X/D of approximately lO, there is no increase in jet temperature
centerline penetration. This data comparison indicates that the exponents
on both the X/D and J terms of the correlating equation for single jets used
in Reference 8 are different for multiple jet injection. Therefore, the
single jet correlation should not be used to predict temperature centerline
trajectories of multiple jet configurations.
b. Velocity Centerline
A comparison of the velocity centerline
equation from the analysis of Reference 8 with the multiple jet data from
plates I/0_16 and 1/06/08 is presented in Figure 38. These data show closer
agreement between the single and multiple jet data than did the temperature
-31 -
Ill Technical Discussion (cont.)
centerline data presented previously. An adjustment of the exponents used
for X/D and J for the single jet data correlation and incorporation of a
geometric parameter such as S/D or S/H should yield a reasonable multiple
jet correlation equation for velocity centerline. The penetration of the
velocity centerline apparently does not reach a maximum within ten X/D's
downstream from the injection point as did the temperature centerline.
-32-

IV CONCLUSIONS
AQ MIXING PARAMETERS
I. An energy exchange parameter defined during this
program adequately characterizes the mixing effectiveness over a range of
test operating and design conditions.
2. An empirical correlation equation as a function
of dimensionless geometric and operating parameters could be developed
from the data obtained during the Multiple Jet Study program.
B. OPERATING PARAMETERS
1. The jet to mainstream momentum flux ratio is the single
most important operating variable influencing jet penetration and mixing.
2. The absolute momentum flux level does not influence jet
penetration or mixing significantly.
3. The jet to mainstream density ratio does not appear
to influence jet penetration or mixing significantly, except through its
contribution to the momentum flux ratio.
4. The effect of turbulence level on jet penetration
and mixing was insignificant within the range of turbulence examined.
B° DESIGN PARAMETERS
I. At a given momentum flux ratio and at a fixed
distance from the injection plane, jet penetration and mixing increases with
increasing orifice diameter.
2. The spacing between orifices has a significant
effect on lateral spreading of the jets, jet penetration, and jet mixing.
Closely spaced orifices (spacing to diameter ratio, S/D, of 2) inhibit jet
penetration and cause nonuniform downstream temperature profiles.
-33-

IV Conclusions (cont.)
3. If the ratio of center-to-center orifice spacing to
duct height and the momentum flux ratio are held constant,and orifice dia-
meter varied,the resultant temperature profiles are similar in shape but off-
set from one another by the differences in ideal-@-. This suggests that for a
given momentum flux ratio there exists an S/H such that nearly uniform temp-
erature distributions are achieved. The hole size may then be chosen based on
the desired jet mass flow rate.
4. Slotted orifices (aspect ratios of 2 and 4, major
axis in the direction of primary flow) appear to produce no significant
change in jet penetration or mixing compared to circular orifices of equal
area.
5. When baffles were used to channel the secondary
injection flow and create a cross flow component, no significant effect on
jet penetration or mixing was observed.
6. Double orifice rows spaced two orifice diameters
apart and having twice the total jet flow area of a single row result in better
penetration than a single orifice row of the same diameter. Double orifice
rows provide more uniform mixing than a single row of the same total flow
area and same S/D; however, jet penetration into the mainstream is greater
with the single row of large orifices. When the double orifice row is
compared to a single row of equal flow area and S/H, the single row data
appear to yield a more uniform lateral temperature profile and slightly better °
penetration.
7. Alternating orifice sizes in a single row increases
jet penetration when compared with a row of constant diameter orifices of
the same flow area and spacing. However, mixed orifice sizes may cause non-
uniform lateral temperature distributions. If the mixed orifice size data are
compared to date from a row of constant diameter orifices of the same flow
area but twice the orifice spacing, the jet penetration with the constant dia-
meter orifice plate is better than the jet penetration from the large orifices
of the mixed diameter configuration.
-34-
REFERENCES
I •
1
•
o
o
•
o
Q
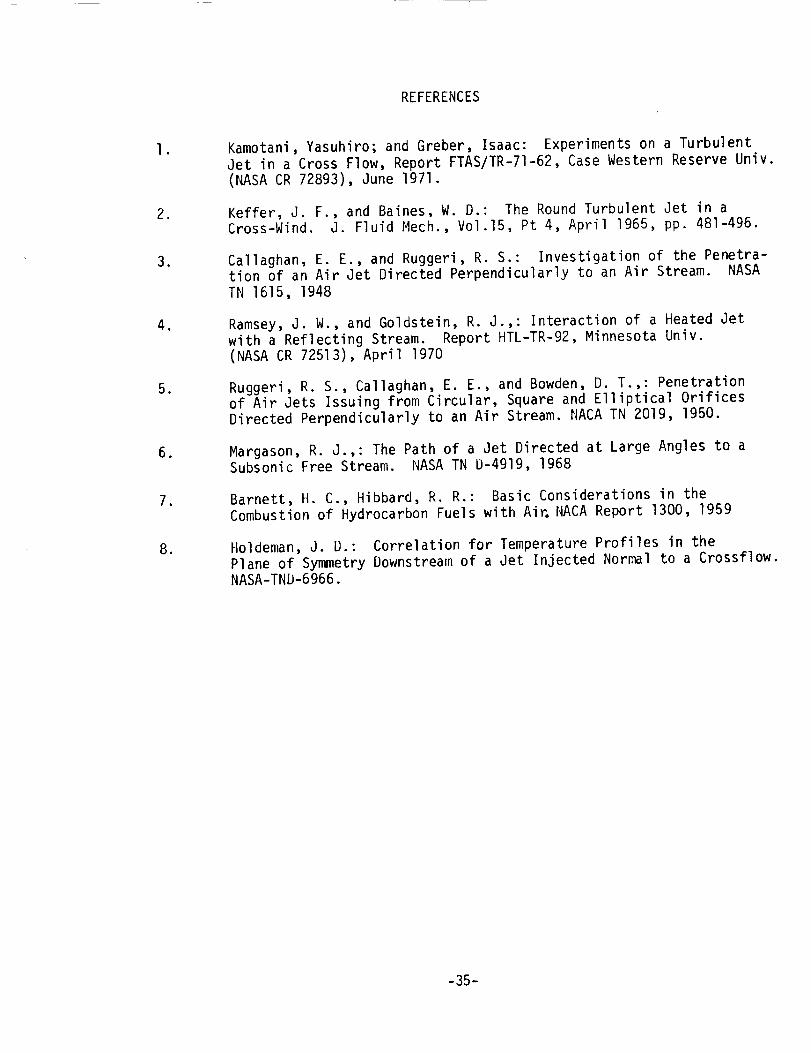
Kamotani, Yasuhiro; and Greber, Isaac: Experiments on a TurbulentJet in a Cross Flow, Report FTAS/TR-71-62, Case Western Reserve Univ.(NASA CR 72893), June 1971.
Keffer, J. F., and Baines, W. D.: The Round Turbulent Jet in aCross-Wind. J. Fluid Mech., VoI.15, Pt 4, April 1965, pp. 481-496.
Callaghan, E. E., and Ruggeri, R. S.: Investigation of the Penetra-tion of an Air Jet Directed Perpendicularly to an Air Stream. NASATN 1615, 1948
Ramsey, J. W., and Goldstein, R. J.,: Interaction of a Heated Jetwith a Reflecting Stream. Report HTL-TR-92, Minnesota Univ.(NASA CR 72513), April 1970
Ruggeri, R. S., Callaghan, E. E., and Bowden, D. T.,: Penetrationof Air Jets Issuing from Circular, Square and Elliptical OrificesDirected Perpendicularly to an Air Stream• NACA TN 2019, 1950.
Margason, R. J.,: The Path of a Jet Directed at Large Angles to aSubsonic Free Stream. NASA TN D-4919, 1968
Barnett, H. C., Hibbard, R. R.: Basic Considerations in theCombustion of Hydrocarbon Fuels with Ai_ NACA Report 1300, 1959
Holdeman, J. D.: Correlation for Temperature Profiles in thePlane of Symmetry Downstream of a Jet Injected Normal to a Crossflow.NASA-TND-6966.
-35-

A
a
Cp
CD
D
d
E.in
Eout
ET
g
H
ho
i
d
m
N
n
P
S
T
V
W
x
Y
APPENDIX A
SYMBOLS
flow area
a constant
pressure coefficient, P - PJ
P®- Pj
orifice discharge coefficient
orifice diameter
double orifice row
energy into system
energy leaving system
mixing efficiency, (See Equation 15)
gravitational constant
duct height
stagnation enthalpy
index
momentum flux ratio ( pV2)j/( pV 2)
mixed orifice size
number of orifices
nominal
Stagnation pressure
orifice spacing
temperature
velocity
weight flow rate
x direction, parallel to duct axis
y direction, parallel to orifice centerline
-36-
Symbols (cont.)
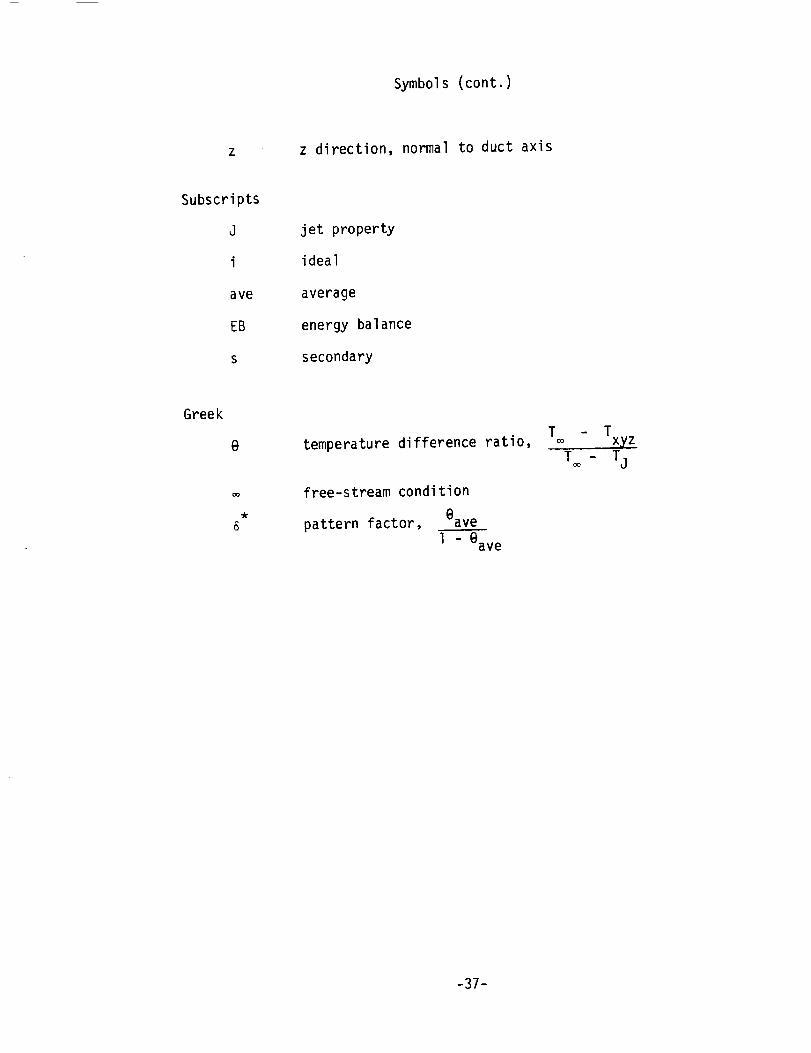
z direction, normal to duct axis
Subscripts
J
i
ave
EB
S
jet property
ideal
average
energy balance
secondary
Greek
e
6
temperature difference ratio,
free-stream condition
pattern factor, eave
l - @ave
T a
Oo
Too
Txyz
- Tj
-37-
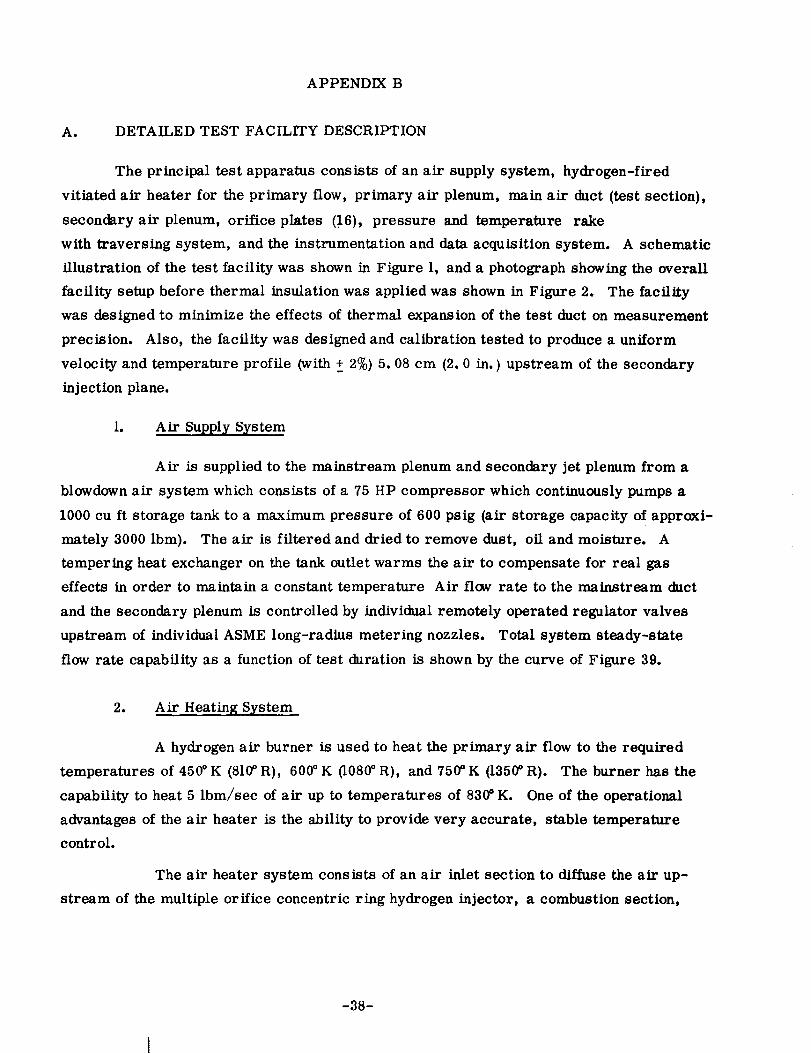
APPENDIX B
A. DETAILED TEST FACILITY DESCRIPTION
The principal test apparatus consists of an air supply system, hydrogen-fired
vitiated air heater for the primary flow, primary air plenum, main air duct (test section},
secondary air plenum, orifice plates (16), pressure and temperature rake
with traversing system, and the instrumentation and data acquisition system. A schematic
illustration of the test facility was shown in Figure 1, and a photograph showing the overall
facility setup before thermal insulation was applied was shown in Figure 2. The facility
was designed to minimize the effects of thermal expansion of the test duct on measurement
precision. Also, the facility was designed and calibration tested to produce a uniform
velocity and temperature profile (with + 2%) 5.08 cm (2.0 in.) upstream of the secondary
injection plane.
1. Air Supply System
Air is supplied to the mainstream plenum and secondary jet plenum from a
blowdown air system which consists of a 75 HP compressor which continuously pumps a
1000 cu ft storage tank to a maximum pressure of 600 psig (air storage capacity of approxi-
mately 3000 Ibm). The air is filtered and dried to remove dust, oil and moisture. A
tempering heat exchanger on the tank outlet warms the air to compensate for real gas
effects in order to maintain a constant temperature Air flow rate to the mainstream duct
and the secondary plenum is controlled by individual remotely operated regulator valves
upstream of individual ASME long-radius metering nozzles. Total system steady-state
flow rate capability as a function of test duration is shown by the curve of Figure 39.
2. Air Heating System
A hydrogen air burner is used to heat the primary air flow to the required
temperatures of 450 ° K (810. R), 600 ° K (1080 ° R), and 750" K (1350" R). The burner has the
capability to heat 5 lbm/sec of air up to temperatures of 830" K. One of the operational
advantages of the air heater is the ability to provide very accurate, stable temperature
control.
The air heater system consists of an air inlet section to diffuse the air up-
stream of the multiple orifice concentric ring hydrogen injector, a combustion section,
-38-

and a mixing section. The combustor contained stainless steel baffles to promote large-
scale mixing and is terminated by an abrupt contraction to further enhancemixing. The
mixing section contains a jet breaker and screens to eliminate temperature stratification
and to aid in the generation of a more uniform velocity profile in a short length. The
system is ignited by an automotive spark plug and provision is made for automatic fuel
shutoff if ignition is not achieved within 2 seconds of fuel flow initiation. Instrumentation
is provided to monitor combustion temperature and pressure continuously in the heater.
Temperature was controlled by adjusting hydrogen flow rate.
3. Main Air Plenum
The main air plenum consists of a 60.7 cm (24 in. ) diameter, 92 cm (36 in. )
long circular cylinder of. 157 (. 062 in. ) wall thickness with. 315 cm (. 125 in. ) flat end
plates, all of 304 stainless steel. The upstream end plate is bolted to the cylinder to
allow access. Screens are employed in the cylinder to ensure a uniform flow profile.
The cylinder has thermocouples on the exterior surface in order to monitor transient
thermal response.
In order to reduce the heat losses to the plenum walls, . 005 cm (0. 002 in. )
thick stainless steel foil is spot welded to the inside plenum wall. An air gap between
the foil and the wall was provided by first tack welding. 075 cm (0. 030 in. ) stainless
steel wire to the wall in a spiral configuration and then welding the foil to the wire.
4. Main Air Duct _Test_ Section)
The test section is a 10. 17 cm (4.0 in. ) high by 30.48 cm (12 in. ) wide duct
88. 9 cm (35.0 in. } long and incorporates a contoured entrance section beginning at a
contraction ratio of 5.3 (with respect to duct area). A boundary layer trip is placed on
the top duct wall at the location corresponding to a minimum Reynolds number, based on
length, of 105. A trip is also located on the duct bottom wall 2.54 cm downstream of the
top wall trip; both trips are approximately 0.25 cm high (corresponding to the boundary
layer displacement thickness). The section is fabricated from. 157 cm (. 062 in. ) 304
stainless steel sheet. Wall static pressure taps are installed in the test section at
required stations on all four walls. Thermocouples are placed on the outside of the duct
walls to measure duct wall temperature.
-39-
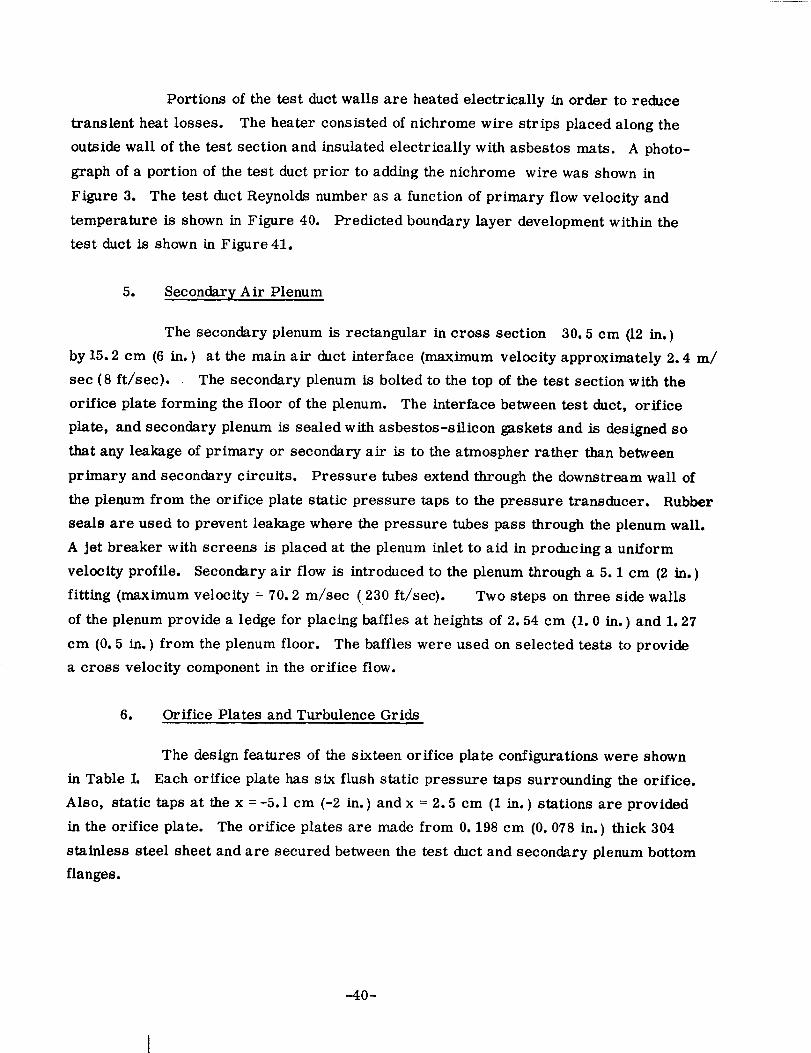
Portions of the test duct walls are heated electrically in order to reduce
transient heat losses. The heater consisted of nichrome wire strips placed along the
outside wall of the test section and insulated electrically with asbestos mats. A photo-
graph of a portion of the test duct prior to adding the nichrome wire was shown in
Figure 3. The test duct Reynolds number as a function of primary flow velocity and
temperature is shown in Figure 40. Predicted boundary layer development within the
test duct is shown in Figure 41.
5. Secondary Air Plenum
The secondary plenum is rectangular in cross section 30.5 cm (12 in.)
by 15.2 cm (6 in. ) at the main air duct interface (maximum velocity approximately 2.4 m/
sec (8 ft/sec). The secondary plenum is bolted to the top of the test section with the
orifice plate forming the floor of the plenum. The interface between test duct, orifice
plate, and secondary plenum is sealed with asbestos-silicon gaskets and is designed so
that any leakage of primary or secondary air is to the atmospher rather than between
primary and secondary circuits. Pressure tubes extend through the downstream wall of
the plenum from the orifice plate static pressure raps to the pressure transducer. Rubber
seals are used to prevent leakage where the pressure tubes pass through the plenum wall.
A jet breaker with screens is placed at the plenum inlet to aid in producing a uniform
velocity profile. Secondary air flow is introduced to the plenum through a 5.1 cm (2 in. )
fitting (maximum velocity = 70.2 m/sec (,230 ft/sec). Two steps on three side walls
of the plenum provide a ledge for placing baffles at heights of 2.54 cm (1.0 in. ) and 1.27
cm (0. 5 in. ) from the plenum floor. The baffles were used on selected tests to provide
a cross velocity component in the orifice flow.
6. Orifice Plates and Turbulence Grids
The design features of the sixteen orifice plate configurations were shown
in Table L Each orifice plate has six flush static pressure taps surrounding the orifice.
Also, static taps at the x =-5.1 cm (-2 in.) and x = 2.5 cm (1 in. ) stations are provided
in the orifice plate. The orifice plates are made from 0. 198 cm (0. 078 in. ) thick 304
stainless steel sheet and are secured between the test duct and secondary plenum bottom
flanges.
-40-

During selected tests, turbulence inducing grids were inserted into the
test duct 10.2 cm (4 in. ) upstream of the jet injection plane. Two grid designswere used;
both were of stainless steel and onehad 2.54 cm (1.0 in. ) spacingwith 0.79 cm (5/16 in.)
diameter cross rods and the other had 1.27 cm (0.5 in. ) spacingwith 0.411 cm (0. 162 in.)
diameter cross rods. The grids were secured within the test duct by spot welding the
cross rods to the test duct wall.
A photograph of 13 predrilled orifice plates (11 of these were subsequently
tested) and the two turbulence inducing grids was shown in Figure 5. One of the orifice
plates is shown with pressure tap instrumentation installed.
7. Rake and Traverse System
a. Rake and Probes
Twenty temperature and pressure probes are used to measure free-
stream stagnation conditions in the test duct. The probes are welded to a support bar and
are aligned in a vertical plane. The center-to-center distance between probes is 0. 475 em
(0. 187 in. ) and the probes extend to within 0. 500 cm (0. 197 in. ) of the top and bottom duct
surfaces. A photograph of the probe design was shown in Figure 4.
Since the direction of the velocity vector is not known, a total pressure
tube with a fiat inlet is used to measure duct stagnation pressure. This probe configuration
has essentially 100% total pressure recovery up to flow angles of approximately + 11".
The velocity inferred from the pressure probe measurements was assumed to be the
velocity component parallel to the duct axis. Each probe element consists of a 0. 149 cm
(0. 059 in. ) diameter full-hard stainless steel total pressure probe with a 0. 107 cm
(0. 042 in. ) inside diameter. The rake also incorporates a 0. 102 cm (0.040 in. ) diameter
chromel-alumel, Inconel-sheathed thermocouple spaced about 0.22 cm (0.09 in. ) from
the total pressure element in the plane of the probes. The junction of the thermocouple
is not sheathed in order to minimize errors due to heat conduction to the junction along the
sheath. The whole assembly is resistance welded to the rake support assembly. Since
no high temperature brazing is required, the steel probe tubes retain their hardness and,
therefore, stiffness and dimensional rigidity. All materials and construction techniques
used in the probe fabrication were suitable for extended operation at 755"K (900* F) in
air.
-41-
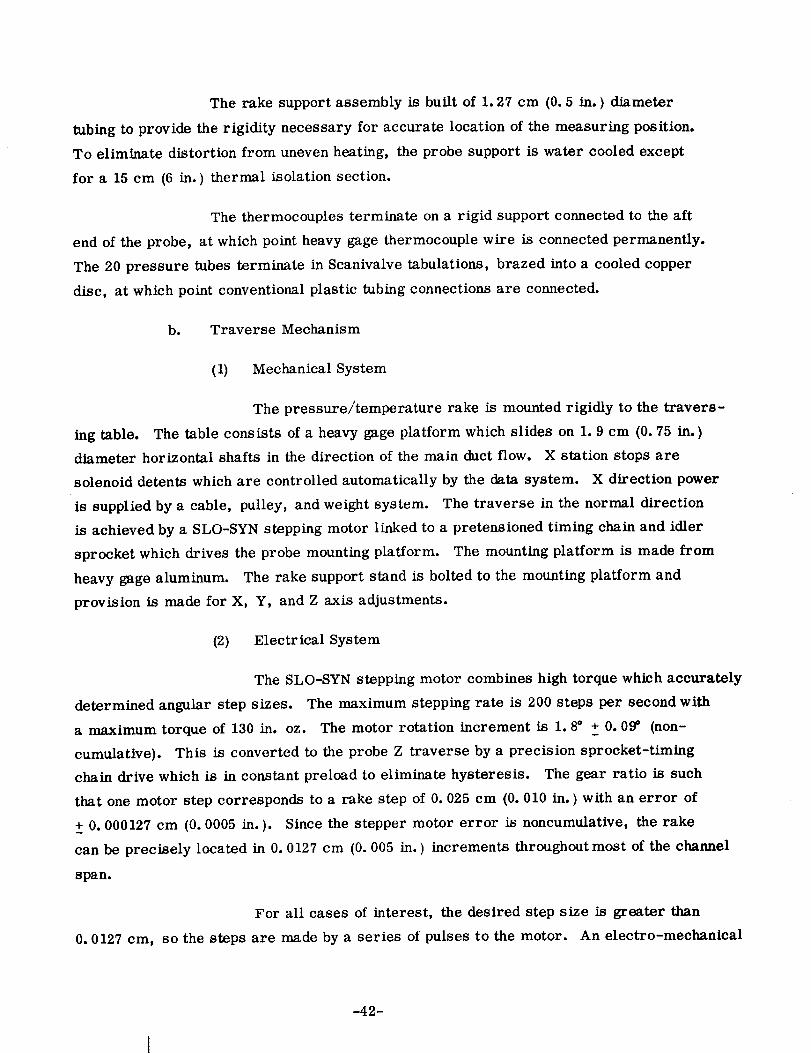
The rake support assembly is built of 1.27 cm (0.5 in. ) diameter
tubing to provide the rigidity necessary for accurate location of the measuring position.
To eliminate distortion from uneven heating, the probe support is water cooled except
for a 15 cm (6 in. ) thermal isolation section.
The thermocouples terminate on a rigid support connected to the aft
end of the probe, at which point heavy gage thermocouple wire is connected permanently.
The 20 pressure tubes terminate in Scanivalve tabulations, brazed into a cooled copper
disc, at which point conventional plastic tubing connections are connected.
b. Traverse Mechanism
(1) Mechanical System
The pressure/temperature rake is mounted rigidly to the travers-
ing table. The table consists of a heavy gage platform which slides on 1.9 cm (0.75 in. )
diameter horizontal shafts in the direction of the main duct flow. X station stops are
solenoid detents which are controlled automatically by the data system. X direction power
is supplied by a cable, pulley, and weight system. The traverse in the normal direction
is achieved by a SLO-SYN stepping motor linked to a pretensioned timing chain and idler
sprocket which drives the probe mounting platform. The mounting platform is made from
heavy gage aluminum. The rake support stand is bolted to the mounting platform and
provision is made for X, Y, and Z axis adjustments.
(2} Electrical System
The SLO-SYN stepping motor combines high torque which accurately
determined angular step sizes. The maximum stepping rate is 200 steps per second with
a maximum torque of 130 in. oz. The motor rotation increment is 1.8 ° + 0.09 _ (non-
cumulative). This is converted to the probe Z traverse by a precision sprocket-timing
chain drive which is in constant preload to eliminate hysteresis. The gear ratio is such
that one motor step corresponds to a rake step of 0. 025 cm (0. 010 in. ) with an error of
+ 0. 000127 cm (0. 0005 in.). Since the stepper motor error is noncumulative, the rake
can be precisely located in 0. 0127 cm (0. 005 in. ) increments throughout most of the channel
span.
For all cases of interest, the desired step size is greater than
0. 0127 cm, so the steps are made by a series of pulses to the motor. An electro-mechanical
-42-
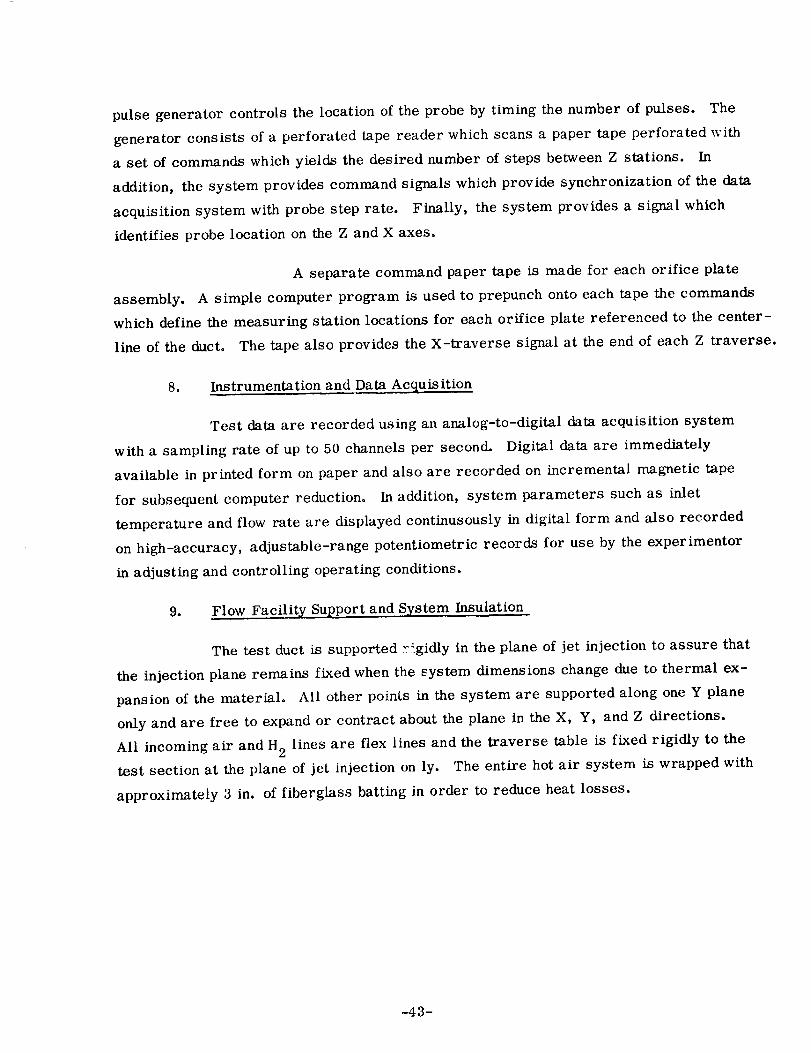
pulse generator controls the location of the probe by timing the number of pulses. The
generator consists of a perforated tape reader which scans a paper tape perforated with
a set of commands which yields the desired number of steps between Z stations. In
addition, the system provides command signals which provide synchronization of the data
acquisition system with probe step rate. Finally, the system provides a signal which
identifies probe location on the Z and X axes.
A separate command paper tape is made for each orifice plate
assembly. A simple computer program is used to prepunch onto each tape the commands
which define the measuring station locations for each orifice plate referenced to the center-
line of the duct. The tape also provides the X-traverse signal at the end of each Z traverse.
8. Instrumentation and Data Acquisition
Test data are recorded using an analog-to-digital data acquisition system
with a sampling rate of up to 50 channels per second. Digital data are immediately
available in printed form on paper and also are recorded on incremental magnetic tape
for subsequent computer reduction. In addition, system parameters such as inlet
temperature and flow rate are displayed continusously in digital form and also recorded
on high-accuracy, adjustable-range potentiometric records for use by the experimentor
in adjusting and controlling operating conditions.
9. Flow Facility . Support and System Insulation
The test duct is supported r:gidly in the plane of jet injection to assure that
the injection plane remains fixed when the system dimensions change due to thermal ex-
pansion of the material. All other points in the system are supported along one Y plane
only and are free to expand or contract about the plane in the X, Y, and Z directions.
All incoming air and H 2 lines are flex lines and the traverse table is fixed rigidly to the
test section at the plane of jet injection on ly. The entire hot air system is wrapped with
approximately 3 in. of fiberglass batting in order to reduce heat losses.
-43-
APPENDIX C
A. FLOW SYSTEMCHECKOUT, CALIBRATION AND TEST PROCEDURE
1. Checkout and Calibration Tests
Prior to conducting tests of the various orifice plate configurations, system
calibration tests and checkout tests were conducted. The primary objectives of these
calibration/checkout tests were:
(a) To verify that the hydrogen-air heater operation was free from
surges and that the temperature control was operating effectively.
(b) To verify that adequate motor torque and rake positioning repeat-
ability could be achieved.
(c)
(d)
To verify that the duct free-stream stagnation pressure and tempera-
ture were within + 2% of the average values at a distance from the
duct walls greater than 1.27cm (0.5 in. ) at a plane 5.1 cm (2 in. )
upstream of the jet injection point.
To verify that the system flow control, traversing mechanism and
instrumentation were functioning adequately.
a. Hydrogen-Air Heater Checkout
Tests were made with the air and H2 supply mated to the main plenum
but without the rectangular test section mated to the main plenum. The tests were con-
ducted at the three test temperatures and with the maximum, nominal, and minimum air
flow rates. Fast response pressure transducers and thermocouples were monitored
during the test to evaluate system performance. If a start surge overpressure occurred
or if ignition did not occur, test procedures were modified and the system was retested
as necessary.
b. Traverse Mechanism Checkout
Prior to installing the probe traversing mechanism in the test duct,
the system was tested for station alignment precision and total traverse time. The
alignment of the probe axis is estimated to be within 2° of the test duct axis. The lateral
station positioning, Z/S, was within 1% of the desired rake locations and the total time
to complete one traverse was approximately 90 seconds.
-44-
Ce Test Duct Stagnation Condition Evaluation andProbe Checkout
After the main air system had been tested to ensure smooth operation,
the test duct was connected to the main plenum and tests ma de to determine if stagnation
pressure and temperature are constant across the test within the allowable limits (+ 2%
at distances over 1.27 cm from duct walls). Tests were conducted at nominal mainstream
flow rates at temperatures of 450 ° K (350 ° F), 600 ° K (620 ° F), and 750 ° K (890 ° F) and at
maximum flow rates at 600 ° K (620 _ F), with the secondary plenum orifice plate blanked off.
Modifications were made to the original combustor configuration (the addition of screens
and baffles) until the desired pressure and temperature profiles were achieved.
In addition to an evaluation of the duct temperature and pressure profiles,
these tests: (1) served as an evaluation of probe operation in the hot gas environment, (2)
allowed a leak check to be made of the secondary plenum with blank orifice plate, and
(3) allowed further test data instrumenta:ion checkout.
2. Test Procedure
The following test procedures were used for the Multiple Jet Study tests:
a. Pretest
installed.
(1)
(2)
Main air and secon4ary air metering nozzles were selected and
Tank charged to 600 psig.
(3) Orifice plate selected and installedin secondary plenum and
pressure tape connections made.
(4) If secondary plenum baffle Insert was used, it was installed and
secondary plenum sealing surfaces tightened.
(5) Perforated paper control tape for the particular orifice plate was
loaded into the tape reader and locate buttons pushed.
(6) The rake was checked and manually aligned as necessary.
(7) READY button was pressed to allow the control system to position
rake to beginning of first traverse.
-45-

(8) The digital system was readied by inputting the appropriate
run number and configuration number.
b. Start Transient
The main air supply was turned on at moderate flow rate, the igniter
energized, and a low flow rate of hydrogen ( -,-10% steady-state flow) introduced. If
ignition did not occur within approximately two seconds as in dicated by a high response
thermocouple in the combustor, hydrogen flow was automatically terminated and the system
purged with main flow air for approximately 60 seconds. Hydrogen and air flow rates were
set to a more favorable ratio for ignition and the process repeated. When ignition occurred,
the air and hydrogen flow rates were brought simultaneously up to the planned values and
the hydrogen flow was trimmed to give the desired plenum test temperature. Based on
wall thermocouple readings, the system thermal steady state was reached and the test
data acquisition began.
c. Test Data Acquisition
After the facility reached steady-state operation, the rake traverse
was initiated. Except for monitoring and control of test conditions, the remainder of the
test sequence continued automatically under the control of the tape reader. The number of
stations sampled was identical for all orifices plates tested. The only variable was the Z
spacing which was varied dependent on the particular orifice spacings. In all cases, the
total Z span was equal to twice the orifice spacing. Twenty-one Z stations were sampled
at the first three axial locations and 11 Z stations were sampled at the fourth X station
and 21 Z locations were sampled at the fifth X station, for a total of 95 X, Z points. For all
plates with H/D < 16, the axial stations were at X/H = 0.25, . 5, 1.0, 1.5, and 2.0. For tests
with small orifices.(H/D = 16), an X = 1.27 cm (0.5 in.) station was substituted for the X = 20.3 cm
(8.0 in. ) station. The Z stations were symmetrically spaced about the midpoint between the two
centermost orifices.
At the beginning and the midpoint of each traverse, all channels
were scanned in order to provide run number, time, system parameters, and rake
parameter measurements. After the first complete data scan, the rake, under the con-
trol of the prepunched tapes, was traversed to the next Z station and the thermocouple
stepper and Scanivalve No. 2 were monitored to record the rake temperatures and
pressures. Approximately 4 seconds were required at each station for steady state to be
reached and data to be taken. The rake then stepped to the next Z station and the process
-46-

repeated. At the completion of dataacquisition from the last Z station, the rake, under
the control of the paper tape, was stepped back to the next X station and was ready for the
Z traverse in the reverse direction to the first traverse.
The process of data acquisition outlined for the first X location was
repeated until all X, Z points had been sampled, at which time the hydrogen flow to the
heater was terminated, the air flow reduced, and the rake manually returned to the starting
position in preparation for the next test.
-47-
APPENDIX D
A. DATA ANALYSIS PROGRAM
1. Objective
l'heobjective of _he data analysis program is to use the output from the data
reduction program to calculate testran conditions (weight flow rates, velocities, Mach
numbers, momemum fluxes, densities, and temperature), dimensionless temp erature
and pressure profiles, and correlating parameters (pattern factors, temperature deviation
ratios, and energy exchange_ ETj values). The output from the analysis program is a
paper listingof the run conditions, correlating paralneters, and temperature and pressure
values. In addition to the paper listing,the temperature and pressure profile data are
output on a magnetic drum for use as input to the computer plottingroutines. When the
plot program is executed, the output data are stored on magnetic tape which is then in-
put to the microfilm printer/plotter.
2. Methods of Calculation
a. Mainstream Conditions
The weight flow rate in the test duct upstream of the secondary injection
orifices is calculated from the main venturi pressure drop, flow coefficient, and temper-
ature data. The velocity in the test duct upstream of the secondary injection orifices is
calculated using the continuity equation with the gas density based on the ideal equation of
state and corrected to static conditions. The mainstream stagnation temperature is
measured directly with a thermocouple in the main air plenum. Mainstream Mach number
is calculated from the mainstream stagnation temperature and mainstream velocity. The
mainstream pressure ratios, used for static density calculations, are measured from
total pressure measurements in the main air plenum and static pressure measurements
in the test duct 5.1 cm upstream of the secondary injection plane. Momentum flux in
the mainstream is the product of the static density and the square of the mainstream
velocity.
b. Jet Conditions
The jet weight flow rate is calculated from the secondary air venturi
pressure drop, flow coefficient, and temperature. The jet velocity is the velocity at the
-48-
jet vena contracta and is calculated fro._ the jet pressure ratio (measured wall static
pressure adjacent to orifice and measured secondary suagnarion pressure), gas constant,
isentropic exponent, and measured secondary flow stagnation temperature. The jet static
density is calculated from the ideal equation of state and the jet pressure ratio. Momentum
flux of the jet is the product of the jet static density and the square of the vena contracta
velocity. Orifice discharge coefficients are calculated from the ratio of measured
secondary flow, divided by the number of secondary orifices, to the ideal isentropi¢ flow
through the orifice, based on the measured pressure ratio.
c. Jet to Mainstream Cor_ditions
The momentum flux ratio, density ratio, velocity ratio, and flow rate
ratio are the jet values of the parameter divided by the mainstream values. The
temperature ratio is the mainstream temperature divided by the jet temperature.
d. Flow Field Conditions
Dimensionless temperature difference ratios, _(free-stream temperature
minus temperature at a point divided by free-stream minus jet temperature), are calculated
for each rake temperature measurement. Also, dimensionless pressure difference ratios,
C (pressure measured at a point minus _rimary flow pressure divided by secondaryP
stagnation pressure minus primary stagnation pressure), are calculated for each rake
pressure measurement. The maximum values of-@ and C in the center plane of eachP
orifice are listed along with the verLical _oeation of the maximum value at each axial
measurement station.
The average values of_, Cp, and temperature are listed at each axial
station. Also, at each axial station, mixing correlation parameters are listed. These
parameters are (1) the pattern factor (the free-stream temperature minus the average
temperature at station X divided by the average temperature at X minus the jet temperature),
(2) the temperature deviation ratio (the average temperature minus the ideal mixed temper-
ature divided by the free-stream temperature minus the ideal mixed temperature), and
(3) E T (the percent of the maximum possible energy exchange between jet and free-stream).
A sample program listing is contained in Table VI.
-4 9-
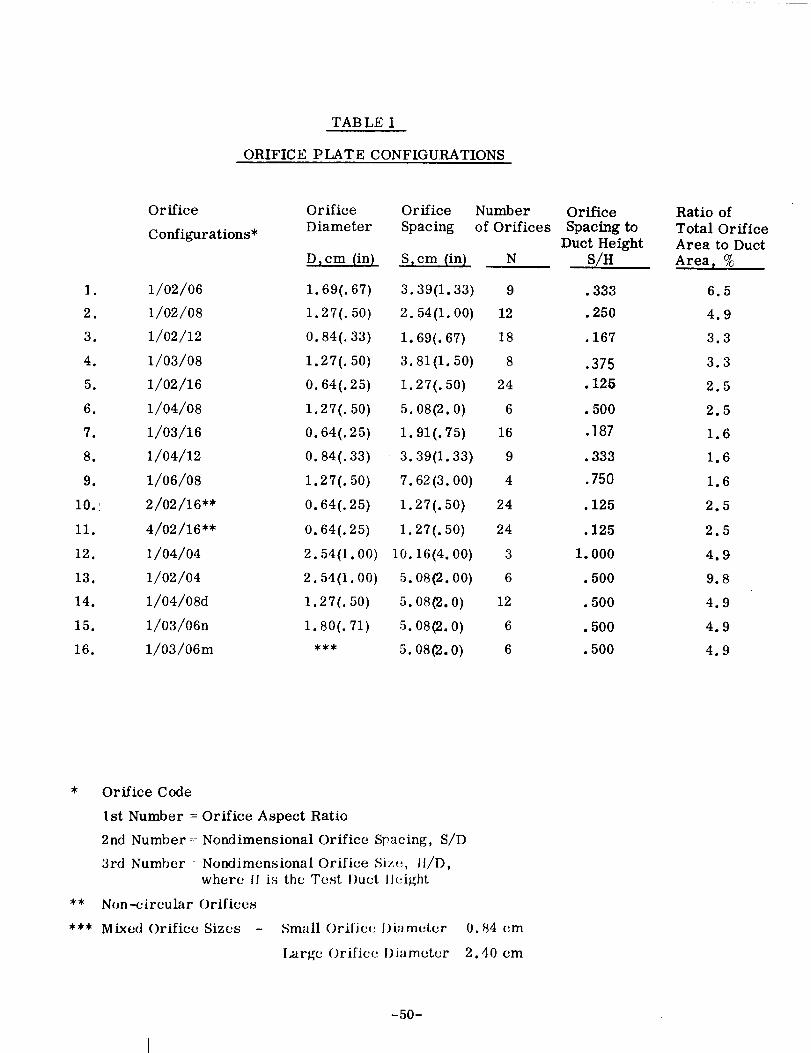
TABLE I
ORIFICE PLATE CONFIGURATIONS
Orifice Orifice Orifice Number
Diameter Spacing of OrificesConfigurations*
D,cm (in) S,cm (in) N
I. 1/02/06 1.69(.67) 3.39(1.33) 9
2. 1/02/08 1.27(.50) 2.54(1.00) 12
3. 1/02/12 0.84(.33) 1.69(•67) 18
4. 1/03/08 1.27(.50) 3.81(1.50) 8
5. 1/02/16 0.64(.25) 1.27(.50) 24
6. 1/04/08 I.27(.50) 5.08(2.0) 6
7. 1/03/16 0.64(.25) 1.91(•75) 16
8. 1/04/12 0.84(.33) 3.39(1.33) 9
9. 1/06/08 1.27(.50) 7.62(3.00) 4
i0.: 2/02/16"* 0.64(.25) 1.27(.50) 24
11. 4/02/16"* 0.64(.25) I.27(.50) 24
12. 1/04/04 2.54(1.00) 10.16(4.00) 3
13. 1/02/04 2.54(1.00) 5.08(2.00) 6
14. 1/04/08d 1.27(. 50) 5.08(2.0) 12
15. 1/03/06n i.80(.71) 5•08(2•0) 6
16. 1/03/06m *** 5.08(2.0) 6
Orifice
Spacing toDuct Height
S/H
.333
.250
.167
.375
•125
•500
.187
•333
.750
•125
•125
1.000
•500
•500
•500
•500
Ratio of
Total OrificeArea to Duct
Area, %
6.5
4.9
3.3
3.3
2.5
2.5
1.6
1.6
1.6
2.5
2.5
4.9
9.8
4.9
4.9
4.9
* Orifice Code
1st Number = Orifice Aspect Ratio
2nd Number : Nondimensional Orifice Spacing, S/D
3rd Number Nondimensional Orifice Size, Ii/D,
where II is the Test I)uct Ilci_ht
** Non-circular Orifices
*** Mixed Orifice Sizes - Small Oriticc Diameter
I_rge Oriliee Diameter
0.84 cm
2.40 cm
-50-
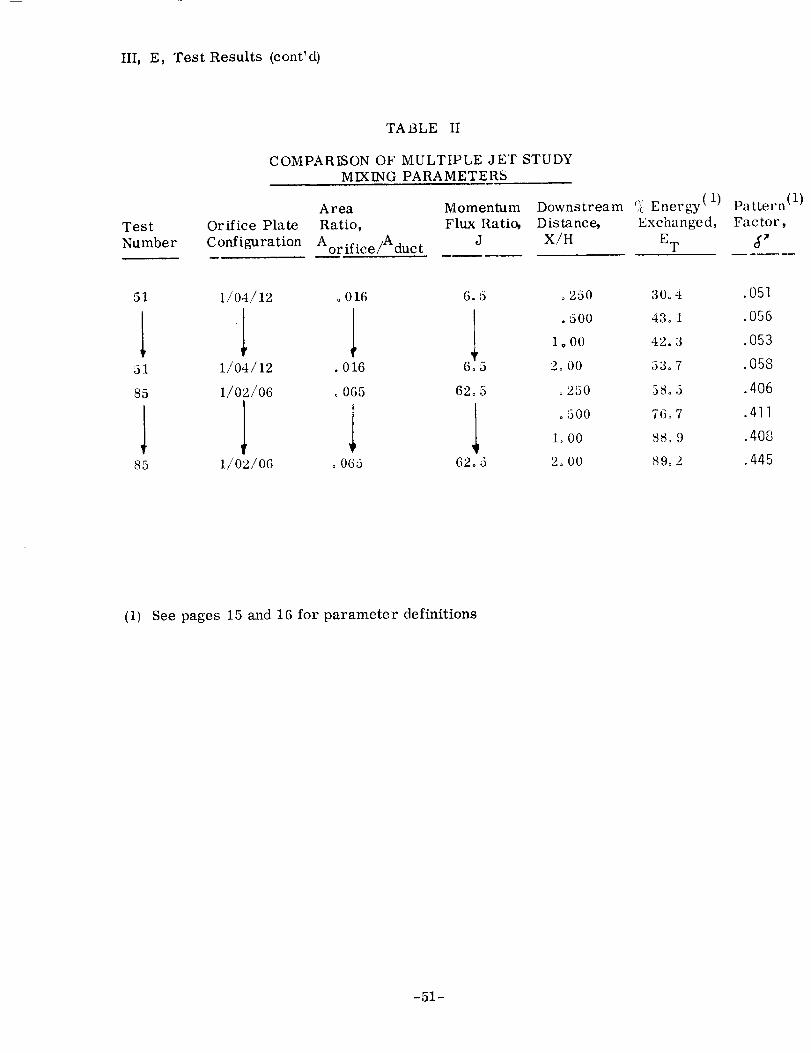
III, E, Test Results (cont'd)
TA t3LE II
COMPARISONOF MULTIPLE JET STUDYMIXING PARAMETERS
Test Orifice PlateNumber Configuration
Area MomentumRatio, Flux Ratio,Aor ffice/Aduct J
DownstreamDistance,X/H
'_/cEnergy (1)
Exchanged,
E T
Pattern (1)
Fac tor,
51
51
85
1/04/12
1/04/12
1/02/06
85 1/02/06
o016
.016
o 065
l0 065
16.5
6205
l62o5
o250
• 500
1.00
2o 00
o250
o 500
1_00
2_00
30°4
43° 1
42.3
53°7
58.5
76°7
88.9
89°2
.051
.056
053
058
406
411
408
445
(1) See pages 15 and 16 for parameter definitions
-51-

N
Q.
_0
ooJ
_o
c_
u.
0
o
mE 0 _J
o_
r_+_
c3
_-_o0
0 0 _ 0
..... ° ° ° ._ ._ ._
_ _ .......... _ ............
• _._ .... _ _..... _o_ o o _ ...........
_NNN_N_N_N_N_NN_N_N_N_NNNN_N
) _ )N N
_J
-52-

N
N
e_
0
_4,a
8
i=
'F- 'E '_
.o
¢0
0
_-N N
"53-
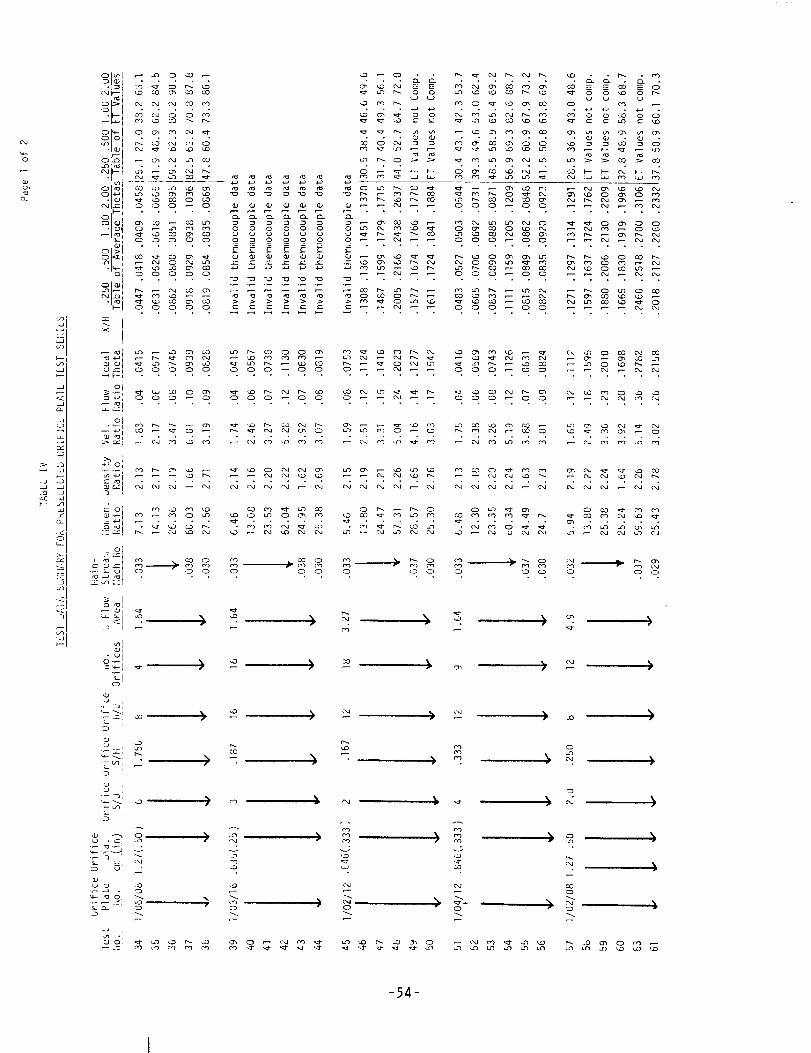
c_
r_
<,
:J
C_l l_ _.0 CO Ch _ CO
c_O_ C,J c_ Oa CO e'l
CD W- CD O_ on C'4 ,_
un P-- CO C_ c'1 CD
_ .....
_-_ _, _ _,
.....:D ....
5
000000
_EEE_E_.__
_'_o _o
_..._
• ° . _ °
.__
0 0 0
CD 0
0
_ ;-2.
2 _g_ 2
CD 0 0
c_ t_ u-_ c_ on
C_ 04 c,4 c_ _ c-4
c_ c_ cO u,_ e_
.... _uo _ cx_
0 0 0 0 0 0
) '2 ) _ >
cO
.5
c_
-54-
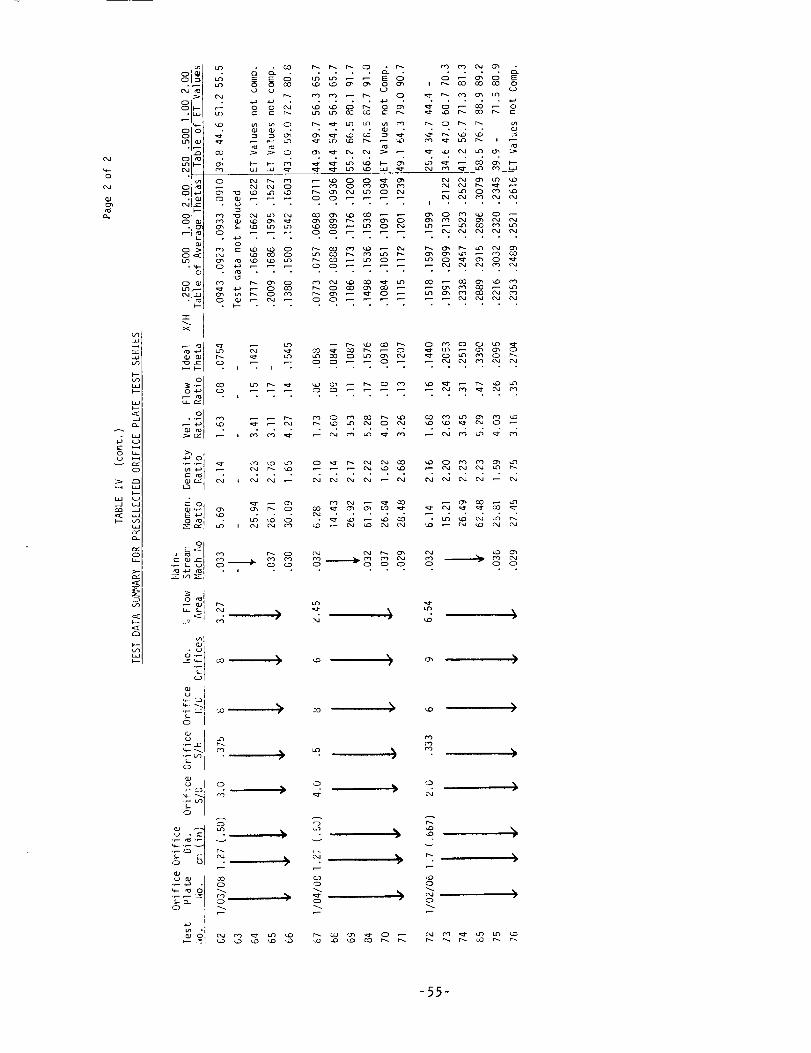
OJ
46
LO
c:I
0
ta_
o°od%
o__ _.
oO_61 _.
o__ _.oooJ
oo
X
o 0
o
_o o
o o_
I
_ ,-_ , N_
o • _o
eo 4.._ i
_
d _
'_ .21
_'_ __.2
o
0 0 0 0 0 0
• _ °
o_
0 0
-55-
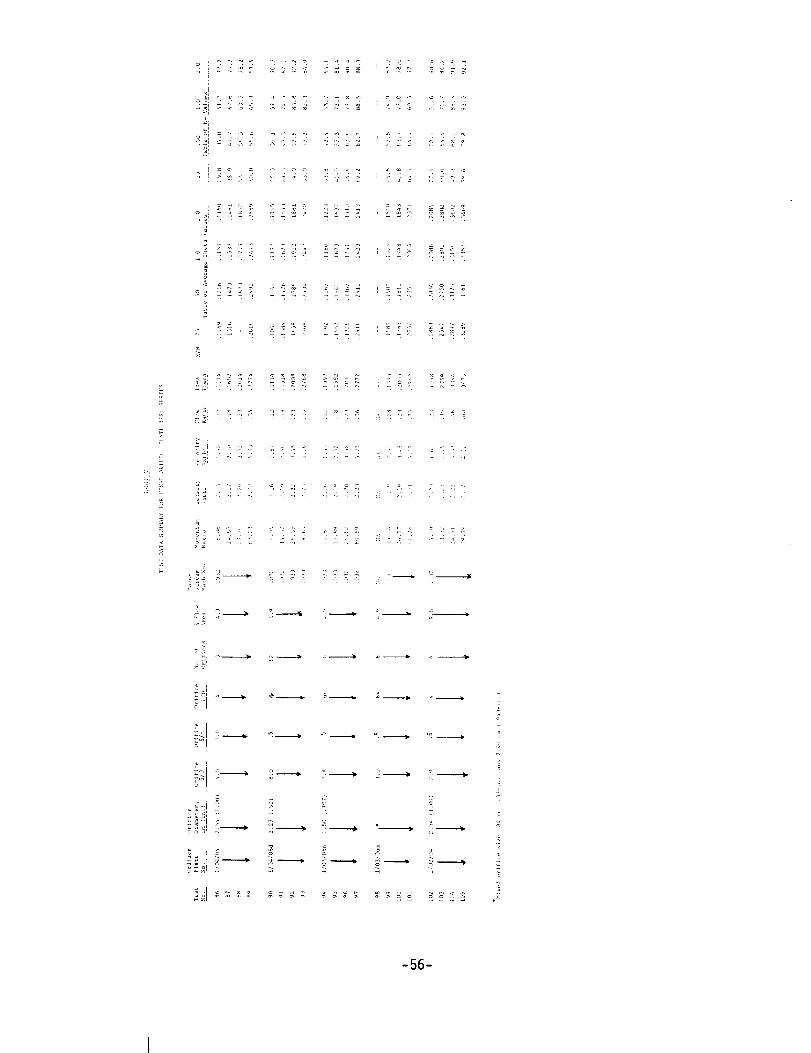
!
_ _ o_ _ _ _ _
-56-
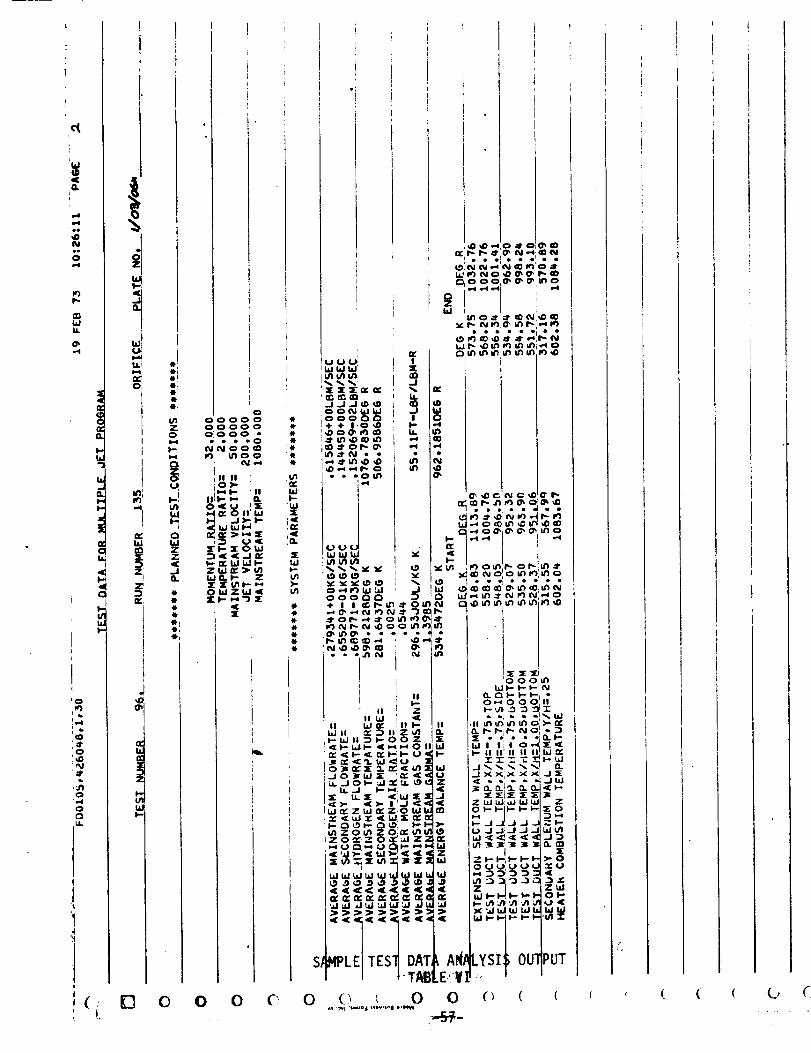
I
Ne_0
I',-
W
!o
bi
_,,.J
_8
l"
(-
J
I-
,4
I
,.,.,Ii,.,iItJ
o;I
i
iI
ii
l,,.,,.W
ziZ
t
2
I-
0
411.!'lu
*I_nZ0
I--k,,4:,,.,,
(_L
I,.
0WZZ
J
tl,
t1'41.,ti
t,
ooOoQooO_Oo
• • • oOc_N o0 cO
II II N .,.6
i'II-- :II
,-
0
I,
41.
Jl
,el
:z
Ul>.._n
,11.
i
I
lu '1
.J J -I _,.,__J_
I
II
: _ VtUl
i _ (.0 (.0
_ --_ F) bJ '..mJ
JIl--h
%.
I" "i""
! imII hl
i n
III.-
II Ii.I'n" :II I" IIW II 'Y _II Z I_I ,iira-,.,._m- Oo z I_
" J I--_-'_iX I.L:_: '(lld I _I J
ibj O:: Z Ld _ Z;O bjm. ,n
Z 0 _ 0 _',i.I Z 2 Y
,_d _J_'_J_ll_J _, _J
S_IPLEI TES? DAT:• "T_
0 (_ _ 0
I_O, OJ Od -,40d _
: I'1t1_t
= IW
° I
_'__
_,__
1--_ ..,.
,$$$!_
OMO0_II
' 'i'o-i_(II_II II III_
• ' U.JLd: L_I Ld L_
ia'-'-r- '-'-"'1-- J.._JJ_
_ F.- F._ I-- f- I-
:i.m I.,., I-,-- Q'I :,,/) ,.n .,tl _
A_LYSII
E"V]* -
0 ()
;OLn'
_.JbJ_ I.,..,
ZI[03_
.I_/I
:0,._
,._,_
;PUT
( ( .
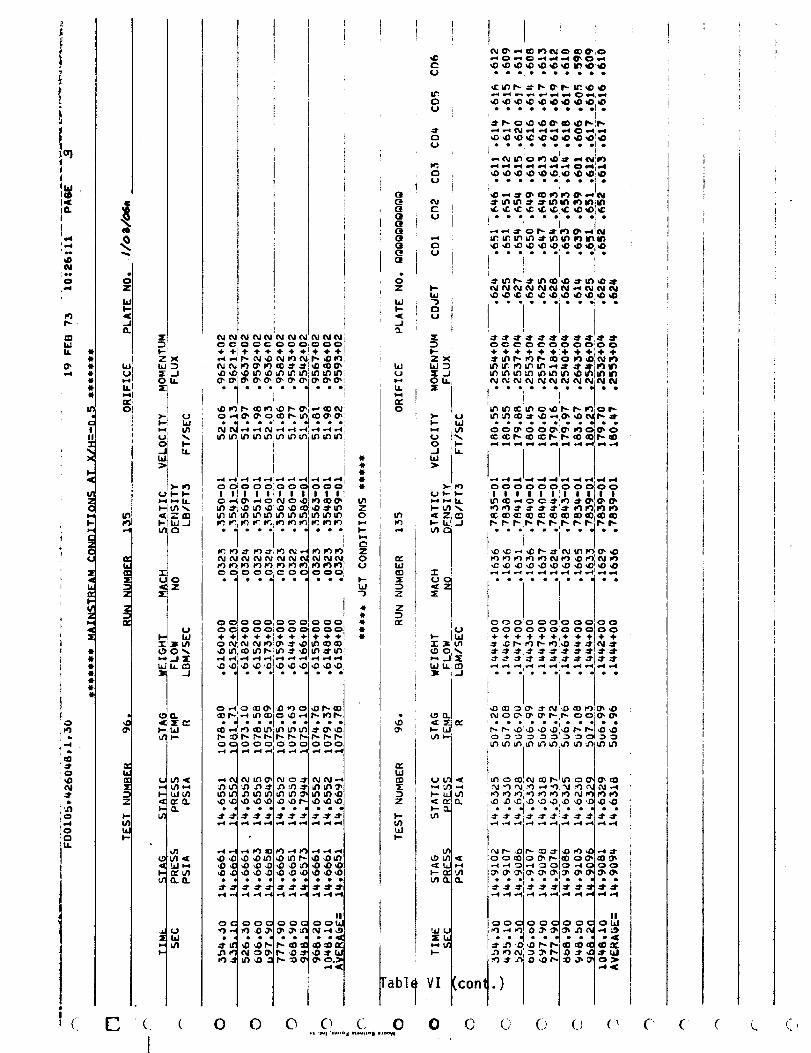
)
I
Li
iO.
i
!,,,q
,,=4
I-
t+ :
i :41'
I
iO
JO
N
t,
1I
, (
4
!+05".jO h
I
¢_1 ('_(_ I'_1 ¢_1 ¢_ Od (N N I_ I_11
_i *++ *!+*+t'_ I",- _ID
l ',,D 1.3: I_ _ _') _D I_ OS: ,.., ((3 IN ,
_, _ "-'°' °'. °.:9 ". "_= °' °':
41'
_,-,,, oOoooooNoool :.<.,,..,- , ,I, ,, , , ,I,, ,!
1
z _
@ ÷1@ @ +I+ + @1@ + ÷! .II.
"z'1.11 i/_ o all _ o,I _O: O_ =1- _0 i/'1 _0 _0,
o _1o o o o o J o oo
(..1 ffl <
I.._ t_.l t,n
P,- _r',. t'.- _-II_ r',- I_ £P'.- r'- f".oqoooioooIoo_,..i +=i ,,_ ,_=4+.=i ,,=( ,..4 ,.( e=4 ,,=4+=4
I_0 ,_l,O ,o ,ol,o ,o r,-I ,o ,o ,oi
• • e • •
I
' I• -4 ,-I,,=4 _') _I_ _ _1 ,,-q ,,"_ ,,"11
,,0 ,DI +,,0 ,._ I._ _l& L/'I P".,.I ,,,0 _0 I/"l_D 4)1 ,D _0 4) ,4) _0 _D _O _DI,_ _ ,,O ,,O _ _ _ _ _ ,O _1
• ol • • • • • el • • el
...i ..i .-.i .=4 .,=¢ .=s ...i ..4 ...i .-i .=Ii
e4oea
(, 0 0
Ol
Oe
Ol
WI--
l.IJ
U
IP0
)Z
,',r"
II
°°°,_(_ 01_ ',,"N
i
i labl_
0 0 C 0
r',
U
0
U
U
U
U
I,-
W
X _
_'..J
!u_- Ira
.00_ _
W L_ _"_
(._O_
k- t_i
'L_
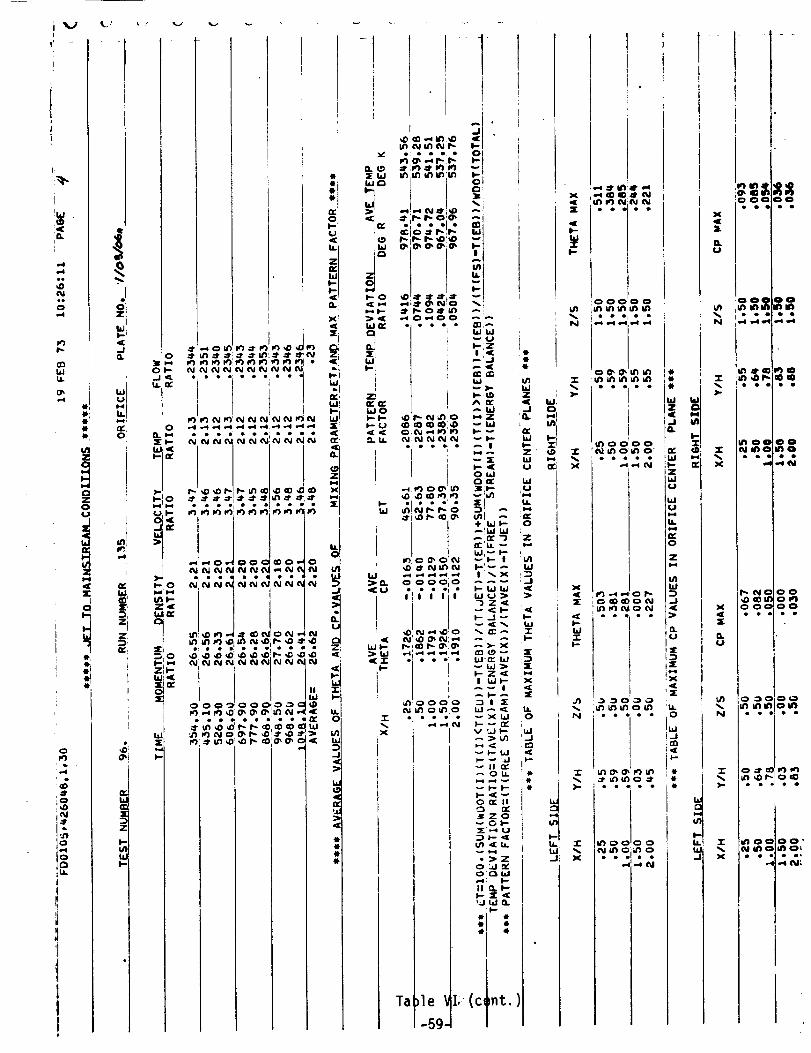
i V l...'i
I&llIm_
l".-Q.,
O0 !WbL
tl, 0F
(:3Z0
m,.4_
(
L
g
,
i
( zW
lO
01--
I)
_oX_
,s
)1
=I
ZIP.-
tat
eeeeeeeo
1I
t
(_1 il') ¢'_1I'_ i.-i
n-e_WOI-- I,-
I,-W
W
_U
l
I 1I
seeseeeee _ _ m osee
___ _ _ I
w
' _,. W
cO m _ _i'.O wW(_. (_l _l ll') IR1 1--_(%1 ('d_i (%i(_i wi-.-
,n!_r- r-o
)t
Ta le
-Sg
x:
m,.-i
oc:̧
eLi
Im._lxi
,.9-.,'4
2m,¢
nl
,,_[
I"
U.0
K)i,fiI+WI--
_ n? "jE'LLbJ,_ I--
i.- i,i bjb.lU_
I.-J_
%. n'. _
_bJ_I..- Z _
"_ II[
V '..J _m
_ 11 ._?_OU.
I--<{_O(E II
lZO
2E ,-'i U3 I" _tUl _t I,
._z
II _. I-
'.J _.1Q.I--
[i,' (c,
)
41.I.
_JZ,I{..J
'G.
n,bJI--ZhiU
bd
0
Z
;J
T
5"3
X
tL0
nt. )
IW,0
I?-_i9""I-
= _I_0=$00.
X ,,.4 -,_ (M
i
x,_ • • • • •
W"r
'% ,,_ if) if) o ._I_ • • • • •
X • • •,,.4 .-i eWI
)41,
Li
,.=,
0
Z8.,e
U')hJ
_1_t
i>
:X_t
!,r
0
LIJJ
:E:l!<
tt
!
U,.
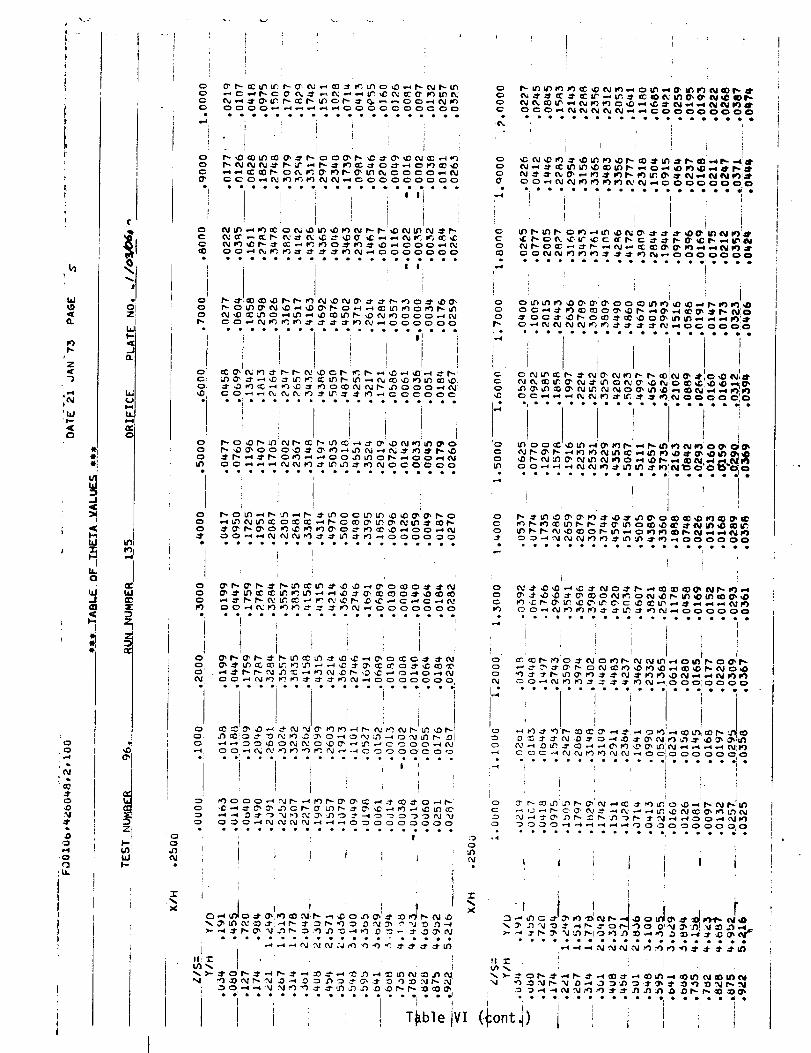
!
?
I
LI
hi
e.
Z
")
_lJJ
4(C3
E)
'aO
,.1"C3,D
,0
i-I
'0
i"
C
oiZ_
i,i
I--
h(Jl-qLI.
r,"
--I
Id
b. Io =j
:D
.:I
W ¸
!Q
o
"t-
X
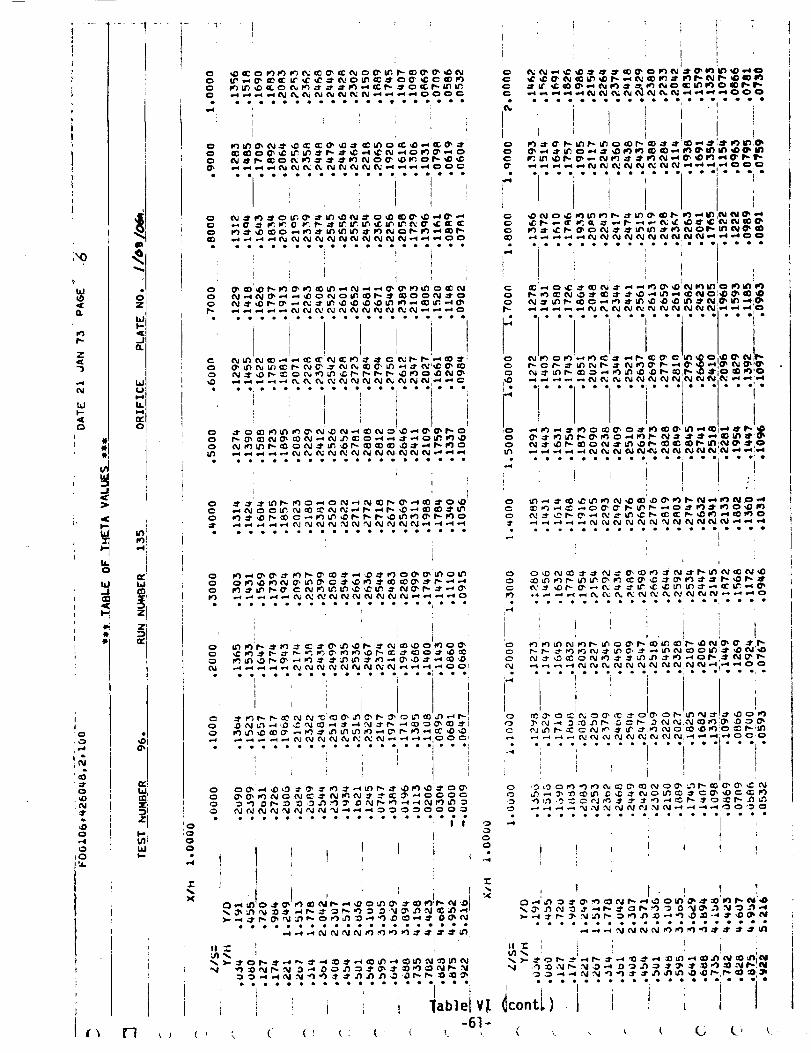
i',0
.
;D
n
Z
N
b.II--
u_O
W
--I
!-
01'i
4
II
_a0
O
I"
L_
I
I
'4fD
WIi-I
u.IIUIi,-,_i
ILli,,_1
aCl
oi
.4
iI
W
Z_
aC_
z I
U.It--
J
I k
O
O
O
1"
X
_eeooooo_eeooleo
1 i i
° t _' • •
1able V_
-61 -
OC
O
OC
¢r
CO
C
O
I _-
rO
OO
U3
c__r
c)
o
oC
' I 1_o _!_ _
M
i °°i° °_...... i°_ -,;°°i°° . __cont_ _ 1
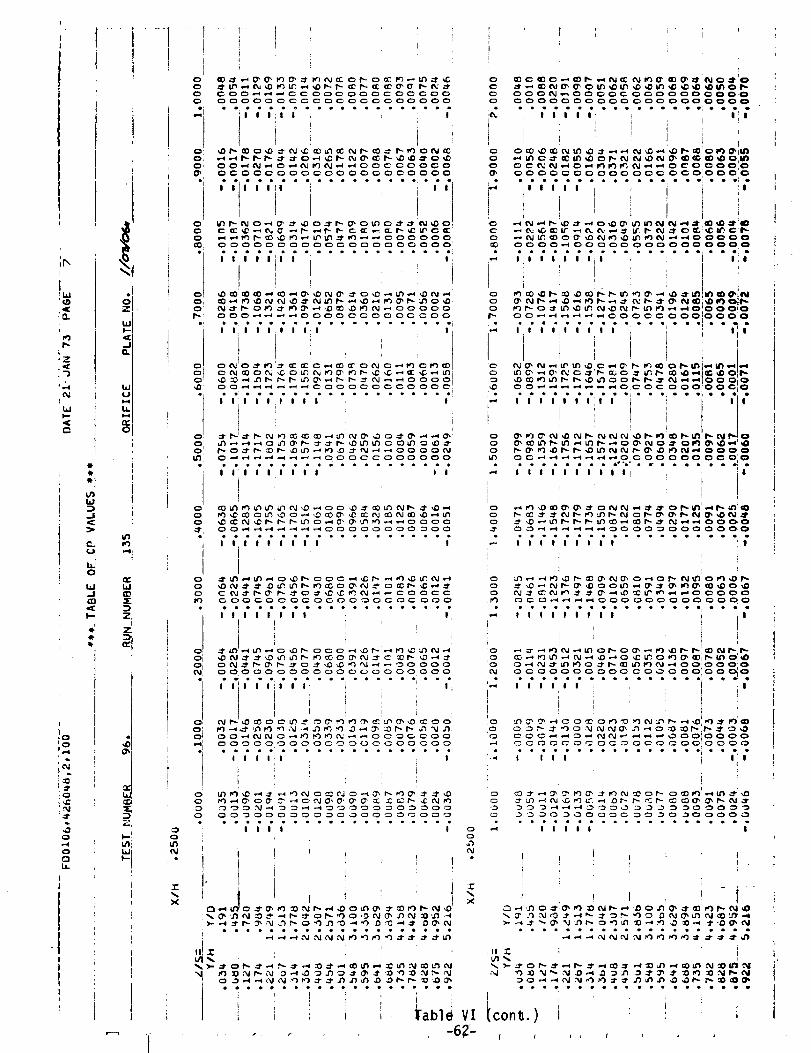
i
i
!z
O_I
I--
0
I
I°_0t..4
_O
,Q
0
0
L.L
t
!
t!
-II
)
tl.
W
J
0
.d
.....
W
UM
0
UFI _
0 ¸
Z,
i Lt:
x
! i
c
Q
Qc_
O_
i
C
m,,,.m
o
o
,..4
c_
o
o
.-4
o
oo
o
1,"_
,.2
,,=4
! •
1
II _ ; I
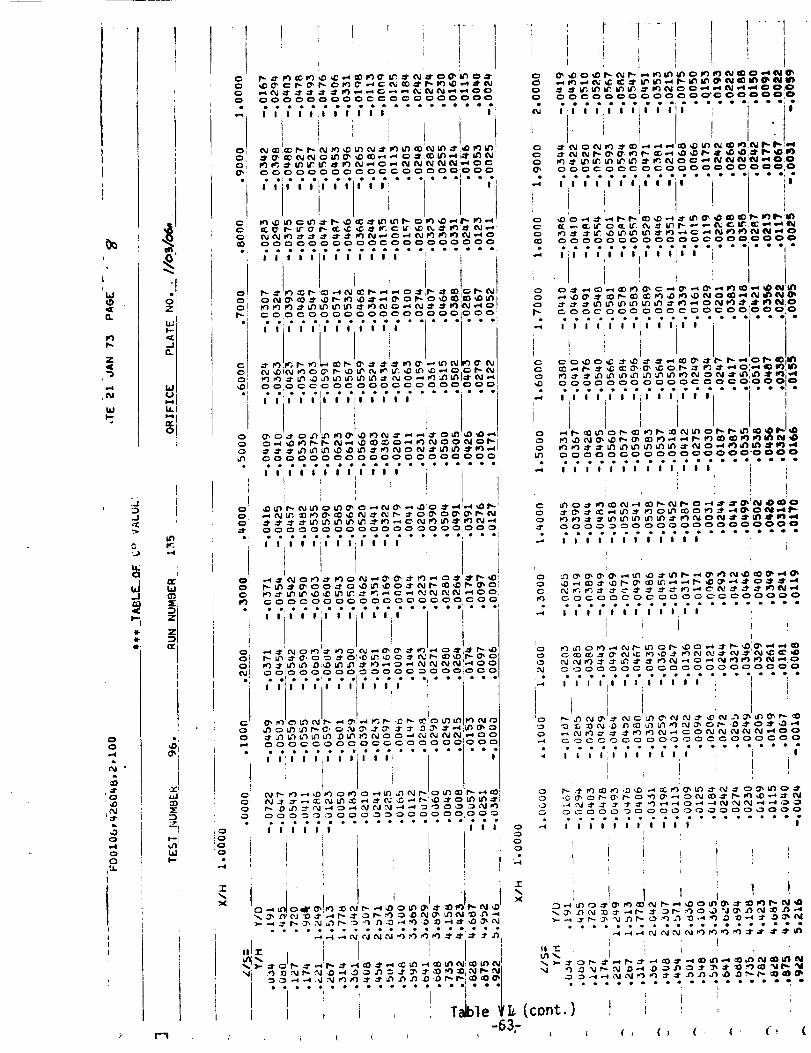
1
d
W
a.
f..
Z
.,,,4
l(_,l
I,--4
J
,...J,
to.;0
,d.J
.11-
41-41.,
00
,,.-4
,clO
,g
,.00
h,,,.I_P
Q
LI,.
tcJU
0
t,d
i
l
I
_L
ILl !0I,.,,,. 1 •
.,.-4
"r
,%.ix
I"1
I
C:t
0
0,0":
• I
i C
CO:
e_
r,_
o
i
!0
00
o!,=,I
e,
oi
_0000000 OCt _ 00 _0 004_
;;;;;;;;;;;2222221_u_oI= r- _-L m _ m N= m m
_...._...._ .. _._._._._.
_,',_coo o_ 1• .i. • ._ .... .------_
''''''''''"¢"i' oooo.• • • • • • • • • • • • • • • o, o • •
I I II I I :1 I I I I : I !il I:
I , !
::I12Z22;
l" I" I° l" I ° I" I° I" I" I ° l .... ° °' ° ° °i
I '_ I" i _ 10 t'_l" i" tel "]_ _"'_I I" Ill'_! • • .I. • "i '_ " "(
ooo=,,-,=o =o =olooo
/,'i', ;"'"'" ''i I''"'
° ° _. _. =.2 _. °. °. °. =.°. _. _. °. _.°. _. °.°.i.I I I I I | I I
i i
_ 5 "1"]"• _. _. _ _. _ o,.-,.-,_ =.
', T_dble
L (
i , r 1 -1 I -1---,' I I t i 'I _ i !
o-Q
ii i* i ._®_ ,
• "; go" ..... i ..... +
c _ _ _. iJr' _ _. Lit, ¢'_ ._" i.'3 I_ _., ,,=. 4L%. C:: Ill'. i_ _,,_ =,., 4L%1
_ ..-I" .,,,,¢ _:) ,,.._ _:l (_ ..-,I 0', ,,,,_ _ .,.,I :
I I I I I I I I I l I I
' iI ,
• • • • • • • • • • e; • • • •
I I I ! I I
-=_ l l I Iii J Ill
• • • • • • e •
"_ ( "( ( " " ( _i " "i
•.." I I I I I I I
i
o .D.-_ _0_ _r.-_ aol_,..._.-_l_,4_.-l_J" o_i'=r .,4
,"4 1 I l I I l I I I I
,_o o= ___oooo=oo
• . • • • e • e • • • • . e • • • • • • eo ,-4 I I I I I I I._ i
o i
'=' t i i• i
" J 2 ,; 1X
.::_,-_u_o..lrO',r_ _11".. ,,,0o Cl'_,:._"_er}1',..('_l,_
,.,,_,-,,,I,-_t, JOJt_lO,.l_'.')P_N')_.Ir',=t ..Ir.:J',ll'_
_i _Z I I
• • • • • • e • • • • • • • • • • e • •
i i i _ 'I_(cont.) I i i ,
-63.--(, (_ ( 1, (, (

0
ZI,-4
_,4
-64-
Z0
11,41,,,4
0U
I--
F-
ILlI-
F'-UJ
-J0.
IN..d
e---
H
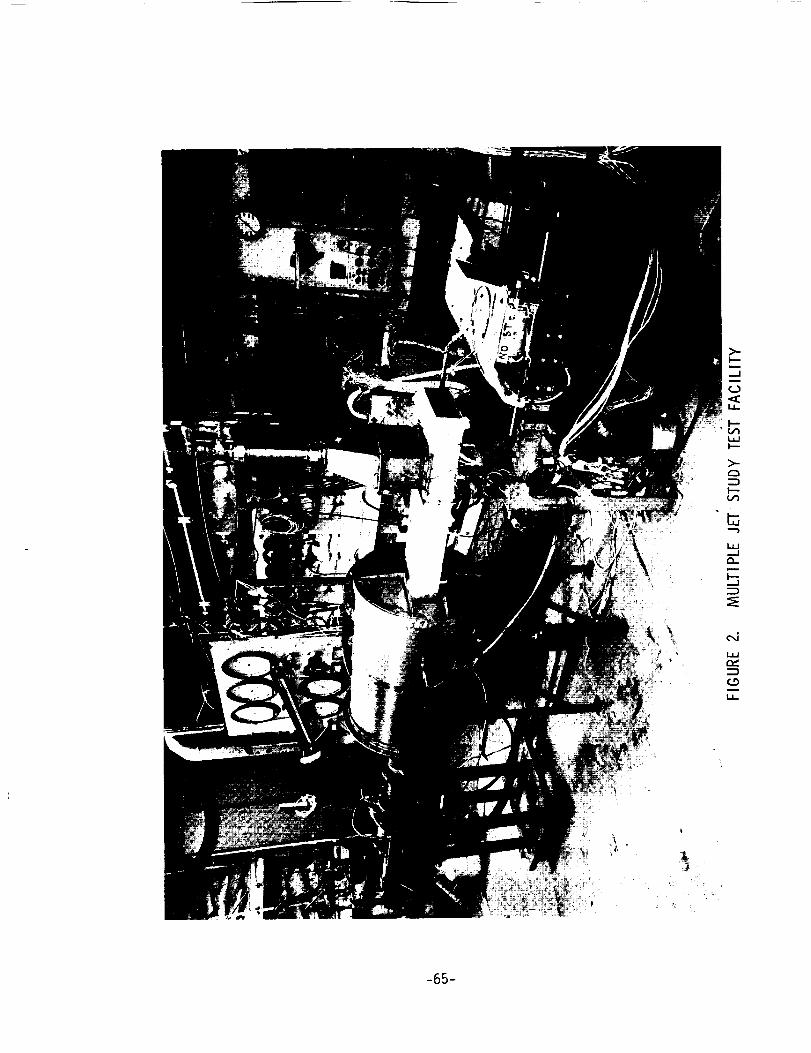
lira
ii
lirac_illlira
_n
LLI
t_
c_J
IiJ
m_
LL
165_
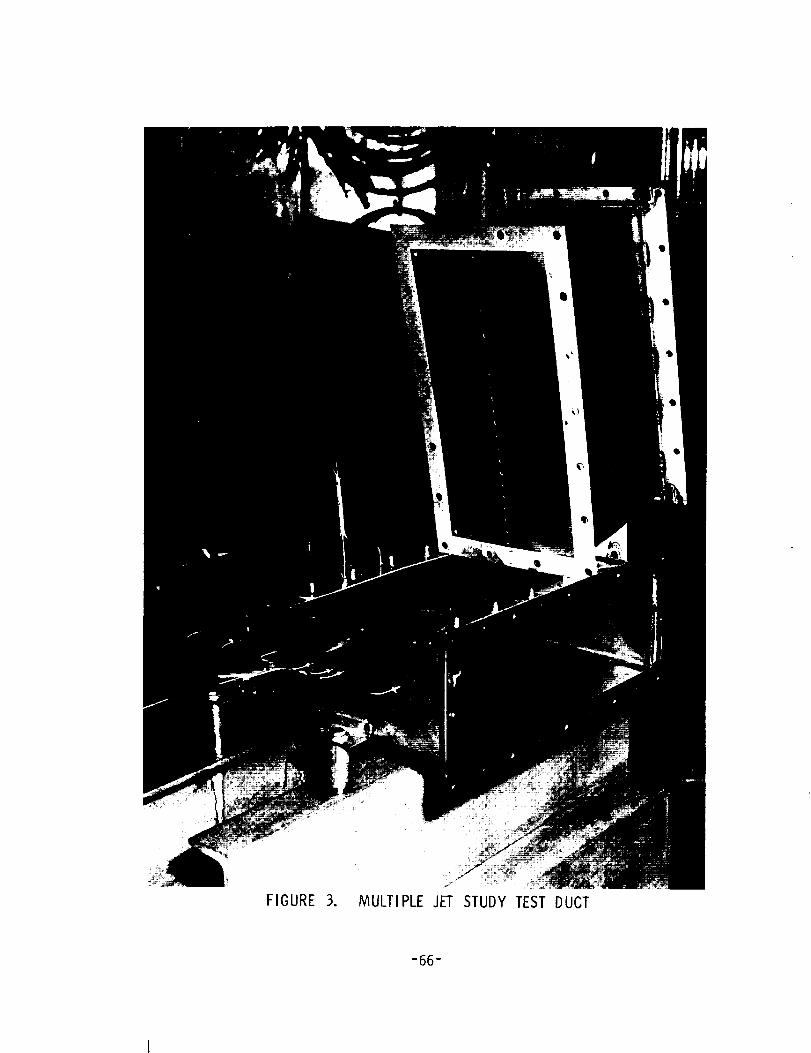
FIGURE 3. MULTIPLE JET STUDY TEST DUCT
-66-

FIGURE4. MULTIPLEJET STUDY INSTRUMENTATION RAKE
-67-

Figure 5 MULTIPLE JET STUDY ORIFICE PLATES AND TURBULENCE GRID
-68-
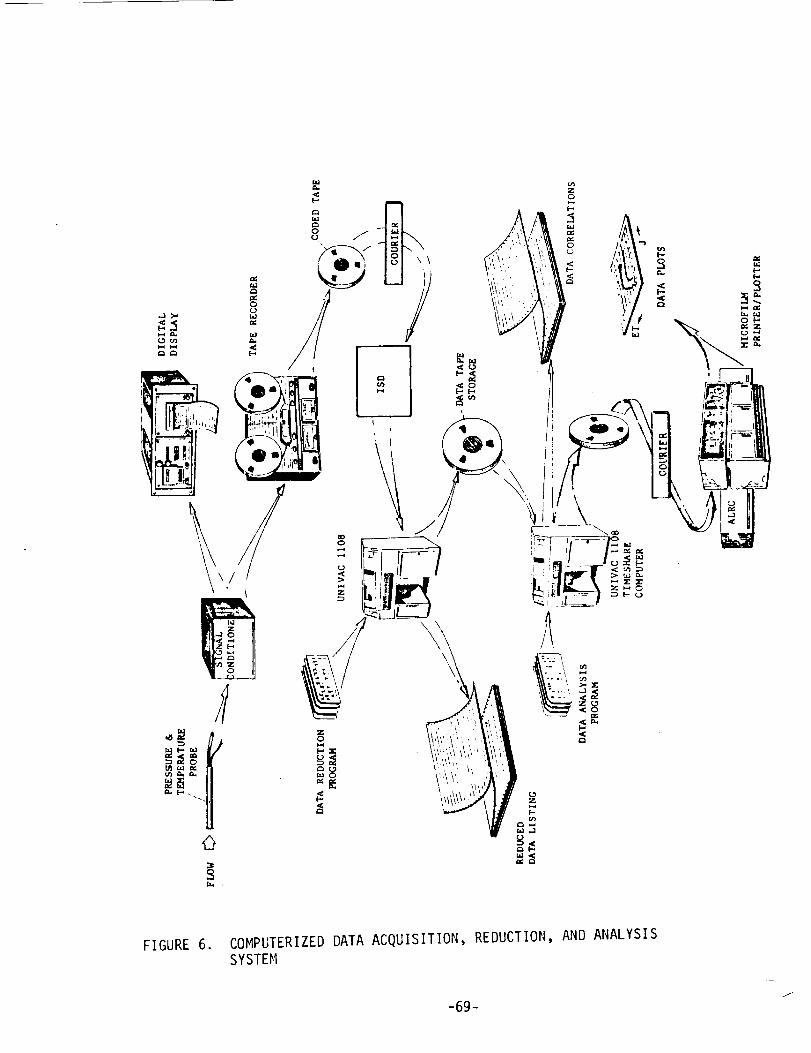
_, L_ k
0 t ,I' ' ," _'", ' _ _
\I
\ // = , -..\\ // -_ l,_.,/ /i.=.\, i n_ ""I_ _=-.
_I / _ /t(,,_'I ! _li!<_ oli ' ,.'.',_A_', ,ti i.,,,o \,,,,])),t,,,
: "" llt °gIV ,._,a
0
FIGURE 6. COMPUTERIZED DATA ACQUISITION, REDUCTION,SYSTEM
-69-
AND ANALYSIS

Z
....J
o
II
x
\
_J
I--
_JI--
L_r_ XI---
L_ .-J Z
bJH-bO
b_
L_l---c_Z
C)0(.J
>-
l--
h-UJ,-3
L_.-J
h--
ud
(-'3
LL
-70-
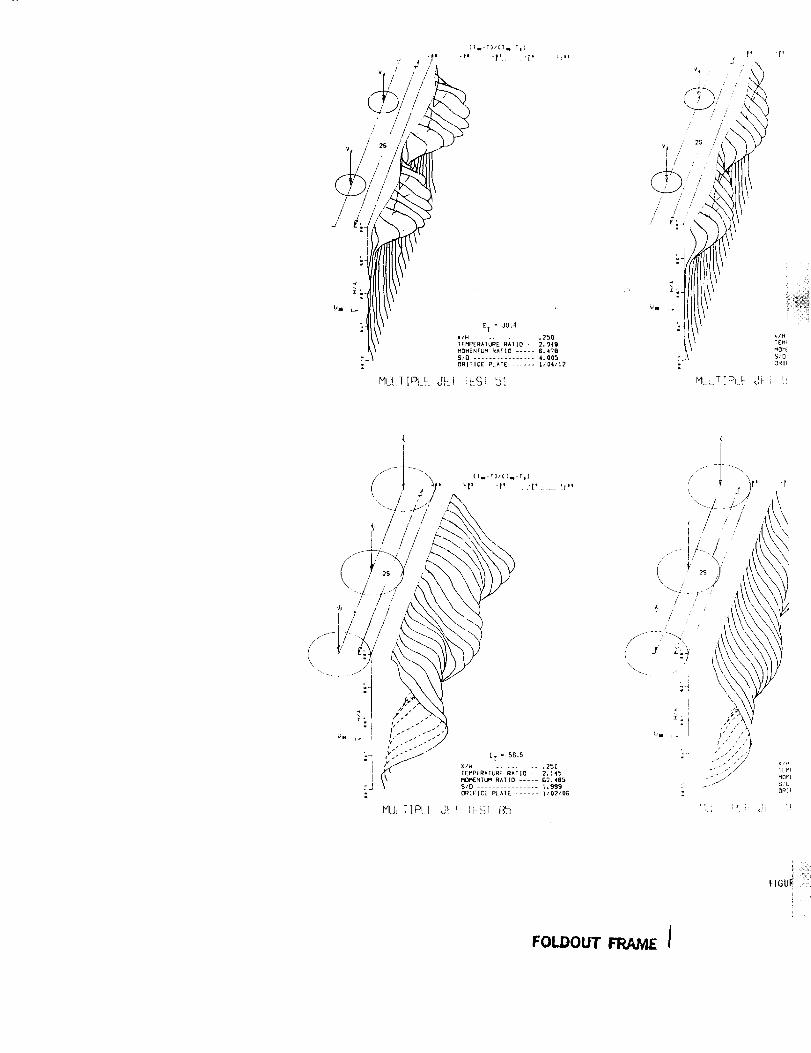
E T = 30,4
X/H ................ ,250
OAf:ICE PLkTE ...... 1/04/12
MdLTIPEF JEt IESF 51
/
/' /
I
P1LjLT!Pi ,_. JF
E T = 58.5
XIH ................ .250
TEMPERATURE RATIO -- 2,145
M(_e4ENTU_ RATIO ..... G2,465
S/O ................ 1,999
ORIFICE PLATE ...... ]/02/0G
MU_ [IPLI: Jhl [bSl 8b
- "_ MOML
'IL; ]r_, !- Jt ,!
FOIl)OUT _E I
}
FIGU_z

e, i J

/
/'
/
v I ///
[l_ I] [T_-T I]
•r" 'P' "T' Ir°'
/
/
L T = 43.1 E T : 42,3
.500 X/H ................ 1,OO0
NATURE R_II0 -- 2.0"19 TEMPERATURE RATIO -- 2,048
R_TI0 ..... 6,478 HOMENTU_ R_TIO ..... G.4?B
4.005 : SJO ................ 4.00b
ICE PLATE ..... l/Q4/12 _ 0RIFICE PLATE ..... 1/0442
.Si bl NUL I_P['F JF1 i1:51 t)1
i_m_M FLUX F.ATIO = C,L)
I NCREAS II_G :.:/h
i_EhTUMFLUXFATIO= C,,_,5IIICREASIHG)Ytl ---_
E 8. COMPARISON OF MIXING EFFICIENCIES AND TEMPERATURE PROFILES
E 1 = 53.7
XIH ................ 2.000
TEt44_ERAI_E RATIO -- 2. 048
MOMENTUM RATI0 ..... G,_TB
S/D ............... 4,005
_|FEE PLATE ...... 1/04/12
A£TIR_E- JFT 1FST b:
E T : 89.2
X/H ............... 2.000
IEMPEhAIURE RAIIO -- 2.145
MOMENIU'MRATI0 ..... 62,4_
$/0 ................ 1,999
O_IFICE PLATE ...... 1/02/06
v ,_. T[PE_-_Jl-I i_-Sl85
FIGURE 8
I:OLDOUT I:TVwV.K
-71-

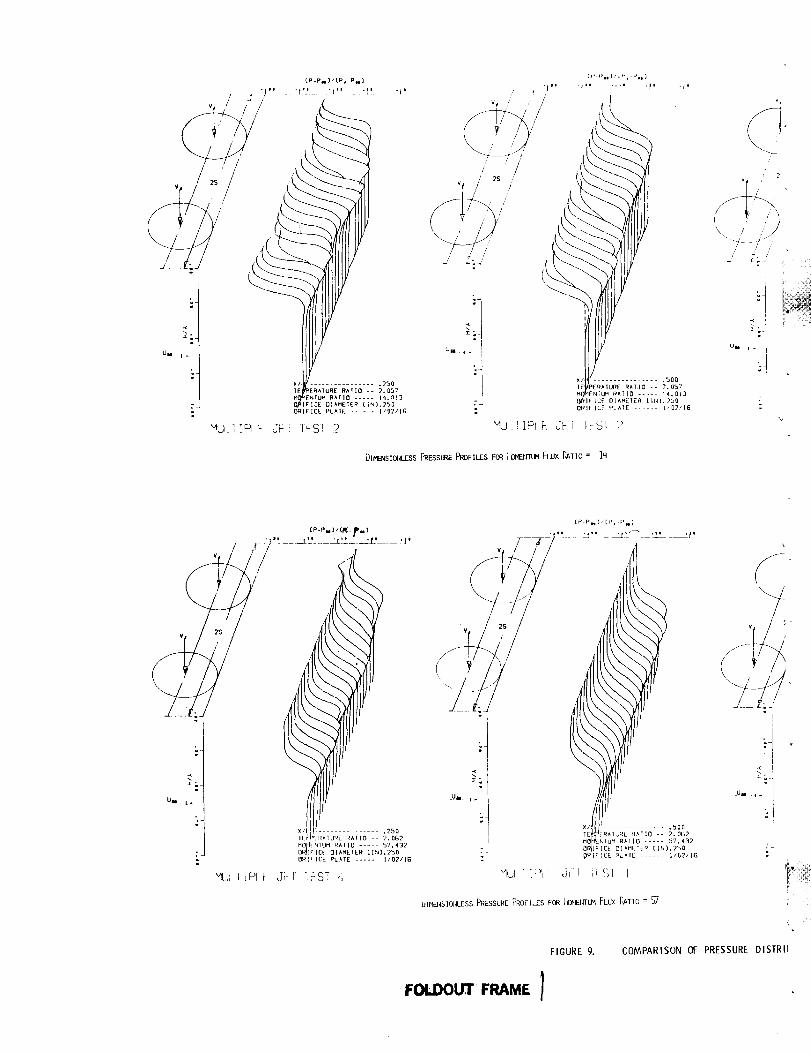
"l H _T'' "I' "t'
vF /j _ /."
/
/ /
z'...
UII i-
JJ|t, IENS[OI,ILES$ PRESSURE F_I)FIIFS FOR ;13MEHIII'4FLUX P_TIO= lq
v
2!
i 7
I'm I° )
iI
%,
v
Ij
H/j'_ l iP/ t _TII _;_ST ,',. MUI TlPi_ J_-I IISI !
UIMF.I_,SIOI,_LESS PRESSURE PROFI_ FS FOR J_Et_TL_ FLux P_TIO =
Umi (_
-!
!
FIGURE g. COMPARISON OF PRESSUREDISTRII
FOLDOI._T FRAME 1

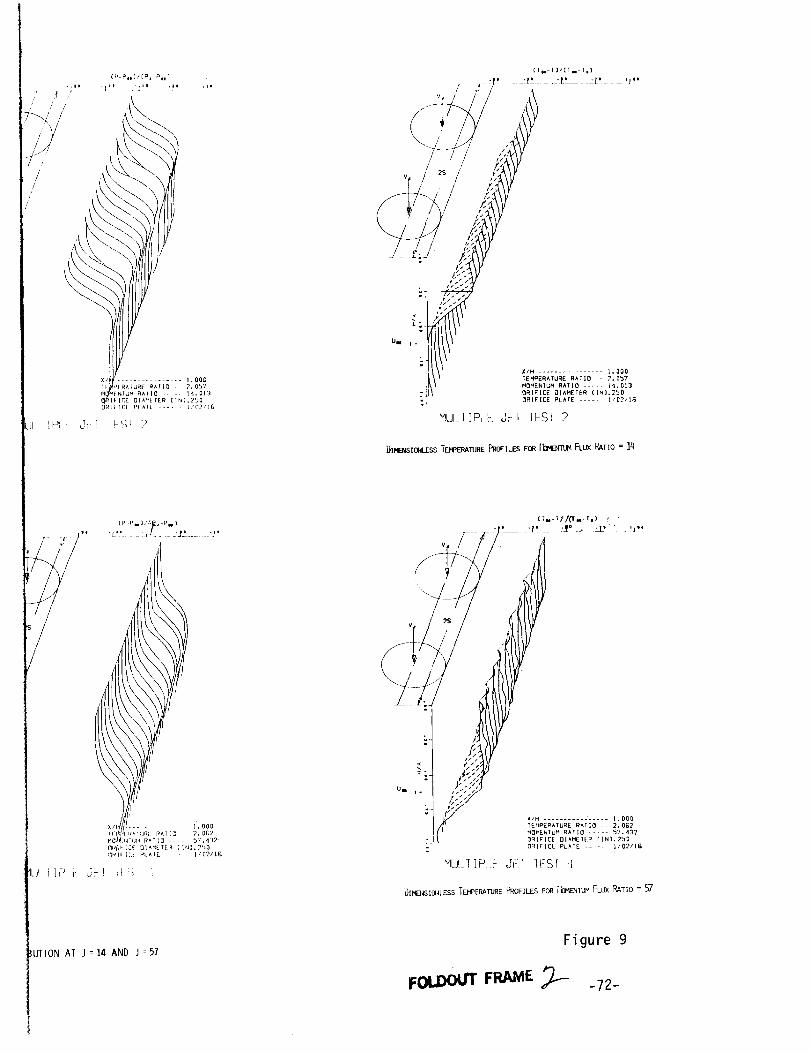
/
[P P_],'£./l_ j-Pel)
L'.'_ h/-- -:]-' ..... "]'
IUTION AT J =]4 AND J :57
/1/
X/H ............... I.O00TEMPERATURE RATIO - 2.057
MOMENTUM RATIO ..... 14.013ORIFICE DIAMETER (INl.2_DORIFICE PLATE ...... i/D2/I_
'!UI I TpI t-. j_i IFSI 2
UIMENSIOHLESS IEMPERAIIJRE PROFILES FOR [_MENTUM FLUX RATIO = 14
0RIFICL PLAIE ..... 1/02/16
0[MENSI_LESS TEMPERATURE PROFILES FOR [_OMENll]M FLUX RATIO = _7
Figure 9


O 00 CO
i
................ ioo_o_m -
. i
. !
C_ C_ 0 O_ C_ ,m--
13 'a6u_qox3 £6_au3 %uao_ad
-74-


CTN_I)/CIorTu3 CTw-T_/CTm-II)
_ 'rt .'rl "i' . !ri' "f' "[' '1'. ill'
//
:J
X/H ................ .250TEMPERATURE RATIO -- 2. 123MOMENTUM RATIO ..... 61.913
S/D ................. 4.000ORIFICE PLAZE ...... 1/04/09
HOLTIPLE JEl IEST 84
Um {.
MULTIPi E JFI
X/14 ................. .500
TEMF_ERATURE R^I]0 -- 2, 123NOHE_IUH R^IIO ..... 61,513StD .............. 4,000ORIFICE PLATE ...... 1/04/08
1FSF 8.1
_IMENSIC(_%ESS TEIHPERATURE PROFILES FCINCREAS!
/t
/
r
z._
-J
W/H ............... ,250IEHPERATURIE RATIO -- 2.033
MOMENIUH RAIlO ..... 6.283S/O ................ 4.000
ORIFICE PLATE ...... 1/04_Q9
MULTIPLE JET IEST 67 MUL.T I PI E
XIH ................ .500
TEHPERAIL_E RkTIO -- 2. 033
S/O ................ 4,000
ORIFICE PLAIE ...... 1104/OB ii !
JET IEST 67
DImENSIOnLESSTEMPERATUREN i
FIGURE iO. EFFECT OF AAOMENTUA

_ P
B,o

CT,o=IJ/CTm-T o 3
,_' "r" '_' "T' b"
/
RGI_,NAL IbMElfrUM,-FLUxPATIO=
x/H ................ 2.000
TEMPERATURE RATIO -- 2.123MOMENTUM RATIO ..... EI.913S/O ................ 4.000ORIFICE PLAIE ...... 1/04108
MULTIPLE JET TEST84
/
/
Y
W/H ................ I,O00TEMPERATURE RATIO -- 2.033MOMENTUM RATIO ..... &.283
S/D ................ 4.000ORIFICE PLATE ...... 1/04108
MUL IIPLK JE[ [E.SI E/
:ILES FOR IbMINALIb,IENTUMFLux RATIO= G,2INCREASING>'dIl "-
FLUX RATIO ON TEMPERATURE PROFILE
[Tm-T)/( Tem-T _)
] __ L --.
X/H ................. 2.000TEMPER^lURE RkTI0 -- 2. 033MOHENTbM RATIO ..... 6.283
S/D ................ 4.000ORIFICE PLATE ...... 1104108
MULTIPLE JET TEST 6?
Figure lO
FOLDOUT FRAM_ _'_ _73-


Ll
!.-O"0 v̂o
INIERVAL : .5
X/H ................ ,2'50
TENPER^TURE RATIO -- 2.123MOMENIUM RATIO ..... GI.913S/O ................ 4.000
ORIFICE 'PLATE ...... 1104100
MILTIPLE JEJ TEST 84
b. _ b b
b
I.-_'6AvG
INTERVAL :: .5
X/H ............... .500TEMPERATURE RATIO -- 2,123rKI_E_?¢_ RATIO ..... 6I. 9t3
S/O ................. 4.000ORIFICE PLATE ...... 1/04t0B
_UL[IPLL j_T 'ES] 84
_[M_SIO_LESS TE_ERATURE CONTOURS FO.'q[NCREASIt_
_, : J •
b
D
1.- -P--/OA_s
INTERVAL : .5
X/H ................ ,2501EMPERATURE RATIO -- 2.033
MOMENTUM RATIO ..... 6.283S/O ................ 4,000ORIFICE PLATE ...... 1/04/08
MUITIPiE JEl lEST 87 HIJL 1 I PL [-
INTERVAL = ,5
W/H ................ ._00TEMPERATURE RATIO -- 2.033
MOMENTUM RATIO ..... 6,2835/0 ................ 4.000
ORIFICE PLATE ...... L/O4/OB i
JE3 T_ST G7f
DIM_IONLESS TEMPERATURE CONTOURS i:Lt_REA'-
FIGURE 12.
FOLDOUT FI_ 1
EFFECTOF MOMENTUMFI

_J
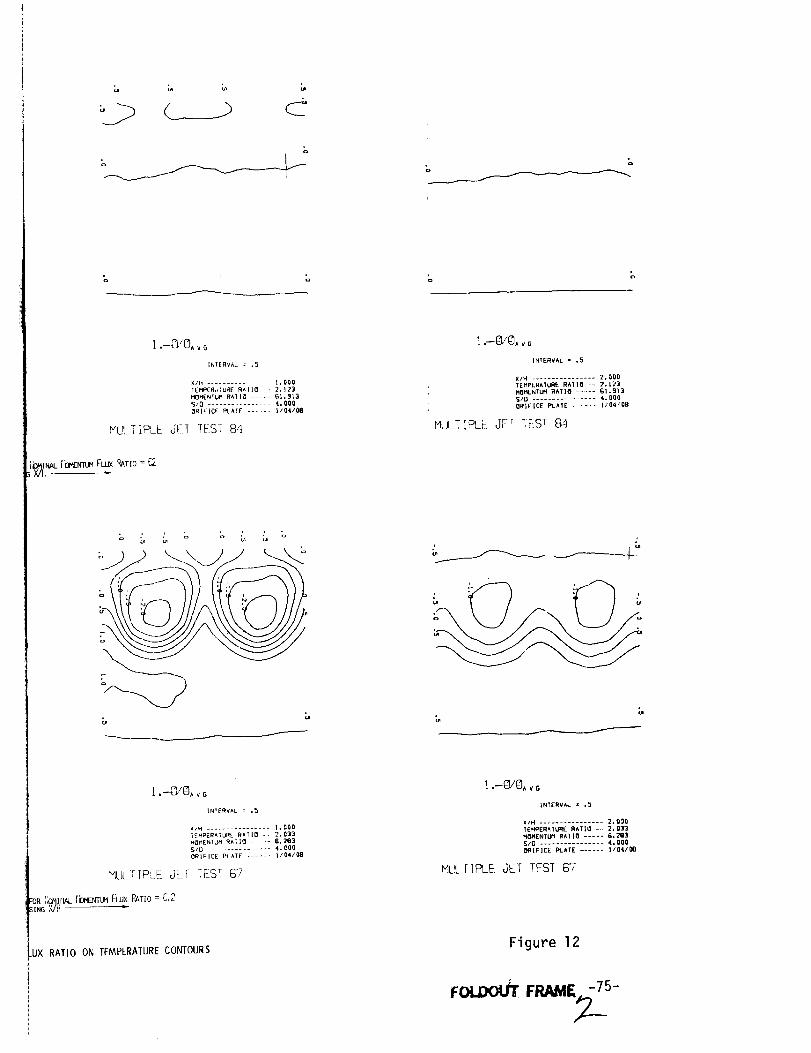
a
INIERVAL = ,5
X/H ............... t,O00FEMPERnTURE RAflO -- 2.123
MOMENTUM RATIO ...... Bl.gi35/0 ................ 4,000ORIFICE RLAIE ...... 1/041_
MULTIPLE dFl _ES_ 8_i
IbM[NAL[_MENTmFLUXRATIO= £_-_XAI
Cn _
!.-_OA _G
INTERVAL = ,5
X/H ................ 1.000
TEMPERATURE RATID -- 2.033MOMENT_M RA_O ..... 6,283S/O ............... 4.000
ORIFICE PLAIE ...... 1/04/08
HULTIP! E JET IEST 6"7
:OR(_OMIIU__rB_ENTUMFLUXP_TIO= C,2HNGX/H
UX RATIO ON TEMPERATURE CONTOURS
• o
o
1.-O/C), vG
INTERVAL = ._
X/H ................ 2,000TEHPERAIURE RATIO -- 2. 123ROMENTt._ RATIO ...... 61. 913$/O ................ 4.000
O_IFICE PRATE ...... 1/04/08
_LS 84MULTIPLE JFI _- T
1.-0/0^vo
INTERVAL = ,5
X/H ................ 2,000TEMPERATURE RATIO -.. 2,0]3MOMENTUM RAIIO ..... 6.2B3
S/O ................ 4,000(_RIFICE PLATE ...... 1104/0@
ML!LTIPLE JET TEST G7
Figure 12
FOUX FRA Z S-

i'¸ _ _ql I _ _°
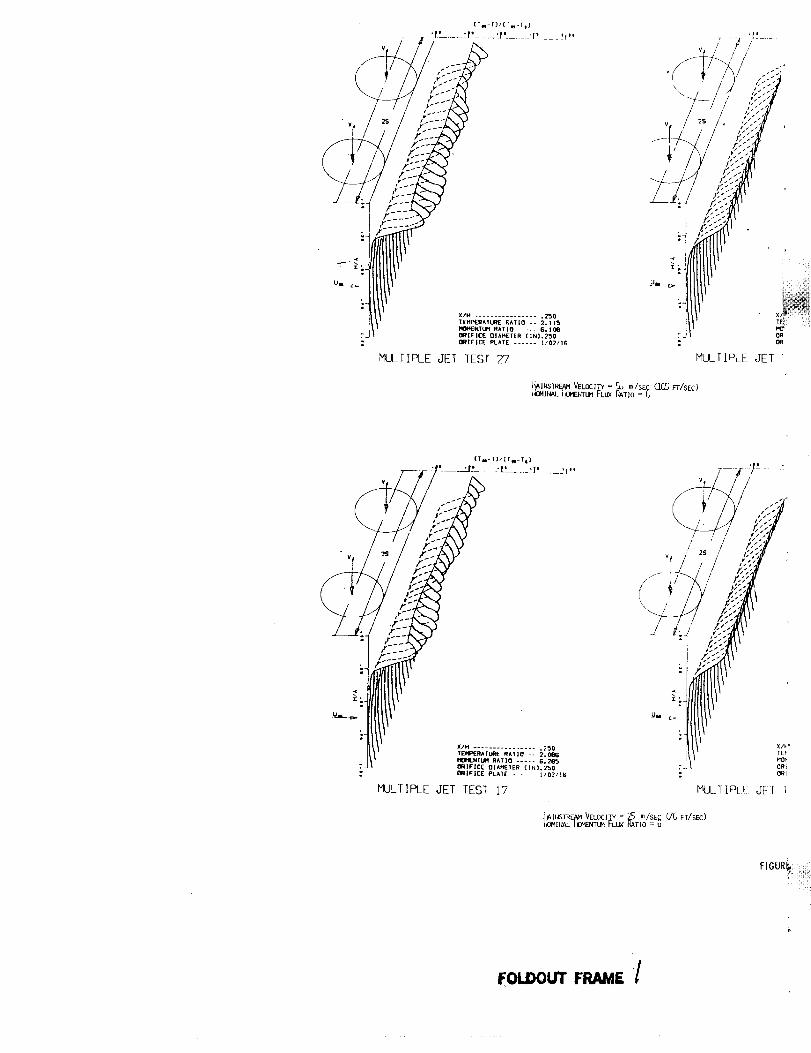
CTm-T)/[ ?_-TlI
-r' "r' 'r ° '{' _I**
N(_'ItE NT UH RATIO ..... 6.100
ORIFICE OIAHETER (IN),_'50
O_f F I L'E PLATE ...... 1/02/1G
MULTIFLE JET TEST 27
t,_]J_s_M, VELOCZ_= _ m/sEc (ICS FT/SEC)_40iMII4PI_ _13vEI,(TUH IIL_ _,TIO =
X/H ................ .;50
TEI41_RATt._ (_AIIO -- 2.096
e'K$t4ENTLIM RA_IO ..... G,, 2mO'_
_IFICE DIAMETER (1N3,250
OR|FIC _" PLATE ...... 1/02/15
MULTIPLE JET TEST 17
/
_" _-! I'o..o
VUL 1 I PL_E JF [
IIIISTRF__t VELOCIII'Y = _=_ m/SEe (7C FT/SEC)
l?4.e,L.Hor,'ENIIJM t-LU:< V-ATIO = b
FIGUR
FOLDOUT FRAME _l

q
b •

cr_-_I,(rN-T = )
p' . .p' .p? ,j,,
/
+ ................ I.OOO
qENTI._ RATIO ..... E, lOO
|FLEE OTAMETER [IN}o+"_50
W%CE PLATE .... 1102/IG
-EBT 2'7
X/H ................ .250
TEI_ERATI.IR[ _^TI_ -- 2.1_0
H(_4ENTUM RATIO ..... 5g, llG
S/O ................ 2,000
0RIF]CE PLkTE ...... I10_116
HULIIPLE JET TEST 28
X/H ................ l,O00
TEMP_AATL_E RATIO -+ 2o120
S/O ................ 2.000
O_IFICE PLATE ...... 1102116
MULTIPLE JET TEST 2CD
i_II_TReH_W+£.oC]_= 16 mlsEc(_FT/SEC)
(T_I-T)/CTu-T s ]
..... :_, _--I#____U *_
................ 1,000
PERAT_RE RATIO -+ 2. 084_
ENTUM _*rlO ..... 6,205
FICE DIAmeTER (IN).2_OFlEE +_.+_l[ ...... $/02/LB
EST i'7 _',Jt :I_'! E J_ : +t S; 1
i_INSPRE._I_I_I,__hO_EN_MVELOCITYFLUx= RA tO57_'_Tm/sec(T6=FT/SEC)
FIGURE 13
13. EFFECT OF ABSOLUTE MOMENTUM LEVEL ON TEMPERATURE PROFILES
-76-
FOLDOUT FRAME

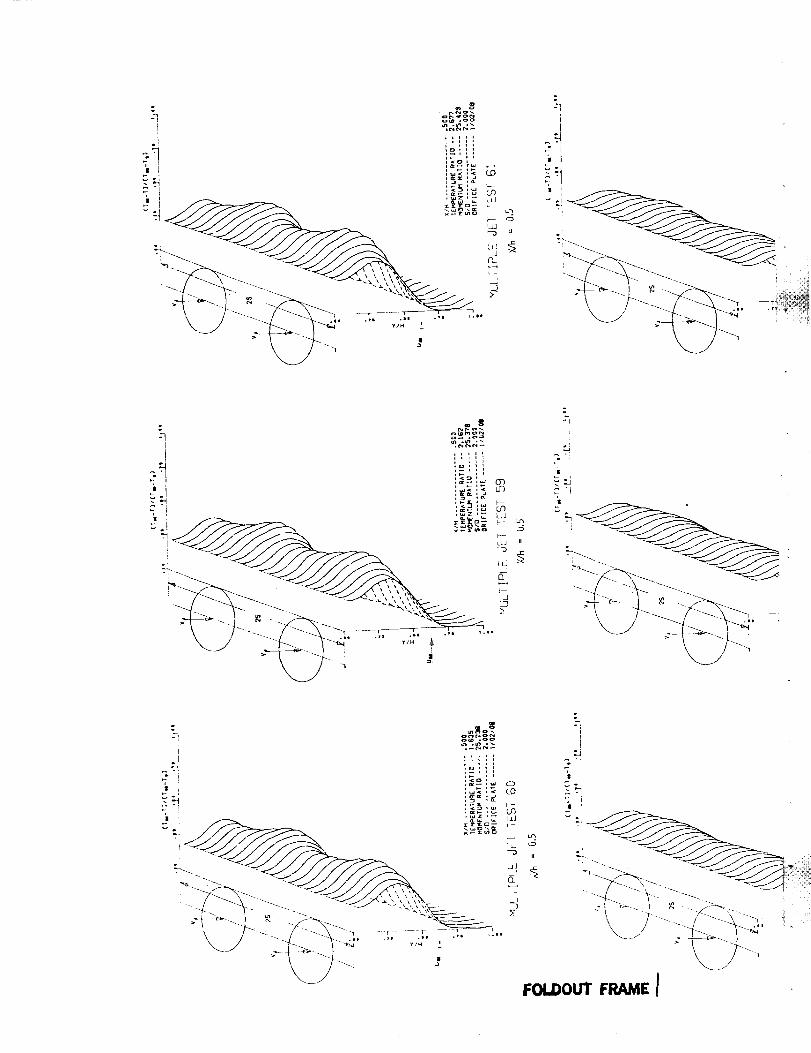
i
:,.<,'_ :_ (D
1_1:, b--
"7II I _ _ _ L_
I ,_ 11
-i " " k_t2
).i
(amors
i--i!!
,o.
I wz,_ ,
\ J _ -_---_..... ,,.
i ,sS
i i

L
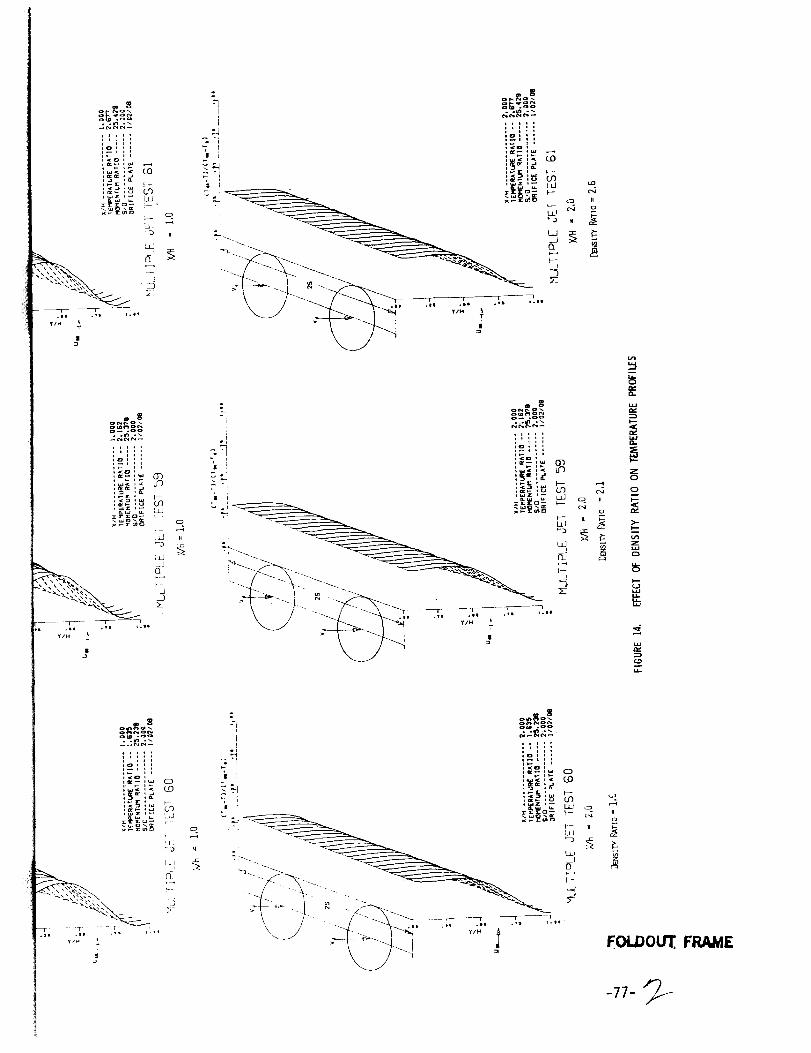
o
0
5
i..i.I
I,iI..

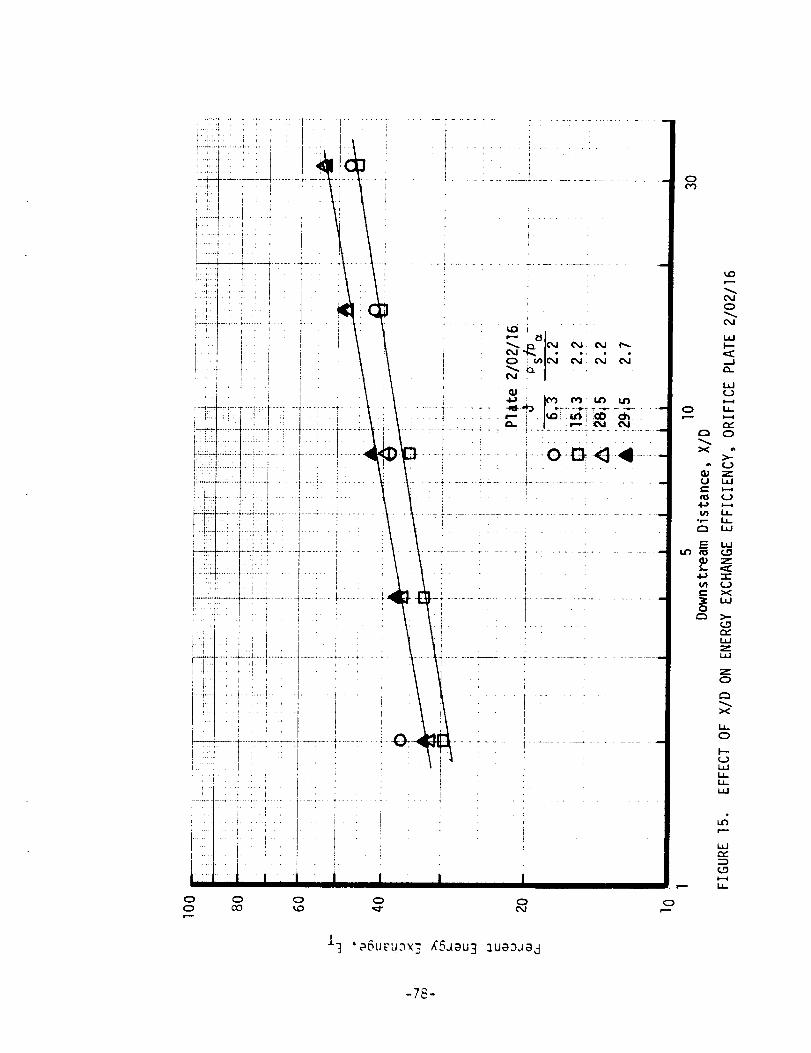
c) o oo co ,,.c)
o 0
J--_,OSU_,U._3 RSJOU 3 _UO_JO d
o
0
o
L.mJ
LmJ
r_,r_ 0
×>2g_ z
_ c._
_z
_×0
eY
z
z
><
o
_4
e_2_
I..L
-7_-

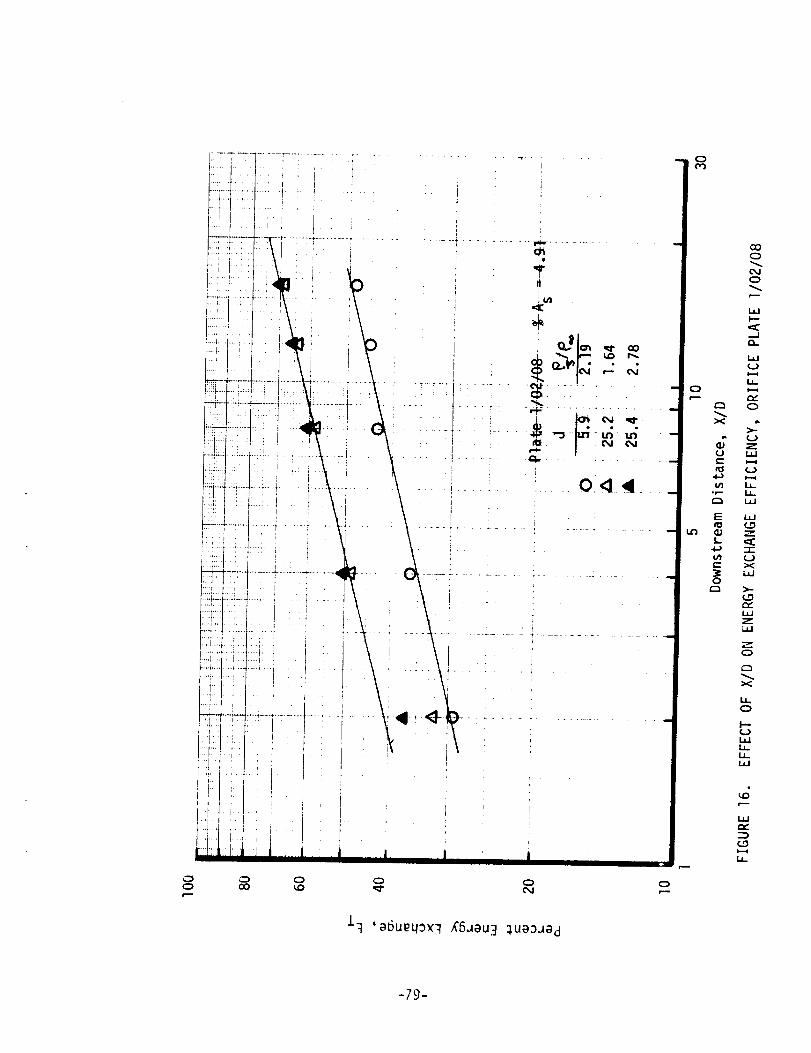
Or-,-
13 'a6ueq3×3 £6Jau3 _ua3Jad
E:
¢,n°r-
E
f,,,,,,
ul
o
,.,=;i.,--
n,,::3
-79-


0 C_ 0 0 0
13 'B6u_q_x'3 £6_Bu3 _ua_JBd
c,
('4Jr--,-
o
t-.-
L61
I---
._.Ir,
Im_
LJ..
r_0
),--
ZI..61I---4
l_mm,l.zJ
(._
"r"
Xm,m
_-(__r,,"
z0
x
m,
I'-'-
_,m
,.C
r,..
(--"4
-80-


xl_ ................ .250TEMPERAIURE RATIO -- 2°062MOMENTUM _ATIO .... 57,_32
O_]FICE _L^T£ - II02116
/
V_ 2S
,oux_,,_E /

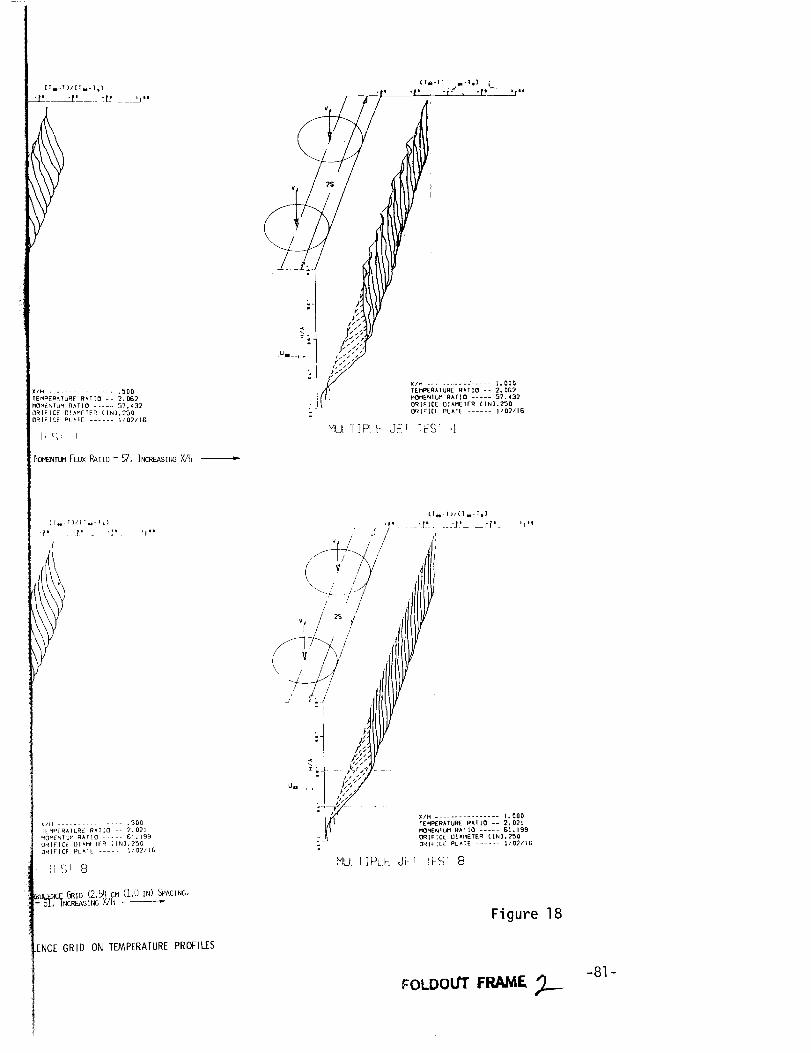
X/H .......... ..... _,000
1EhPERAIURE R_TIO -- 2.062
_0_YENTU_ g^rl0 ..... 57.432
: ORIFICE OIAMETEO fIN],250
: ORIFICE PLATE ...... II0211G
".IU_liP1 _: JF_ ]FS] ,t
2,_ cM (1,UIN)SPACING,NG X/H
GRID ON TEMPERATURE PROFILES
(T n I)I(T,,-T,]
• y "_'.. 'P. "t' ...... "V. 'r"
,, / / ,!!
,,/l[[[1
/ ,,tl
,,,///(IV
o. • ,..;..?
X/H ................ 1.000
TEMPERATURE PATIO -- 2,02l
HOHEN1UH R^TIO ..... G_. 199
ORIFICE OIAI4ETER C|N),250
OR]F:CE PLATE ...... 1/02/IG
MUt iPL.E d_-I _ES] 8
Figure 18
FOLDOUT FRAME, ,_-81 -

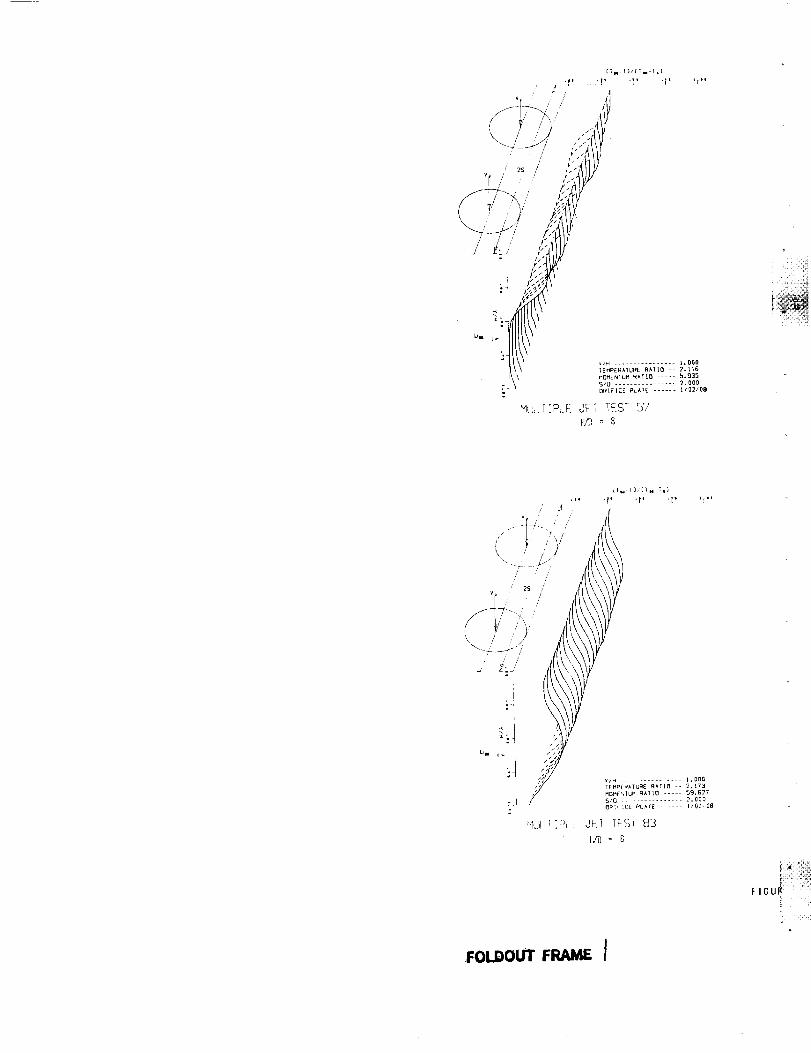
L
u|l g -
I/D =
FI
FOIDOUT FRAME I

P
'i • ° Ir _k
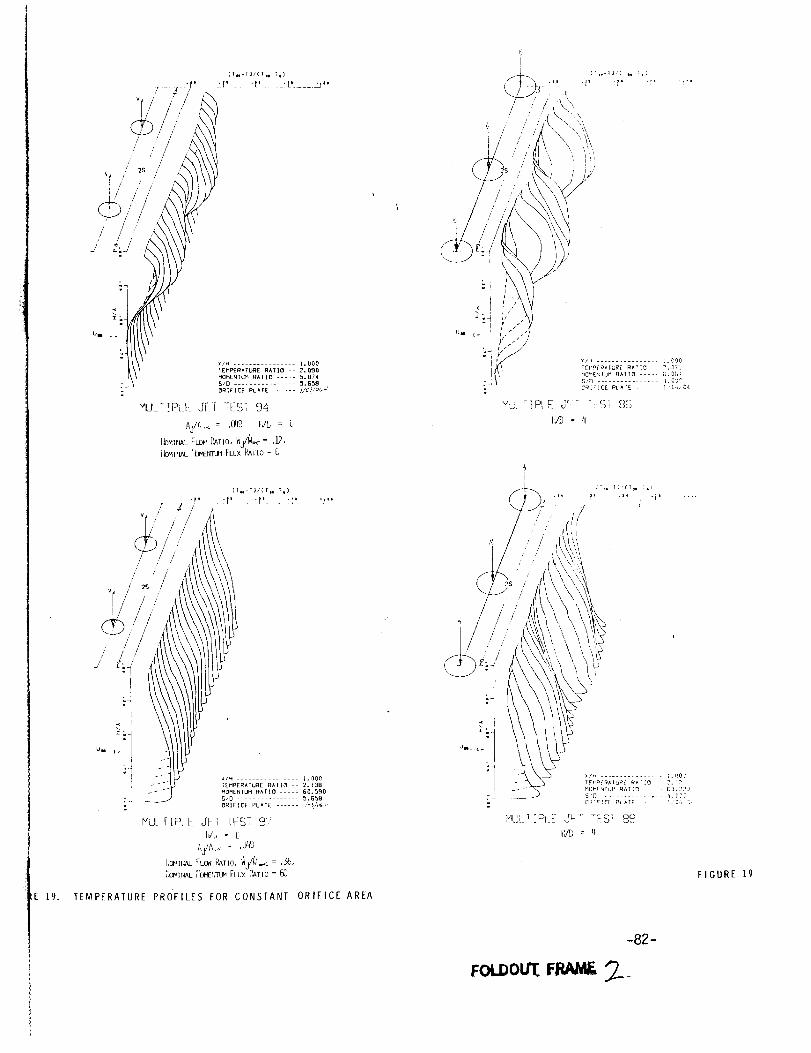
_E 19,
CTu-T)ZCTtrTI)
Um _.
X/H ................ I. O00
_EMPERATL_RE RATIO -- 2,090
_O_EN T_, RATIO ...... 5.074
7 S/D ................ 5.BSB(_;F ICE PLATE ...... /z_/o_-'J
MULTIPLE JET rEST 94
Aj//',__ = ,_9 I_ = 6
Pano, I:Ij/W_ = ,12,[_MlrU_L FLOV_
[DNINALrb_ErlTUMFLUXPATIO= C
I / %.. ",\
l / //I \i/ \,
s 1
TEt_Pf PA IURE RATIO 2.071
M_NE_ITUM F_ IO - g. Og_
:-_J ' g S ........... I, C;_
_, C_!F!CE Pt_rE -- ! t-l,O,i
MUL '_]P_ F ,,.J_7 '-LTS _S
t_ : q
FIGURE 19
-82-
FOLOOU'C

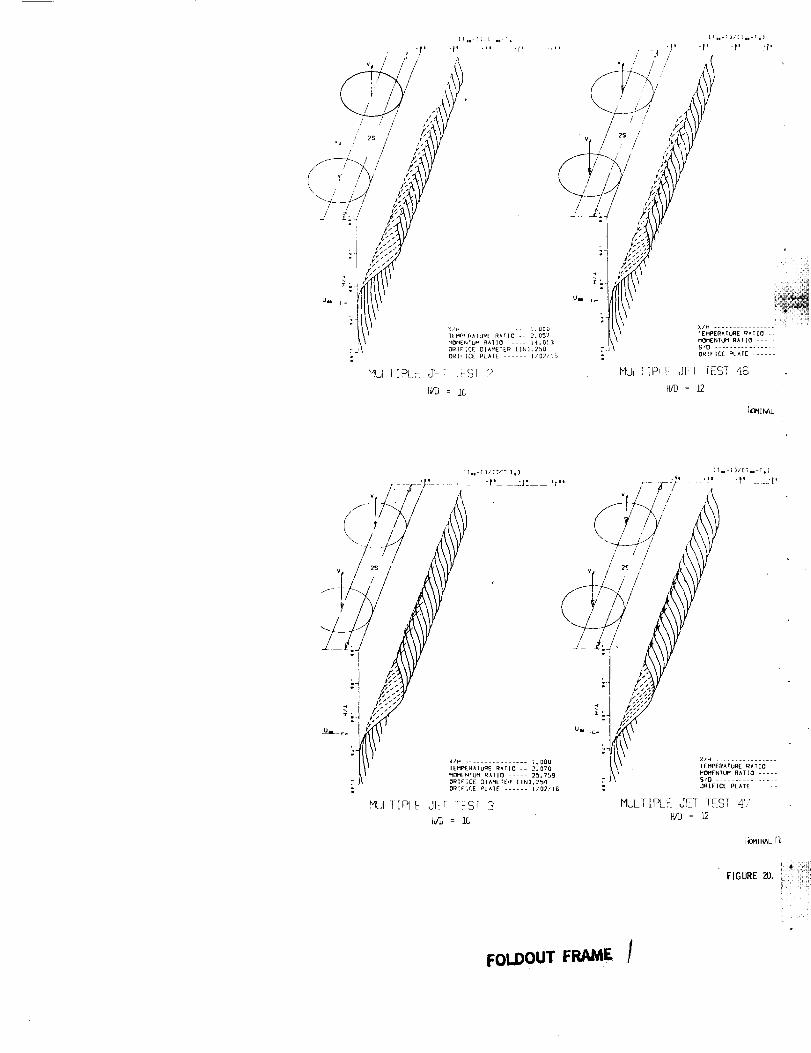
./" i
/°
:7
/
//
2S //
_OMINAL
FOLDOUT FRAME [

"a • I °

. 't It
,000
,It?
3,803
.002
102tl2
IIJ = 8
Um I- I
Ii
MULI_._LE TEl TEST 73
F;/D = 6
!i II
XIH ................ l. OO0
IEHPERATURE RATIO -- 2,137
HOME_T_M RATIO ..... 13.318
SJO ............... _,000
ORIFICE PLATE ...... 1102/04
MULTIPLE JE_ T_ST !0'3
H/l)= 4
MEI,ITU_ FLUX _,ATIO = lq, k/fl: 1,0. Ii:CREA_ING ORIFICE DIAMETER --
/
HOM[NIUH RATIO ..... 26.4_?
StD ................ 1.9_
O_IEICE PLATE ...... it02 OO
_LJi rlP_ Ji I IFST 74
H/D = O
EFFECT OF ORIFICE DIAMETER ON TEMPERATURE PROFILES, CONSTANT SID
°"'!'I
:J
WIH ................ I.OOO
IFEMPERATURE RATIO -- 2,138
MOMEN TUP RATIO ..... 24.612
ORIFICE P'L k TE ...... 1/02/04
l IPLE dE] TEST I04
II/D= 4
FIGURE 20
-83-
FOLDOU'[ FRAACSF.

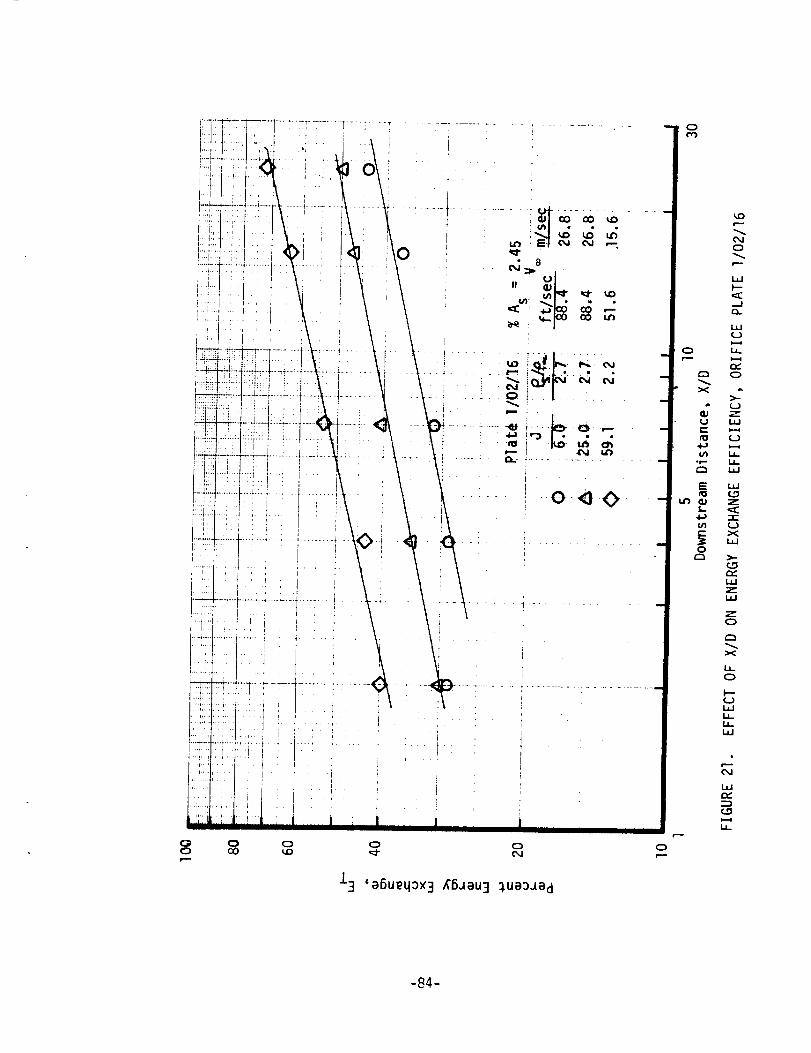
0 o o oco _ _ oJ
13 '_6ueqox3 RBJeu3 _ue_ed
o
0
0
x
r_
r=
ur_
_=,
o
oJo
i..61l'-
r_
i,m
_=_
Lz.I-*=i
o
>;z
(_)m.==_L_L_.t_J
L_J_._Z
-r
ILl
ILlZL_J
L_J
Ld
-84-

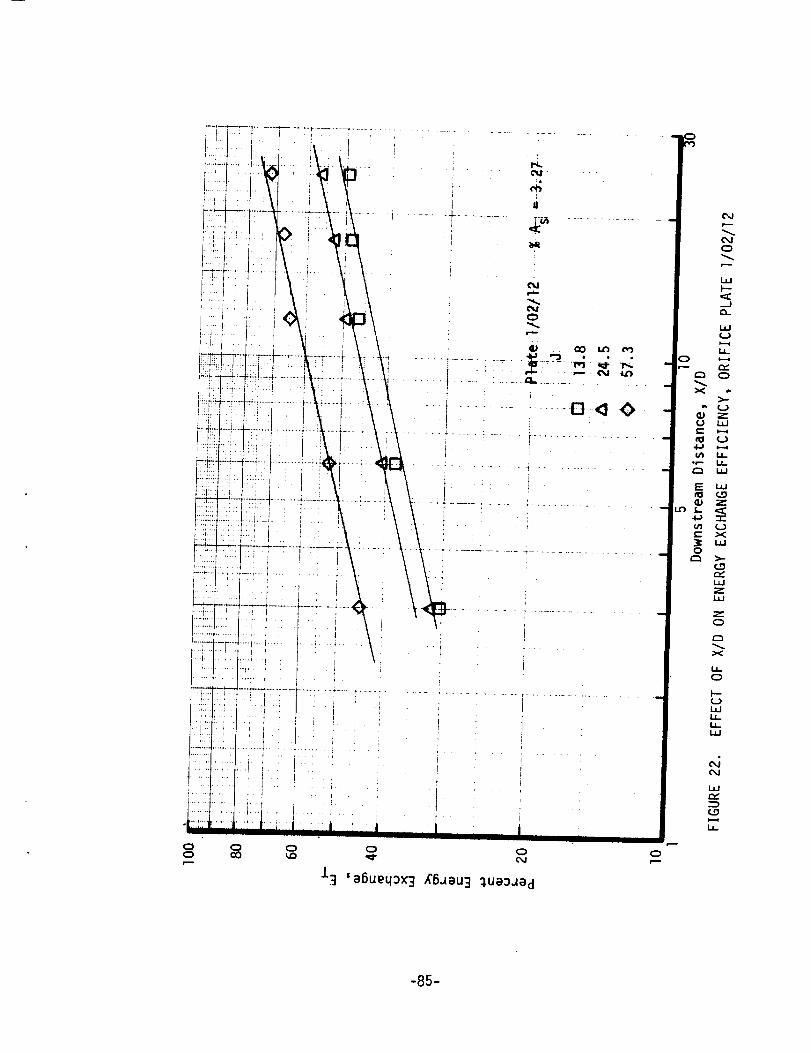
" ................E]-<I0z
I
-85-

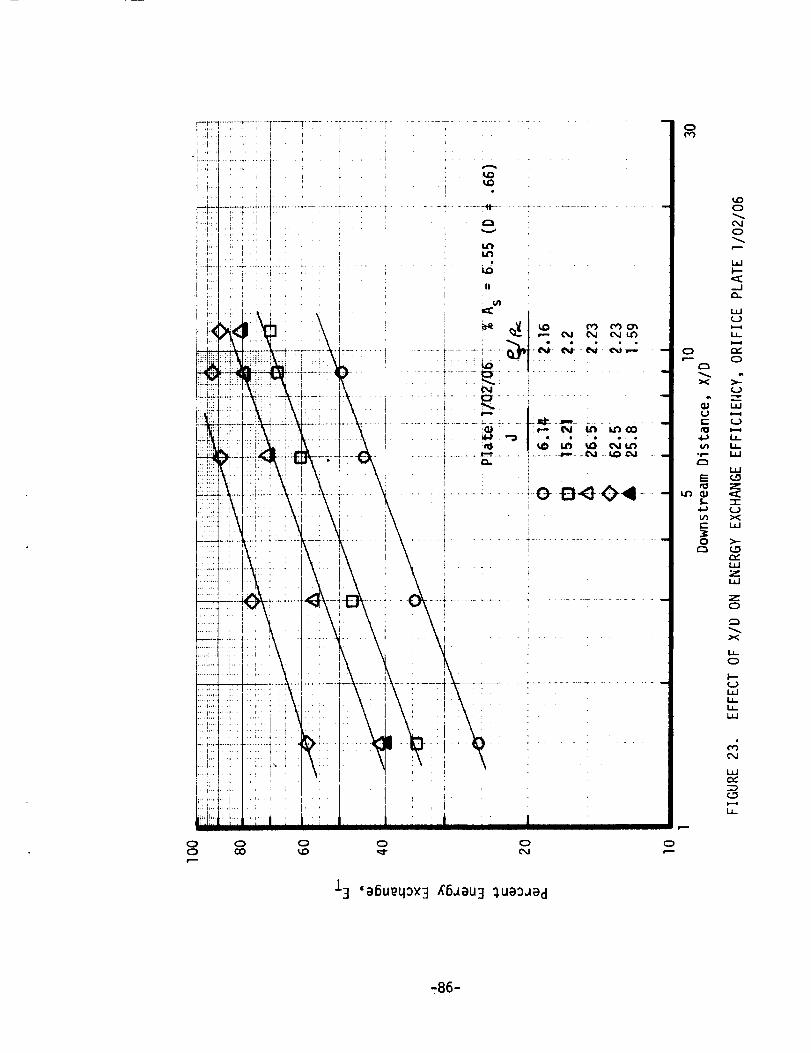
I
o
.................. 0 Et_-0,-4- -
c)
x
(/I
°r--
r_
0J
c-,
o
13 'a6u_q0×3 RBJau3 0,ua0J_d
tO0
0
#,.--
LIJl'--
--JO.
I.m.I
m,--i
m,
r_0
,2
LJ-
-l-
ILl
F'--
,,4
¢Y
I-,,,4
tJ-
,86-

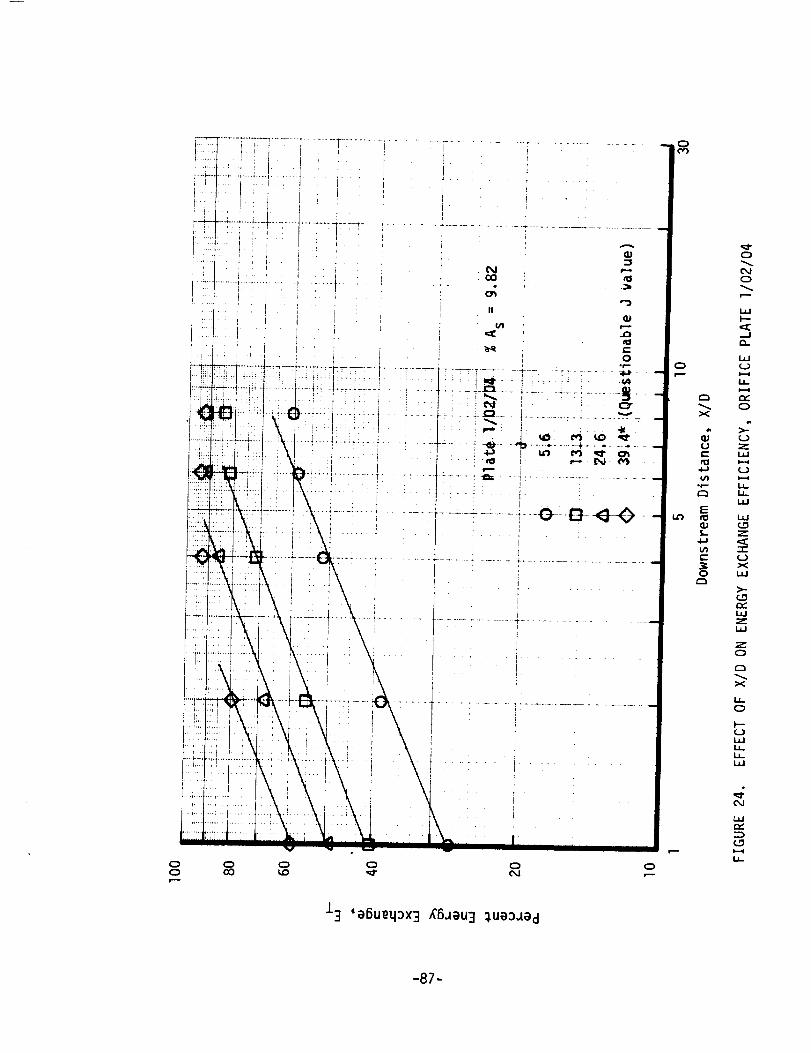
13 ,e6u_q_x-3R6a_u3 _u_0a_d
X
c-"
4.a
°_
r'_
0
0
e-"-
l.a.lI'--
..I
?,..)
i",,."0
Z1.61
¢..)
I=I.,i,m
Z
1,1
o
I---
N
i1
-87-


CT_-T]/CT_T_,) [(_-T_/Clw-'it}
• ° I' J" ' ":'I" _ I' _'Z' _j " _ r' _ _ml L ....... !
XlM ................ 1.000TEMPERATURE RATIO -- 2.033
MOMENIUM RATIO ..... 6.283S/D ................ 4.Q00
ORIFICE PLATE ...... 1/04/08
F_S_MULTIPLE JET - ' 6'7
/
/'/
X/H ................ L.OCOTEMRERAIU_E RATIO --2.01B7
MOMENTUIt RATIC ..... 14.4)2S/D ................ 4.000
ORIFICE PLATE ...... 1/04/0B
MULTIPLE JET TEST 68
ORIFICE PLATE I/OL_, FJS =o5 , _{./l
XlH ................ [.UO0IEMPERAIURE RAIIO -- 7.090
HONENT_K RATIO ...... 5.B74
S/D ................ _,65BOR2FICE PLAIE ...... J/oa/o_
HULT!PLE JET TEST 9,!
Ci._ "),(TN-T.)
'r' "P' "_' ':"
ORIFICEPLATEIYO3/JU_,h/S %5
/FIGURE 25. CO/VIPAR I SON


/
,/2$
t' /
/'
2S /v I / /I
/j
X/H ................ ;.000
TEMPERATURE RATIO -- 2. 067MOMENTUH RATIO ..... 28._22
S/O ................ 4.000ORIFICE PLATE ....... I_04/08
_,O{ TIPLi- JET [FSi 69
= 1,0, Ir,'CRF_ASlr,'Gr'cnEnt_FLuX P_tlo
II=
i
F' P _' .;i,
/)':i /
, rC : ._K P,' _ :t: .i_:}.,..,
v,; ;> j:r
1.0, IIaZREASIUGI'_X_E_JTUt.IFLUXPATIO
OF TEMPERATURE PROFILES AT CONSTANT SIH
/
-j
X/H ............... l. OOO
1EMPERAIURE RATIO -- 2.138
MOMENTUM RATIO ..... 60,590
£/D ................. 5.65B
ORIFICE PLATE ...... _D,.,_,(..,,
MOLTIPL_E JET TEST 97
FIGURE 25
EOLD(W_ FRAME;"2__ -88-

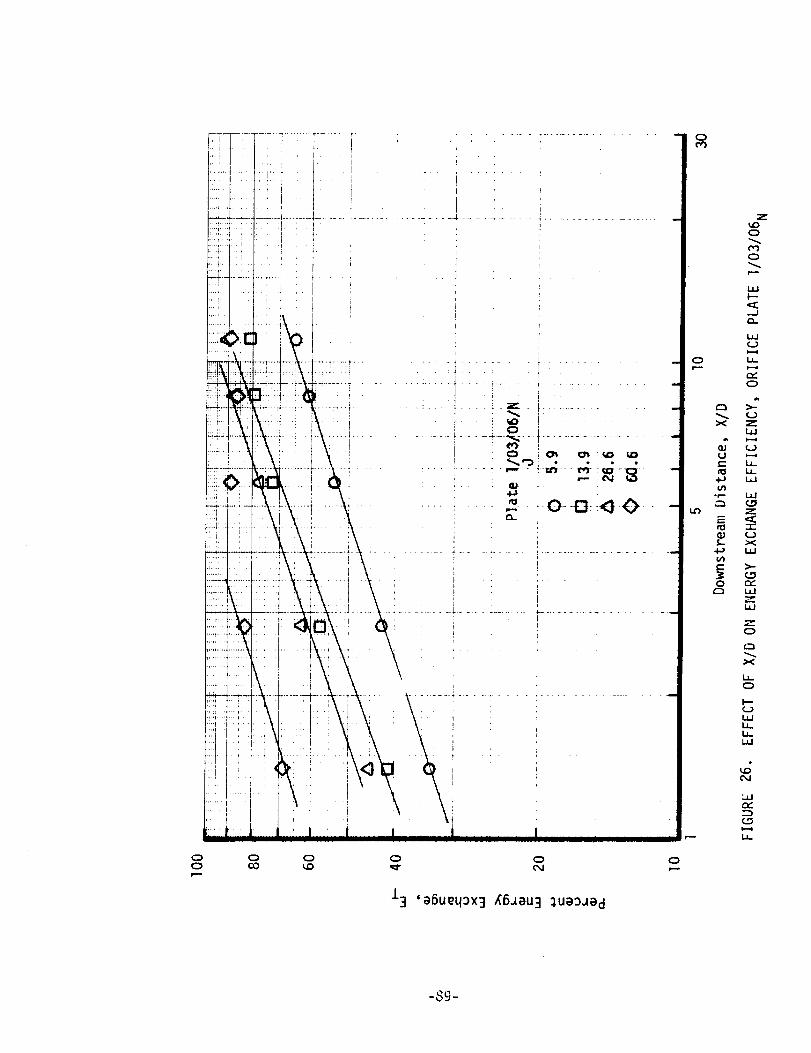
0{=}
13 '_6ueq0x3 R6aau3 _u_aad
0
0
X
U
c-
O
Z_00
0
t--,..
I--
,..._1
0
,2
i,i
"-r"
XLI.I
>.
Z0
X
I.L0
I,--0
It.I.l.I
I.L
-89-

Q
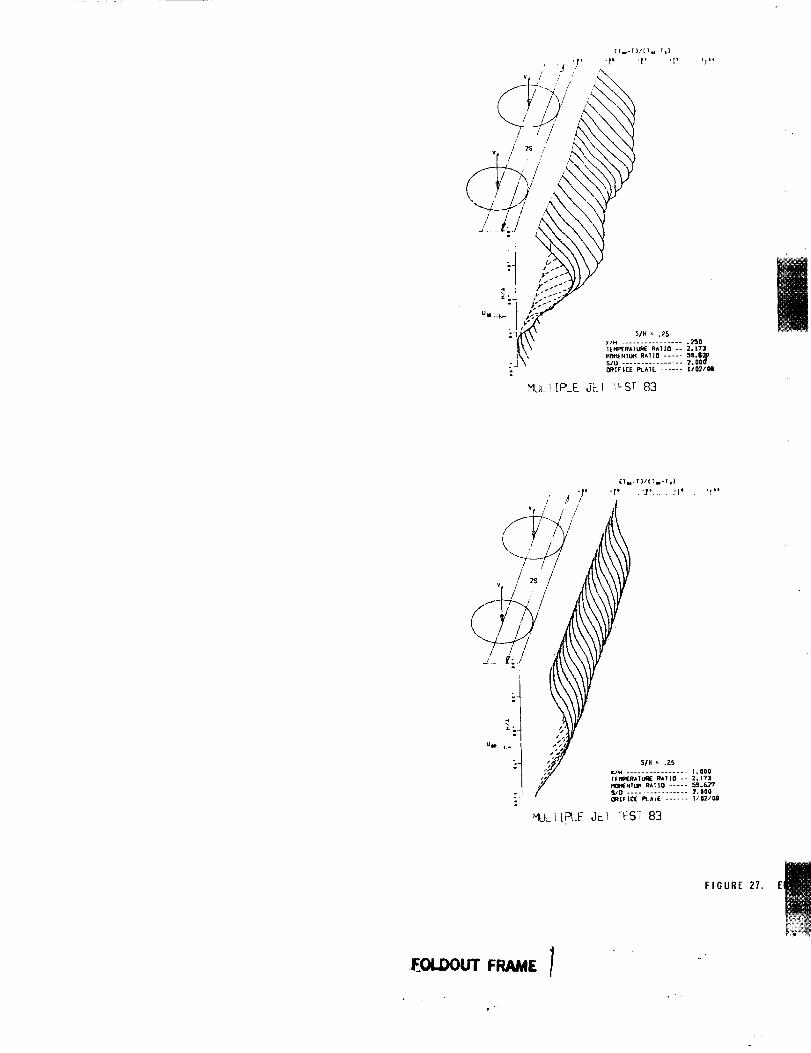
i
"EL TI PLE JE TES[ 83
__OLDOUT FRAME ]
FIGURE
27. E i

t
s

/
/
v ,,;I /
:J
'I"
Temperature Profiles at X/H = .25, ]ncreasJng S/D and S/H
(Tm-T)ICTm-T m)
I10:tEN TUP,I RATIO ..... GO. 020
.. ._ $/0 ................ E. 0gO
•1'_ Of_IF ICF Pt.A T( ...... t / 0G/00
MULTIPLE JET TEST 3"7
/ //
i
/
Temperature Profiles at X/H = 1.0, Increasing S/U and SIH_
OF SPACING ON TEMPERATURE PROFILES FOR J'60,
S/H - .75
X#H ................ l.g00T(_RITUR_ A).T|O -- |.lliJ_,I_OHENTtJN DATIO ..... SO.O_II
SzO ................ G. O00ON'|FICE PLATE ...... |/10_m/00
MITIPLE JET TEST 37
CONSTANT ORIFICE DIAMETER
%-90-
FIGURE 27

J
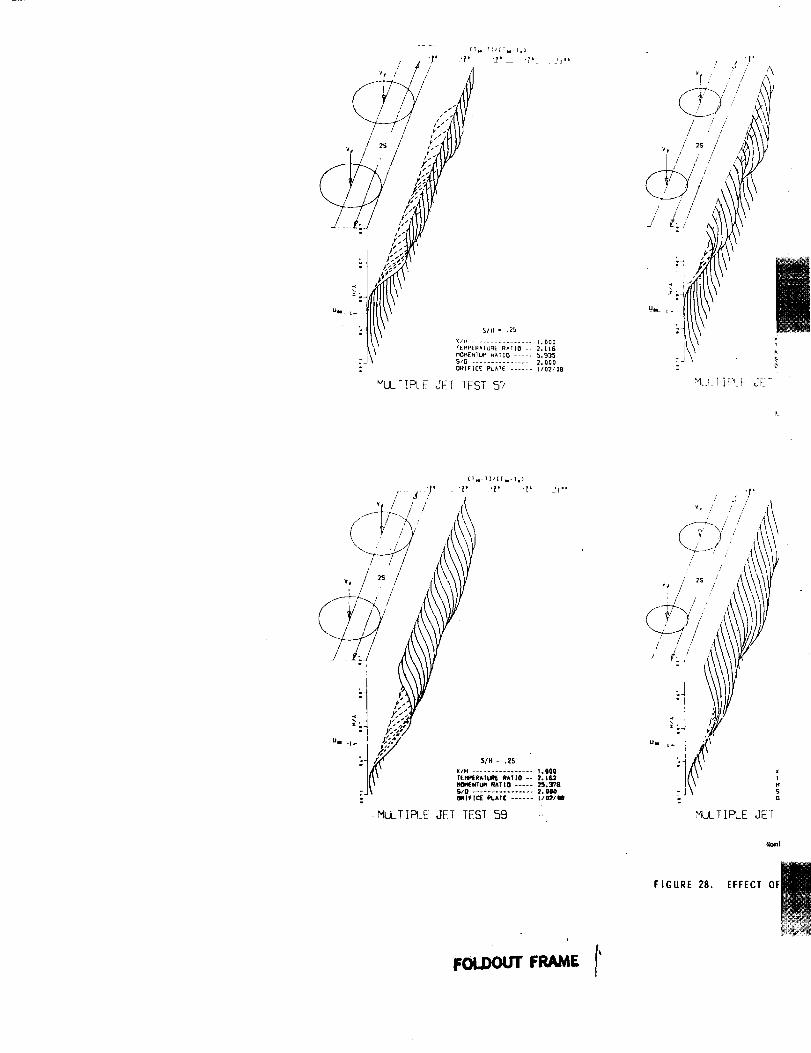
SIH = .25
X/H ............... 1.000
NOMENI'UN _^TIO ..... 5.935S/0 ................ 2.000ORIF|C[ PLATE ...... II02100
HULFIPLE gET IFST 5?
\
UI -I -
S/H = ,25
X/H ................ l. O00TE_RAIURE RATIO -- 2,162BOI'_NTLkM RATIO ..... _._?8S,+,'O ................ 2, 000I_IlFII_E PI,.ATE ...... ll021m
.MLLTIPI_.EJET TEST 59
FOLDOUTFRAME I'
FIGURE 28.
Nomi
EFFECT OF_! 1


Ct,o TJ,CI,, t,) {Iw-t]/Cl_-II) {TI-T}/CT__TI)
/
//
S/H = .375
/H .......... 1.000EhPERATURE NATIO - 2,0B_0_ENTUH RATIO - -- _,6B9/0 ............ 3.0G0
RIFICE PLATE -- 1/03/08
SIH = .50
x/H ................ 1.0O0IEMPERATLIPE RATIQ -- 2.033HOHEN]UH RAI]O ..... 6.283S/O ................ 4.000ORIFICE PLAIE ...... 1/04/08
M,LJLIIP_E JEST TES] 6'7
ominal Homentum Flux Ratio = 6, X/H : 1.0, Increasing S/D and S/H
(lu-T)'CT,_ Ill
!f' '_' 'T'
5/H = .375
_MPER^TUqE RA(IO -- 2.655IME_TIJM RATI0 ..... 2_,71Q'O ................ 3,000tIF ICE PLAIE ...... I/03/08
] h_S; 66
nal Momentum Flux Ratio = Z6, X/H = l.O, Increasing S/D and SIN
/
{I w T)/(T_-T I )
•r' I' :[' tr"
S/H = .SO
WIM ................ 1.000TEHPtERATUR( RATIO -- 2. N7HI_f.NTUH RATIO ..... _.922S."g ................ _.OOO
ORIFICE Pt^TE ...... 1!|4/68 ,
MULTIPLE JET rEST 69
SPACING ON TEMPERATURE PROFILES FOR J'6 AND J-26, CONSTANT ORIFICE DIAMETER
/
S/H = .75
X/M ................ 1.000TEMPER^1L_RE RATIO -- 2.053MOMEN]UM RATIO ..... ?,13IS/O ................ S, O00O_IFICE PLATE ...... t/06/09
MULTIPLE JET TEST 34
$/H = .75
XVH ................ I.OO0TEMPlERA_ RATIO -- 2.100MOI4ENTU_ RATIO ..... Zq_.3K3S/O ................ G, OO0ORIFICE I_.kTE ...... i1_/08
MULTIPLE JET TEST 36
FIGURE 28
-91 -


0
13 'e6ueq0x3 RB_eu3 _ue0_ed
CO0
0
I--
.-Ir_
1.1.1
X _Y
0
g
_ Z
-t-
N _
e_
I-.-
i,n,
-_2-


--o-o<}-0 ---
0 (._ o0 o3 u_
o o
=
o
o
<
0
Z
>,
Z0
o
o
i.-i
--'95-


Vf /r
i s
/ ,
//_i-/
i
MUk
lJi I,INSlOILESSTI_PE_
._.-_.'o ._ _
V;. .- o
=.. .-., :-',
o o .r
, L
%lla
o
%
1.-O/OA_
X/H ................ ,125TEMPERATURE RATIO -- 2,070HOMENIUH RATIO .... 25.759_RIFICE 01AMETER C|N),250ORIFICE PLATE ...... 1/02/IG
MOt ]!PL_ JHF TES_ 3
CIRCULAR ORIFICE
FOLDOUT. FRAME
I]II,._ENSIONLESS TE]'IF'ERATURE C,(I
FIGURE 31. EFFECT

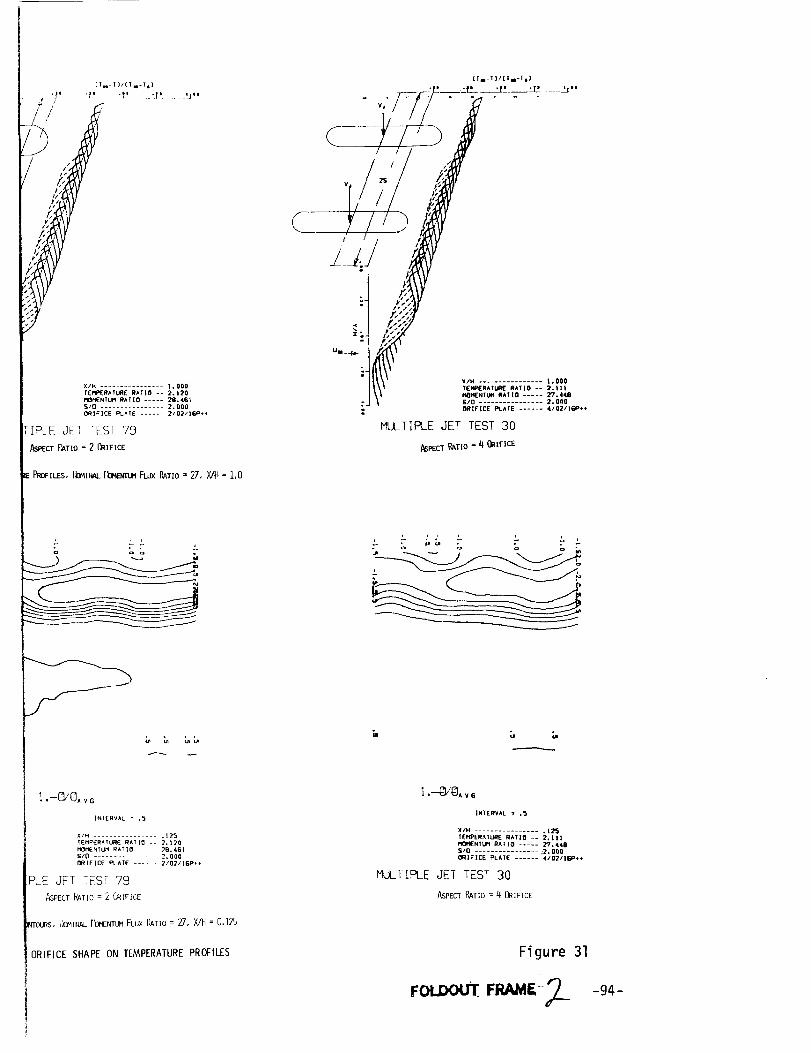
t ///
[T_-I)/CTm-Tel
.p ._, .p . ._"
X/H ................ 1.000TEMPERATURE RATIO -- 2.120MOMENTUM RAtiO ..... 28.4Gtg/O ................ 2.000
(_I_ICE _ATE ...... 2/02/IGP*,
IPLE J_ TES[ '79
ASPECT RATIO = 2 ORIFICE
PROFILES,IlOMINALf_O_IgfiIJMFLuxRATIO= 27, X/H = 1.0
C
MLLT IPLE
W/H ................ 1.000
TEMI_ERAILRE RAIIO -- 2.111I'_IMENTUM RATIO ..... 2"/.448SlO ................ 2.000ORIF ICE PLATE ...... 4/02/IGP**
JET TEST 30
ASPECT PATIO = LI ORIFICE
L L• - L
. L " .' " " L -_'' 3 o ;,,
f6 t. 1,
1.-O/O^_o
IN]ERVAL = ,5
XIH ................ .125TEMPERATURE RATIO -- 2,120MOMENTUM RATIO ..... _.4G|
5/0 ................ 2,000ORIFICE PLATE ..... 2/02/16P*+
PLE JFT TFST r79
ASPECT RATIO = 2 ORIFICE
mOURS. I_INAL rDMENTUM FLUX P_TlO = 2,7. X/H = 0,125
ORIFICE SHAPE ON TEMPERATURE PROFILES
1.-EVO v̂G
INTERVAL = ,_
XIH ................ .l_:_TENPERATURE RATIO -- 2,111MONENTUM RATIO ..... 27.448SIO ................ 2.000_]FIEE PLATE ...... 4102/IBP++
MULTIPLE JET TEST 30
ASPECTRATIO= 4 ORIFICE
Figure 31
FOU)OU .FRAme;-2_- -94-


/
//
X/H ................ I. 000
TEMPERAIURE RAT[0 -- 2.084
_Ot",E N; UM R^]I0 ..... E,. 038
S/O ................ 4.00C
ORIFICE PLATE ...... { / 04/0(]0
MULTIPLE JET TEST 90
DOUBLEOeIFlCEro_
/
/].
/
"IULT__P',EJEl _S; 93
ORLFICE
,,OLDOUT FitAII_ I
(1.
'T' 'I'
i
/ /
/
_ J S/D - -O_IF12_
SIf,_LE ORIFICE _0 f
A = i/2 g OF DOL_
FIGUR

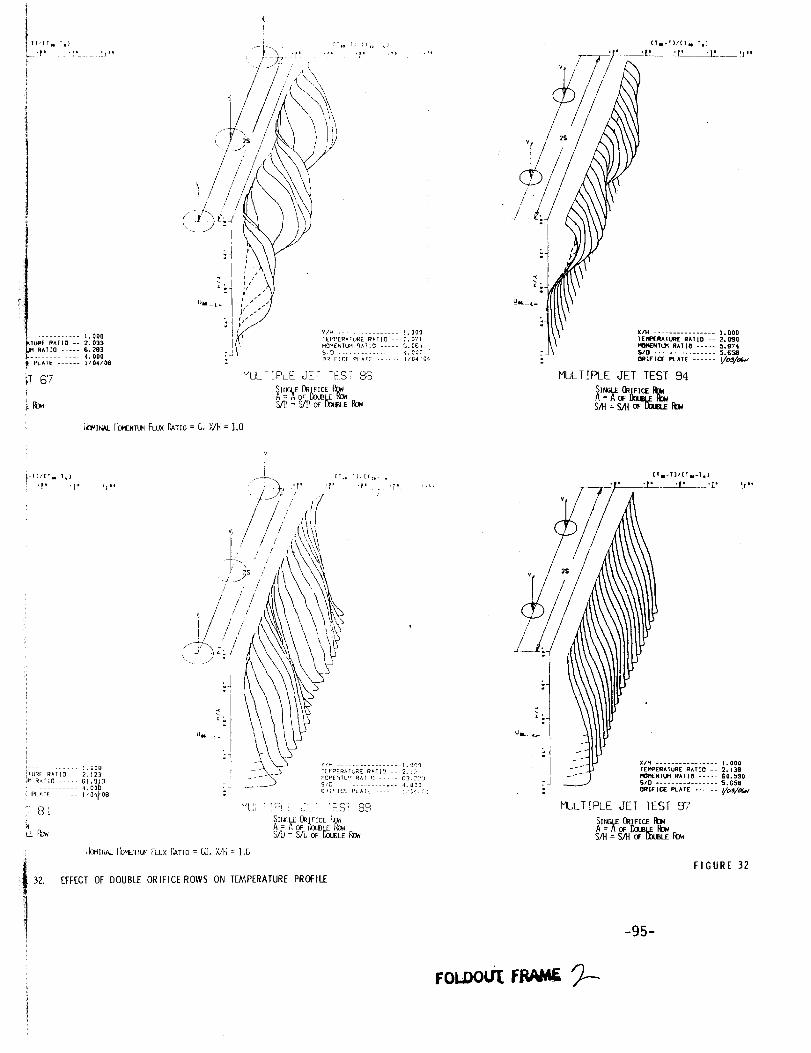
T)/[T_-T,}
}
ii
............. 1.000
TUR[ RATIO -- 2,033RATIO .... G.283
............ 4.000
PLATE ..... |10410B
P 67
i ib'_l__[OMENru_IFLUXPATIO: C,X/H= 1,0
-XI/CT_-l,)
't' '(' f;"
......... ' 000
6l .9 3
: PI.I_E --- _t04_OB
LE Fbw
1
_l(_lr,L,__ I'C_EUTUK FLUX P_ATIO = _, _/H : l,G
EFFECT OF DOUBLE ORIFICE ROWS ON TEMPERATURE PROFILE
X/H ................ 1.000TEI"_'ERkTVRE RATIO -- 2.t38MOe'IENIUM RATIO ..... 60,590S/O ................ _.G58
ORIFICE PRATE ...... _o_/_
MULTIPLE JET TEST 97
SINGLEORIFICEI_WA = A OF COUBI.ERo_S/B=SAT oF LbUBLEROW
FIGURE 32
-95-
FOC O

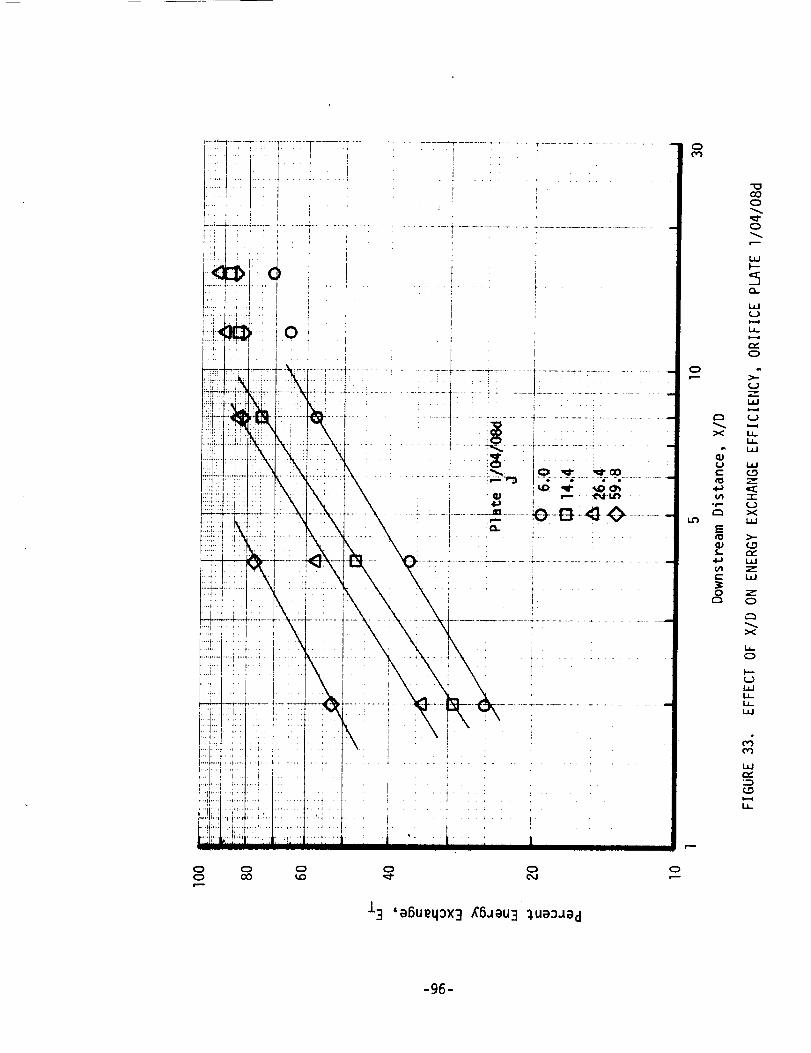
!_ii I _I ....
.... t.+.
"T
t rt:--:
_11!!!?
i: 11
!ii21
,,. ....
,i.,
i .... I
:-:?1.m-i
_-:--T .......I....... T ...... _,........... r--_t ..... -:- .......................
I
O
.._.... " I ........ !
00i,m
00 0 0 0
13 'a6ue4ox3 R6aeu3 %ueoaed
CO0
0
I--
,-.Ia,.
0
Xm,
U _
E
5- r_
I,--
,-4
-g6-


Mixed Orifice Size
:J
HUL _!P__
Single Or
A = A Mi_
SIH : Sl_
Nominal Momentt
,/ //
_OU_ f_ IFIGURE34.
7- il
HUL T I
Single
A = A
SfH =
Nominal Mome
EFFECT OF MIXE[

i
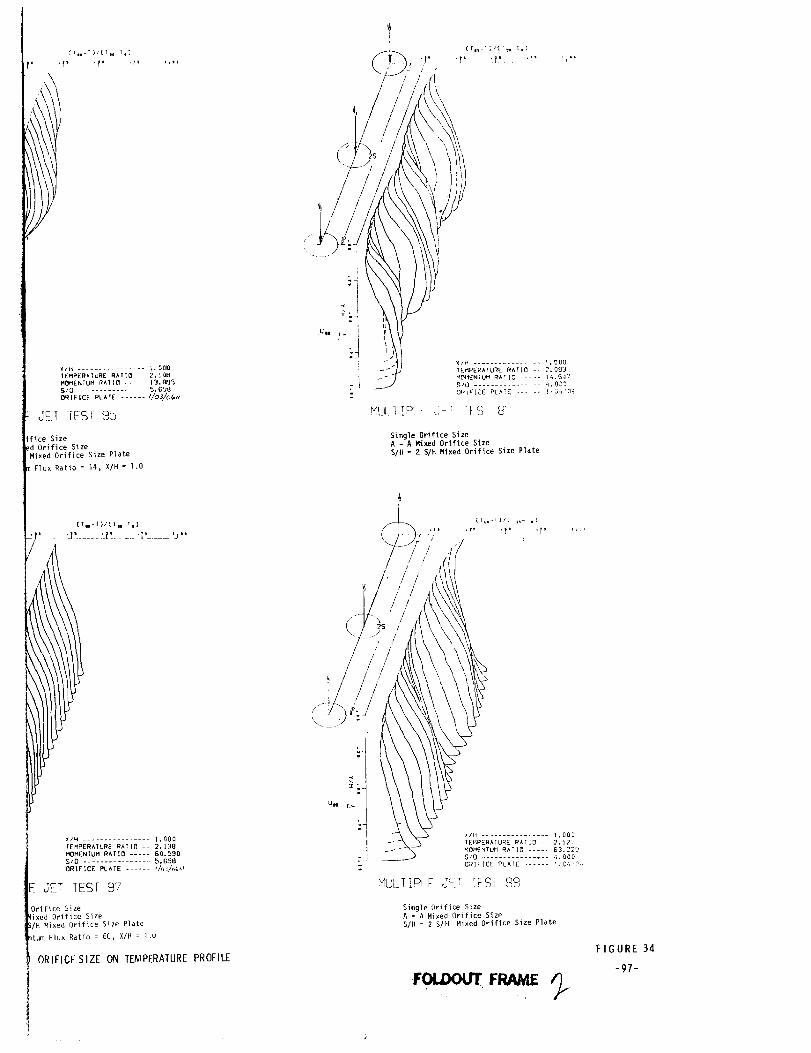
X/H ................. I.DO_TEMPEPATUR[ PAIIO -- P, JOBMOMENTUM _ATIO ..... 13.B FJ5
$/0 ............... 5.6b_
ORIFICE PLATE ...... //O3/OG_
dE I iESI 95
fice ;ize
id Orifice iize
Mixed Orifice Size Plate
Flux Ratio = 14, X/H = l.O
TEMPERAIURE PATIO -- 2.]3B
MOMENTUM PATIO ..... 60._90SID ................. _.GSB
ORIFICE PLATE ...... I/GJ_G,_
JET TEST 9__
Orifice Size
4ixed Orifice Size
_/H Mixed Orifice Size Plate
_tum Flux Ratio = 60, X/H - 1.0
ORIFICESIZE ON TEMPERATUREPROFILE
:I
r'4Ut.'lIF>',i ,.!L: '_o,c" 8'
Single Orifice SizeA = A Mixed Orifice Size
$/H = 2 S/H Mixed Orifice Size Plate
// //
Single Orifice SizeA = A Mixed Orifice Size
S/H = 2 S/H Mixed Orifice Size Plate
FOUX)u'r.
FIGURE 34
-97-


i
o 0 o o o
'alSueq_x3 _'6aau3 _.ua_aad
o
0
o
_o0
_"-
.J
.c_ D_
_-_ r_c_ o
× ,2
-r- I_
N .-
i,
I--
1.1_
_4
-98-


I3 'e6ue4_x3 R6Jeu3 _ue_Jed
iI.
0
0
o
1.61I----
._.I
'-_ 0
x _,-t.b
,,, ZI.mJ
Lz_I..L
Z
I.- '-r
u'_ X
N'-e_
o
x
0
I--
e_
M
-gg-

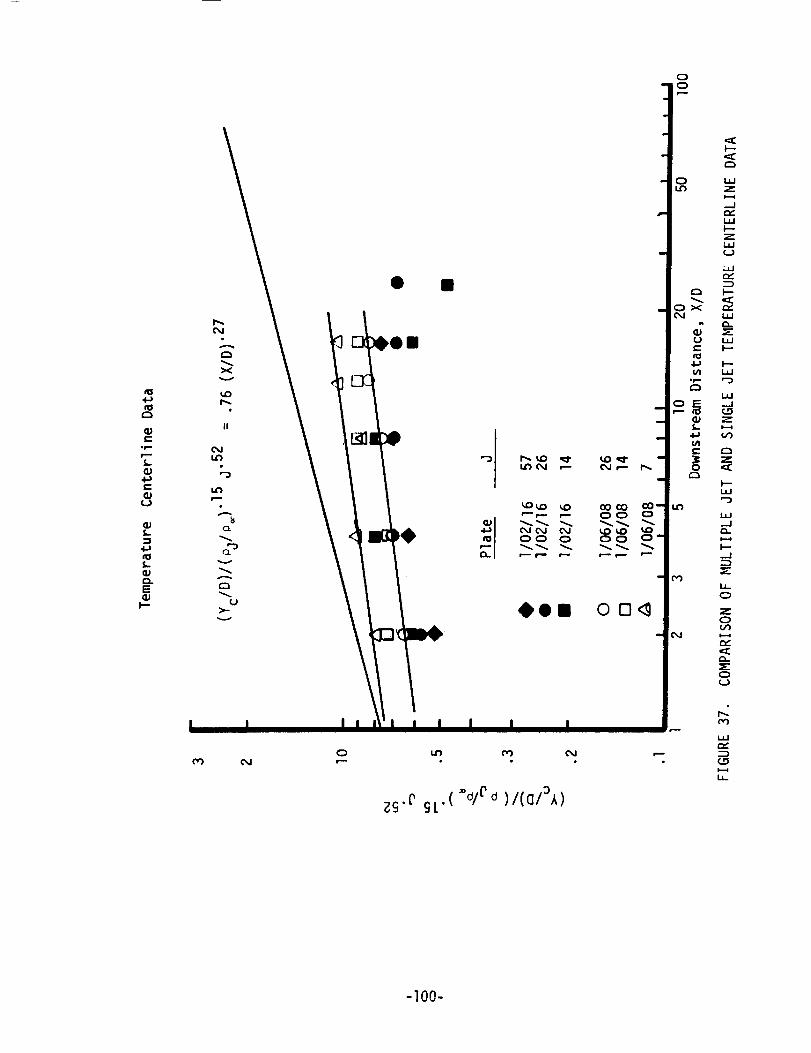
e-
L
0,.E
o0f---
_S" _L.( %/rd )/(a/_A)
-100-

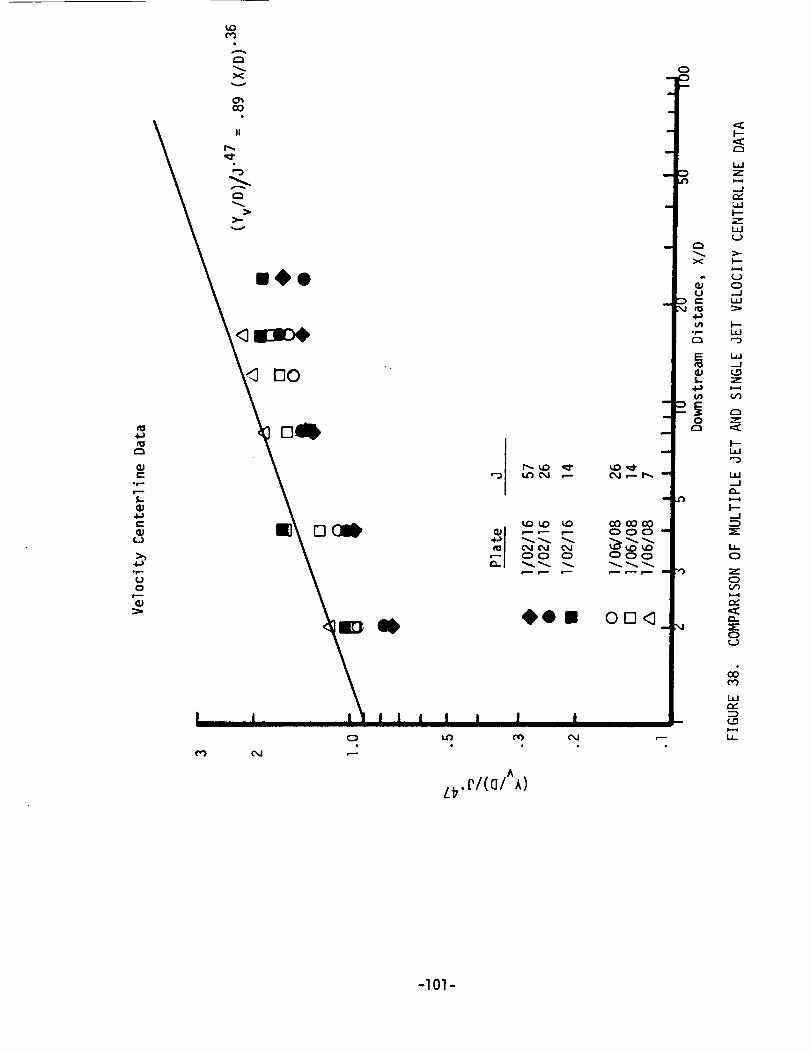
c_
-101-

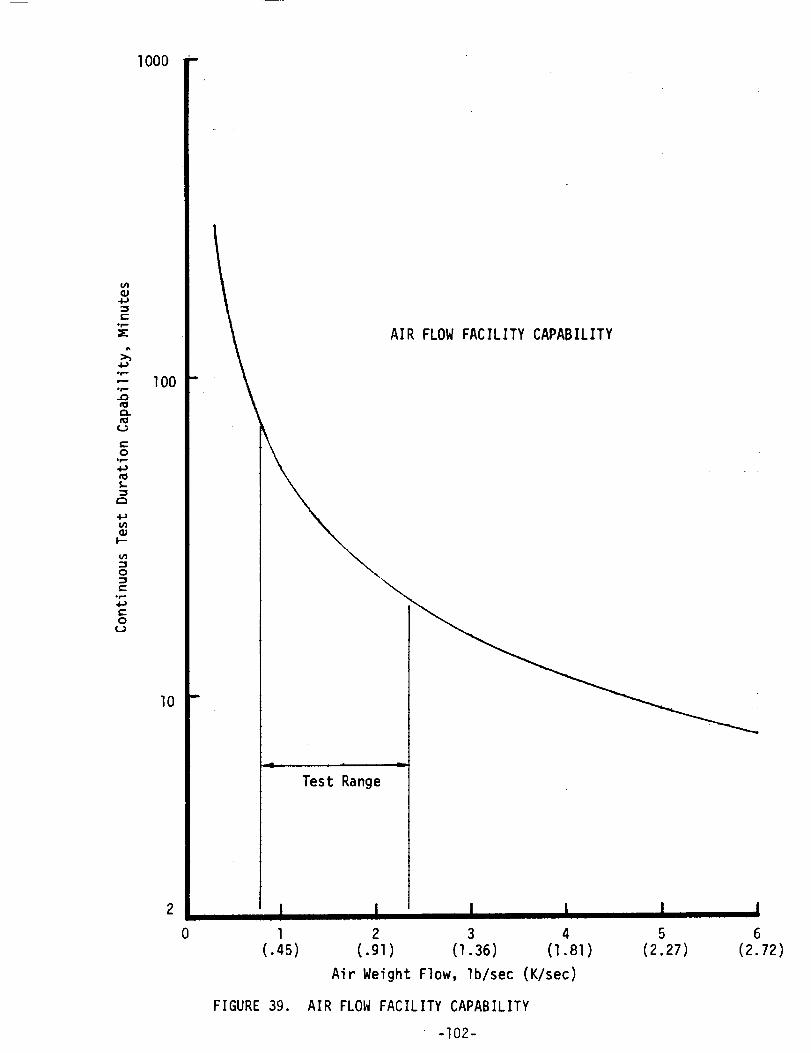
1000 -
.s--
p--
.p,-
e_
c-O
L
tlt
b=-
o'I
0::3
.r.=
0i.)
100
lO
1(.45)
FIGURE 39.
AIR FLOW FACILITY CAPABILITY
Test Range
I I I I I2 3 4 5 6
(.gl) (1.36) (l.81) (2.27) (2.72)
Air Weight Flow, Ib/sec (K/sec)
AIR FLOW FACILITY CAPABILITY
-I02-

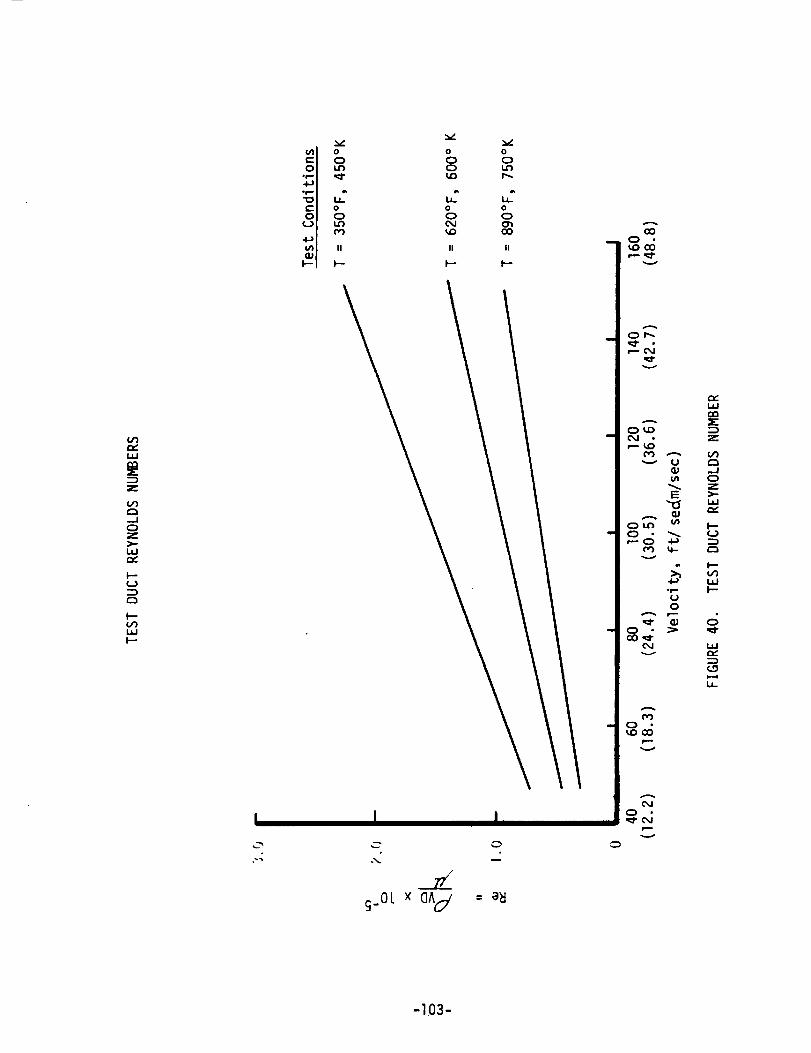
rv,i.u
z
,._Joz>-w
i--o
c_
I--
ladI---
I
.%.
s.OL x C]A_
II
c_
= el_
cO0
v
A
c:_ t'.,.
r,--
V
A
(v_ A"-." U
QJ(,n
E
GJ
4-}
v
(.J0
aJ
A
V
c_
j....v
I,a,Jnn:E:
..JC_Z>,-I.I,J
I--(..)
I--
ladI--
0
W
LI,.
-103-


F--(J
C_
F--V1i,iI--
p-Zi,i=Eo..0._1u.I z
C3la..l ,-4C:_ l--
n,," (.3U..I r',, 0
'=C "=:
I,,,,,,I
>_ r,,'n,,,
r'_Z
0(:0
II II
4-)U
U,-C_0
¢1m_
0e- e:_
c-c-.- 4,a
• r-- _"
_-I_
_..o
¢..)
4(cO
cn
c-
¢J°p.
e-l--
U
p-
tn°r..
c_
c_...c
_- 0r-
I-- c_--1-
A
OOe--
EU
v
.I--
o• 0
v U
.1-)E
Cn(30 S.-
O
i._ e-v 0
4,-o
E0t_
_ Um e-
U
Z0
0_J
F-
z
I--z
Z
0__11.1.1
I..iJr_
n_hi
..--I
>--C_
N
p-
I---m
e_
LI-
"_" O 0'I_..0 (Mr-.- ,-.-kr), • I".,, * l..ir) • o.,.I
i,-,-,
'u_ 'ssau)t:)_qJ. JaA'el A'jepuno_]
c)
c:)
-I04-

A A
DISTRIBUTION LIST FOR NASA CR-121217, Multiple Jet Study
NASA Scientific and Technical Information Facility
P. O. Box 33
College Park, MD 20740
Attn: Acquisitions Branch
NASA - Lewis Research Center
21000 Brookpark Road
Cleveland, OH 44135
Attn: Library
Technology Utilization
Report Control Office
Patent Counsel
Director of Aeronautics
Chief, Fluid Systems
Components Division
Chief, V/STOL and Noise
Divislon
Chief, Wind Tunnel and
Flight Divis ion
Chief, Airbreathing EnginesDivis ion
Chief, Physical Science
Division
Head, Contract Section A,
Technology Procurement Br.AAMRDL
W. T. Olson
J. F. Dugan, Jr.
R. A. Rudey
R. E. Jones
J. S. Grobman
D. J. Poferl
J. E. Rohde
R. W. Graham
R. Siegel
W. H. Braun
C. J. Marek
C. T. Norgren
H. F. Butze
F. M. Humenik
J. A. Albers
J. D. Holdeman
MS 60-3
MS 3-19
MS 5-5
MS 500-311
MS 3-3
MS 5-3
MS 501-5
MS 86-1
MS 60-4
MS 301-1
MS 500-206
MS 500-317
MS 3-16
MS 86-1
MS 60-6
MS 60-6
MS 60-6
MS 77-2
MS 77-2
MS 301-1
MS 301-1
MS 301-1
MS 60-4
MS 60-6
MS 60-6
MS 60-6
MS 501-4
MS 60-6
I0
1
I
11
1
I
1
i
i
1
1
I
i
1
1
1
I
1
I
I
1
45

A A
DISTRIBUTION LEST - NASA CR-121217 cont'd.
NASA Headquarters
600 Independence Ave., S.W.
Washington, D. C. 20546
Attn: N. F. Rekos (RAP)
Dr. W. H. Roudebush (RL)
J. Suddreth (RL)
NASA Langley Research Center
Langley Station
Hampton, VA 23365
Attn: Library
Dr. D. M. Bushnell
Dr. R. S. Levine
NASA Flight Research Center
P. O. Box 273
Edwards, CA 93523
Attn: J. Nugent, Code R
Jet Propulsion Laboratory
4800 Oak Grove Drive
Pasadena, CA 91103
Attn: Dr. James King, MS 183-401
NASA Ames Research Center
Moffett Field, CA 94035
Attn: Dr. I. G. Poppoff, MS 254-1
Library
Department of Transportation
400 7th Street, SW
Washington, D. C. 20590
Attn: Dr. R. Underwood, Code TST
FAA Headquarters
800 Independence Ave., S.W.
Washington, D. C. 20533
Attn: W. T. Westfield
Library
DOT Transportation Systems Center
55 Boradway
Cambridge, _ 02142
Attn: A. Broderick (TI)
1
1
*I

DISTRIBUTION LIST - NASA CR-121217 cont'd.
Environmental Protection Agency
Research Triangle Park
Raleigh, NC 27711
Attn: E. E. Berka_
D. G. Lachapelle
D. PershingJ. Wasser
Environmental Protection Agency
Advanced Automotive Power Systems Division
Ann Arbor, _ 48105
Attn: T. Sebestyen
Dr. W. Mirsky
United States Air Force
Aero Propulsion Laboratory
Area B, Bldg. 18D
Wrlght-Patterson A.F.B.
Dayton, OH 45433
Attn: R. E. Henderson AFAPL/TBC
Capt. W. Blazowski AFAPL/SFF
K. Hach
Air Force Office of Scientific Research
1400 Wilson Boulevard
Arlington, Virginia 22209Attn: SREP
Department of the Army
U. S. Army Aviation Material Laboratory
Propulsion Division (SAUFE-PP)
Ft. Eustis, VA 23604
Attn: E. T. Johnson
Robert G. Dodd, SAVDL-EU-PP
Michigan State University
Department of Mechanical Engineering
201 Engineering Building
East Lansing, _ 48823
Attn: Professor J. F. Foss
Case Western Rese_Je University
Division of Fluid, Thermal, and Aerospace Sciences
Glennan Building
Cleveland, OH 44]06
Attn: Professor Isaac Greber
Dr. Y. Kamotani
I
I
i
I
1
"°

DISTRIBUTION LIST - NASA CR-121217 cont'd. 4
Bell Aerospace Company
Advanced Technology Research
P. O. Box 1
Buffalo, NY 14240
Attn: Dr. S. W. Zelazny
Northern Research and Engineering Corp.219 Vassar Street
Cambridge, MA 02139
Attn: Dr. E. R. Norster
Dr. D. M. Dix
General Electric Company
Flight Propulsion Division
Cincinnati, OH 45215
Attn: Technical Info. Center N-32
D. Bahr
Detroit Diesel Allison Division
Department 8894, Plant 8
F. O. Box 894
Indianapolis, Indiana 46206
Attn: Dr. H. J. Brandon
Library
General Applied Science Labs
Merrlck and Stewart Avenues
Westbury, Long Island, NY 11590
Attn: Dr. R. Edelman
Fluidyne Engineering Corporation
5900 Olson Memorial Highway
Minneapolis, Minnesota55422Attn: O. P. Lamb
AIResearch Manufacturing Company of Arizona
Division of the Garrett Corporation
402 South 36th Street
Phoenix, Arizona 85034
Attn: J. M. Haasis
Massachusetts Institute of Technology
Department of Mechanical Engineering
Cambridge, MA 02139
Attn: Professor J. A. FayProfessor J. B. Heywood
1
1
-Q

DISTRIBUTION LIST - NASA CR-121217 cont'd. 5
Advanced Technology Laboratory
400 Jericho Turnpike
Jericho, NY 11753
Attn: Dr. A. Ferri
Virginia Polytechnic Institute
and State University
Department of Aerospace Engineering
Blacksburg, VA 24061
Attn: Professor J. A. Shetz
Arnold Engineering Development Center
J. Division, Engine Test Facility
Arnold Air Force Station, Tenn. 37389
Attn: Dr. C. E. Peters
Dr. P. T. Harsha
D. W. Male
The University of Tennessee Space InstitUte
Tullahoma, Tennessee 37388
Attn: Professor G. W. Braun
Georgia Institute of Technology
School of Aerospace Engineering
Atlanta, Georgia 30332
Attn: Professor L. H. Bangert
Washington State University
College of Engineering Research Divlslon
Pullman, Washington 99163
Attn: Dr. C. T. Crowe
Surface Combustion Division
Midland-Ross Corporation
2375 Dorr Street
Toledo, OH 43691
Attn: Dr. Klaus H. Hemsath
University of Minnesota
Mechanical Engineering Department
Minneapolis, Minnesota 55455
Attn: Professor R. J. Goldstein
Purdue University
School of Hechanical Engineering
West Lafayette, Indiana
Attn: Professor V. W. Goldschmldt I
A
DISTRIBUTION LIST - NASA CR-121217 cont'd
Polytechnic Institute of Brooklyn
Department of Aerospace Engineering
and Applied Mechanics
Long Island Graduate Center
Route ii0, Farmingdale, NY 11735
Attn: Professor P. M. Sforza
Lockheed Missile and Space Company
Palo Alto Research Laborator_T
3251 Hanover Street
Palo Alto, CA 94304
Attn: Dr. R. J. Conti
Solar Division
International Harvester Company
2200 Pacific Highway
San Diego, CA 92138
Attn: W. Compton
General Motors Research Laboratories
12 Mile and Mound Roads
Warren, MI 48090
Attn: W. Cornelius
University of Illinois at Urbana - Champaign
Department of Aeronautical and Astronautical Engineering
Urbana, Illinois 61801
Attn: Professor R. A. Strehlow
University of California at Berkeley
Department of Mechanical Engineering
Berkeley, CA 94720
Attn: Professor R. F. Sawyer
Northwestern University
Department of Mechanical Engineering
Evanston, Illinois 60201
Attn: Professor A. A. Kovitz
United Aircraft Corporation
400 Main Street
East Hartford, Connecticut 06108
Attn: R. L. O'Brien(UARL)
L. S. Cohen (UARL)
Library (UARL)
R. Marshall (P&WA)
l
l
l
I
l
l
llll
" "g

DISTRIBUTION LIST - NASA CR-121217 cont'd.
Pratt and Whitney Aircraft
Florida Research and Development CenterBox 2691
West Palm Beach, Florida 33402
Attn: G. B. Cox, Jr.
D. J. Nielsen
AVCO Lycoming Division
550 South Maln Street
Stratford, Conn. 06497
Attn: D. Eckber
"o