multiple measures in placement recommendations: an
TRANSCRIPT

DOCUMENT RESUME
ED 381 186 JC 950 160
AUTHOR Lewallen, Willard ClarkTITLE Multiple Measures in Placement Recommendations: An
Examination of Variables Related to CourseSuccess.
INSTITUTION Antelope Valley Coll., Lancaster, Calif.EUB DATE 29 Sep 94NOTE 40p.
PUB TYPE Reports Research/Technical (143)Tests /Evaluation Instruments (160)
EDRS PRICE MF01/PCO2 Plus Postage.DESCRIPTORS Community Colleges; *Educational Background; *Grades
(Scholastic); Multivariate Analysis; *PredictorVariables; *Student Placement; Two Year Colleges; TwoYear College Students
IDENTIFIERS Antelope Valley College CA
ABSTRACTA study was conducted at Antelope Valley College in
California to explore the use of multiple measures in placementrecommendations by examining variables potentially associated withsuccess in writing, reading, and math courses. The study sample wasall students who were assessed and enrolled in reading and writingcourses in fall 1990, spring 1991, fall 1992, and spring 1993; andstudents enrolled in math courses in fall 1993 and spring 1994.Variables examined for their relationship with course success wereage, high school grade point average (GPA), high school completionstatus, recency of formal schooling, years of high school English,grade in last English and math classes, highest 'evel math classcompleted, recency of last math class, units planned and work hoursplanned. Chi-square analyses indicated that: (1) for writing courses,grade in last English class, units planned, and recency of schoolingwere strongly associated with success; (2) for reading courses, yearsof high school English, work hours planned, and recency of schoolingwere strongly associated with success; and (3) for math courses,success was strongly associated with high school grade point average,highest math class completed, grade in last math class, unitsplanned, and recency of schooling. A number of cases were examined tomeasure thL impact of multiple measures on placement recommendations,revealing that the majority of impact from this weighting falls onborderline scores. Though multiple measures are applied at the frontend of the process, placement recommendations can be appealed throughthe prerequisite challenge process. (KP)
***********************************************************************
Reproductions supplied by EDRS are the best that can be madefrom 0-1 original document.
*******************************************************************

a
U.S. DEPARTMENT OF EDUCATIONOffice of Educational Research and improvement
EOUCATIONAL RESOURCES INFORMATIONCENTER (ERIC,
ihis document has been reproduced asecived from the person or organization
originating it0 Minor changes have been made to improve
(production Quality
Pointe or view Ce Ogentone Staled at INS dOCu.rnent do not neCeSSardy represent °theta!OERI posetton or potty
MATERIAL TO REPRODUCETHISHAS BEEN GRANTED
BYW. Lewallen
TO THE EDUCATIONALRESOURCESINFORMATION
CENTER (ERIC)."
MULTIPLE MEASURES IN PLACEMENT RECOMMENDATIONS:AN EXAMINATION OF VARIABLES RELATED TO COURSE SUCCESS
Willard Clark Lewallen, Ph.D.Dean of CounselingMatriculation CoordinatorAntelope Valley College
September 29, 1994
I'
BEST COPY AVAILABLE

r
Page 1
INTRODUCTION AND BACKGROUND
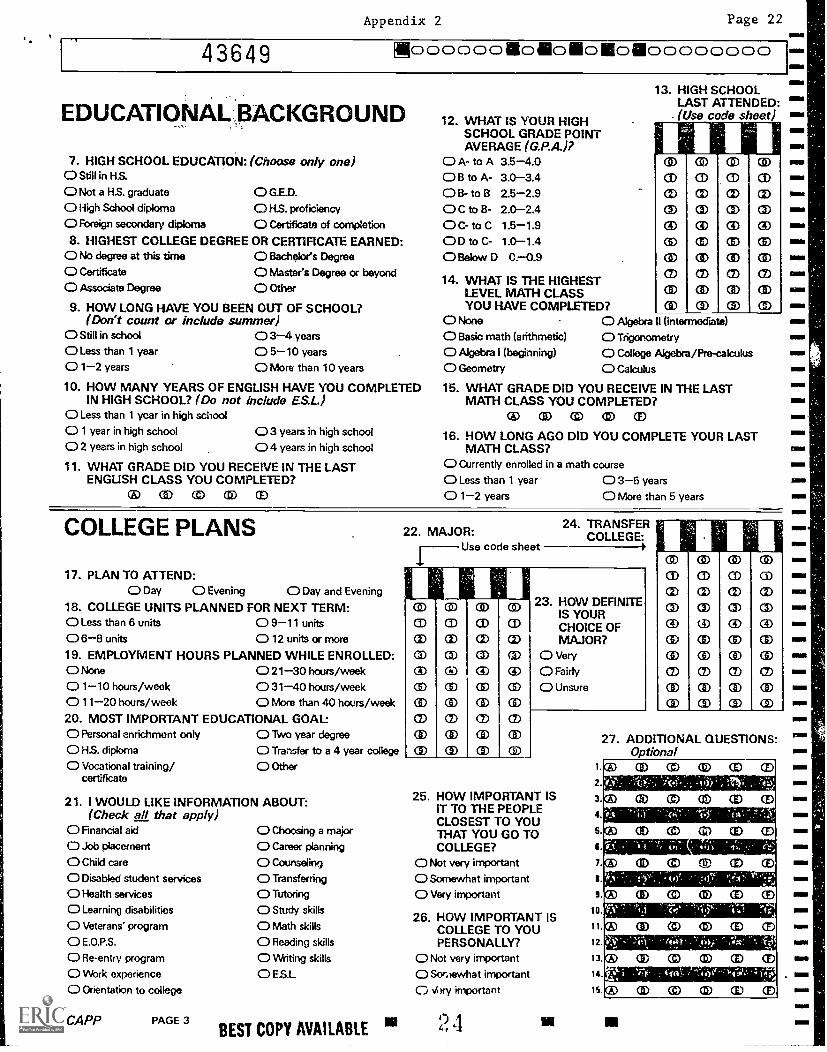
Consistent with Title 5 regulations concerning matriculation, Antelope Valley College hasapplied multiple measures in making placement recommendations for writing, reading, and mathcourses. During the process of administering placement exams, the college collects additionalinformation on each student (demographics, educational background, future educational plans,etc.). This additional information is collected by means of a survey (see Appendix 1). Whenthe placement exams are scored, this additional information is also entered into the assessmentdatabase. The result of this assessment process is a profile of the student. This profileculminates in a "Counseling Report" (see Appendix 2) which provides a summary of thestudent's background information along with score resuits from the placement exams. Based oncut scores for the exams, initial placement recommendations are made.
Historically, during the regNtration,,procesl; students interfaced with a counselor orinstructional faculty advisor to discuss course placement and selection. During these interfaces,the placement test results, the additional information on the counseling report, and other data(transcripts, etc.), would be used as multiple criteria to render placement recommendations.Even though there was considerable variability in how the additional criteria were evaluated, atleast measures beyond test scores were utilized. However, beginning with the summer term1994, the College implemented phone registration. As a result of this new registration process,the "interfaces" that used to occur during registration are less frequent if they occur at all. Thenet impact of these changes is that the College lost its primary vehicle for applying multiplemeasures in placement recommendations. Because of the College's commitment to usingmultiple measures in placement it became imperative that a new system for utilizing multiplemeasures be developed.
A NEW MULTIPLE MEASURES SYSTEM
A survey of other community colleges found two principle methods being used to applymultiple measures in placement recommendations. One method involves the identification ofvariables related to success in courses (usually through multiple or logistic regression). Oncethese variables are identified, a weighted formula is developed which predicts the probability ofa student achieving a particular grade based on these variables. The other method also identifiesvariables associated with course success (through multiple or logistic regression,crosstabulations, expectancy tables, etc.). Once these variables are identified the student's rawscore on the placement exams are adjusted. These scores are typically adjusted by adding pointsfor positive predictors and subtracting points for negative predictors.
The I 'ollege chose the latter method mentioned above for three reasons. First, thismethod could be integrated into existing assessment software and systems without drasticmodifications. Second, the system would be easily understood by students who often havequestions about their placement recommendations. Third, this method would standardize theweighting and application of additional criteria in placement recommendations.
11:\reports\multmos.rpt3
METHODOLOGY
Data Source
Page 2
The data source consisted of all students who were assessed and were enrolled in writing,reading, and math courses. For reading and writing courses the data was drawn from the Fall1990, Spring 1991, Fall 1992, and Spring 1993 semesters. For math courses the data wasdrawn from the Fall 1993 and Spring 1994 semesters.
Variables
The variables examined for relationship to course success were as follows: age, highschool GPA, high school completion status, recency of formal schooling, years of high schoolEnglish, grade in last English class, highest math class completed, grade in last math class,recency of last math class, units planned, work hours planned. The values for these variablescan be found in Appendix 1.
Analyses
Chi-square analysis was used to determine associations between course success and thevariables of interest. The chi-square statistic provided a measure of statistical significance whilethe crosstabulations provided a means to examine the relative and practical importance of theassociations. These analyses were carried out for writing, reading, and math courses. Coursesuccess was determined by end of course grade. Grades of A, B, C, or CR were consideredsuccess. Grades of D, F, or NC were considered nonsuccess. Grades of W or INC were notconsidered nonsuccess, but were treated as separate values. Because of the large number ofcases and the desire to find only meaningful associations, statistical significance was set at p <.01.
I I Areports mu llmcas. rpt 4

RESULTS
Writing Courses
Page 3
Because of the desire to identify underlying factors associated with success in writingcourses, analyses were performed with data combined from all writing courses (English 50A -Basic Composition, English 50B - Intermediate Composition, and English 1A FreshmanComposition I). Table 1 displays the association between age and success in writing courses.The relationship was found to be statistically significant. Given the limitations of the data, itis evident that students 25 years of age and older experience considerably more success thanthose 24 years of age and younger.
Table 1 Expectancy Table Showing Relation Between Age and End of Course Grade forWriting Courses (N = 4127).
Age # of CasesPercentage Receiving Each GradeA/B /C /CR D/F/NC W/INC
< 24 2896 43 31 27
25 - 34 816 56 19 25
35 44 313 63 17 20
> 45 102 60 17 23
All Cases 4127 47 27 26
1-square = i uo. ul, of = i u, p = .
Table 2 displays the association between high school GPA and writing course success.The relationship was found to be statistically significant. It is evident that students with averagegrades of "B to A-" and "A- to A" experience considerably more success than those with lowerhigh school grades.
11:\rcports\inultincas.rr:

1
Page 4
Table 2 Expectancy Table Showing Relation Between High School GPA and End ofCourse Grade for Writing Courses (N = 4090)
HS GPA # OF CASESPercentage Receiving Each GradeA/B/C/CR D/F/NC W/INC
D or less 179 42 28 30
C- to C 541 45 26 30
C to B- 1195 41 30 29
B- to B 1157 47 27 26
B to A. 800 56 24 20
A- to A 218 62 19 19
P-II Cases 4090 47 27 26
Chi-square = 70.06, df = 12, p = 000
Table 3 displays the association between high school completion and writing coursesuccess. The relationship was found to be statistically significant. Students who are high schoolgraduates experience greater success (48%) than those who are not high school graduates (43%).It is interesting to note that 20% of all students in writing courses did not completehigh school.
Table 3 Expectancy Table Showing Relation Between High School Completion Statusand End of Course Grade for Writing Courses (N = 4135)
HSCOMPLETION
# OF CASESPercentage Receiving Each GradeA/B/C/CR D/F/NC W/INC
HS Graduate 3303 48 27 25
Not HS Grad 832 43 27 30
All Cases 4135 47 27 26
fu-square 56, df = 2, p = .000
Table 4 displays the association between years of high school English and writing course
success. The relationship was not statistically significant. It appears that the number of yearsof high school English is not a very useful variable in predicting writing course success. For
example, students with two years (49%) have as much success as students with four years
(50%).
II:\ rcports\multmcas.rpt

Page 5
Table 4 Expectancy Table Showing Relation Between Years of High School English andEnd of Course Grade for Writing Courses (N = 4096).
Years of HSEnglish # of Cases
Percentage Receiving Each GradeA/B/C/CR D/F/NC W/INC
< 1 year 136 46 25 29
1 year 166 43 25 31
2 years 436 49 24 27
3 years 1800 45 29 26
4 years 1558,.1
50 26 24
All Cases 4096 47 27 26
Chi-square = 13.64, df = 8, p = .052
Table 5 displays the associatiod between grade in last English class and writing coursesuccess. The relationship was found to be statistically significant. Students with grades of "B"
or "A" experience considerably more success than those with grades of "C" or less.
Table 5 Expectancy Table Showing Relation Between Grade in Last English Class andEnd of Course Grade for Writing Courses (N = 4054)
Last EnglishGrade # of Cases
Percentage Receiving Each GradeA/B/C/CR D/F/NC W/INC
F 49 20 25 29
D 252 33 42 25
C 1587 43 29 28
B 1641 51 24 25
A 525 58 23 19
All Cases 4054 47 27 26
Chi-square = 97.18, df = 8, p = .000
Table 6 displays the association between work hours planned and writing course success.The relationship was found to be statistically significant, but a confusing picture emerged.Students planning to work no hours have almost the same success rate (49%) as those planning
HAreports\multmcas.rpt
7
Page 6
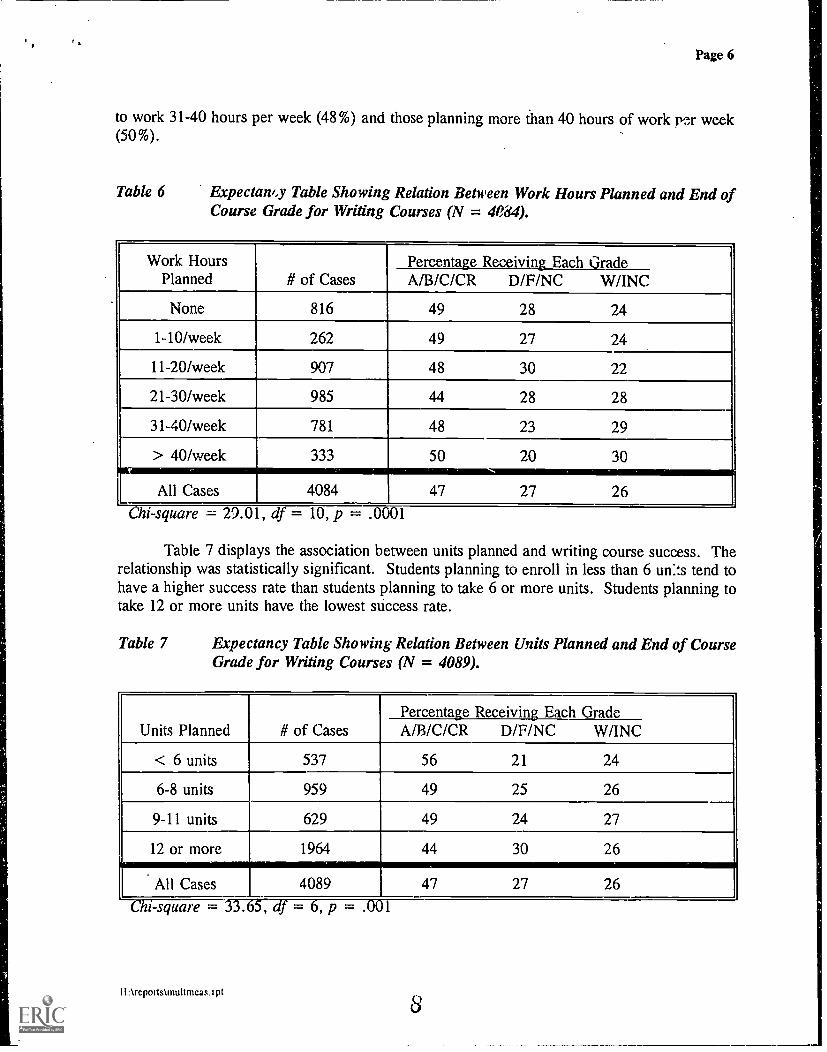
to work 31-40 hours per week (48%) and those planning more than 40 hours of work pfx week(50%).
Table 6 Expectamy Table Showing Relation Between Work Hours Planned and End ofCourse Grade for Writing Courses (N = 4084).
Work HoursPlanned # of Cases
Percentage Receiving Each GradeA/B/C/CR D/F/NC W/INC
None 816 49 28 24
1-10/week 262 49 27 24
11-20/week 907 48 30 22
21-30/week 985 44 28 28
31-40/week 781 48 23 29
> 40/week 333 50 20 30
LAll Cases 4084 47 27 26Chi - square -= 29.01. df = 10_ D = .0001
Table 7 displays the association between units planned and writing course success. Therelationship was statistically significant. Students planning to enroll in less than 6 un:ts tend tohave a higher success rate than students planning to take 6 or more units. Students planning totake 12 or more units have the lowest success rate.
Table 7 Expectancy Table Showing Relation Between Units Planned and End of CourseGrade for Writing Courses (N = 4089).
Units Planned # of CasesPercentage Receiving Each GradeA/B/C/CR D/F/NC W/INC
< 6 units 537 56 21 24
6-8 units 959 49 25 26
9-11 units 629 49 24 27
12 or more 1964 44 30 26
All Cases 4089 47 27 26
Chi- square = 33.65, df = 6, p = .
II Areports\multmcag.ipt
8

r.
Page 7
Table 8 displays the association between recency of schooling and writing course success.The relationship was statistically significant. Students who have been out of school 3 or moreyears tend to have higher success rates than those out of school less than 3 years.
Table 8 Expectancy Table Showing Relation Between Recency of Schooling and End ofCourse Grade for Writing Courses (N = 4116).
Years Outof School # of Cases
Percentage Receiving Each GradeA/B/C/CR B /F /NC W/INC
Still enrolled 1110 46 30 25
< 1 year 1198 40 33 27
1-2 years 410 41 30 29
3-4 years 318 54 19 27
5-10 years 511 52 21 27
> 10 years 569 60 18 22.mslim.
All Cases 4116 47
Neimimigammior27 26
ht-square = 99.84, df = 10, p = .0
Seven of the variables showed statistically significant associations with writing coursesuccess (age, high school GPA, high school completion status, grade in last English class, workhours planned, units planned, and recency of schooling). One variable, years of high schoolEnglish, was not significantly associated with success.
Using additional measures in placement recommendations requires that the measures notbe "highly correlated" [Title 5, 55521(c)]. The terms "highly correlated" are extremelysubjective. Correlations can be statistically significant and/or practically significant. When thenumber of cases is sufficiently large, even small departures from 0 can be statisticallysignificant. However, statistical significance does not always mean that a correlation is usefulor meaningful. In sorting out the interrelationships among the variables, it was decided thatcorrelations of .50 or higher between variables were indicative of high correlations. Appendix3 displays a correlation matrix for all the independent variables as well as end of course gradefor writing.
. The relation between high school completion and writing course success was statisticallysignificant. However, the difference between competers and non-completers was only 5% andtherefore it is re'ommended that this variable not be used. The relationship between work hoursplanned and writing course success, while statistically significant, produced some puzzlingresults (see Table 6). Age was strongly associated with writing course success. However, thecorrelation matrix reveal: a high correlation (r = .62) between age and recency of schooling.
II:\reports\multmcas.rpt
Page 8
Including age would not add appreciably to the model of multiple measures because most of thisvariance is explained through the recency of schooling variable. Additionally, age is a sensitivevariable and using it as a measure for placement consideration could create a bias/discriminationissue. Grade in last English class and high school GPA were strongly associated with writingcourse success. However, the correlation matrix reveals a high correlation (r = .56) betweenhigh school GPA and grade in last English class. In choosing one or the other it seemsreasonable to choose grade in last English class since we are concerned with writing coursesuccess.
In summary, high school completion status, work hours planned, age, and high school-GPA are not recommended as multiple measures because of the reasons outlined above. Threeof the independent variables demonstrated very clear and highly linear associations with writingcourse success and were not highly correlated with each other. It is recommended that for the .
following variable values a point be added to the writing score to form an adjusted writing scorebased on multiple measures:
Grade in Last English class (add a point for students with a "B" or better grade)Units Planned (add a point for students planning to take less than 6 units)Recency of Schooling (add a point for students out of school more than 10 years)
Reading Courses
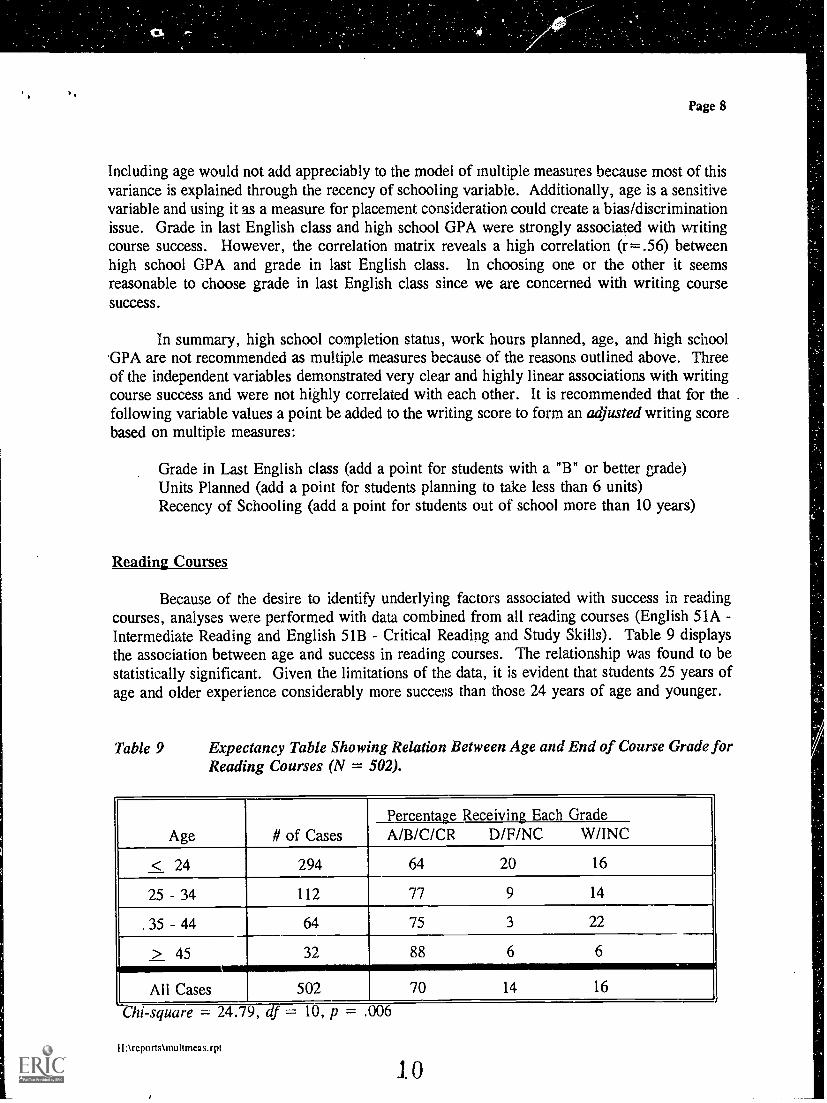
Because of the desire to identify underlying factors associated with success in readingcourses, analyses were performed with data combined from all reading courses (English 51A -Intermediate Reading and English 51B - Critical Reading and Study Skills). Table 9 displaysthe association between age and success in reading courses. The relationship was found to bestatistically significant. Given the limitations of the data, it is evident that students 25 years ofage and older experience considerably more success than those 24 years of age and younger.
Table 9 Expectancy Table Showing Relation Between Age and End of Course Grade forReading Courses (N = 502).
Age # of CasesPercentage Receiving Each GradeA/B/C/CR D/F/NC W/INC
< 24 294 64 20 16
25 34 112 77 9 14
. 35 44 64 75 3 22
> 45 32 88 6 6
All Cases
NMI MEM=
502 70 14 16
Chi-square = 24.79, df = 10, p = .006
II: \ reports\ multmcas.rpt
10

Table 10 displays the association between high school GPA and reading course success.The relationship was found to be statistically significant. It is evident that students with averagegrades of "B to A-" and "A- to A" experience considerably more success than those with lowerhigh school grades. Students with high school GPAs of "D or less" also have high success rates(86%), but with so few in this category (N = 9, 2%), it seems unreasonable to draw anyconclusions.
Table 10 Expectancy Table Showing Relation Between High School GPA and End ofCourse Grade for Reading Courses (N = 498)
HS GPA # OF CASESPercentage Receiving Each GradeA/B/C/CR D/F/NC W/INC
D or less 9 86 0 14
C- to C 84 62 21 17
C to B- 158 71 10 19
B- to B 138 62 19 19
B to A- 88 82 9 9
A- to A 21 88 12
All Cases 498 70 14 16
Chi-square = 22.48, df = 10, p = .013
Table 11 displays the association between high school completion and reading coursesuccess. The relationship was not statistically significant. Students who are high schoolgraduates are not likely to experience greater success than those who are not high schoolgraduates.
II: \reportslmultnicas.rpt
11

Page 10
Table 11 Expectancy Table Showing Relation Between High School Completion Statusand End of Course Grade for Reading Courses (N = 500)
HSCOMPLETION
# OF CASESPercentage Receiving Each GradeA/B/C/CR D/F/NC W/INC
HS Graduate 418 70 14 16
Not HS Grad 82 66 20 14
All Casesetv
500A
70 14 16A .,
square = ." 1 A A
, = , p = .
Table 12 displays the association between years of high school English and readingcourse success. The relationship was not statistically significant. Students with three or fouryears of high school English experience are not more likely to be successful when compared tostudents with 2 years or less of high school English.
Table 12 Expectancy Table Showing Relation Between Years of High School English andEnd of Course Grade for Reading Courses (N = 498).
Years of HSEnglish # of Cases
Percentage Iteceiving Each GradeA/B/C/CR D/F/NC W/INC
2 years or less 92 70 13 17
3 years 180 68 20 12
4 years 226 70 12 18
All Cases,
498 70 14 16
z-square = 1.254, ar = 4, p = .
Table 13 displays the association between grade in last English class and reading coursesuccess. The relationship was statistically significant. Students with grades of "B" in their lastEnglish class experience the highest success rate (76%) in reading courses. No students reportedhaving an "F" in their last English class and only 5% reported earning a "D".
11: \ reports mu Unica s. rpl 12

Page 11
Table 13 Expectancy Table Showing Relation Between Grade in Last English Class andEnd of Course Grade for Reading Courses (N = 500)
Last EnglishGrade # of Cases
Percentage Receiving Each GradeA/B/C/CR D/F/NC W/INC
C or less 294 67 15 18
B 144 76 8 16
A 62 65 26 9
All Cases 500 70 14 16
hi- square = 12.86, df = = .012
Table 14 displays the association between work hours planned and reading coursesuccess. The relationship was found to be statistically significant. Students planning to workno hours or 1-10 hours per week are more likely to succeed in reading courses than thoseplanning to work 11 or more hours per week.
Table 14 Expectancy Table Showing Relation Between Work Hours Planned and End ofCourse Grade for Reading Courses (N = 502).
Work HoursPlanned # of Cases
Percentage Receiving Each GradeA/B/C/CR D/F/NC W/INC
None 128 81 6 13
1-10/week 36 78 6 16
11-20/week 140 69 17 14
21-30/week 74 57 30 13
31-40/week 104 63 14 23
> 40/week 20 70 20 10
All Cases 502 70 14 16
Chi- square = 31.11, df = 10, p = .000
I I : \ reports\ multnicas.rpl
13
Page 12
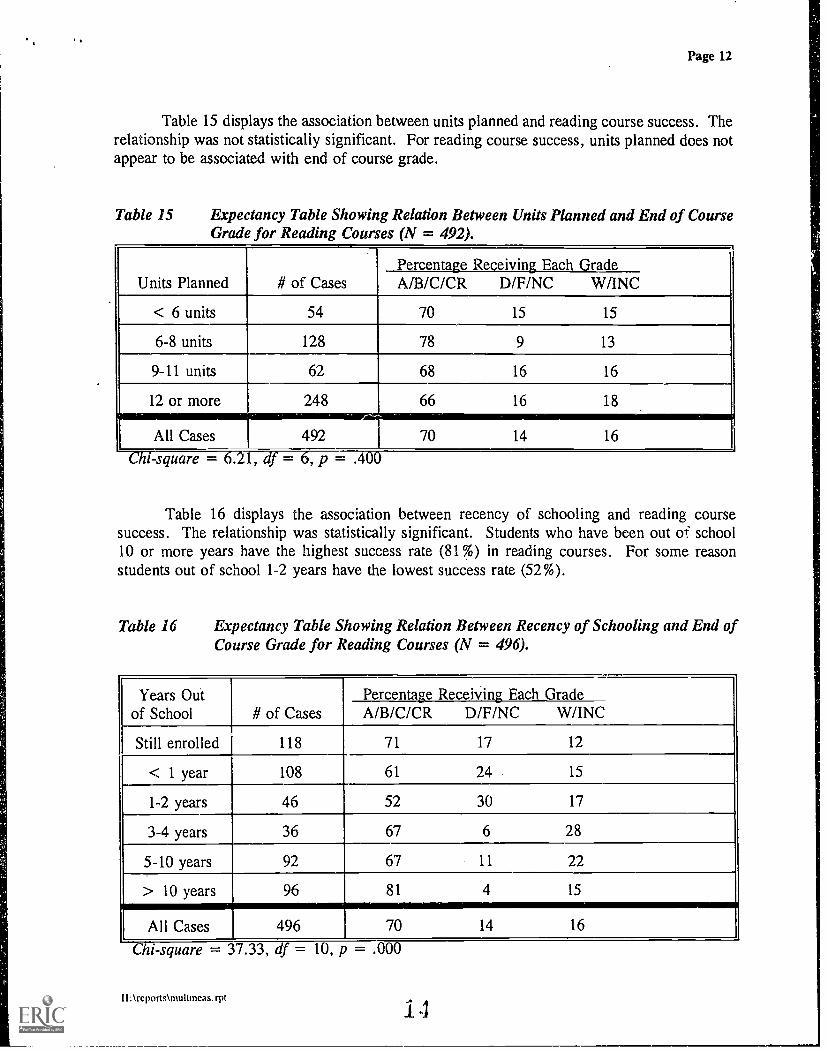
Table 15 displays the association between units planned and reading course success. Therelationship was not statistically significant. For reading course success, units planned does notappear to be associated with end of course grade.
Table 15 Expectancy Table Showing Relation Between Units Planned and End of CourseGrade for Reading Courses (N = 492).
Units Planned # of CasesPercentage Receiving Each GradeA/B/C/CR D/F/NC W/INC
< 6 units 54 70 15 15
6-8 units 128 78 9 13
9-11 units 62 68 16 16
12 or more 248 66 16 18
All Cases 492 70 14 16
Chi-square = 6.2 = 6, p = .
Table 16 displays the association between recency of schooling and reading coursesuccess. The relationship was statistically significant. Students who have been out of school10 or more years have the highest success rate (81%) in reading courses. For some reasonstudents out of school 1-2 years have the lowest success rate (52%).
Table 16 Expectancy Table Showing Relation Between Recency of Schooling and End ofCourse Grade for Reading Courses (N = 496).
Years Outof School # of Cases
Percentage Receiving Each GradeA/B/C/CR D/F/NC W/INC
Still enrolled 118 71 17 12
< 1 year 108 61 24 15
1-2 years 46 52 30 17
3-4 years 36 67 6 28
5-10 years 92 67 11 22
> 10 years 96 81 4 15
All Cases 496 70 14 16
Chi- square = 37.33, df = 10, p = .000
II Arcports\multmeas.rpt

n
Page 13
Rive of the variables showed statistically significant associations with reading coursesuccess (age, high school GPA, grade in last English class, work hours planned, and recencyof schooling) while three variables were not significantly associated with success (high schoolcompletion status, years of high school English, and units planned).
Age was strongly associated with reading course success. However, additional analysisrevealed a high correlation (r = .75, see Appendix 4) between age and recency of schooling.Including age would not add appreciably to the model of multiple measures because most of thisvariance is picked up in the recency of schooling variable. And as mentioned previously, ageis a sensitive variable that potentially could raise issues of bias and/or discrimination if used inplacement decisions. High school GPA and grade in last English class were strongly associatedwith reading course success. However, the correlation between high school GPA and grade inlast English was high (r = .55). In choosing one or the other, it seems reasonable to choosegrade in last English class since we are concerned with reading course success.
In summary, age and high school GPA are not recommended as multiple measuresbecause of the reasons outlined above. Three of the independent variables demonstrated veryclear and highly linear associations with reading course success and were not highly correlatedwith each other. It is recommended that for the following variable values a point be added tothe reading score to form an adjusted reading score based on multiple measures:
Grade in Last English Class (add a point for students reporting a "B" grade)Work Hours Planned (add a point for students planning to work 10 or less hours per
week)Recency of Schooling (add a point for students out of school more than 10 years)
Math Courses
While there are 13 different math courses in which students can be placed, 7 years ofplacement data have shown that 96% of all students place into math courses at the intermediatealgebra level and below. It seemed reasonable to explore variables associated with math successutilizing these courses: Math 60 - Arithmetic Fundamentals, Math 50 Arithmetic, Math AElementary Algebra, Math B Geometry, and Math C Intermediate Algebra,
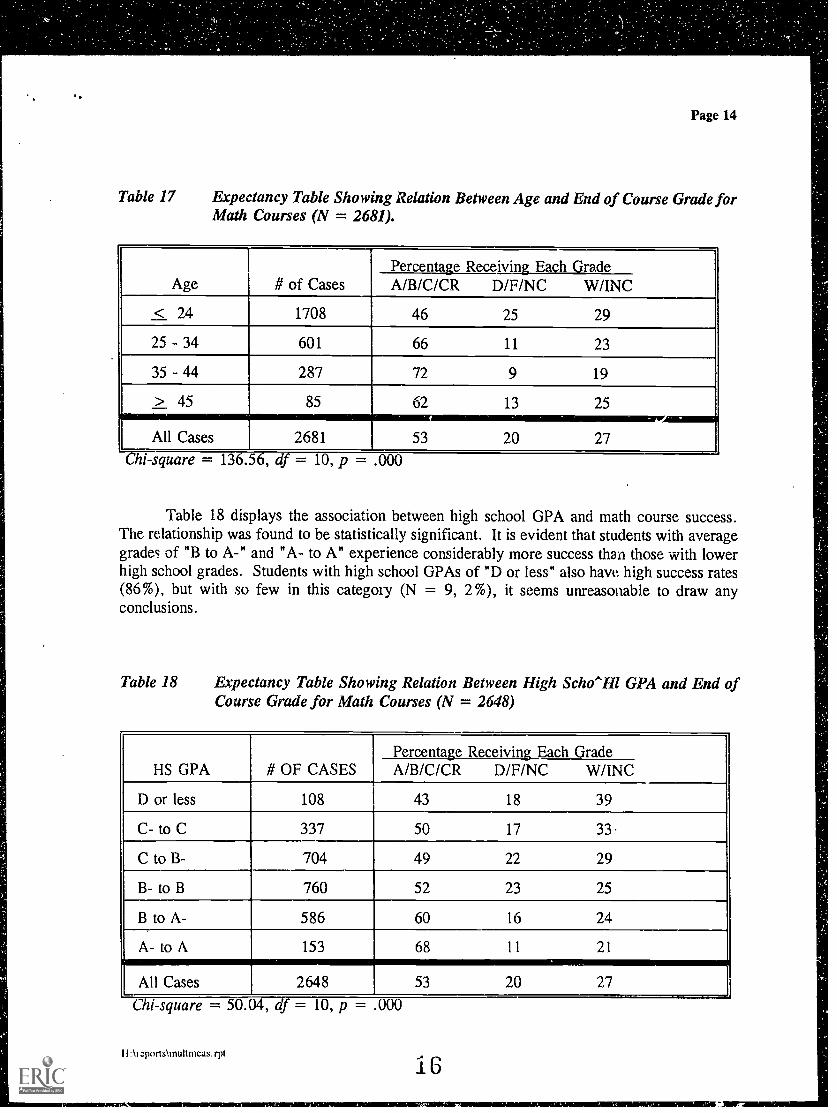
Table 17 displays the association between age and success in math courses. Ther:;lationship was found to be statistically significant. Given the limitations of the data, it isevident that students 25 years of age and older experience considerably more success than those24 years of age and younger.
II: \reports\multmeas.rpt
15
Page 14
Table 17 Expectancy Table Showing Relation Between Age and End of Course Grade forMath Courses (N = 2681).
Age # of CasesPercentage Receiving Each GradeA/B/C/CR D/F/NC W/INC
< 24 1708 46 25 29
25 - 34 601 66 11 23
35 - 44 287 72 9 19
> 45 85 62 13 25
All Cases 2681 53 20 27
hi-square = 136.56, df = 10, p = .000
Table 18 displays the association between high school GPA and math course success.The relationship was found to be statistically significant. It is evident that students with averagegrades of "B to A-" and "A- to A" experience considerably more success than those with lowerhigh school grades. Students with high school GPAs of "D or less" also haw high success rates(86%), but with so few in this category, (N = 9, 2%), it seems unreasonable to draw anyconclusions.
Table 18 Expectancy Table Showing Relation Between High Scho"Hl GPA and End ofCourse Grade for Math Courses (N = 2648)
HS GPA # OF CASESPercentage Receiving Each GradeA/B/C/CR D/F/NC W/INC
D or less 108 43 18 39
C- to C 337 50 17 33
C to B- 704 49 22 29
B- to B 760 52 23 25
B to A- 586 60 16 24
A- to A 153 68 11 21
All Cases 2648 53 20 27
Chi- square = 50.04, df = 10, p = 000
I I Arzports\multmeas.rpt
16

Page 15
Table 19 displays the association between high school completion and math coursesuccess. The relationship was statistically significant. Students who are high school graduatesare likely to experience greater success in math courses (58%) than those who are not highschool graduates (45%). It is interesting to note that 34% of all students in math courses dicknot complete high school.
Table .!9 Expectancy Table Showing Relation Between High School Completion Statusand End of Course Grade for Math Courses (N = 2681)
HSCOMPLETION
# OF CASESPercentage Receiving Each GradeA/B/C/CR D /F /NC W/INC
HS Graduate 1774 58 17 25
Not HS Grad 907 45 25 30
All Cases 2681 53 20 27
hi-square = 20.40, df = 2, p = .00
Table 20 displays the association between recency of last math class and math coursesuccess. The relationship was found to be statistically significant. It appears that students whocompleted a math class 5 or more years ago are the most likely to be successful (67%).
Table 20 Expectancy Table Showing Relation Between Recency of Last Math Class andEnd of Course Grade for Math Courses (N = 2673).
Years SinceLast Math Class # of Cases
Percentage Receiving Each GradeA/B/C/CR D/F/NC W/INC
Current 223 49 27 23
< 1 year 573 47 28 26
1-2 years 682 43 25 32
3-5 years 322 52 15 33
> 5 years 873 67 11 22
All Cases 2673 53 20 27
Chi-square = 140.35, df = 8, p = .000
II Arcvnts\multmcas.rpt 17
Page 16
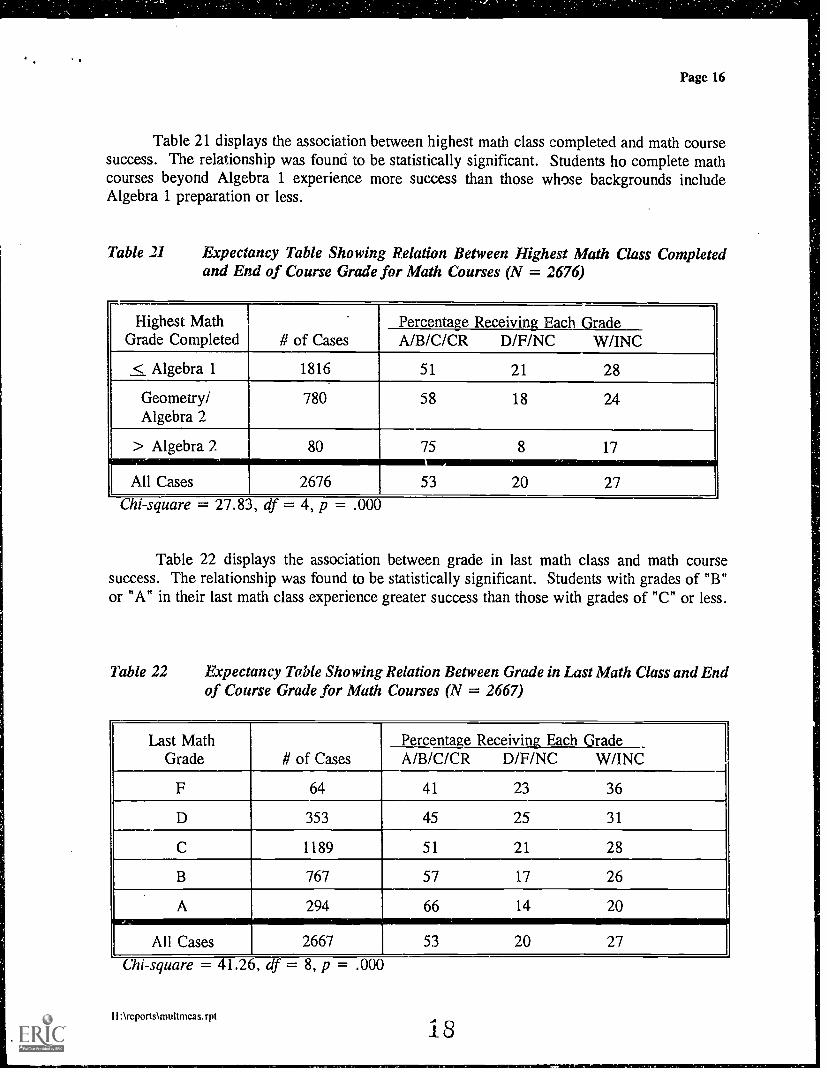
Table 21 displays the association between highest math class completed and math coursesuccess. The relationship was found to be statistically significant. Students ho complete mathcourses beyond Algebra 1 experience more success than those whose backgrounds includeAlgebra 1 preparation or less.
Table 31 Expectancy Table Showing Relation Between Highest Math Class Completedand End of Course Grade for Math Courses (N = 2676)
Highest MathGrade Completed
.
# of CasesPercentage Receiving Each GradeA/B/C/CR D/F/NC W/INC
< Algebra 1 1816 51 21 28
Geometry/Algebra 2
780 58 18 24
> Algebra 2 80 75 8 17
All Cases 2676 53 20 27-square = . , = , p = .
Table 22 displays the association between grade in last math class and math coursesuccess. The relationship was found to be statistically significant. Students with grades of "B"or "A" in their last math class experience greater success than those with grades of "C" or less.
Table 22 Expectancy Table Showing Relation Between Grade in Last Math Class and Endof Course Grade for Math Courses (N = 2667)
Last MathGrade # of Cases
Percentage Receiving Each GradeA/B/C/CR D/F/NC W/INC
F 64 41 23 36
D 353 45 25 31
C 1189 51 21 28
B 767 57 17 26
A 294 66 14 20
All Cases 2667 53 20 27
Chi-square = 41.26, df = 8, p = .000
II Arcports\multmcas.rpt
18

Page 17
Table 23 displays the association between work hours planned and math course success.The relationship was found to be statistically significant, but a confusing picture emerged.Students planning to work no hours have almost the same success rate (56%) as those Fanningto work 31-40 hours per week (57%). Those planning more than 40 hours of work per weekhave the highest success rate (65%). Additionally, those students planning to work from 1-30hours per week have similar success rates (around 50%).
Table 23 Expectancy Table Showing Relation Between Work Hours Planned and End ofCourse Grade for Math Courses (N = 2644).
Work Hours Percentage Receiving Each GradePlanned # of Cases A/B/C/CR D/F/NC W/INC
None 706 56 19 25
1-10/week 164 51 18 31
11-20/week 591 49 23 29
21-30/week 551 49 21 31
31-40/week 460 57 18 25
> 40/week 172 65 15 20,All Cases 2644 53 20 27
1-square = 27.26, d = 10, p = .
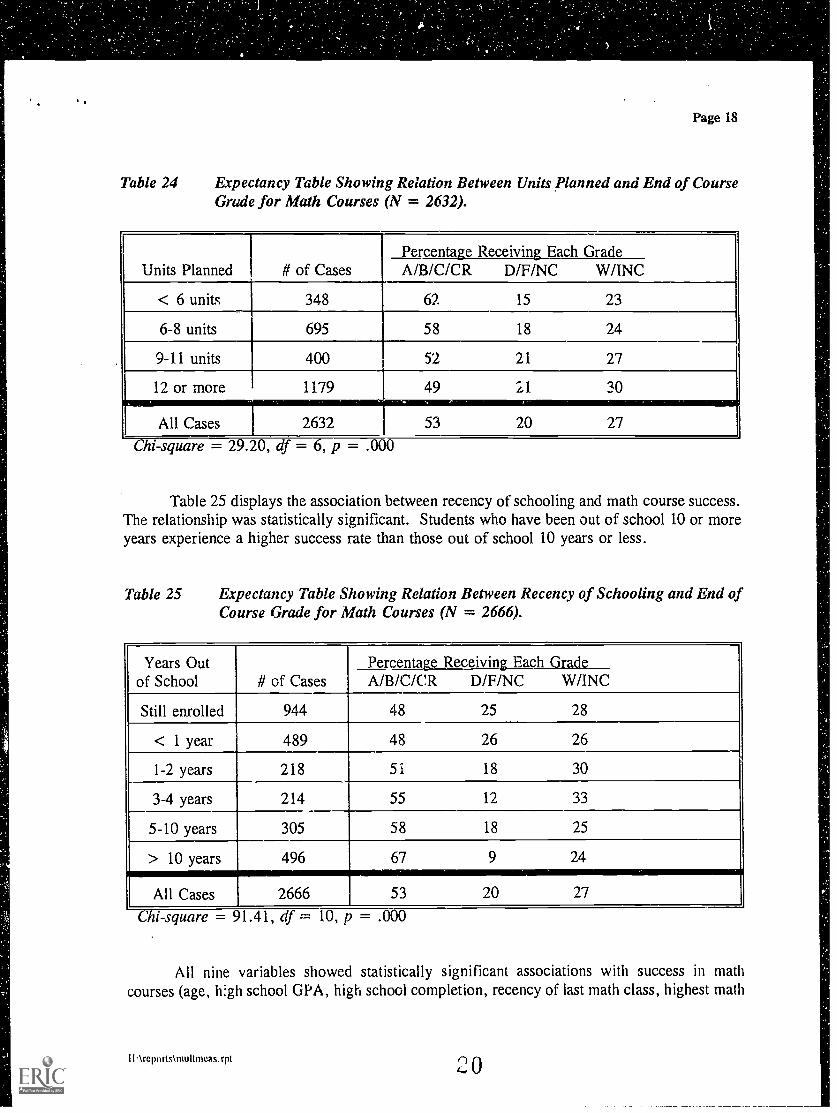
Table 24 displays the association between units planned and math course success. Therelationship was statistically significant. Students planning to enroll in 8 units or less tend tohave a higher success rate than students planning to take 9 or more units. Students planning totake 12 or more units have the lowest success rate.
II: \ reports\ multmeas.rpt 19
Page 18
Table 24 Expectancy Table Showing Relation Between Units Planned and End of CourseGrade for Math Courses (N = 2632).
Units Planned # of CasesPercentage Receiving Each GradeA/B/C/CR D/F/NC W/INC
< 6 units 348 62 15 23
6-8 units 695 58 18 24
9-11 units 400 52 21 27
12 or more 1179 49 21 30
All Cases 2632 53 20 27
Chi-square = 29.20, df =
Table 25 displays the association between recency of schooling and math course success.The relationship was statistically significant. Students who have been out of school 10 or moreyears experience a higher success rate than those out of school 10 years or less.
Table 25 Expectancy Table Showing Relation Between Recency of Schooling and End ofCourse Grade for Math Courses (N = 2666).
Years Outof School # of Cases
Percentage Receiving Each GradeA/B/C/CR D/F/NC W/INC
Still enrolled 944 48 25 28
< 1 year 489 48 26 26
1-2 years 218 51 18 30
3-4 years 214 55 12 33
5-10 years 305 58 18 25
> 10 years 496 67 9 24
All Cases 2666 53 20 27
Chi-square = 91.41, df = 10, p = .000
All nine variables showed statistically significant associations with success in mathcourses (age, high school GPA, high school completion, recency of last math class, highest math
II Arcports\multineas.rpt

Page 19
completed, grade in last math class, work hours planned, units planned, and recency ofschooling).
The correlation matrix in Appendix 5 reveals a high correlation (r = .63) between ageand recency of schooling, a high correlation (r = .79) between recency of last math class andrecency of schooling, a high correlation (r = .59) between age and recency of last math class,and a high correlation (r = .46) between high school completion and recency of schooling. Thisevidence of high multicollinearity among these independent variables provides reasonablejustification to leave out age, recency of last math class, and high school completion status inthe model of multiple measures. The contributions of these variables in explaining math coursesuccess is sufficiently picked up through the recency of schooling variable. Additionally, thework hours planned variable was significantly associated with math course success, but asdescribed earlier, a somewhat odd pattern emerged in success rates. It is also recommended toleave this variable out of the model.
In summary, age, recency of last math class, high school completion status, and workhours planned are not recommended as multiple measures because of the reasons outlined above.Five of the independent variables demonstrated very clear and highly linear associations withmath course success and were not highly correlated with each other. It is recommended that forthe following variable values, a point be added to the math score to form an adjusted math scorebased on multiple measures:
HS GPA (add a point for students with average grades of "B to A-" or higher)Highest Math Completed (add a point for students who completed courses beyond
Algebra 1)Grade in Last Math Class (add a point for students with a "B" or better)Units Planned (add a point for students planning to take 8 units or less)Recency of Schooling (add a point for students out of school more than 10 years)
II. \ reports \ multtneas. rpt4,L

Page 20
SUMMARY
The use of multiple measures in placement recommendations is required as outlined inmatriculation regulations and provisions. This study explored educational background variablespotentially associated with success in writing, reading, and math courses. For writing courses,three variables were found to be strongly associated with success and were recommended to beused as additional criteria in reading placement recommendations: Grade in last English class,units planned, and recency of schooling. For reading courses, three variables were found to bestrongly associated with success and were recommended to be used as additional criteria inmaking placement recommendations: Years of high school English, work hours planned, andrecency of schooling. For math courses, five variables were found to be strongly associatedwith success and were recommended to be used as additional criteria in placementrecommendations: high school GPA, highest math class completed, grade in last math class,units planned, and recency of schooling. It is interesting to note that recency of schooling wasassociated with success in writing, reading, and math courses. It is not surprising that recencyof schooling is predictive of success across these courses. The older, returning students tend
to be more mature, motivated, and determined to succeed, all of which, are believed tocontribute to success in college work.
One caveat needs to be mentioned in this approach with multiple measures. The values
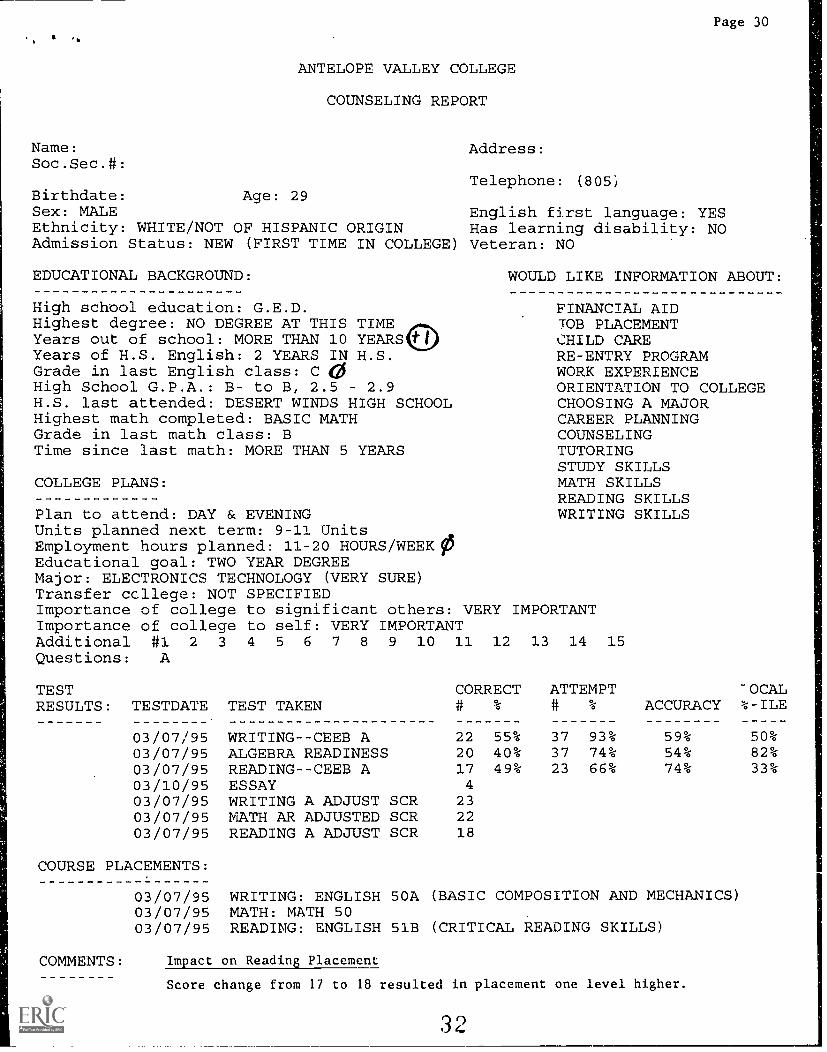
for the variables are self-reported (see Appendix 1). There is concern that when students findout about how the measures are applied there may be false reporting of some of the information.Because of this concern a number of cases were examined in terms of how the application of themultiple measures affect placement recommendations. The result of this examination revealedthat the majority of the impact from this weighting is with students who have borderline scores.In other words, the impact is primarily with students who are 1 or 2 points away from adifferent placement level. Appendices 6, 7, and 8 provide examples of how the adjusted scoresaffect placement recommendations for writing, reading, and math respectively. Appendix 9
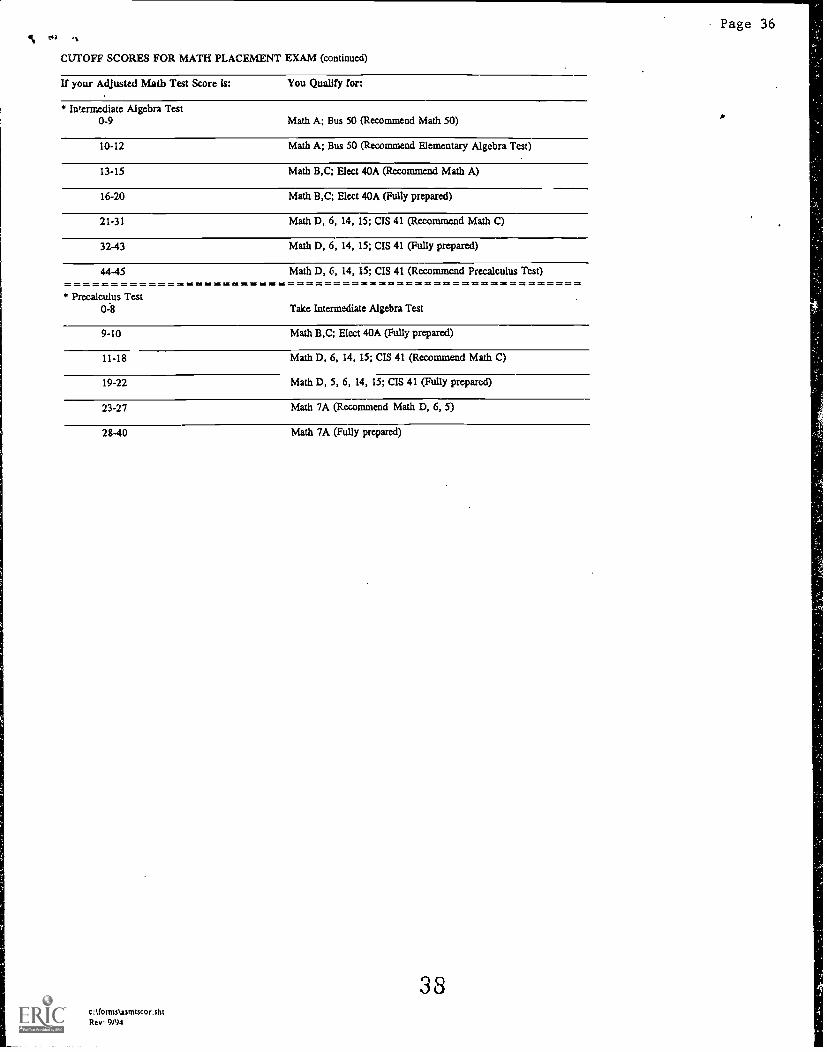
provides a table of cutoff scores for placement recommendations. For many students, theaddition of 3 or 4 points to their test scores will not affect their placement recommendation.Additionally, experience and research has shown that students tend to be quite forthright andhonest when answering questions about their academic backgrounds.
There are certainly pluses and minuses with this approach to using multiple measures.On the negative side it is cold and impersonal. The measures are applied mechanically throughcomputer scoring of the placement exams. There is no subjectivity. On the positive side thismethod of applying multiple measures is fair and consistent. In the past multiple measures wereapplied differently by different counselors/advisors with a variety of opinions and biases toward
success factors.
Finally, even though multiple measures are applied at the front end of theassessment/placement process, the resulting placement recommendation is not absolutely final.
Students have the opportunity to appeal their placement recommendation through the prerequisite
challenge process (see Appendix 10).
I I: \ reportskmultrneas.rpt

Appendix 1 Page 21
ANTELOPE VALLEY COLLEGE
COUNSELING REPORT
Name:Soc.Sec.#
Birthdate: 02/05/74 Age: 19Sex: MALEEthnicity: BLACK/NOT OF HISPANIC ORIGINAdmission Status: NEW (FIRST TIME IN COLLEGE)
EDUCATIONAL BACKGROUND:
High school education: HIGH SCHOOL DIPLOMAHighest degree: NO DEGREE AT THIS TIMFYears out of school: LESS THAN 1 YEARYears of H.S. English: 4 YEARS IN H.S.Grade in last English class: BHigh School G.P.A.: B to A-, 3.0 - 3.4H.S. last attended: NOT SPECIFIEDHighest math completed: BASIC MATHGrade in last math class: ATime since last math: LESS THAN 1 YEAR
COLLEGE PLANS:
Address:
Telephone:
English first language: YESHas learning disability: NOVeteran: NO
WOULD LIKE INFORMATION ABOUT:
FINANCIAL AIDVETTWS' PROGRAME.O.e.S.
Plan to attend: DAYUnits planned next term:Employment hours planned: NONEEducational goal:Major: NOT SPECIFIEDTransfer college: UC, LOS ANGELES (UCLA)Importance of college to significant others: VERY IMPORTANTImportance of college to self: VERY IMPORTANTAdditional #1 2 3 4 5 6 7 8 9 10 11 12 13 14 15
Questions: A
TEST CORRECT ATTEMPT LOCALRESULTS: TESTDATE TEST TAKEN # % # % ACCURACY %-ILE
07/29/93 WRITING--CEEB A 16 40% 40 100% 40% 17%
08/02/94 WRITING--CEEB A 16 40% 40 100% 40% 096
08/02/94 ALGEBRA READINESS 14 28% 50 100% 28% 0%
07/29/93 READING--CEEB A 12 34% 35 100% 34% 14%
08/02/94 READING--CEEB A 15 43% 35 100% 43% 0%
COURSE PLACEMENTS:
07/29/9308/02/9408/02/9407/29/9308/02/94
COMMENTS:
WRITING: ENGLISH 50A (BASIC COMPOSITION AND MECHANICS)WRITING: ENGLISH 50A (BASIC COMPOSITION AND MECHANICS)MATH: MATH 50READING: READING X ENGLISH 51A (INTERMEDIATE READING)READING: ENGLISH 51A (INTERMEDIATE READING)
23
Appendix 2 Page 22
43649 000000 o o o 000000oo
EDUCATIONAL BACKGROUND
7. HIGH SCHOOL EDUCATION: (Choose only one)0 Still in HS.0 Not a HS. graduate
0 High School diploma
0 Foreign secondary diploma
0 G.E.D.0 H.S. proficiency
0 Certificate of completion
8. HIGHEST COLLEGE DEGREE OR CERTIFICATE EARNED:0 No degree at this time 0 Bachelor's Degree0 Certificate 0 Master's Degree or beyond0 Associate Degree 0 Other
9. HOW LONG HAVE YOU BEEN OUT OF SCHOOL?(Don't count or include summer)
0 Still in school0 Less than 1 year0 1-2 years
0 3-4 years05-10 years0 More than 10 years
10. HOW MANY YEARS OF ENGUSH HAVE YOU COMPLETEDIN HIGH SCHOOL? (Do not include E.S.L.)
O Less than 1 year in high school
O 1 year in high school 0 3 years in high school0 2 years in high school 0 4 years in high school
11. WHAT GRADE DID YOU RECEIVE IN THE LASTENGUSH CLASS YOU COMPLETED?
(2i) CD (ED CD
12. WHAT IS YOUR HIGHSCHOOL GRADE POINTAVERAGE (G.P.A.)?
0 A- to A 3.5-4.00 B to A- 3.0-3.40 B- to B 2.5-2.90 C to B- 2.0-2.40 C- to C 1.5-1.9OD to C- 1.0-1.4°Below D 0.-0.9
14. WHAT IS THE HIGHESTLEVEL MATH CLASSYOU HAVE COMPLETED?
13. HIGH SCHOOLLAST ATTENDED:(Use code sheet)
CID CD CD CD
CD CD CD CD
CD a) CD GO
CJ CD CD CD
(3D (3) (3) OD
CD (ID CD CD
CD a) CD GD
a) CD a) CD
® a) a) (ID
GD op a) co0 None 0 Algebra II (intermediate)0 Basic math (arithmetic) 0 Trigonometry0 Algebra I (beginning) 0 College Algebra/Pre-calculus0 Geometry 0 Calculus
15. WHAT GRADE DID YOU RECEIVE IN THE LASTMATH CLASS YOU COMPLETED?
(D (D
16. HOW LONG AGO DID YOU COMPLETE YOUR LASTMATH CLASS?
0 Currently enrolled in a math courseO Less than 1 year 0 3-5 years0 1-2 years 0 More than 5 years
COLLEGE PLANS 22 MAJOR:Use code sheet
17. PLAN TO ATTEND:0 Day 0 Evening 0 Day and Evening
18. COLLEGE UNITS PLANNED FOR NEXT TERM:LI
CD GD CD CID
0 Less than 6 units 0 9-11 units CD CD co co0 6-8 units 0 12 units or more CD CD CD CD
19. EMPLOYMENT HOURS PLANNED WHILE ENROLLED: (1) CD
0 None 0 21-30 hours/week GI) CD CD (3)0 1-10 hours/week 0 31-40 hours /week CD CD CD co0 11-20 hours/week 0 More than 40 hours/week CD CD CID op20. MOST IMPORTANT EDUCATIONAL GOAL: CD CD CD
0 Personal enrichment only 0 Two year degree CD CID co) CD
OHS. diploma 0 Transfer to a 4 year college CD co op CD
0 Vocational training/ 0 Othercertificate
21. I WOULD LIKE INFORMATION ABOUT:(Check all that apply)
0 Financial aid 0 Choosing a major0 Job placement 0 Career planning0 Child care 0 CounselingO Disabled student services 0 TransferringO Health services 0 Tutoring0 Learning disabilities 0 Study skillsO Veterans' program 0 Math skillsO E.O.P.S. 0 Reading skillsO Re-entry program 0 Writing skills0 Work experience 0ES.L
0 Orientation to college
CAPP PAGE 3BEST COPY AVAILABLE III
24. TRANSFERCOLLEGE:
23. HOW DEFINITEIS YOURCHOICE OFMAJOR?
0 Very0 Fairly0 Unsure
25. HOW IMPORTANT ISIT TO THE PEOPLECLOSEST TO YOUTHAT YOU GO TOCOLLEGE?
ONot very important0 Somewhat important0 Very important
26. HOW IMPORTANT ISCOLLEGE TO YOUPERSONALLY?
O Not very important0 Sor.rewhat important0 t try important
e)4, L i
1.
z.
3.
4.
27. ADDITIONAL QUESTIONS:Optional
5.
I.7.
I.
10.
11.
12.
13.
14.
15.
fa CD CD (ID CD CD
CI OD © CD

Page 23
Appendix 3
Correlation Matrix for All Independent Variables and End of Course Grade for Writing Courses(N = 3995)
Variable Name 1 2 3 4 5 6 7 8 9
1. Age 1.00 - .17** .12** - .16** - .07** .02 - .27** .61** - .02
2. HS GPA - .17** 1.00 .11** .23** .56** .06** .12** - .27** - .08**
3. HS Completion .12** .11** 1.00 .28** .08** .10** .03 - .18** - .04*
4. Years HS English - .16** .23** .28** 1 00 .18** .06** .17** - .20** - .04
5. Grade Last Engl Class - .07** .56** ...;!"-- .18 1.00 .01 .06" - .09** - .07**
6. Work Hours Planned .02 .06** .10** .06** .01 1.00 .20** .01 .05*
7. Units Planned - .27** .12** .03 .17* .06** - .20** 1.00 - .30** .02
8. Recency of Schooling .61** - .27** .18** - .20** - .09** .01 - .30** 1.00 - .01
9. Writing Course Grade - .02 .08** - .04* - .C4 - .07** .05* .02 - .01 1.00
* p < .01* *p < .001
11:1 reports \ multmeas.rpt2 5

Page 24
Appendix 4
Correlation Matrix for All Independent Varia,. and End of Course Grade for Reading Courses(N = 406)
Variable Name 1 2 3 4 5 6 7 8 9
1. Age 1.00 - .21** .08 .05 - .16* .11 - .22** .75** .18**
2. HS GPA - .22** 1.00 .25** .32** .55** .09 .14* - .32** .07
3. HS Completion .08 .25** 1.00 .37** .16** .01 .14* - .00 .08
4. Years HS English - .05 .32** .37** 1.00 .26** - .05 .12 - .24** .11
5. Grade Last Engl Class .16* .55" .16** .26** 1.00 - .06 .20** - .26** .01
6. Work Hours Planned .11 .09 .01 - .05 - .06 1.00 - .37** - .08 - .15*
7. Units Planned - .2 .14* .14 .1? 20** - .37** 1.00 - .20** - .09
8. Recency of Schooling .75** - .32** - .00 24** - .26** - .08 .20** 1.00 .13
9. Reading Course Grade .18** .07 .08 .11 .01 - .15* .09 .13 1.00
*p < .01** p < .001
(Llreports\multrncac rptr

Page 25
Appendix 5
Correlation Matrix for All Independent Variables and End of Course Grade for Math Courses(N = 1875)
Variable Name 1 2 3 4 5 6 7 8 9 10
1. Age 1.00 - .15** .33** .59** - .14** .05 .06 - .20** .63** .26**
2. HS GPA - .15** 1.00 - .06* - .21** .34** .29** .01 .10** - .23** .10**
3. HS Completion .33** - .06* 1.00 .46** .02 .06* .12** _ .11** .46** .19**
4. Last Math Class .59** - .21** .46** 1.00 - .17** - .00 .09** - .23** .79** .27**
5. Highest Math Class - .14** .34" .02 - .17** 1.00 - .00 .06* .13** - .17** .09**
6. Grade Last Math Class .05 .29** .06* - .00 - .0%3 1.00 .01 - .03 .04 .17**
7. Work Hours Planned .06 .01 .12** .09** .06* .01 1.00 - .26** .05 .03
8. Units Planned - .20** .10** - .11** - 23** .13** - .03 - .26** 1.00 - .22* - .13**
9. Recency of Schooling .63** - .23** .46** .79** - .17** .04 .05 - .22** 1.00 .26"
10. Math Course Grade .26** .10" .19" .27** .09** .17" .03 .13** .26" 1.00
* p < .01** p < .001
II:\reports\multmeas.rot
27

Appendix 6Writing Placement ExamplesANTELOPE VALLEY COLLEGE
COUNSELING REPORT
Name:Soc.Sec.#:
Birthdate: Age: 54Sex: FEMALEEthnicity: FILIPINOAdmission Status: NEW (FIRST TIME IN
EDUCATIONAL BACKGROUND:
Address:
Telephone: (805)
English first language: YESHas learning disability: NO
COLLEGE) Veteran: NO
High school education: FOREIGN SECONDARY DIPLOMAHighest degree: ASSOCIATE DEGREEYears out of school: MORE THAN 10 YEARS 14Years of H.S. English: 4 YEARS H.S.Grade in last English class: AHigh School G.P.A.: B to A-, 3.0 3.4H.S. last attended: OTHER COUNTRY HIGH SCHOOLHighest math completed: ALGEBRA IGrade in last math class: BTime since last math: MORE THAN 5 YEARS
COLLEGE PLANS:
WOULD LIKE INFORMATION ABOUT:
FINANCIAL AIDJOB PLACEMENTWORK EXPERIENCECAREER PLANNING
Plan to attend: DAYUnits planned next term: 9-11 Units 95Employment hours planned: NONEEducational goal: VOCATIONAL TRAINING/CERTIFICATEMajor: CHILD AND FAMILY EDUCATION (VERY SURE)Transfer college: NOT SPECIFIEDImportance of college to significant others: VERY IMPORTANTImportance of college to self: VERY IMPORTANTAdditional #1 2 3 4 5 6 7 8 9 10 11 12 13 14Questions: A
TESTRESULTS: TESTDATE
COURSE
03/07/9503/07/9503/07/9503/10/9503/07/9503/07/9503/07/95
PLACEMENTS:
COMMENTS:
TEST TAKEN
15
CORRECT ATTEMPT# % #
WRITING--CEEB A 25 63% 40 100%ALGEBRA READINESS 20 40% 43 86%READING--CEEB A 19 54% 31 89%ESSAY 6
WRITING A ADJUST SCR 27MATH AR ADJUSTED SCR 23,READING A ADJUST SCR 21
LOCALACCURACY %-ILE
63% 61%47% 82%61% 43%
03/07/95 WRITING: ENGLISH 50B (INTERMEDIATE COMPOSITION)03/07/95 MATH: MATH A, BUS 50 (RECOMMEND MATH 50)03/07/95 READING: ENGLISH 51B (CRITICAL READING SKILLS)
Impact on Writing Placement
None - Score change from 25 to 27 caused essay to be read, but score of8 on essay required for ENGLISH lA placement.
28

ANTELOPE VALLEY COLLEGE
COUNSELING REPORT
Name:Soc.Sec.#:
Birthdate: Age: 35Sex: FEMALEEthnicity: AMERICAN INDIAN/ALASKAN NATIVEAdmission Status: NEW (FIRST TIME IN COLLEGE)
EDUCATIONAL BACKGROUND:
High school education: HIGH SCHOOL DIPLOMAHighest degree: NO DEGREE AT THIS TIMEYears out of school: MORE THAN 10 YEARSYears of H.S. English: 3 YEARS IN H.S.Grade in last English class: CHigh School G.P.A.: C- to C, 1. 1.9H.S. last attended: NOT SPECIFIEDHighest math completed: BASIC MATHGrade in last math class: CTime since last math: 3-5 YEARS
COLLEGE PLANS:
Plan to attend: DAYUnits planned next term: LESS THAN 6 Unit
-Employment hours planned: 1-10 HOURS/WEEKEducational goal: PERSONAL ENRICHMENT ONLYMajor: ENGLISHTransfer college: NOT SPECIFIEDImportance of college to significant others: VERY IMPORTANTImportance of college to self: VERY IMPORTANTAdditional #1 2 3 4 5 6 7 8 9 10 11 12 13 14 15Questions: A
Address:
Telephone: (805)
English first language: YESHas learning disability: NOVeteran: NO
Page 27
WOULD LIKE INFORMATION ABOUT:
RE-ENTRY PROGRAMCAREER PLANNINGSTUDY SKILLSREADING SKILLSWRITING SKILLS
TESTRESULTS: TESTDATE
COURSE
03/07/9503/07/9503/07/9503/07/9503/07/9503/07/95
PLACEMENTS:
COMMENTS:
TEST TAKEN
WRITING--CEEB AALGEBRA READINESSREADING--CEEB AWRITING A ADJUST SCRMATH AR ADJUSTED SCRREADING A ADJUST SCR
CORRECT ATTEMPT# % # %
14 35% 39 98%1 2% 8 16%7 20% 18 51%
163
9
LOCALACCURACY % -ILE
36% 21%13% 3%39% 4%
03/07/95 WRITING: ENGLISH 50A (BASIC COMPOSITION AND MECHANICS)03/07/95 MATH: MATH 60 (ARITHMETIC FUNDAMENTALS)03/07/95 READING: ENGLISH 51A (INTERMEDIATE READING)
Impact on Writing Placement
Score change from 14 to 16 resulted in placement one level higher.
29

Page 28
ANTELOPE VALLEY COLLEGE
COUNSELING REPORT
Name:Soc.Sec.#:
Birthdate: Age: 28Sex: MALEEthnicity: WHITE/NOT OF HISPANIC ORIGINAdmission Status: NEW (FROM OTHER COLLEGE)
EDUCATIONAL BACKGROUND:
Address:
Telephone: (805)
English first language: YESHas learning disability: NOVeteran: YES
High school education: HIGH SCHOOL DIPLOMAHighest degree: NO DEGREE AT THIS TIMEYears out of school: 5-10 YEARS 49Years of H.S. English: 4 YEARS IN H.S.Grade in last English class: BHigh School G.P.A.: B- to B, 2. 2.9H.S. last attended: OTHER CALIFORNIA HIGH SCHOOLHighest math completed: GEOMETRYGrade in last math class: CTime since last math: MORE THAN 5 YEARS
COLLEGE PLANS:
WOULD LIKE INFORMATION ABOUT:
VETERANS' PROGRAMCAREER PLANNTNGTRANSFERRIN..)TUTORINGMATH SKILLSWRITING SKILLS
Plan to attend: DAY & EVENINGUnits planned next term: 6-8 Units 0Employment hours planned: 31-40 HOURS/WEEKEducational goal: TWO YEAR DEGREEMajor: BUSINESS ADMINISTRATION/GENERAL BUSINESS (VERY SURE)Transfer college: NOT SPECIFIEDImportance of college to significant others: VERY IMPORTANTImportance of college to self: VERY IMPORTANTAdditional #1 2 3 4 5 6 7 8 9 10 11 12 13 14 15Questions: A
TESTRESULTS: TESTDATE
03/07/9503/07/9503/07/9503/07/9503/07/9503/07/95
COURSE PLACEMENTS:
COMMENTS:
TEST TAKEN
WRITING--CEEB AALGEBRA READINESSREADING--CEEB AWRITING A ADJUST SCRMATH AR ADJUSTED SCRREADING A ADJUST SCR
CORRECT ATTEMPT# % # 96
31 78% 40 100%31 62% 45 90%30 86% 35 100%323331
03/07/95 WRITING: ENGLISH 1A (FRESHMAN COMPOSITION)03/07/95 MATH: MATH A, BUS 50 (FULLY PREPARED)03/07/95 READING: COLLEGE LEVEL READING
LOCALACCURACY %-ILE
78%69%86%
Impact on Writing Placement
Score change from 31 to 32 resulted in ENGLISH 1A placement withoutessay being read.
30
92%97%92%

Appendix 7Reading Placement Examples
ANTELOPE VALLEY COLLEGE
Name:Soc.Sec.#:
Birthdate: Age: 36Sex: MALE English first language: YESEthnicity: HISPANIC Has learning disability: NOAdmission Status: NEW (FIRST TIME IN COLLEGE) Veteran: YES
COUNSELING REPORT
Address:
Telephone: (805)
Page 29
EDUCATIONAL BACKGROUND:
High school education: HIGH SCHOOL DIPLOMAHighest degree: NO DEGREE AT THIS TIMEYears out of school: MORE THAN 10 YEARSYears of H.S. English: 3 YEARS I H.,Grade in last English class: BHigh School G.P.A.: C to B-, 2. - 2.4H.S. last attended: OTHER CALIFORNIA HIGH SCHOOLHighest math completed: BASIC MATHGrade in last math class: CTime since last math: MORE THAN 5 YEARS
COLLEGE PLANS:
WOULD LIKE INFORMATION ABOUT:
FINANCIAL AIDJOB PLACEMENTVETERANS' PROGRAME.O.P.S.ORIENTATION TO COLLEGECAREER PLANNINGCOUNSELINGTRANSFERRINGTUTORINGSTUDY SKILLSMATH SKILLSREADING SKILLSWRITING SKILLS
#
Plan to attend: EVENINGUnits planned next term: 12 Units OR MOREEmployment hours planned: 31-40 HOURS/WEEKWEducational goal: TRANSFER TO A 4 YEAR COLLEGEMajor: GENERAL EDUCATION/LIBERAL STUDIES (VERY SURE)Transfer college: CSU, BAKERSFIELDImportance of college to significant others: VERY IMPORTANTImportance of college to self: VERY IMPORTANTAdditional #1 2 3 4 5 6 7 8 9 10 11 12 13 14 15Questions: A
TESTRESULTS: TESTDATE TEST TAKEN
03/07/9503/07/9503/07/9503/10/9503/07/9503/07/9503/07/95
COURSE PLACEMENTS:
03/07/9503/07/9503/07/95
WRITING--CEEB AALGEBRA READINESSREADING--CEEB AESSAYWRITING A ADJUST SCRMATH AR ADJUSTED SCRREADING A ADJUST SCR
CORRECT ATTEMPT# 0
19 48% 24 60%16 32% 27 54%15 43% 17 49%4
211717
0
LOCALACCURACY % -ILE
79%59%88%
WRITING: ENGLISH 50A (BASIC COMPOSITION AND MECHANICS)MATH: MATH 50READING: ENGLISH 51A (INTERMEDIATE READING)
COMMENTS: Impact on Reading Placement
None - Score change from 15 tonext level placement.
17 not enough - score of 18 necessary
31
for
45%56%25%
a
Page 30
ANTELOPE VALLEY COLLEGE
COUNSELING REPORT
Name:Soc.Sec.#:
Birthdate: Age: 29Sex: MALEEthnicity: WHITE/NOT OF HISPANIC ORIGINAdmission Status: NEW (FIRST TIME IN COLLEGE)
EDUCATIONAL BACKGROUND:
High school education: G.E.D.Highest degree: NO DEGREE AT THIS TIMEYears out of school: MORE THAN 10 YEARSYears of H.S. English: 2 YEARS IN H.S.Grade in last English class: C tHigh School G.P.A.: B- to B, 2.5 - 2.9H.S. last attended: DESERT WINDS HIGH SCHOOLHighest math completed: BASIC MATHGrade in last math class: BTime since last math: MORE THAN 5 YEARS
COLLEGE PLANS:
Plan to attend: DAY & EVENINGUnits planned next term: 9-11 UnitsEmployment hours planned: 11-20 HOURS/WEEKIOEducational goal: TWO YEAR DEGREEMajor: ELECTRONICS TECHNOLOGY (VERY SURE)
Address:
Telephone: (805)
English first language: YESHas learning disability: NOVeteran: NO
WOULD LIKE INFORMATION ABOUT:
FINANCIAL AIDTOB PLACEMENTCHILD CARERE-ENTRY PROGRAMWORK EXPERIENCEORIENTATION TO COLLEGECHOOSING A MAJORCAREER PLANNINGCOUNSELINGTUTORINGSTUDY SKILLSMATH SKILLSREADING SKILLSWRITING SKILLS
Transfer ccllege: NOT SPECIFIEDImportance of college to significant others: VERY IMPORTANTImportance of college to self: VERY IMPORTANTAdditional #1 2 3 4 5 6 7 8 9 10 11 12 13 14 15Questions: A
TEST CORRECT ATTEMPTRESULTS: TESTDATE TEST TAKEN # % # ACCURACY
OCALY5-ILE
03/07/95 WRITING--CEEB A 22 55% 37 93% 59% 50%03/07/95 ALGEBRA READINESS 20 40% 37 74% 54% 82%03/07/95 READING--CEEB A 17 49% 23 66% 74% 33%03/10/95 ESSAY 4
03/07/95 WRITING A ADJUST SCR 2303/07/95 MATH AR ADJUSTED SCR 2203/07/95 READING A ADJUST SCR 18
COURSE PLACEMENTS:
03/07/95 WRITING: ENGLISH 50A (BASIC COMPOSITION AND MECHANICS)03/07/95 MATH: MATH 5003/07/95 READING: ENGLISH 51B (CRITICAL READING SKILLS)
COMMENTS: Impact on Reading Placement
Score change from 17 to 18 resulted in placement one level higher.

Page 31
ANTELOPE VALLEY COLLEGE
COUNSELING REPORT
Name:Soc.Sec.#:
Birthdate: Age.: 19Sex: FEMALEEthnicity: WHITE/NOT OF HISPANIC ORIGINAdmission Status: NEW (FIRST TIME IN COLLEGE)
Address:
Telephone: (805)
English first language: YESHas learning disability: NOVeteran: NO
EDUCATIONAL BACKGROUND: WOULD LIKE INFORMATION ABOUT:
High school education: HIGH SCHOOL DIPLOMAHighest degree: NO DEGREE AT THIS TIMEYears out of school: LESS THAN 1 YEAR 91,Years of H.S. English: 4 YEARS H.S.Grade in last English class: BHigh School G.P.A.: B to A-, 3. 3.4H.S. last attended: ANTELOPE VALLEY ADULT SCHOOLHighest math completed: ALGEBRA IGrade in last math class: FTime since last math: 3-5 YEARS
COLLEGE PLANS:
CHOOSING A MAJORTRANSFERRINGSTUDY SKILLSMATH SKILLS
Plan to attend: DAYUnits planned next term: 9-11 U 'tsEmployment hours planned: NONE tiEducational goal: TRANSFER TO A YEAR COLLEGEMajor: UNDECLARED MAJOR--UNDECIDED (UNSURE)Transfer college: NOT SPECIFIEDImportance of college to significant others: VERY IMPORTANTImportance of college to self: VERY IMPORTANTAdditional #1 2 3 4 5 6 7 8 9 10 11 12 13 14 15Questions: A
TEST CORRECT ATTEMPT LOCALRESULTS: TESTDATE TEST TAKEN # # % ACCURACY %-ILE
03/07/95 WRITING--CEEB A 31 78% 40 100% 78% 92%03/07/95 ALGEBRA READINESS 19 38% 31 62% 61% 71%03/07/95 READING--CEEB A 27 77% 35 100% 77% 79%03/07/95 WRITING A ADJUST SCR 3203/07/95 MATH AR ADJUSTED SCR 2003/07/95 READING A ADJUST SCR 29
COURSE PLACEMENTS:
COMMENTS:
03/07/95 WRITING: ENGLISH 1A (FRESHMAN COMPOSITION)03/07/95 MATH: MATH 5003/07/95 READING: COLLEGE LEVEL READING
Impact on Reading Placement
Score change from 27 to 29 resulted in placement
33
one level higher.

Name:Soc.Sec.#:
Appendix 8Math Placement Examples
ANTELOPE VALLEY COLLEGE
COUNSELING REPORT
Birthdate: Age: 15Sex: MALEEthnicity: WHITE/NOT OF HISPANIC ORIGINAdmission Status: NEW (FIRST TIME IN COLLEGE)
EDUCATIONAL BACKGROUND:
High school'education: H.S. PROFICIENCYHighest degree: NO DEGREE AT THIS TIMEYears out of school: STILL IN SCHOOL W7Years of H.S. English: 3 YEARS IN H.S.Grade in last English class: AHigh School G.P.A.: B to A-, 3.0 3.4H.S. last attended: OTHER CALIFORNIA HI SCHOOLHighest math completed: ALGEa; IIGrade in last math class: BTime since last math: CURRENTLY ENROLLED IN MATH
Address:
Telephone: (805)
English first language: YESHas learning disability: NOVeteran: NO
COLLEGE PLANS:
Page 32
WOULD LIKE INFORMATION ABOUT:
CHOOSING A MAJORCAREER PLANNINGMATH SKILLSWRITING SKILLS
Plan to attend: DAYUnits planned next term: 9-11 UnitsEmployment hours planned: 1-10 HOURS/WEEKEducational goal: TRANSFER TO A 4 YEAR COLLEGEMajor: PRE MEDICINE (UNSURE)Transfer college: PRIVATE COLLEGE OR UNIVERSITYImportance of college to significant others: VERY IMPORTANTImportance of college to self: VERY IMPORTANTAdditional #1 2 3 4 5 6 7 8 9 10 11 12 13 14Questions: A
15
TEST CORRECT ATTEMPTRESULTS: TESTDATE
COURSE
03/07/9503/07/9503/07/9503/07/9503/07/9503/07/95
PLACEMENTS:
COMMENTS:
TEST TAKEN
WRITING--CEEB AINTERMEDIATE ALGEBRA CREADING--CEEB AWRITING A ADJUST SCRMATH IA ADJUSTED SCRREADING A ADJUST SCR
3124 53%30 86%322731
7896 40 100%31 69%35 100%
LOCALACCURACY %-ILE
79%77%86%
03/07/95 WRITING: ENGLISH 1A (FRESHMAN COMPOSITION)03/07/95 MATH: MATH D,6,14,15, CIS 41 (RECOMMEND MATH C)03/07/95 READING: COLLEGE LEVEL READING
Impact on Math Placement
None - need to take Precalculus test to
34
achieve higher placement.
92%50%92%
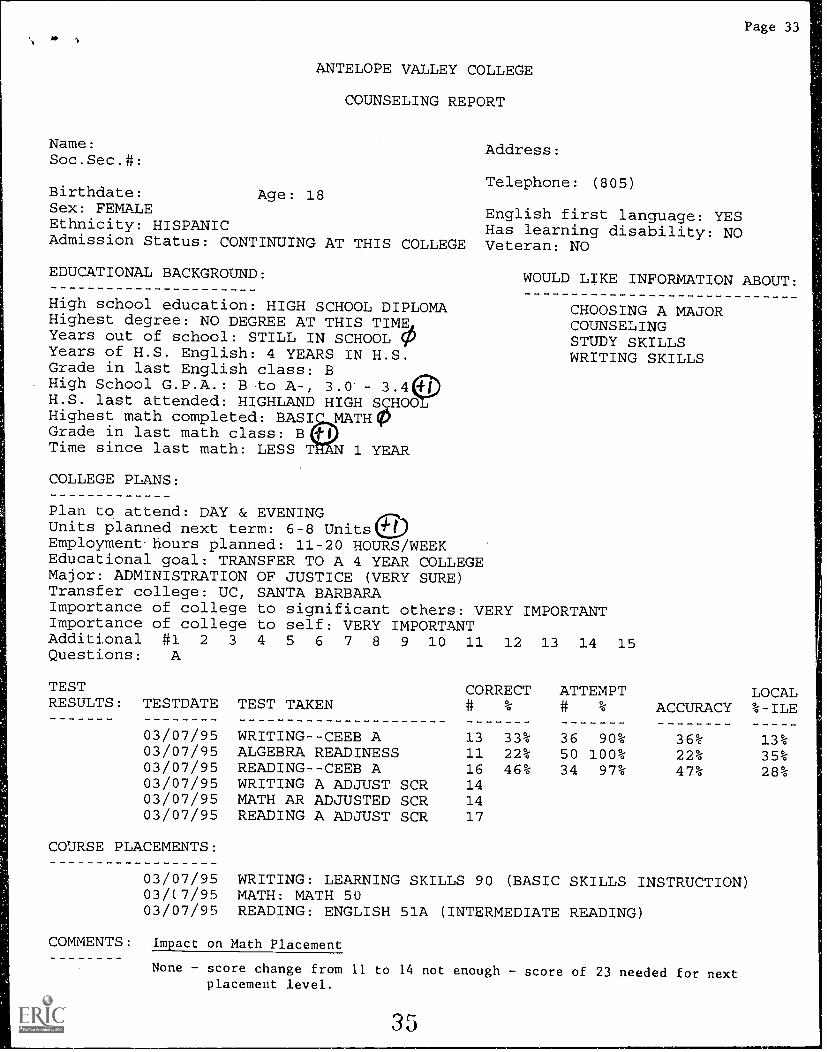
Page 33
ANTELOPE VALLEY COLLEGE
COUNSELING REPORT
Name:Soc.Sec.#:
Birthdate: Age: 18Sex: FEMALEEthnicity: HISPANICAdmission Status: CONTINUING AT THIS COLLEGE
EDUCATIONAL BACKGROUND:
High school education: HIGH SCHOOL DIPLOMAHighest degree: NO DEGREE AT THIS TIMEIYears out of school: STILL IN SCHOOL 92Years of H.S. English: 4 YEARS IN H.S.Grade in last English class: B
PH.S. last attended: HIGHLAND HIGH SCHOHigh School G.P.A.: B to A-, 3.0' 3.4
Highest math completed: BASI MATHOGrade in last math class: BTime since last math: LESS TV 1 YEAR
COLLEGE PLANS:
Address:
Telephone: (805)
English first language: YESHas learning disability: NOVeteran: NO
WOULD LIKE INFORMATION ABOUT:
CHOOSING A MAJORCOUNSELINGSTUDY SKILLSWRITING SKILLS
Plan to attend: DAY & EVENINGUnits planned next term: 6-8 Units '{'tEmployment hours planned: 11-20 HOURS/WEEKEducational goal: TRANSFER TO A 4 YEAR COLLEGEMajor: ADMINISTRATION OF JUSTICE (VERY SURE)Transfer college: UC, SANTA BARBARAImportance of college to significant others: VERY IMPORTANTImportance of college to self: VERY IMPORTANTAdditional #1 2 3 4 5 6 7 8 9 10 11 12 13 14Questions: A
TESTRESULTS: TESTDATE
COURSE
03/07/9503/07/9503/07/9503/07/9503/07/9503/07/95
PLACEMENTS:
03/07/9503/( 7/9503/07/95
TEST TAKEN
WRITING--CEEB AALGEBRA READINESSREADING--CEEB AWRITING A ADJUST SCRMATH AR ADJUSTED SCRREADING A ADJUST SCR
15
CORRECT ATTEMPT# % # %
13 33% 36 90%11 22% 50 100%16 46% 34 97%141417
LOCALACCURACY %-ILE
36%22%47%
WRITING: LEARNING SKILLS 90 (BASIC SKILLS INSTRUCTION)MATH: MATH 50READING: ENGLISH 51A (INTERMEDIATE READING)
COMMENTS: Impact on Math Placement
None score change fromplacement level.
11 to 14 not
35
enough - score of 23 needed for next
13%35%28%

Page 34
ANTELOPE VALLEY COLLEGE
COUNSELING REPORT
Name:Soc.Sec.#:
Birthdate: Age: 39Sex: FEMALEEthnicity: WHITE/NOT OF HISPANIC ORIGINAdmission Status: RETURNING TO THIS COLLEGE
EDUCATIONAL BACKGROUND:
High school education: HIGH SCHOOL DIPLOMAHighest degree: NO DEGREE AT THIS TIMEYears out of school: LESS THAN 1 YEAROYears of H.S. English: 4 YEARS IN H.S.Grade in last English class: BHigh School G.P.A.: B to A-, 3.0 3.4H.S. last attended: OTHER CALIFORNIA HIGH SCHOOLHighest math completed: GEOM RYGrade in last math class BTime since last math: MORE T 5 YEARS
Address:
Telephone: (805)
English first language: YESHas learning disability: NOVeteran: NO
COLLEGE PLANS:
WOULD ilIKE INFORMATION ABOUT:
JOB PLACEMENTLEARNING DISABILITIESRE-ENTRY PROGRAMCAREER PLANNINGCOUNSELINGSTUDY SKILLS
Plan to attend: DAY & EVENINGUnits planned next term: 6-8 Units()Employment hours planned: 21-30 HOURS/WEEKEducational goal: VOCATIONAL TRAINING/CERTIFICATEMajor: SOCIAL SCIENCES (FAIRLY SURE)Transfer college: NOT SP7,CIFIEDImportance of college to significant others: SOMEWHAT IMPORTANTImportance of college to self: VERY IMPORTANTAdditional #1 2 3 4 5 6 7 8 9 10 11 12 13 14 15Questions: A
TESTRESULTS: TESTDATE
COURSE
03/07/9503/07/9503/07/9503/10/9503/07/9503/07/9503/07/95
PLACEMENTS:
COMMENTS:
03/07/9503/07/9503/07/95
TEST TAKEN
WRITING--CEEB AALGEBRA READINESSREADING--CEEB AESSAYWRITING A ADJUSTMATH AR ADJUSTEDREADING A ADJUST
SCRSCRSCR
CORRECT ATTEMPT# % # %
30 75%19 38%18 51%8
312319
LOCALACCURACY %-ILE
40 100% 75% 82%23 46% 81% 71%35 100% 51% 38%
WRITING: ENGLISH 1A (FRESHMAN COMPOSITION)MATH: MATH A, BUS 50 (RECOMMEND MATH 50)READING: ENGLISH 51B (CRITICAL READING SKILLS)
Impact on Math Placement
Score change from 19 to 23 resulted in placement one
36
level higher.

Appendix 9S m
ANTELOPE VALLEY COLLEGE
CUTOFF SCORES FOR PLACEMENT EXAMS
CUTOFF SCORES FOR WRITING PLACEMENT EXAMS
If your AdjustedWriting Score is:
and your EssayScore is: You Qualify for:
0-14 NA Learning Skills 90 - Developmental Learning Skills
15-20 NA* English 50A - Basic Composition
1 21-23 0-5 English 50A - Basic Composition
21-23 6-8 English 50B - Intermediate Composition
24-25 NA English 50B - Intermediate Composition
26-31 0-7 English 50B - Intermediate Composition
26-31 8 English lA - Freshman Composition
32-40 NA* English lA - Freshman Composition
NA = Essay not utilized
CUTOFF SCORES FOR READING PLACEMENT EXAMS
If your Adjusted Reading Score is:CEEB SDRT
You Qualify for:
0-8 0-41 Learning Skills 90 - Developmental Learning Skills
9-17 42-49 English 51A - Intermediate Reading
18-27 50-52 English 5113 - Critical Reading & Study Skills
28-35 53-60 College Level Reading (no course)
CUTOFF SCORES FOR MATH PLACEMENT EXAM
If your Adjusted Math Test Score is: You Qualify for:
Algebra Readiness Test0-10 Math 60
11-22 Math 50
23-30 Math A; Bus 50 (Recommend Math 50)
31-44 Math A; Bus 50 (Fully prepared)
45-50 Math A; Bus 50 (Recommend Elementary Algebra Test)
Elementary Algebra Test0-6 Math 50
7-14 Math A; Bus 50 (Recommend Math 50)
15-19 Math A; Bus 50 (Fully prepared)
20-24 Math B,C; Elect 40A (Recommend Math A)
25-44. Math B,C; Elect 40A (Fully prepared)
45-50 Math B,C; Elect 40A (Recommend Intermediate Algebra Test)
c.1formskasmtscor.shtRev 9/94
Page 35
ft
$1
CUTOFF SCORES FOR MATH PLACEMENT EXAM (continued)
If your Adjusted Math Test Score Is: You Qualify for:
Intermediate Algebra Test0-9 Math A; Bus 50 (Recommend Math 50)
10-12 Math A; Bus 50 (Recommend Elementary Algebra Test)
13-15 Math B,C; Elect 40A (Recommend Math A)
16-20 Math B,C; Elect 40A (Fully prepared)
21-31 Math D, 6, 14, 15; CIS 41 (Recommend Math C)
32-43 Math D, 6, 14, 15; CIS 41 (Fully prepared)
44-45 Math D, 6, 14, 15; CIS 41 (Recommend Precalculus Test)= ==---===== a= a a a se = = = a St a = = = = = = = =
Precalculus Test0 -8 Take Intermediate Algebra Test
9-10 Math B,C; Elect 40A (Fully prepared)
11-18 Math D, 6, 14, 15; CIS 41 (Recommend Math C)
19-22 Math D, 5, 6, 14, 15; CIS 41 (Fully prepared)
23-27 Math 7A (Recommend Math D, 6, 5)
28-40 Math 7A (Fully prepared)
38c:Vomukasmucor.shtRev. 9/94
Page 36

Name:
Antelope Valley CollegePREREQUISITE CHALLENGE FORM
. Phone: Street Address:
SSN: Date Submitted:
Appendix 10Page 37
City/State/Zip:A Separate form must be completed for each course you wish to enter. This form must be submitted before the first dayof the term. All forms must be submitted to the Counseling C:mter (Student Services Building).
Course I wish to enter. Prerequisite, corequisite, or limitation on enrollment Iwish to charenge:
Challenc.ie CategoriesCheck the box which applies to you:
1.Challenging the prerequisite, corequisite, or limitation on enrollment on the grounds that it has not been madereasonably available. The Division Dean or designee shall determine within 5 working days whether the required coursewas reasonably available, and if not, shall waive the prerequisite for the term. Students wishing to appeal the decisionof the Division Dean or designee may do so by meeting with the Vice President of Academic Affairs or designee.
2. Challenging the prerequisite, corequisite, or limitation on enrollment based on my knowledge or ability tosucceed in the course despite not meeting the stated conditions of enrollment (student documentationrequired). I understand that I must attach documentary evidence in support of the challenge. The Division Dean willarrange for the Instructors who will evaluate the documentation and provide written notification to me within 5 workingdays. Students wishing to appeal thl decision of the instructor may do so by meeting with the Division Dean.
3. Challenging the prerequisite, corequisite, or limitation on enrollment on the grounds that it was established inviolation of regulation or in violation of the District-approved processes (student documentation required).The Dean of Counseling or designee shall review the petition and provide written notification to the student within 5working days. Students wishing to appeal the decision of the Dean of Counseling or designee may do so bymeeting with the Vice President of Academic Affairs or designee.
4. The prerequisite, corequisite, or-limitation on enrollment is discriminatory or applied in a discriminatorymanner (student documentation required). I understand that I must present documentary evidence to the Dean ofCounseling or designee who will review the evidence and provide written notification to me within 5 working days.Students wishing to appeal the decision of the Dean of Counseling or designee may do so by meeting with theVice President of Academic Affairs.
Petition to Challenge (Attach Documentation)It is the responsibility of the student to provide compelling evidence to support the Challenge.
I acknowledge that Antelope Valley College has determined that this prerequisite is necessary for success in the course and thatI am taking personal responsibility for succeeding without this prerequisite.
Student Signature: (My request must be made prior to the first day of the term.)Upon completing this Challenge form you may enroll in the Challenge course by presenting this form at the Counseling Centerduring registration. If this Challenge is not upheld, you will be dropped from the course. If no space is available in the coursewhen the Challenge is filed and, if the Challenge is upheld, you will be permitted to enroll in rr,e subsequent term provided thatspace is available when you register.
For Official Use Only:Action Taken: approved not approved
Comments:
Reviewers name. Signature
Date:
Note: AN forms are to be returned to the Office of the Dean of Counseling.
39
C.Vmmskprechall.pm5

Alb
Page 38
PREREQUISITES, COREQUISITES, ADVISORIES ONRECOMMENDED PREPARATION, AND LIMITATIONS ON ENROLLMENT
Definitions
Prerequisite - A condition of enrollment that a student is required to meet in order to demonstrate current readinessfor enrollment in a course or educational program. A prerequisite will assure that a student has the skills, concepts,and/or information necessary for success in the course; on the other hand, a student who has not met the prerequisiteis highly unlikely to receive a satisfactory grade in the course. Prerequisites are enforced and a student will beblocked from enrolling if the student does not meet the stated prerequisite (see below for challenge procedure).
Corequisite A condition of enrollment consisting of a course that a student is required to simultaneously take inorder CO enroll in another course. Corequisites are enforced and a student will be blocked from enrolling if thestudent does not meet the stated prerequisite (see below for challenge procedure).
Advisory on recommended preparation A condition of enrollment that a student is advised, but not required, tomeet before or in conjunction with enrollment in a course or educational program.
Limitation on enrollment - A condition of enrollment which limits how students qualify for a particular course orprogram. These limitations apply to courses that include public performance or intercollegiate competition wherea try-out or audition is necessary. Additionally, some courses require formal admission to a particularprogram inorder to enroll (e.g., Associate Degree Nursing Program and Licensed Vocational Nursing Program). Limitationson enrollment are enforced and a student will be blocked from enrolling if the student does not meet the statedlimitation (see below for challenge procedure).
Challenge Procedure
A prerequisite, corequisite, or limitation on enrollment challenge requires the submission of a Prerequisite ChallengeForm. This form can be obtained from the Counseling Center in the Student Services Building. A student mayfile a Prerequisite Challenge Form for one or more of the following reasons.
I) A prerequisite or corequisite is not reasonably available;
2) The student believes the prerequisite was established in violation of regulation or in violation of theDistrict-approved processes;
3) The student believes the prerequisite is discriminatory or being applied in a discriminatory manner and hasdocumentation for such a claim; or
4) The student has the documented knowledge or ability to succeed in the course without meeting theprerequisite.
Upon completing this challenge form the student may enroll in the challenge course by presenting this form at theCounseling Center during registration. If this challenge is not upheld, the student will be dropped from the course.If no space is available in the course when the challenge is filed and, if the challenge is upheld, the student will bepermitted to enroll in the subsequent term provided that space is available at the time the student registers.
h %ohmic \prereq pro 40