multisensory integration in self motion perception · 4 german center for vertigo, university...
TRANSCRIPT

Multisensory Research (2016) DOI:10.1163/22134808-00002527 brill.com/msr
Multisensory Integration in Self Motion Perception
Mark W. Greenlee 1,∗, Sebastian M. Frank 1,6, Mariia Kaliuzhna 2, Olaf Blanke 2,
Frank Bremmer 3, Jan Churan 3, Luigi F. Cuturi 4, Paul R. MacNeilage 4
and Andrew T. Smith 5
1 Institute of Experimental Psychology, University of Regensburg, Regensburg, Germany2 Center for Neuroprosthetics, Laboratory of Cognitive Neuroscience, Ecole Polytechnique
Fédérale de Lausanne, EPFL, Switzerland3 Department of Neurophysics, University of Marburg, Marburg, Germany
4 German Center for Vertigo, University Hospital of Munich, LMU, Munich, Germany5 Department of Psychology, Royal Holloway, University of London, UK
6 Department of Psychological and Brain Sciences, Dartmouth College, Hanover, NH, USA
Received 23 September 2015; accepted 24 January 2016
AbstractSelf motion perception involves the integration of visual, vestibular, somatosensory and motor sig-nals. This article reviews the findings from single unit electrophysiology, functional and structuralmagnetic resonance imaging and psychophysics to present an update on how the human and non-human primate brain integrates multisensory information to estimate one’s position and motion inspace. The results indicate that there is a network of regions in the non-human primate and humanbrain that processes self motion cues from the different sense modalities.
KeywordsVisual–vestibular integration, self motion perception, single-unit electrophysiology, magnetic reso-nance imaging, psychophysics, eye movements, somatosensory thresholds, optic flow perception
1. Introduction
We experience our environment via a continuous exchange between our dif-ferent sense modalities in order to optimally plan and execute behavioralresponses to these sensory signals. Oftentimes signals from the environment
* To whom correspondence should be addressed.E-mail: [email protected]
© Koninklijke Brill NV, Leiden, 2016 DOI:10.1163/22134808-00002527

2 M. W. Greenlee et al. / Multisensory Research (2016)
are weak, noisy and ambiguous. As an example, while riding in a vehicle,retinal motion arises from self motion induced by locomotion, object motionevoked by independently moving objects (other vehicles or pedestrians), eyeand head movements in order to monitor the surrounding traffic (e.g., oncom-ing vehicles, lead car, etc.) and accompanying vestibular and somatosensorysensations. The challenge the brain is confronted with is to analyze these in-coming signals and extract an accurate representation of one’s self moving inthe environment. Multisensory integration of the different incoming sensorysignals enhances our ability to more accurately represent the current scene,to draw conclusions about the nature of the objects that lead to these sen-sory signals and to execute the appropriate behavior to interact with animate(i.e., moving) and inanimate (i.e., stationary) objects in our environment, evenwhen we ourselves are in motion (Sereno and Huang, 2014). Such complexprocessing of sensory information from different modalities requires efficientintegration to be able to respond quickly to the demands placed on us by ourenvironment. Indeed, impairment in any one of these sense systems can leadto maladaptation and thus suboptimal behavior (Andersen et al., 1997).
Self motion perception involves the integration of sensory signals aris-ing from the visual, vestibular, somatosensory and motor systems (Bremmer,2011; Britten, 2008; Greenlee, 2000; Lappe et al., 1999). To differentiate be-tween the retinal image motion evoked by one’s own movement from imagedisplacements arising from object motion the brain needs to integrate signalsrelated to head and body motion with motion signals of external objects. Lin-ear acceleration or rotations of the head lead to changes in endolymph flowin the otoliths and semicircular canals of the vestibular organ (Barany, 1907;Lopez et al., 2012). Optic flow, on the other hand, provides rich visual infor-mation above self motion in space (Koenderink, 1986). Since the eyes movewith respect to the head and the head moves with respect to the trunk, the brainneeds to parse these different signal sources to disambiguate self motion inspace (i.e., heading — Gibson, 1950; Van den Berg, 1993; Warren and Han-non, 1988) from object motion and retinal slip due to eye/head movements(Duffy, 2000; Lappe et al., 1999). The cortical representations of these vi-sual, vestibular and somatosensory inputs, as well as their combinations, havebeen extensively studied (for reviews, see Angelaki et al., 2011; Guldin andGrüsser, 1998; Hitier et al., 2014; Lopez and Blanke, 2011). In this reviewwe provide an update on progress in research that should deepen our under-standing of how the brain combines multisensory cues to disambiguate motionsignals arising when the organism itself is in motion. In addition, we will alsoexamine how eye movements affect perceived heading during self motion per-ception and how visual–vestibular cues for self motion modulate other sensemodalities like touch. We focus primarily on our own results based on themethods we have available in our own laboratories.

Multisensory Research (2016) DOI:10.1163/22134808-00002527 3
2. Eye Movement Invariant Heading Encoding in Monkeys
Neurophysiological research over the past thirty years has shown in the animalmodel, i.e., the macaque monkey, how visual, vestibular, tactile and auditorysignals interact to enhance and disambiguate the perception of heading dur-ing self motion. Two cortical areas, i.e., the medial superior temporal area(area MST) and the ventral intraparietal area (area VIP), proved to be of spe-cific importance in this context. Neurons in area MST respond to visual andvestibular self motion signals (Bremmer et al., 1999; Duffy, 1998; Duffy andWurtz, 1991a, b; Lappe et al., 1996; Page and Duffy, 2003; Yu et al., 2010).Their causal role in heading perception has been confirmed by numerous stud-ies (Gu et al., 2007, 2008, 2010, 2012; Morgan et al., 2008). Neurons in areaVIP respond not only to visually simulated and real (vestibular) self motion,but also to tactile and auditory stimulation (Avillac et al., 2005, 2007; BenHamed et al., 2002; Bremmer et al., 2002a, b; Chen et al., 2011; Duhamel etal., 1998; Schlack et al., 2002). Behavioral experiments have likewise demon-strated a causal role of area VIP for heading perception (Britten, 2008; Chenet al., 2013; Zhang et al., 2004). Importantly, functional equivalents of bothareas have been identified in human visual cortex (area MST: e.g., Dukelow etal., 2001; Huk et al., 2002; Morrone et al., 2000; area VIP: Bremmer et al.,2001; Sereno and Huang, 2006; Wall and Smith, 2008). Accordingly, a betterunderstanding of the processing of self motion information at the cellular levelin the animal model will also advance our understanding of the same processesin humans.
Neurons in macaque areas MST and VIP integrate visual and vestibularself motion signals with extraretinal or eye movement information to disso-ciate self induced motion from object motion (area MST: e.g., Bradley et al.,1996; Shenoy et al., 1999; Upadhyay et al., 2000; area VIP: Zhang and Britten,2011). Such multisensory convergence of self motion signals is clearly suitedto improve heading. Nevertheless, perceptual performance could be further en-hanced if single neurons were capable of deducing heading information fromvisual signals alone. Accordingly, in two recent studies, we investigated if neu-rons in areas MST and VIP can encode heading solely based on visual signals(Bremmer et al., 2010; Kaminiarz et al., 2014). More specifically, we askedif such neurons would keep their heading selectivity regardless of whether ornot the retinal flow resulting from a simulated forward motion was disturbedby superimposed simulated eye movements of various gains.
Experimental methods followed standard procedures and were described indetail in earlier studies (Bremmer et al., 2009, 2010; Kaminiarz et al., 2014;Morris et al., 2012). Optic flow stimuli were back projected onto a tangentscreen (width × height: 90° × 90°), which was located 48 cm in front of themonkey and simulated self motion of a virtual observer over an extended hor-

4 M. W. Greenlee et al. / Multisensory Research (2016)
izontal plane located 37 cm below eye-level. Stimuli simulated self motionat 1 m/s in one of three directions: 30° to the left, straight-ahead, and 30° tothe right. These three self motion directions were combined with three differ-ent gains of simulated eye movements: gain = 0.0 (fixed gaze), gain = 0.5(aiming at the natural viewing behavior as indicated by Lappe et al., 1998),and gain = 1.0 (imitating perfect tracking of a stationary target on the groundplane). These nine different stimulus conditions were presented in pseudo-randomized order across trials and were combined with blocks of trials duringwhich the animals were allowed to perform spontaneous, unrestrained eyemovements. Here, the same three different self motion directions as in thesimulated eye movement condition were presented in pseudo-randomized or-der.
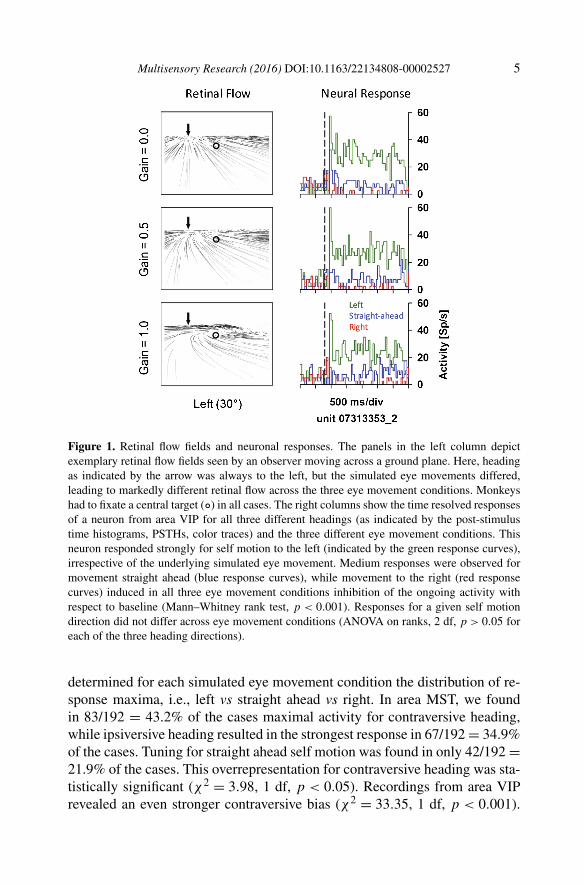
We recorded 84 MST neurons and 68 VIP neurons from three awake behav-ing monkeys. About three quarters of the cells revealed a significant stimulusdriven response: 64/84 = 76% in area MST and 48/68 = 71% in area VIP(ANOVA on ranks, 9 degrees of freedom [df], p < 0.05). An example for aresponse of a neuron from area VIP is shown in Fig. 1. This neuron’s headingtuning was invariant with respect to the simulated smooth eye movement.
In order to quantify heading at the population level, we ranked the responsestrength of each individual neuron for a given self motion direction across thethree simulated eye movement conditions, as detailed in Bremmer et al. (2010)and Kaminiarz et al. (2014).
For a given heading direction, this ranking procedure theoretically couldresult in 3 × 3 × 3 = 27 different outcomes, which we termed rank-ordertriplets. Figure 2A and B shows the distribution of the observed rank-ordertriplets for areas MST (light grey/orange bars) and VIP (medium grey/greenbars) as well as average data (Fig. 2B, dark grey/blue bars).
For both areas, MST and VIP, as well for the averaged data, we founda strong and statistically significant overrepresentation of eye movement in-variance. This result was based on the analysis of long response windows(2500 ms). In everyday life, however, such an integration time would be far toolong to be functional during navigation. We hence were interested to determinehow long the neurons would take to establish these response patterns. Thetime courses for eye movement invariance 〈1-1-1〉 and a random distribution〈1-2-3〉 are shown in Fig. 2C and D. For increasingly longer integration win-dows, exponential functions with time constants tau in the order of τ = 400 mscould be significantly fitted to the data.
In the single-cell example shown in Fig. 1, responses for leftward head-ing were strongest for all three simulated eye movement conditions. This VIPneuron was recorded from a monkey’s right hemisphere. Based on this finding,we were interested to determine whether or not such tuning for contraversiveheading was representative for the populations of neurons in both areas. We
Multisensory Research (2016) DOI:10.1163/22134808-00002527 5
Figure 1. Retinal flow fields and neuronal responses. The panels in the left column depictexemplary retinal flow fields seen by an observer moving across a ground plane. Here, headingas indicated by the arrow was always to the left, but the simulated eye movements differed,leading to markedly different retinal flow across the three eye movement conditions. Monkeyshad to fixate a central target (◦) in all cases. The right columns show the time resolved responsesof a neuron from area VIP for all three different headings (as indicated by the post-stimulustime histograms, PSTHs, color traces) and the three different eye movement conditions. Thisneuron responded strongly for self motion to the left (indicated by the green response curves),irrespective of the underlying simulated eye movement. Medium responses were observed formovement straight ahead (blue response curves), while movement to the right (red responsecurves) induced in all three eye movement conditions inhibition of the ongoing activity withrespect to baseline (Mann–Whitney rank test, p < 0.001). Responses for a given self motiondirection did not differ across eye movement conditions (ANOVA on ranks, 2 df, p > 0.05 foreach of the three heading directions).
determined for each simulated eye movement condition the distribution of re-sponse maxima, i.e., left vs straight ahead vs right. In area MST, we foundin 83/192 = 43.2% of the cases maximal activity for contraversive heading,while ipsiversive heading resulted in the strongest response in 67/192 = 34.9%of the cases. Tuning for straight ahead self motion was found in only 42/192 =21.9% of the cases. This overrepresentation for contraversive heading was sta-tistically significant (χ2 = 3.98, 1 df, p < 0.05). Recordings from area VIPrevealed an even stronger contraversive bias (χ2 = 33.35, 1 df, p < 0.001).

6 M. W. Greenlee et al. / Multisensory Research (2016)
Figure 2. Population responses. Panels A and B depict the distribution of rank-order tripletsfor areas MST (light grey, online version: orange) and VIP (medium grey, online version:green) as raw numbers (A) and in percent (B). Data from 64 MST neurons and 48 VIP neuronsresulted in a set of n = 64 × 3 + 48 × 3 = 336 rank-order triplets. Peak average dischargesfor identical heading directions (i.e., triplet 〈1-1-1〉) were observed in 60/336 = 17.9% of thecases. Weakest discharges for identical headings (〈3-3-3〉) occurred in 62/336 = 18.4% of thecases and medium discharges for identical headings (〈2-2-2〉) occurred in 44/336 = 13.1%of the cases. Each of these rank-order triplets indicates the invariance of a neuron’s headingresponse with respect to simulated eye movements. Considering the occurrence of these threetriplets together, eye movement invariances were found in 168/336 = 49.4% of the cases.

Multisensory Research (2016) DOI:10.1163/22134808-00002527 7
Preferred contraversive heading was found in 97/144 = 67.4% of the cases.Maximum responses for ipsiversive and forward heading were found in only20/144 = 13.9% and 27/144 = 18.7% of the cases, respectively.
Forty-nine neurons from area MST and 37 neurons from area VIP wererecorded for a sufficiently long time to investigate the self motion tuning alsoduring real eye movements. In blocks of trials, we removed the central fixa-tion point. As expected from the literature (e.g., Lappe et al., 1998), optic flowstimuli elicited spontaneous eye movements that often followed the visual mo-tion experienced along the direction of gaze. We ranked also the responsesduring these real eye movements (not shown here). The resulting ranks werecombined with the rank-order triplets from the simulated eye movement con-dition, resulting in rank-order quadruplets (Fig. 2E). Considering both areastogether, eye movement invariances (〈1-1-1-1〉, 〈2-2-2-2〉, and 〈3-3-3-3〉) werefound in 96/257 = 37% of the cases, i.e., significantly more often than ex-pected if responses across eye movement conditions had been independent(χ2 = 87.81, 1 df, p < 0.001).
From a system’s point of view, visual consequences of real eye movementsare predictable by means of efference copy or corollary discharge signals(Sperry, 1950; von Holst and Mittelstaedt, 1950). These signals could be usedto obtain a net signal of optic flow as induced purely by self motion. Such acompensatory mechanism, however, was not possible for simulated eye move-ment conditions, for which distortions were not predictable. Hence, we were
Figure 2 (Continued). This proportion was significantly larger than would have been expected,if responses for a given heading direction across the different eye movement conditions hadbeen independent (χ2 = 117.5, 1 df, p < 0.001). Importantly, we found this overrepresentationof eye movement invariance in each of the two areas individually: in 82/192 = 42.7% of thecases in area MST (χ2 = 49.4, 1 df, p < 0.001), and in 84/144 = 58.3% of the cases in area VIP(χ2 = 72.6, 1 df, p < 0.001). Panels C and D depict the time courses of the establishment ofeye movement invariance (〈1-1-1〉) and of a random response scheme (〈1-2-3〉). Panel E depictsthe distribution of the rank-order quadruplets. In area MST, we found a coincidence of headingpreferences for simulated and real eye movements (rank-order quadruplet 〈1-1-1-1〉) in 20 outof 147 cases (13.6%). The weakest response for a given heading direction (〈3-3-3-3〉) was ob-served in 19/147 = 12.9% of the cases. A medium response for a given heading (〈2-2-2-2〉) wasfound in 13/147 = 8.8% of the cases. Each observed number of cases of the three eye move-ment invariances occurred significantly more often than would have been expected if tuningshad been distributed uniformly (smallest χ2 value = 8.5, 1 df, p < 0.005). A similar result wasobtained from the population of VIP neurons. Here, response peaks for a given heading direc-tion were observed in 16/111 = 14.4% of the cases. Medium and weakest responses for a givenheading direction were found in 18/111 = 16.2% and 10/111 = 9% of the cases, respectively.Again, each of these proportions differed significantly from a uniform distribution (smallestχ2 value = 5.64, 1 df, p < 0.03). Panel F shows the distribution of the response modulation forsimulated (abscissa) and real (ordinate) eye movements. For details see main text. This figure ispublished in colour in the online version.

8 M. W. Greenlee et al. / Multisensory Research (2016)
interested in the question, if we could find any indication for predictive signalsduring real eye movements and (if so) how they would be represented at theneural level. As a first step, we determined for each of the three heading di-rections the median firing rates as obtained in the four different eye movementconditions. For area MST, for none of the three heading directions a differencein response strength during real and simulated eye movements was found (re-peated measures ANOVA on ranks, 3 df; left: p > 0.4, straight-ahead: p > 0.2,and right: p > 0.9, respectively). For area VIP, this was also true in almost allof the cases. Only for rightward heading, average discharges during real eyemovements were significantly smaller than during simulated eye movementswith gain = 1.0 and 0.0 (each: p < 0.05).
In a second step of our population analysis, we computed for each eyemovement condition the response modulation (RM), i.e., the difference be-tween the maximum (preferred heading) and the minimum response (non-preferred heading,. Fig. 2F). For the population of VIP neurons, most datapoints fell below the identity line (χ2 = 13.89, 1 df, p < 0.001). This meansthat in most cases, RM during simulated eye movements was larger thanduring the real eye movement, which is indicative of an efference copy orpredictive signal reducing response modulations during real eye movements.An analogue result was obtained for area MST (χ2 = 3.98, 1 df, p < 0.05).
Taken together, we have used the simulated eye movement technique (War-ren and Hannon, 1990) to show that neurons in macaque areas MST and VIPrespond selectively to heading irrespective of the occurrence of tracking eyemovements. Crucially, this invariant response was derived from purely visualmechanisms. Such invariant heading responses require complicated visual tun-ing of heading detectors. The receptive field (RF) structure of MST and VIPneurons is not fully understood but known to be complex (MST: Yu et al.,2010, VIP: Chen et al., 2014). The existence of neuronal mechanisms thatdetermine heading visually from distorted flow fields was proposed in sev-eral neural models for heading detection (Beintema and Van den Berg, 1998;Lappe and Rauschecker, 1993, 1994; Perrone and Stone, 1994). Curiously,these models share the prediction of a bi-circular (RF) structure (Beintema etal., 2004). It will be interesting to see how the receptive fields of invariantheading detectors in areas MST and VIP are structured.
In addition to compensatory mechanisms based purely on visual informa-tion, we also found evidence for non-visual or extraretinal signals being in-volved in self motion processing. In blocks of trials, monkeys were allowed tofreely move their eyes. This resulted typically in reflexive eye movements be-ing composed of slow tracking phases and fast resetting eye movements. Here,different from the simulated eye movement conditions, eye movement sig-nals (efference copy or corollary discharge) were available. Such extraretinalsignals are thought to help dissociating self induced from externally induced

Multisensory Research (2016) DOI:10.1163/22134808-00002527 9
motion (Erickson and Thier, 1991; Sommer and Wurtz, 2008). Galletti andcolleagues (Galletti et al., 1984, 1988, 1990) have described real motion cellsin a number of visual cortical areas of the monkey. In these studies, opti-mized visual stimuli (bars) were moved across the retina in two conditions:either passively, i.e., by moving the stimulus across the screen while the mon-key was fixating, or actively, i.e., when the monkey performed smooth pursuiteye movements, thereby moving the receptive field of the neuron under studyacross the screen stationary stimulus. Remarkably, 9% of the neurons in areaV1, 14% in area V2, and 41% in area V3a responded only or significantlystronger in the passive condition, i.e., when the stimulus movement was dueto external motion. Also in area V6, a considerable proportion of neurons re-vealed such a real motion behavior (Galletti and Fattori, 2003). Importantly, acorrelate of this functional property has been described also in human area V6(Fattori et al., 2009; Gamberini et al., 2015).
In our study, we observed an implicit neural signature of such predictiveprocessing. Response modulation (RM) between strongest and weakest dis-charges was generally smallest for the real eye movement condition as com-pared to all simulated eye movement conditions. We suggest that this reducedresponse modulation is indicative of predictive processing of visual motion in-formation: in the simulated eye movement condition the response modulationwould encode both, the eye-movement-induced and the self-motion-inducedvisual signal. On the contrary, the response modulation in the real eye move-ment condition would indicate only the net visual signal resulting from the(simulated) self motion. The above mentioned studies on ‘real motion cells’describe processing in the dorsal stream of the primate visual cortical systemthat allow to dissociate external object motion from self-generated retinal mo-tion. Our findings provide evidence for an analogue information-processingnetwork concerning self motion signals. Further experiments, however, areneeded to test this hypothesis.
3. Behavioral Studies in Humans
3.1. Visuo-Vestibular Crossmodal Aftereffects in Self Motion Perception
Numerous psychophysical studies have investigated how visual and vestibularsignals contribute to self motion perception (Bremmer et al., 2002b; Cardinand Smith, 2010; Cuturi and MacNeilage, 2013; De Winkel et al., 2015;Fetsch et al., 2009; Frank et al., 2014; Kaliuzhna et al., 2015; MacNeilageet al., 2010; Ni et al., 2013), but less research has examined adaptation or cal-ibration across these signals. Characterizing perceptual adaptation providesunique insight into both the architecture and dynamics of physiological pro-cesses underlying perception. In particular, extensive research on the visual

10 M. W. Greenlee et al. / Multisensory Research (2016)
motion aftereffect, caused by adaptation to a constant visual motion stimulus,has shown that visual motion processing depends on opponent motion chan-nels that adapt with particular temporal dynamics (Barlow, 1990; Barlow andHill, 1963; Sutherland, 1961). This finding, in turn, has been related to changesin response properties of visual-motion-sensitive neurons thought to underlievisual motion perception (for a review: Mather et al., 2008). Similar insightshave resulted from characterization of motion aftereffects in other modalities,including auditory (Grantham and Wightman, 1979; Shu et al., 1993), tactile(Watanabe et al., 2007) and vestibular modalities (Coniglio and Crane, 2014;Crane, 2012).
Aftereffects also have the potential to shed light on multimodal interactionsand the underlying neural mechanisms through characterization of so-calledcrossmodal aftereffects, i.e., when adaptation to a stimulus in one modalitygives rise to an aftereffect in a different modality. For example, Kitagawa andIchihara (2002) showed adaptation to visual motion led to auditory aftereffectand vice-versa, and Konkle et al. (2009) demonstrated similar interactions be-tween visual and tactile modalities. Such findings are proposed to be indicativeof multisensory neural representation that are more ‘process-dependent’ thanmodality-dependent (Konkle and Moore, 2009).
Following this reasoning, it seems likely that adaptation of visual–vestibularneural populations devoted to the ‘process’ of self motion estimation (e.g., indorsal extent of the medial superior temporal area, MSTd) could similarlyresult in aftereffects that transfer between visual and vestibular modalities.Evidence in favor of such visual–vestibular crossmodal aftereffects has beendescribed in several previous reports.
For example, Brandt and coworkers (1974) presented subjects with pro-longed (5 s to 15 min) visual-only stimulation inside a rotating drum thatinduced the illusion of circular self motion (i.e., vection). When the visualstimulation stopped and the light was extinguished subjects reported an ‘after-sensation’ of self motion in darkness in the direction opposite the previouslyexperienced illusory self motion, and they also exhibited an afternystagmus(Kommerell and Thiele, 1970), which agreed with the perceptual aftereffect.
More recently, Seno et al. (2010) explicitly asked subjects to rate thestrength and duration of the self motion aftereffect after exposure to sustainedvisual stimulation simulating linear self motion which was long enough toelicit vection. They reported persistence of vection in the same direction asthe adapted one. The problem with subjective reports is that they do not allowquantification of the aftereffect magnitude and may be vulnerable to biases in-duced by experimental instructions (for a recent comparison of vection onsetlatency and strength for 3D and head-mounted displays see Riecke and Jordan,2015). These findings are highly suggestive but they provide only a subjectivemeasure of aftereffect strength.

Multisensory Research (2016) DOI:10.1163/22134808-00002527 11
A more objective approach was taken by Crane (2013). In this experi-ment, subjects were seated on a motion platform experienced small forward orbackward movements and had to indicate the direction of the movement, i.e.,two-alternative-forced choice, a common method in vestibular psychophys-ical experiments (Benson et al., 1986; Crane, 2012; Grabherr et al., 2008;MacNeilage et al., 2007). The magnitude and direction of the movement wasvaried from trial to trial in order to find the movement that was equally likelyto elicit a forward or backward response. This stimulus magnitude is knownas the point of subjective equality (PSE) and indicates the stimulus perceivedequal to zero motion. Prior work (Crane, 2012) had shown systemic shiftsin the PSE when the movement was preceded on each trial by an adaptingvestibular stimulus, suggestive of a within-modality vestibular motion after-effect. However when the adapting stimulus consisted of visually simulatedself motion only, no shift of the PSE, and therefore no crossmodal aftereffect,was observed. This result was somewhat surprising given reports of visuallyinduced self motion aftereffects by Brandt et al. (1974) and Seno et al. (2010).
Comparisons across studies suggests that an adapter duration longer than1.5 s used by Crane (2013) may be required. To investigate this possibilityCuturi and MacNeilage (2014) conducted a study with methods similar tothose of Crane (2013), but using different durations for the visual self mo-tion adapter (Fig. 3A). In the main experiment an adapter duration of 15 swas used. Optic flow simulated either forward or backward self motion at3 m/s through a 3D cloud of randomly placed triangles, each with 0.5 cmbase and height (0.7 degree at viewing distance of 43 cm). Immediately afterthe optic flow adapter was extinguished, the platform moved either forwardor backward and subjects indicated the direction they perceived. Movementmagnitude and/or direction was varied from trial to trial according to an adap-tive procedure (Kontsevich and Tyler, 1999). A total of 50 trials were collectedper condition and psychometric functions were fit to estimate the PSE. Trialswith forward and backward adaptation were collected in separate blocks. Inaddition, a baseline condition with no visual adaptation was run in a separateblock to quantify any pre-existing biases in fore–aft self motion perception.
Results for the baseline condition show no significant shift in PSE whereassignificant shifts are observed when a 15 s visual adaptation stimulus is pre-sented before each trial (Fig. 3B). These shifts indicate the amount of move-ment needed to cancel the self motion aftereffect. The direction of the shiftssuggests aftereffects in the direction opposite the simulated visual self mo-tion such that a movement in the same direction as the adaptation stimulusis required to cancel the aftereffect. In additional conditions, shorter durationadapters were used but no crossmodal aftereffects were observed (Fig. 3C)suggesting that not just vection (elicited after ∼7 s) but sustained vection (e.g.,following a 15-s stimulus) is required in order to elicit these aftereffects.

12 M. W. Greenlee et al. / Multisensory Research (2016)
Figure 3. Crossmodal self motion aftereffects. (A) Illustration of the experimental protocol.During the adaptation phase (left), subjects were presented with an optic flow simulating eitherforward or backward self motion at constant velocity (3 m/s). In the test phase (right), subjectsexperienced a 2-s passive linear fore–aft translation with a Gaussian velocity profile (vestibular-only test), and subsequently indicated the perceived movement direction. In a control condition,a visual-only test stimulus (far right) composed of expanding or contracting optic flow wasused instead, and subjects indicated the direction of optic flow. Different adaption conditionswere run in separate blocks of 50 trials each: baseline (no adaptation), forward (15 s), backward(15 s), as well as three forward blocks with shorter adapter durations of 7.5, 3.75, or 1.5 s.(B) Mean aftereffect (PSE) across subjects (n = 20) following forward and backward adaptationwith 15 s duration compared with the no-adapter baseline. (C) Mean aftereffect (expressed asforward minus baseline PSE) as a function of adapter duration (n = 17). Subjects additionallyrated their vection on a scale of 1 to 7, with 1 representing perception of object motion onlyand 7 representing perception of self motion only. Gray dots indicate mean subjective ratings.(D) Crossmodal and visual-only aftereffects (expressed as forward or backward minus baselinePSE) are uncorrelated (r = 0.003; p = 0.98) (n = 15). To allow for comparison, backwardaftereffects are multiplied by −1. All error bars show SE.

Multisensory Research (2016) DOI:10.1163/22134808-00002527 13
A trivial explanation of the crossmodal aftereffect is that a visual motionaftereffect is influencing the subsequent perception of self motion via purelyvisual pathways. Indeed, recent results show that visual motion aftereffects(i.e., illusory visual motion), rather than real visual motion, are sufficient toelicit postural sway responses (Holten et al., 2014). To examine this possibil-ity, Cuturi and MacNeilage (2014) also measured the standard visual motionaftereffects in response to the same adaptation stimuli by presenting a teststimulus consisting of visual rather than physical motion. However, the mag-nitude of the visual and self motion aftereffects were found to be uncorrelatedacross subjects (Fig. 3D) supporting the conclusion that the crossmodal after-effects are not simply a secondary consequence of a visual motion aftereffectleading to perceived self motion.
These behavioral findings inform our understanding of physiological sub-strates of self motion perception. Aftereffects are thought to reflect neuralcalibration to steady stimulation by way of suppressed neural responses to theadapted stimulus (Barlow, 1990; Barlow and Hill, 1963; Sutherland, 1961).Crossmodal aftereffects prove that this calibration is transferred from the vi-sual to the non-visual (most likely vestibular — Priesol et al., 2014; Valko etal., 2012) domain. They provide a measure of the magnitude and temporal dy-namics of visual–vestibular interaction at the level of the neurophysiologicalsubstrates of self motion perception. Critically, because aftereffect strength ismeasured by finding the stimulus necessary to cancel the aftereffect, resultscan be more directly related to degree of neural suppression (i.e., the inverseof neural activation elicited by the cancellation stimulus). With this tool inhand it is possible to probe the system more deeply to investigate, for exam-ple, how interaction, quantified by strength of crossmodal transfer, depends onfeatures of the visual stimulus other than duration, such as field of view, speed,contrast, movement direction, etc.
To identify the neurophysiological substrate of the crossmodal aftereffect,it would be necessary to combine behavioral measurements with neurophysio-logical techniques. In particular, it would be interesting to identify physiolog-ical modulations that correlate with aftereffect strength, either across subjectsor across conditions. Future research taking advantage of neural recordingsin animal models, brain imaging and/or stimulation techniques could revealmore details about the neural interconnections and temporal dynamics behindthe crossmodal aftereffect, thus providing a more comprehensive understand-ing of the neural substrates of self motion perception.
3.2. Self Motion Perception and Visuo-Vestibular-SomatosensoryInteractions
The vestibular system is tuned to detect self motion, and vestibular signalsare integrated with additional information in the form of visual optic flow,

14 M. W. Greenlee et al. / Multisensory Research (2016)
as well as tactile and auditory cues (Cohen et al., 1981; Lackner and DiZio,2005; Probst et al., 1985; Prsa et al., 2012). Such integration is necessary fornavigating in the environment by detecting changes in the supporting surface,shifts of body weight, perceiving head orientation on the trunk as well as dis-tinguishing object motion from self motion (Mergner and Rosemeier, 1998;Mergner et al., 1983; Wexler et al., 2001). The reviewed research exploresmultisensory integration of vestibular cues in the form of passive whole bodyrotations, visual stimuli in the form of optic flow, and tactile stimulation.
Extending previous work that has shown visual and vestibular cues forheading to be optimally integrated (Butler et al., 2010; Fetsch et al., 2009), werecently demonstrated similar integrative mechanisms for visual and vestibu-lar cues in the case of angular self motion (Prsa et al., 2012). In severalexperiments participants were seated in a human motion platform, which de-livered rotation stimuli, while observing a 3-D display delivering a visualstimulus (optic flow). Three conditions were tested: unimodal vestibular (yawrotations); unimodal visual (yaw rotations simulated by visual optic flow; sta-tionary motion platform); bimodal condition (visual and vestibular rotationsoccurred simultaneously in opposing directions). On each trial two consec-utive rotations of one type (visual, vestibular, or bimodal) were presentedand participants had to judge whether the first rotation was bigger or smallerthan the second. The results show that participants’ discrimination thresholdswere always better in the bimodal as compared to the unimodal conditions.In addition, participants’ performance in the bimodal empirical condition waspredicted by a Bayesian optimal observer model. Thus, participants optimallyintegrated visuo-vestibular cues signaling self rotations. In an additional exper-iment we also demonstrate that visual and vestibular cues are fused, wherebythe access to the individual cues is lost and only the integrated percept isretained (Prsa et al., 2012). To further explore the limits of visuo-vestibularintegration we tested the impact of additional conflicts between visual andvestibular self rotation cues. Research in other sensory modalities (such as vi-sion, audition and touch) has shown that multisensory integration is alteredwhen conflict is introduced between the two cues, and can even break downwhen the conflict is substantial (Roach et al., 2006; Wallace et al., 2004). Weinvestigated whether under comparable visuo-vestibular conflicts for idiotheticself motion cues (which are never in conflict under natural circumstances) inte-gration still occurs. Performing the task described above (using vestibular yawrotation) we now tested a visual stimulus simulating rotation either aroundthe roll axis (experiment 1) or the pitch axis (experiment 2). The results inFig. 4 show that participants optimally integrated the conflicting cues in bothexperiments and thus do so despite the axial visual–vestibular incongruency(Kaliuzhna et al., 2015). Multisensory integration is thought to occur when acommon cause is inferred for the cues (Körding et al., 2007). It is possible that

Multisensory Research (2016) DOI:10.1163/22134808-00002527 15
Figure 4. Experimental setup and results. Participants are seated in the motion platform with ascreen in front of them. Upper panel: Experiment 1. Lower panel: Experiment 2. Participantsshow optimal visuo-vestibular integration, their bimodal threshold (grey square, online version:red) being lower than their unimodal visual (open square, online version: blue) and vestibular(black) thresholds, and not different from the predictions of a Bayesian optimal integrationmodel (open circle, online: red circle). This figure is published in colour in the online version.
despite the directional conflict a common cause was attributed to the visual andvestibular cues through the formation of a subjective percept of some untestedintermediate (e.g., diagonal) direction of self motion, thus resolving the con-flict (in fact, one of our subjects spontaneously reported this). Alternatively,multisensory integration could also occur because, despite directional conflictalong the axis of rotation, other characteristics of the two cues were not inconflict, such as their identical motion profile, their angle of rotation and theirspeed. Thus, visuo-vestibular combinations remain optimally integrated, pos-sibly due to the functional necessity of merging multiple information sourcesfor an adequate estimation of self motion.

16 M. W. Greenlee et al. / Multisensory Research (2016)
Figure 5. (A) Experimental setup testing for the effects of natural vestibular stimulation ontactile detection. A congruent trial is depicted: rotation direction corresponds to the side oftactile stimulation. (B) Results. Independently of congruency tactile sensitivity was improvedduring rotation in comparison to a no-rotation baseline. This figure is published in colour in theonline version.
Another important source for computing self motion, as well as balancemaintenance, is provided by the tactile system (Mergner and Rosemeier,1998). Moreover, do vestibular or visuo-vestibular stimuli modulate touch?Vestibular effects on touch were first documented in patient studies, wherecaloric vestibular stimulation (CVS) was shown to transiently improve hemi-anaesthesia (Bottini et al., 2005; Vallar et al., 1990). Subsequent studies con-firmed this result in healthy volunteers, demonstrating that CVS and galvanicvestibular stimulation (GVS) improved tactile sensitivity (Ferrè et al., 2011,2013a). CVS and GVS represent, however, a highly artificial way to stimulatethe vestibular system and simultaneously activate other processing pathways,such as touch and pain. Our work explored whether natural vestibular stimu-lation in the form of passive whole-body rotations achieved the same effect ofimproving tactile sensitivity. Yaw rotation using the above described motionplatform also allowed us to explore whether a spatial attentional componentcould play a role in the vestibular–tactile effects previously observed (Bot-tini et al., 2013; Ferrè et al., 2013b). While participants received yaw-rotation,they also received near-threshold tactile stimuli at their index fingers (Fig. 5A).On every trial a tactile stimulus would either be delivered to the left or theright finger, or no stimulation would occur (catch trials). We tested three con-ditions: a no-rotation baseline; a congruent condition (where the rotation wasin the direction of the finger stimulated); and an incongruent condition (wherethe rotation was in the direction opposite to the finger stimulated). If attentionmediated vestibulo-tactile interactions, higher tactile sensitivity would be ex-pected in the congruent condition with respect to the incongruent condition.Our results show improved tactile sensitivity during rotation, independentlyof congruency, as compared to the no-rotation baseline (Fig. 5B) (Ferrè et al.,

Multisensory Research (2016) DOI:10.1163/22134808-00002527 17
2014). Thus, natural vestibular stimulation improves tactile detection and thiseffect is independent of spatial attention. Note that previous work employingCVS and GVS could not precisely control for spatial attention: the lateralisedthermal and tactile stimulation produced by CVS and GVS could orient spa-tial attention, thus indirectly improving tactile detection. The natural vestibularstimuli used here provide an input signal, which is balanced between the twohemispheres and affects somatosensation in a spatially unspecific way.
Multisensory integration and mandatory fusion of visual and vestibular cuesas well as vestibular–tactile interactions are largely driven by the functionalnecessity for accurate self motion perception, gaze stabilisation and balancemaintenance (Mergner and Rosemeier, 1998; Wexler et al., 2001). Next toself motion perception, these processes are also important for the perceptionof one’s body in space allowing self identification with one’s body, as wellas the construction of a first-person perspective (Ionta et al., 2011; Pfeifferet al., 2013, 2014), and are subtended by an anatomical pathway combiningvisual, vestibular and tactile information already at the level of the brain-stem and the thalamus up to the cortex (Lopez and Blanke, 2011). Our workopens an avenue for a more controlled and systematic study of vestibular ef-fects on perception, cognition, and self consciousness. Exploring the limitsof trimodal integration the use of a motion platform provides precise con-trol over the onset, magnitude, and duration of vestibular stimulation and itscongruency with visual and tactile signals and is additionally selective for agiven semicircular canal. Thus, one direction of future research should ex-plore the characteristics of the vestibular stimulus producing tactile facilitationin terms of strength (different self motion speeds), timing (different self mo-tion duration), direction (stimulation around, e.g., different rotation axes), andwhether the tactile stimulus is occurring at a functionally relevant site (e.g.,foot soles vs fingertips). Trimodal visual–vestibular–tactile interaction alsoremains underexplored despite the tight link between the three modalities. Fu-ture behavioural and imaging work (e.g., recording of somatosensory evokedpotentials — Pfeiffer et al., 2016) may also allow us to establish the order aswell as the timing and the anatomical locus of these effects in the human brain.
3.3. Functional MRI Studies of Vestibular and Visuo-Vestibular Processing inHumans
Brain imaging studies of vestibular and visuo-vestibular functions have beenhindered by the simple fact that the participant’s head should not move duringimaging. Artificial stimulation of the vestibular nerve can be achieved by gal-vanic vestibular stimulation (GVS; Smith et al., 2012) or by caloric vestibularstimulation (CVS; Frank and Greenlee, 2014) techniques. Below we summa-rize recent findings using these two techniques to investigate how vestibularstimulation modifies responses in visual areas to visual motion. Using these

18 M. W. Greenlee et al. / Multisensory Research (2016)
techniques we can also explore areas that integrate visual and vestibular cuesfor self motion perception.
3.4. Visual–Vestibular Interactions in the Human Cerebral Cortex StudiedWith fMRI and Galvanic Vestibular Stimulation
A major limitation in the study of how and where visual and vestibular signalsinteract in the human brain is that natural vestibular stimulation is not possi-ble in a magnetic resonance imaging (MRI) scanner, necessitating the use ofartificial methods. In galvanic vestibular stimulation (GVS), a controlled elec-tric current is passed between two electrodes attached to the skin, just behindthe ears. This stimulates the 8th cranial nerve, which connects the vestibularorgans of the inner ear to the brainstem, resulting in an illusory vestibular sen-sation. Typically, the stimulation waveform is sinusoidal with a frequency inthe region of 1 Hz and a current of about ±2 mA. Unlike caloric stimulation,which typically causes a sensation of leftward and rightward translation (seenext section), GVS causes a predominant sensation of clockwise or anticlock-wise roll.
Several authors have previously used GVS in conjunction with functionalMRI (fMRI — e.g., Lobel et al., 1998; Stephan et al., 2005). GVS results inactivation of a fairly consistent and well-defined set of cortical regions. Thework reported here focussed on area hMST (human MST) because MSTd is akey area for visual–vestibular interaction in macaques (Fetsch et al., 2013; Guet al., 2006; Takahashi et al., 2007). The human area medial superior tempo-ral, hMST, can be defined by dividing the medial temporal, MT, complex intotwo sub-regions on the basis that one portion (hMT) responds mainly to con-tralateral stimuli but the other (hMST) responds well also to ipsilateral stimuli.The relationship between hMST and macaque MSTd is unclear and hMST de-fined in this way may in reality contain more than one functional region, butthis definition of hMST has been widely used and provides a starting point forvestibular studies.
In a study in which GVS was delivered in complete darkness, Smith et al.(2012) explored whether hMT and hMST respond to vestibular stimulation.Three other visual areas were also examined, all areas that are implicated inprocessing visual cues to self motion, namely the ventral intraparietal area,VIP, the cingulate sulcus visual area, CSv, and V6. These can all be identifiedbased on the fact that they respond well to a standard optic flow stimulus butrespond less well or not at all to an array of flow stimuli (Cardin and Smith,2010; Wall and Smith, 2008). As in the case of hMST, there are uncertain-ties about the relationships between some of these areas and their macaquecounterparts. VIP corresponds to human VIP of Bremmer et al. (2001) but itis not certain that this is functionally homologous with macaque VIP and itis unclear how it maps onto alternative classifications of visual areas in the

Multisensory Research (2016) DOI:10.1163/22134808-00002527 19
Figure 6. (A) Cortical regions of interest studied. The figure shows an inflated representation ofthe right cerebral hemisphere of one individual with the locations and extents of hMT, hMST,hVIP, V6 and CSv indicated as grey-scaled (online version: coloured) overlays. In each case,BOLD activity elicited by the visual localizer that was used to define the region is shown in aslice through the brain of the same participant. A corresponding set of visual areas is present inthe left hemisphere (not shown). Modified from Smith et al. (2012). (B) A ‘cut-out’ section ofthe flattened grey matter representation from each hemisphere of one participant, centered onthe MT complex (dashed white line is the superior temporal sulcus). Vestibular activity (grey-scaled, online version: orange/yellow) is superimposed, together with the outlines of hMT (lightgrey, online version: green) and hMST (dark grey, online version: magenta) as defined with avisual localizer. Vestibular activity is apparent in hMST but not hMT and is confined to theanterior portion of hMST. Modified from Smith et al. (2012). (C) Visual stimulus used byBillington and Smith (2015). A circular patch of white dots appears to rotate during GVS.Physical rotation of the patch on the screen was used to null this illusory motion. (D) MVPAresults for classifying the temporal phase of sinusoidal visual and vestibular rotations in theroll plane for five cortical visual areas. Chance performance is shown, along with the 95thpercentile obtained from permutation testing as an indicator of statistical significance. Modifiedfrom Billington and Smith et al. (2015). This figure is published in colour in the online version.
human intraparietal sulcus. Human V6 probably corresponds well to macaqueV6, but V6 as defined with a flow localizer may also include V6A (Pitzalis etal., 2013, 2015). CSv was first defined in the human brain and a homologuehas not so far been identified in macaques.
Figure 6A shows the locations of all these visual regions in the brain of atypical participant. Figure 6B shows, again for one participant, that vestibu-lar activity is present in hMST. In a group of participants, vestibular activity

20 M. W. Greenlee et al. / Multisensory Research (2016)
was usually present in hMST but, without exception, it was absent in hMT.Vestibular activity was also seen quite strongly and consistently in CSv andsometimes also in VIP. It was not seen in area V6, suggesting that human V6is not involved in processing vestibular signals, or at least not the analysis ofroll. When vestibular activity was present in hMST, it did not fill the hMST re-gion of interest as defined visually but was only evident in the anterior part of it(as in Fig. 6B). This is consistent with the idea that hMST encompasses morethan one functional region and suggests that not all subregions have vestibularinput. It is possible, though a matter of speculation, that the part of hMST thathas vestibular responses might correspond to macaque MSTd, the part that hasvestibular responses in macaques.
The work of Smith et al. (2012) identifies three cortical regions that re-spond to both visual and vestibular stimuli: hMST, CSv and VIP. A fourthsuch area is a region referred to as the posterior insular cortex area (PIC),which was not studied by Smith et al. (2012) but was shown by Frank et al.(2014) to respond to both types of stimulus. The presence of both types of re-sponse does not necessarily imply that integration occurs. Nonetheless, theseareas are candidates for visual–vestibular interactions. There is good evidencefrom Angelaki’s group (reviewed by Fetsch et al., 2013) that integration oc-curs in macaque MSTd. In a series of studies, they moved the animal to createvestibular activity and also presented visual cues to self motion. They foundthat many MSTd cells are tuned for direction of self motion. Some have thesame preferred direction for both visual and vestibular stimulation, suggestingthat these neurons may be integrating the two signals, and detailed analysisshowed that direction tuning is often better during combined stimulation thanfor either modality alone, a signature of integration. They found other MSTdcells that were tuned for direction in both modalities but with opposite direc-tion preferences, indicating antagonistic comparison of visual and vestibularsignals, perhaps used for discounting self motion when assessing object mo-tion. Similar cells exist in macaque VIP and also in VPS, which may be ahomologue of human PIC.
To study visual–vestibular interactions with fMRI, Billington and Smith(2015) developed a nulling procedure. They presented participants with a cir-cular patch of white dots on a black background, with all visual cues from thesurroundings occluded. In the real world, when one’s head moves, the imageof a stationary object will move across the retina. If the head is moving yet theretinal image is static, the object must be moving (in synchrony with the head).Consequently, the illusion of self motion from GVS caused the static patch ofdots in this study to appear to move. The dominant sensation from GVS is rollso the patch of dots, which was centrally fixated, appeared to rotate about itscentre. Billington and Smith now physically rotated the dots in the oppositedirection, so as to cancel the illusory motion (Fig. 6C). They then conducted

Multisensory Research (2016) DOI:10.1163/22134808-00002527 21
an fMRI experiment in which this nulled motion was presented. They alsoemployed a second condition in which the direction of the physical motionwas reversed, so that instead of cancelling the illusory motion, it summed withit. Allowance was made for the effect of the vestibular-ocular reflex (VOR)when equating retinal motion. Thus, the two stimulus conditions had exactlythe same retinal motion and exactly the same vestibular motion, the only dif-ference between them being the relative phase of the two sinusoidal motions.One condition was perceived as stationary, because the two signals cancelled,and the other appeared to be moving quite strongly. This raises the interestingquestion of whether cortical activity during the nulled condition follows whatis perceived or what is happening on the retina. It was found that in all fourareas (hMST, hVIP, CSv, PIC), the blood oxygen level dependent (BOLD)response was similar in the two conditions. Retinal motion always caused cor-tical activity, whether or not the motion was perceived, and no cortical regionwas found that was active only when motion was perceived.
Given similar response amplitudes for the two conditions, Billington andSmith (2015) were able to look at whether the responses to the two stim-uli could be distinguished with multi-voxel pattern analysis (MVPA). If theycould be distinguished (classified) based on differences in the pattern of ac-tivity across voxels in a given cortical area, this would suggest the existenceof neurons that are not only responsive to both visual and vestibular stim-uli but are also sensitive to the relative phase in which the two stimuli arepresented. Conceptually, the two conditions correspond to the congruent andopposite conditions used by Angelaki’s group, so applying MVPA shouldprobe whether a given visual/vestibular area has two neural populations, onewith congruent and one with opposite direction preferences.
Figure 6D summarizes the results. In hMST, classification performancereached about 75% correct, where chance performance is 50%. This sug-gests that human MST does indeed contain neurons that are responsive to bothmodalities and are sensitive to whether the stimuli are in the same or oppositephase, like those in macaque MSTd. There were two other areas that showedthis property, namely VIP and PIC. As a control, the authors looked at pri-mary visual cortex (V1), which is not thought to receive vestibular signals,and found as expected that performance was at chance. They also found that itis at chance in CSv, suggesting that this area perhaps does not integrate the twosignals, or at least not in the same way as hMST, VIP and PIC, even thoughboth senses are represented.
In summary, human cortical visual areas hMST, hVIP, CSv and PIC, but notMT or hV6, show vestibular responses. Areas hMST, hVIP and PIC, but notCSv, appear to integrate visual and vestibular cues to direction of self motionand may contain neurons with direction preferences that are congruent in somecases and opposite in others.

22 M. W. Greenlee et al. / Multisensory Research (2016)
3.5. Organization of Human Vestibular Cortex in Lateral Sulcus StudiedWith fMRI and Caloric Vestibular Stimulation
The posterior lateral sulcus (also called posterior sylvian fissure) and its sur-rounding regions (perisylvian cortex) are the major sites of the cortical vestibu-lar network in humans (Dieterich and Brandt, 2008, 2015; Eickhoff et al.,2006; Lopez and Blanke, 2011; Seemungal, 2014). Although the exact loca-tion remains disputed, several imaging studies in humans (for meta-analysessee: Lopez et al., 2012; zu Eulenburg et al., 2013) indicate that the central hubof vestibular processing in this network is in an area referred to as parieto-insular vestibular cortex (PIVC). However, it remains an open question whichother areas belong to the vestibular network in posterior lateral sulcus, andwhich role they play for vestibular processing.
Previous imaging studies have reported distributed activations in lateral sul-cus during vestibular stimulation (e.g., Dieterich et al., 2003; Fasold et al.,2002), extending into the posterior end of the sulcus. Interestingly, imagingstudies employing visual motion stimuli found evidence for visual motion pro-cessing at this posterior site as well, in area PIC (Beer et al., 2009; Biagi etal., 2015; Claeys et al., 2003; Orban et al., 2003; Sunaert et al., 1999). Thelocation of PIC suggests that it might also be part of the vestibular network butthis hypothesis has not been tested in the past.
Therefore, as a first step to understanding the organization of the vestibularnetwork in the sylvian fissure, we explored the sensitivity of area PIC to caloricstimuli (Frank and Greenlee, 2014; Frank et al., 2014, subm.). If PIC is partof the vestibular network it should respond to vestibular information.
Participants were in supine position with eyes open in the MRI scanner(3-Tesla Siemens Allegra) and fixated on a static point in the screen center,while caloric vestibular stimulation (CVS) was performed. For CVS we useda custom-built MRI-compatible, micropump system, where hot (48°C), cold(5°C), or neutral (30°C) water flowed through left and right ear pods leadingto differential caloric vestibular stimulation conditions (see Frank and Green-lee, 2014). Periods of bithermal stimulation were always followed by periodsof neutral stimulation (warm on both sides). During each trial, participantsindicated the presence or absence of self motion sensations and, if present,the main direction of self motion. The fMRI BOLD response was contrastedbetween conditions of caloric and neutral stimulation.
Area PIC was localized using its known responsiveness to visual stimuli.Therefore, in a separate experiment, periods with purely (100%) coherent mo-tion vs static dots were presented (for more information see Frank et al., 2014).
PIC could be localized in all participants using the visual motion localizer.An example of one participant is presented in Fig. 7A. After localizing PIC,we could determine its responses to vestibular stimulation. The results showed

Multisensory Research (2016) DOI:10.1163/22134808-00002527 23
Figure 7. Organization of human vestibular cortex in lateral sulcus (also called sylvian fissure).Shown are activations in a sample participant (left hemisphere) during stimulation with visualmotion and caloric vestibular cues (p < 0.001, uncorrected). (A) Visual motion stimulationshows significant activations in the posterior insular cortex area (PIC) in the posterior end ofthe lateral sulcus. In addition to PIC, other motion-sensitive regions in visual and parietal cortexrespond well to visual motion stimuli. (B) Caloric stimulation elicits activations in the vestibularnetwork in lateral sulcus, including the putative center of cortical vestibular processing, theparieto-insular vestibular cortex area (PIVC). Activations during caloric stimulation are alsoevident in area PIC, suggesting that PIC is part of both, the vestibular and the visual motionprocessing networks After Frank et al., 2014 (with permission of the publisher) and Frank etal., submitted for publication. This figure is published in colour in the online version.
that PIC was significantly activated during CVS (Frank et al., 2014). Exampleactivations in one participant are presented in Fig. 7B.
Based on these results we conclude that area PIC, in addition to the alreadyknown PIVC, appears to be part of the cortical vestibular network in lateralsulcus and plays a role in the integration of visual and vestibular motion cuesfor the perception of self motion. The responsiveness to visual motion sets itapart from area PIVC that does not respond to visual motion (primates: Chenet al., 2011) and might even be suppressed by visual motion cues (humans:Brandt et al., 1998; Deutschländer et al., 2002; Dieterich et al., 1998; Klein-schmidt et al., 2002). Therefore, previously reported activations in posteriorlateral sulcus during self motion induced by visual motion (e.g., Cardin andSmith, 2010; Huang et al., 2015; Uesaki and Ashida, 2015) might fall withinPIC, or at least partially overlap with PIC, rather than PIVC.
In conclusion, we find evidence for a more complex organization of vestibu-lar cortex in posterior lateral sulcus. In addition to area PIVC, there is at leastone other area, named PIC, that responds to visual and vestibular motion, pre-

24 M. W. Greenlee et al. / Multisensory Research (2016)
sumably supporting the integration of motion information from the visual andvestibular senses. Future experiments might investigate if other vestibular ar-eas exist in the vicinity of PIVC and PIC and further clarify the organizationof the vestibular network in posterior lateral sulcus.
4. Conclusions
The findings reviewed above suggest that sensory signals about self motionare integrated over visual, vestibular, somatosensory and motor systems. Todifferentiate between self and object motion the brain integrates signals aris-ing from the vestibular system and compares them with those stemming fromretinal displacements and from other sensory systems. Since the eyes withinthe head are also in relative motion, corollary discharge signals arising fromthe motor commands to move the eye in a certain direction in space with aspecific velocity also need to be taken into account when calculating self mo-tion in space. Using a simulated eye movement technique, we showed abovethat neurons in areas MST and VIP appear to be able to discount the retinaldisplacements during eye movements when calculating the focus of expansionof optic flow fields (see Fig. 1). Moreover, prolonged stimulation with directedmotion in the one sensory system can lead to aftereffects in the same or othersensory modality, leading to a prominent (but illusory) sensation of self motionin a direction opposite that of the adapting direction (Fig. 3). Natural vestibu-lar stimulation leads to direction-invariant enhancements in tactile perception(Fig. 5). The results of functional MRI studies using either galvanic (Fig. 6) orcaloric vestibular stimulation (Fig. 7) coupled with visual motion stimulationindicate that the human brain also contains a set of cortical regions that are in-terconnected and exchanging information regarding visual and vestibular cuesregarding self motion in space. Exactly how the receptive fields of these mul-tisensory neurons are constructed and what sorts of sensory cues they respondto remains an unresolved research domain requiring further investigation.
Acknowledgements
Author ATS thank the Leverhulme Trust for financial support. Authors FBand JC acknowledge that their work was supported by DFG-CRC/TRR-135-A2. Author MWG was supported by German Research Council (DFG, FOR1075).
References
Andersen, R. A., Snyder, L. H., Bradley, D. C. and Xing, J. (1997). Multimodal representation ofspace in the posterior parietal cortex and its use in planning movements, Annu. Rev. Neurosci.20, 303–330.

Multisensory Research (2016) DOI:10.1163/22134808-00002527 25
Angelaki, D. E., Gu, Y. and DeAngelis, G. C. (2011). Visual and vestibular cue integration forheading perception in extrastriate visual cortex, J. Physiol. 589, 825–833.
Avillac, M., Deneve, S., Olivier, E., Pouget, A. and Duhamel, J. R. (2005). Reference framesfor representing visual and tactile locations in parietal cortex, Nat. Neurosci. 8, 941–949.
Avillac, M., Ben Hamed, S. and Duhamel, J. R. (2007). Multisensory integration in the ventralintraparietal area of the macaque monkey, J. Neurosci. 27, 1922–1932.
Barany, R. (1907). Physiologie und Pathologie des Bogengangapparates beim Menschen. FranzDeuticke Verlag, Leipzig, Germany.
Barlow, H. B. (1990). A theory about the functional role and synaptic mechanism of visual after-effects, in: Vision: Coding and Efficiency, C. B. Blakemore (Ed.), pp. 363–375. CambridgeUniversity Press, Cambridge, UK.
Barlow, H. B. and Hill, R. M. (1963). Selective sensitivity to direction of movement in ganglioncells of the rabbit retina, Science 139(3553), 412–414.
Beer, A. L., Watanabe, T., Ni, R., Sasaki, Y. and Andersen, G. J. (2009). 3D surface perceptionfrom motion involves a temporal-parietal network, Eur. J. Neurosci. 30, 703–713.
Beintema, J. A. and Van den Berg, A. V. (1998). Heading detection using motion templates andeye velocity gain fields, Vis. Res. 38, 2155–2179.
Beintema, J. A., Van den Berg, A. V. and Lappe, M. (2004). Circular receptive field structuresfor flow analysis and heading detection, in: The Structure of Receptive Fields for Flow Analy-sis and Heading Detection, L. M. Vaina, S. A. Beardsley and S. Rushton (Eds), pp. 223–248.Kluwer Academic Publishers, Norwell, MA, USA.
Ben Hamed, S., Duhamel, J. R., Bremmer, F. and Graf, W. (2002). Visual receptive field mod-ulation in the lateral intraparietal area during attentive fixation and free gaze, Cereb. Cortex12, 234–245.
Benson, A. J., Kass, J. R. and Vogel, H. (1986). European vestibular experiments on theSpacelab-1 mission: 4. Thresholds of perception of whole-body linear oscillation, Exp. BrainRes. 64, 264–271.
Biagi, L., Crespi, S. A., Tosetti, M. and Morrone, M. C. (2015). BOLD re-sponse selective to flow-motion in very young infants, PLoS Biol. 13, e1002260.DOI:10.1371/journal.pbio.1002260.
Billington, J. and Smith, A. T. (2015). Neural mechanisms for discounting head-roll-inducedretinal motion, J. Neurosci. 35, 4851–4856.
Bottini, G., Paulesu, E., Gandola, M., Loffredo, S., Scarpa, P., Sterzi, R., Santilli, I., Defanti,C., Scialfa, G. and Fazio, F. (2005). Left caloric vestibular stimulation ameliorates righthemianesthesia, Neurology 65, 1278–1283.
Bottini, G., Gandola, M., Sedda, A. and Ferrè, E. R. (2013). Caloric vestibular stimulation:interaction between somatosensory system and vestibular apparatus, Front. Integr. Neurosci.7, 66. DOI:10.3389/fnint.2013.00066.
Bradley, D. C., Maxwell, M., Andersen, R. A., Banks, M. S. and Shenoy, K. V. (1996). Mecha-nisms of heading perception in primate visual cortex, Science 273, 1544–1547.
Brandt, T., Dichgans, J. and Buchle, W. (1974). Motion habituation: inverted self-motion per-ception and optokinetic after-nystagmus, Exp. Brain Res. 21, 337–352.
Brandt, T., Bartenstein, P., Janek, A. and Dieterich, M. (1998). Reciprocal inhibitory visual–vestibular interaction. Visual motion stimulation deactivates the parieto-insular vestibularcortex, Brain 121, 1749–1758.
26 M. W. Greenlee et al. / Multisensory Research (2016)
Bremmer, F. (2011). Multisensory space: from eye-movements to self-motion, J. Physiol. 589,815–823.
Bremmer, F., Kubischik, M., Pekel, M., Lappe, M. and Hoffmann, K. P. (1999). Linear vestibu-lar self-motion signals in monkey medial superior temporal area, Ann. N. Y. Acad. Sci. 871,272–281.
Bremmer, F., Schlack, A., Shah, N. J., Zafiris, O., Kubischik, M., Hoffmann, K., Zilles, K. andFink, G. R. (2001). Polymodal motion processing in posterior parietal and premotor cortex:a human fMRI study strongly implies equivalencies between humans and monkeys, Neuron29, 287–296.
Bremmer, F., Duhamel, J.-R., Ben Hamed, S. and Graf, W. (2002a). Heading encoding in themacaque ventral intraparietal area (VIP), Eur. J. Neurosci. 16, 1554–1568.
Bremmer, F., Klam, F., Duhamel, J.-R., Ben Hamed, S. and Graf, W. (2002b). Visual–vestibularinteractive responses in the macaque ventral intraparietal area (VIP), Eur. J. Neurosci. 16,1569–1586.
Bremmer, F., Kubischik, M., Hoffmann, K. P. and Krekelberg, B. (2009). Neural dynamics ofsaccadic suppression, J. Neurosci. 29, 12374–12383.
Bremmer, F., Kubischik, M., Pekel, M., Hoffmann, K. P. and Lappe, M. (2010). Visual selectiv-ity for heading in monkey area MST, Exp. Brain Res. 200, 51–60.
Britten, K. H. (2008). Mechanisms of self-motion perception, Annu. Rev. Neurosci. 31, 389–410.
Butler, J. S., Smith, S. T., Campos, J. L. and Bülthoff, H. H. (2010). Bayesian integration ofvisual and vestibular signals for heading, J. Vis. 10, 23. DOI:10.1167/10.11.23.
Cardin, V. and Smith, A. T. (2010). Sensitivity of human visual and vestibular cortical regionsto egomotion-compatible visual stimulation, Cereb. Cortex 20, 1964–1973.
Chen, A., DeAngelis, G. C. and Angelaki, D. E. (2011). Representation of vestibular and visualcues to self-motion in ventral intraparietal cortex, J. Neurosci. 31, 12036–12052.
Chen, A., Deangelis, G. C. and Angelaki, D. E. (2013). Functional specializations of the ventralintraparietal area for multisensory heading discrimination, J. Neurosci. 33, 3567–3581.
Chen, X., DeAngelis, G. C. and Angelaki, D. E. (2014). Eye-centered visual receptive fields inthe ventral intraparietal area, J. Neurophysiol. 112, 353–361.
Claeys, K. G., Lindsey, D. T., de Schutter, E. and Orban, G. A. (2003). A higher order motionregion in human inferior parietal lobule: evidence from fMRI, Neuron 40, 631–642.
Cohen, B., Henn, V., Raphan, T. and Dennett, D. (1981). Velocity storage, nystagmus, andvisual–vestibular interactions in humans, Ann. N. Y. Acad. Sci. 374, 421–433.
Coniglio, A. J. and Crane, B. T. (2014). Human yaw rotation aftereffects with brief durationrotations are inconsistent with velocity storage, J. Assoc. Res. Otolaryngol. 15, 305–317.
Crane, B. T. (2012). Fore–aft translation aftereffects, Exp. Brain Res. 219, 477–487.Crane, B. T. (2013). Limited interaction between translation and visual motion aftereffects in
humans, Exp. Brain Res. 224, 165–178.Cuturi, L. F. and MacNeilage, P. R. (2013). Systematic biases in human heading estimation,
PLoS ONE 8, e56862. DOI:10.1371/journal.pone.0056862.Cuturi, L. F. and MacNeilage, P. R. (2014). Optic flow induces nonvisual self-motion afteref-
fects, Curr. Biol. 24, 2817–2821.De Winkel, K. N., Katliar, M. and Bulthoff, H. H. (2015). Forced fusion in multisensory heading
estimation, PLoS ONE 10, e0127104. DOI:10.1371/journal.pone.0127104.

Multisensory Research (2016) DOI:10.1163/22134808-00002527 27
Deutschländer, A., Bense, S., Stephan, T., Schwaiger, M., Brandt, T. and Dieterich, M. (2002).Sensory system interactions during simultaneous vestibular and visual stimulation in PET,Hum. Brain Mapp. 16, 92–103.
Dieterich, M. and Brandt, T. (2008). Functional brain imaging of peripheral and central vestibu-lar disorders, Brain 131, 2538–2552.
Dieterich, M. and Brandt, T. (2015). The bilateral central vestibular system: its pathways, func-tions, and disorders, Ann. N. Y. Acad. Sci. 1343, 10–26.
Dieterich, M., Bucher, S. F., Seelos, K. C. and Brandt, T. (1998). Horizontal or vertical optoki-netic stimulation activates visual motion-sensitive, ocular motor and vestibular cortex areaswith right hemispheric dominance. An fMRI study, Brain 121, 1479–1495.
Dieterich, M., Bense, S., Lutz, S., Drzezga, A., Stephan, T., Bartenstein, P. and Brandt, T.(2003). Dominance for vestibular cortical function in the non-dominant hemisphere, Cereb.Cortex 13, 994–1007.
Duffy, C. J. (1998). MST neurons respond to optic flow and translational movement, J. Neuro-physiol. 80, 1816–1827.
Duffy, C. J. (2000). Optic flow analysis for self-movement perception, Int. Rev. Neurobiol. 44,199–218.
Duffy, C. J. and Wurtz, R. H. (1991a). Sensitivity of MST neurons to optic flow stimuli. I.A continuum of response selectivity to large-field stimuli, J. Neurophysiol. 65, 1329–1345.
Duffy, C. J. and Wurtz, R. H. (1991b). Sensitivity of MST neurons to optic flow stimuli. II.Mechanisms of response selectivity revealed by small-field stimuli, J. Neurophysiol. 65,1346–1359.
Duhamel, J. R., Colby, C. L. and Goldberg, M. E. (1998). Ventral intraparietal area of themacaque: congruent visual and somatic response properties, J. Neurophysiol. 79, 126–136.
Dukelow, S. P., DeSouza, J. F., Culham, J. C., Van den Berg, A. V., Menon, R. S. and Vilis,T. (2001). Distinguishing subregions of the human MT+ complex using visual fields andpursuit eye movements, J. Neurophysiol. 86, 1991–2000.
Eickhoff, S. B., Weiss, P. H., Amunts, K., Fink, G. R. and Zilles, K. (2006). Identifying humanparieto-insular vestibular cortex using fMRI and cytoarchitectonic mapping, Hum. BrainMapp. 27, 611–621.
Erickson, R. G. and Thier, P. (1991). A neuronal correlate of spatial stability during periods ofself-induced visual motion, Exp. Brain Res. 86, 608–616.
Fasold, O., von Brevern, M., Kuhberg, M., Ploner, C. J., Villringer, A., Lempert, T. and Wen-zel, R. (2002). Human vestibular cortex as identified with caloric stimulation in functionalmagnetic resonance imaging, NeuroImage 17, 1384–1393.
Fattori, P., Pitzalis, S. and Galletti, C. (2009). The cortical visual area V6 in macaque and humanbrains, J. Physiol. Paris 103, 88–97.
Ferrè, E. R., Sedda, A., Gandola, M. and Bottini, G. (2011). How the vestibular system modu-lates tactile perception in normal subjects: a behavioural and physiological study, Exp. BrainRes. 208, 29–38.
Ferrè, E. R., Day, B. L., Bottini, G. and Haggard, P. (2013a). How the vestibular system interactswith somatosensory perception: a sham-controlled study with galvanic vestibular stimula-tion, Neurosci. Lett. 550, 35–40.
Ferrè, E. R., Bottini, G., Iannetti, G. D. and Haggard, P. (2013b). The balance of feelings:vestibular modulation of bodily sensations, Cortex 49, 748–758.

28 M. W. Greenlee et al. / Multisensory Research (2016)
Ferrè, E. R., Kaliuzhna, M., Herbelin, B., Haggard, P. and Blanke, O. (2014). Vestibular-somatosensory interactions: effects of passive whole-body rotation on somatosensory de-tection, PLoS ONE 9, e86379. DOI:10.1371/journal.pone.0086379.
Fetsch, C. R., Turner, A. H., DeAngelis, G. C. and Angelaki, D. E. (2009). Dynamic reweightingof visual and vestibular cues during self-motion perception, J. Neurosci. 29, 15601–15612.
Fetsch, C. R., DeAngelis, G. C. and Angelaki, D. E. (2013). Bridging the gap between theoriesof sensory cue integration and the physiology of multisensory neurons, Nat. Rev. Neurosci.14, 429–442.
Frank, S. M. and Greenlee, M. W. (2014). An MRI-compatible caloric stimulation device forthe investigation of human vestibular cortex, J. Neurosci. Meth. 235, 208–218.
Frank, S. M., Baumann, O., Mattingley, J. B. and Greenlee, M. W. (2014). Vestibular and visualresponses in human posterior insular cortex, J. Neurophysiol. 112, 2481–2491.
Frank, S. M., Wirth, A. M. and Greenlee, M. W. (subm.). Visual–vestibular processing in thehuman Sylvian fissure.
Galletti, C. and Fattori, P. (2003). Neuronal mechanisms for detection of motion in the field ofview, Neuropsychologia 41, 1717–1727.
Galletti, C., Squatrito, S., Battaglini, P. P. and Grazia Maioli, M. (1984). ‘Real-motion’ cells inthe primary visual cortex of macaque monkeys, Brain Res. 301, 95–110.
Galletti, C., Battaglini, P. P. and Aicardi, G. (1988). ‘Real-motion’ cells in visual area V2 ofbehaving macaque monkeys, Exp. Brain Res. 69, 279–288.
Galletti, C., Battaglini, P. P. and Fattori, P. (1990). ‘Real-motion’ cells in area V3A of macaquevisual cortex, Exp. Brain Res. 82, 67–76.
Gamberini, M., Fattori, P. and Galletti, C. (2015). The medial parietal occipital areas in themacaque monkey, Vis. Neurosci. 32, E013. DOI:10.1017/S0952523815000103.
Gibson, J. J. (1950). The Perception of the Visual World. Houghton Mifflin, Boston, MA, USA.Grabherr, L., Nicoucar, K., Mast, F. W. and Merfeld, D. M. (2008). Vestibular thresholds for
yaw rotation about an Earth-vertical axis as a function of frequency, Exp. Brain Res. 186,677–681.
Grantham, D. W. and Wightman, F. L. (1979). Auditory motion aftereffects, Percept. Psy-chophys. 26, 403–408.
Greenlee, M. W. (2000). Human cortical areas underlying the perception of optic flow: brainimaging studies, Int. Rev. Neurobiol. 44, 269–292.
Gu, Y., Watkins, P. V., Angelaki, D. E. and DeAngelis, G. C. (2006). Visual and nonvisualcontributions to three-dimensional heading selectivity in the medial superior temporal area,J. Neurosci. 26, 73–85.
Gu, Y., DeAngelis, G. C. and Angelaki, D. E. (2007). A functional link between area MSTd andheading perception based on vestibular signals, Nat. Neurosci. 10, 1038–1047.
Gu, Y., Angelaki, D. E. and DeAngelis, G. C. (2008). Neural correlates of multisensory cueintegration in macaque MSTd, Nat. Neurosci. 11, 1201–1210.
Gu, Y., Fetsch, C. R., Adeyemo, B., DeAngelis, G. C. and Angelaki, D. E. (2010). Decodingof MSTd population activity accounts for variations in the precision of heading perception,Neuron 66, 596–609.
Gu, Y., DeAngelis, G. C. and Angelaki, D. E. (2012). Causal links between dorsal medialsuperior temporal area neurons and multisensory heading perception, J. Neurosci. 32, 2299–2313.

Multisensory Research (2016) DOI:10.1163/22134808-00002527 29
Guldin, W. O. and Grüsser, O. J. (1998). Is there a vestibular cortex? Trends Neurosci. 21,254–259.
Hitier, M., Besnard, S. and Smith, P. F. (2014). Vestibular pathways involved in cognition, Front.Integr. Neurosci. 8, 59. DOI:10.3389/fnint.2014.00059.
Holten, V., Van der Smagt, M. J., Donker, S. F. and Verstraten, F. A. (2014). Illusory motion ofthe motion aftereffect induces postural sway, Psychol. Sci. 25, 1831–1834.
Huang, R.-S., Chen, C.-F. and Sereno, M. I. (2015). Neural substrates underlying the passiveobservation and active control of translational egomotion, J. Neurosci. 35, 4258–4267.
Huk, A. C., Dougherty, R. F. and Heeger, D. J. (2002). Retinotopy and functional subdivisionof human areas MT and MST, J. Neurosci. 22, 7195–7205.
Ionta, S., Heydrich, L., Lenggenhager, B., Mouthon, M., Fornari, E., Chapuis, D., Gassert, R.and Blanke, O. (2011). Multisensory mechanisms in temporo-parietal cortex support self-location and first-person perspective, Neuron 70, 363–374.
Kaliuzhna, M., Prsa, M., Gale, S., Lee, S. J. and Blanke, O. (2015). Learning to integrate con-tradictory multisensory self-motion cue pairings, J. Vis. 15, 15.1.10. DOI:10.1167/15.1.10.
Kaminiarz, A., Schlack, A., Hoffmann, K. P., Lappe, M. and Bremmer, F. (2014). Visualselectivity for heading in the macaque ventral intraparietal area, J. Neurophysiol. 112, 2470–2480.
Kitagawa, N. and Ichihara, S. (2002). Hearing visual motion in depth, Nature 416(6877), 172–174.
Kleinschmidt, A., Thilo, K. V., Büchel, C., Gresty, M. A., Bronstein, A. M. and Frackowiak,R. S. J. (2002). Neural correlates of visual-motion perception as object- or self-motion,NeuroImage 16, 873–882.
Koenderink, J. J. (1986). Optic flow, Vis. Res. 26, 161–179.Kommerell, G. and Thiele, H. (1970). Der optokinetische Kurzreiznystagmus [Optokinetic
short-stimulation nystagmus], Graefes Arch. Klin. Exp. Ophthalmol. 179(3), 220–234.Konkle, T. and Moore, C. I. (2009). What can crossmodal aftereffects reveal about neural rep-
resentation and dynamics? Commun. Integr. Biol. 2, 479–481.Konkle, T., Wang, Q., Hayward, V. and Moore, C. I. (2009). Motion aftereffects transfer be-
tween touch and vision, Curr. Biol. 19, 745–750.Kontsevich, L. L. and Tyler, C. W. (1999). Bayesian adaptive estimation of psychometric slope
and threshold, Vis. Res. 39, 2729–2737.Körding, K. P., Beierholm, U., Ma, W. J., Quartz, S., Tenenbaum, J. B. and
Shams, L. (2007). Causal inference in multisensory perception, PLoS ONE 2, e943.DOI:10.1371/journal.pone.0000943.
Lackner, J. R. and DiZio, P. (2005). Vestibular, proprioceptive, and haptic contributions to spa-tial orientation, Annu. Rev. Psychol. 56, 115–147.
Lappe, M. and Rauschecker, J. P. (1993). A neural network for the processing of optic flow fromego-motion in man and higher mammals, Neural Comp. 5, 374–391.
Lappe, M. and Rauschecker, J. P. (1994). Heading detection from optic flow, Nature 369(6483),712–713.
Lappe, M., Bremmer, F., Pekel, M., Thiele, A. and Hoffmann, K. P. (1996). Optic flow process-ing in monkey STS: a theoretical and experimental approach, J. Neurosci. 16, 6265–6285.
Lappe, M., Pekel, M. and Hoffmann, K.-P. (1998). Optokinetic eye movements elicited by radialoptic flow in the macaque monkey, J. Neurophysiol. 79, 1461–1480.

30 M. W. Greenlee et al. / Multisensory Research (2016)
Lappe, M., Bremmer, F. and Van den Berg, A. V. (1999). Perception of self-motion from visualflow, Trends Cogn. Sci. 3, 329–336.
Lobel, E., Kleine, J., Le Bihan, D., Leroy-Willig, A. and Berthoz, A. (1998). Functional MRIof galvanic vestibular stimulation, J. Neurophysiol. 80, 2699–2709.
Lopez, C. and Blanke, O. (2011). The thalamocortical vestibular system in animals and humans,Brain Res. Rev. 67, 119–146.
Lopez, C., Blanke, O. and Mast, F. W. (2012). The human vestibular cortex revealed bycoordinate-based activation likelihood estimation meta-analysis, Neuroscience 212, 159–179.
MacNeilage, P. R., Banks, M. S., Berger, D. R. and Bülthoff, H. H. (2007). A Bayesian modelof the disambiguation of gravitoinertial force by visual cues, Exp. Brain Res. 179, 263–290.
MacNeilage, P. R., Banks, M. S., DeAngelis, G. C. and Angelaki, D. E. (2010). Vestibularheading discrimination and sensitivity to linear acceleration in head and world coordinates,J. Neurosci. 30, 9084–9094.
Mather, G., Pavan, A., Campana, G. and Casco, C. (2008). The motion aftereffect reloaded,Trends Cogn. Sci. 12, 481–487.
Mergner, T. and Rosemeier, T. (1998). Interaction of vestibular, somatosensory and visualsignals for postural control and motion perception under terrestrial and microgravity con-ditions — a conceptual model, Brain Res. Rev. 28, 118–135.
Mergner, T., Nardi, G., Becker, W. and Deecke, L. (1983). The role of canal-neck interactionfor the perception of horizontal trunk and head rotation, Exp. Brain Res. 49, 198–208.
Morgan, M. L., DeAngelis, G. C. and Angelaki, D. E. (2008). Multisensory integration inmacaque visual cortex depends on cue reliability, Neuron 59, 662–673.
Morris, A. P., Kubischik, M., Hoffmann, K.-P., Krekelberg, B. and Bremmer, F. (2012). Dy-namics of eye-position signals in the dorsal visual system, Curr. Biol. 22, 173–179.
Morrone, M. C., Tosetti, M., Montanaro, D., Fiorentini, A., Cioni, G. and Burr, D. C. (2000).A cortical area that responds specifically to optic flow, revealed by fMRI, Nat. Neurosci. 3,1322–1328.
Ni, J., Tatalovic, M., Straumann, D. and Olasagasti, I. (2013). Gaze direction affects linearself-motion heading discrimination in humans, Eur. J. Neurosci. 38, 3248–3260.
Orban, G. A., Fize, D., Peuskens, H., Denys, K., Nelissen, K., Sunaert, S., Todd, J. and Van-duffel, W. (2003). Similarities and differences in motion processing between the human andmacaque brain: evidence from fMRI, Neuropsychologia 41, 1757–1768.
Page, W. K. and Duffy, C. J. (2003). Heading representation in MST: sensory interactions andpopulation encoding, J. Neurophysiol. 89, 1994–2013.
Perrone, J. A. and Stone, L. S. (1994). A model of self-motion estimation within primate ex-trastriate visual cortex, Vis. Res. 34, 2917–2938.
Pfeiffer, C., Lopez, C., Schmutz, V., Duenas, J. A., Martuzzi, R. and Blanke, O. (2013). Mul-tisensory origin of the subjective first-person perspective: visual, tactile, and vestibularmechanisms, PLoS ONE 8, e61751. DOI:10.1371/journal.pone.0061751.
Pfeiffer, C., Schmutz, V. and Blanke, O. (2014). Visuospatial viewpoint manipulation duringfull-body illusion modulates subjective first-person perspective, Exp. Brain Res. 232, 4021–4033.
Pfeiffer, C., van Elk, M., Bernasconi, F. and Blanke, O. (2016). Distinct vestibular effects onearly and late somatosensory cortical processing in humans, NeuroImage 125, 208–219.

Multisensory Research (2016) DOI:10.1163/22134808-00002527 31
Pitzalis, S., Sereno, M. I., Committeri, G., Fattori, P., Galati, G., Tosoni, A. and Galletti, C.(2013). The human homologue of macaque area V6A, NeuroImage 82, 517–530.
Pitzalis, S., Fattori, P. and Galletti, C. (2015). The human cortical areas V6 and V6A, Vis.Neurosci. 32, E007. DOI:10.1017/S0952523815000048.
Priesol, A. J., Valko, Y., Merfeld, D. M. and Lewis, R. F. (2014). Motion perception in patientswith idiopathic bilateral vestibular hypofunction, Otolaryngol. Head Neck Surg. 150, 1040–1042.
Probst, T., Straube, A. and Bles, W. (1985). Differential effects of ambivalent visual–vestibular–somatosensory stimulation on the perception of self-motion, Behav. Brain Res. 16, 71–79.
Prsa, M., Gale, S. and Blanke, O. (2012). Self-motion leads to mandatory cue fusion acrosssensory modalities, J. Neurophysiol. 108, 2282–2291.
Riecke, B. E. and Jordan, J. D. (2015). Comparing the effectiveness of different dis-plays in enhancing illusions of self-movement (vection), Front. Psychol. 6, 713.DOI:10.3389/fpsyg.2015.00713.
Roach, N. W., Heron, J. and McGraw, P. V. (2006). Resolving multisensory conflict: a strategyfor balancing the costs and benefits of audio-visual integration, Proc. R. Soc. B Biol. Sci.273, 2159–2168.
Schlack, A., Hoffmann, K. P. and Bremmer, F. (2002). Interaction of linear vestibular and visualstimulation in the macaque ventral intraparietal area (VIP), Eur. J. Neurosci. 16, 1877–1886.
Seemungal, B. M. (2014). The cognitive neurology of the vestibular system, Curr. Opin. Neurol.27, 125–132.
Seno, T., Ito, H. and Sunaga, S. (2010). Vection aftereffects from expanding/contracting stimuli,Seeing Perceiving 23, 273–294.
Sereno, M. I. and Huang, R. S. (2006). A human parietal face area contains aligned head-centered visual and tactile maps, Nat. Neurosci. 9, 1337–1343.
Sereno, M. I. and Huang, R. S. (2014). Multisensory maps in parietal cortex, Curr. Opin. Neu-robiol. 24, 39–46.
Shenoy, K. V., Bradley, D. C. and Andersen, R. A. (1999). Influence of gaze rotation on thevisual response of primate MSTd neurons, J. Neurophysiol. 81, 2764–2786.
Shu, Z. J., Swindale, N. V. and Cynader, M. S. (1993). Spectral motion produces an auditoryafter-effect, Nature 364(6439), 721–723.
Smith, A. T., Wall, M. B. and Thilo, K. V. (2012). Vestibular inputs to human motion-sensitivevisual cortex, Cereb. Cortex 22, 1068–1077.
Sommer, M. A. and Wurtz, R. H. (2008). Brain circuits for the internal monitoring of move-ments, Annu. Rev. Neurosci. 31, 317–338.
Sperry, R. W. (1950). Neural basis of the spontaneous optokinetic response produced by visualinversion, J. Comp. Physiol. Psychol. 43, 482–489.
Stephan, T., Deutschländer, A., Nolte, A., Schneider, E., Wiesmann, M., Brandt, T. and Di-eterich, M. (2005). Functional MRI of galvanic vestibular stimulation with alternating cur-rents at different frequencies, NeuroImage 26, 721–732.
Sunaert, S., Van Hecke, P., Marchal, G. and Orban, G. A. (1999). Motion-responsive regions ofthe human brain, Exp. Brain Res. 127, 355–370.
Sutherland, N. S. (1961). Figural aftereffects and apparent size, Q. J. Exp. Psychol. 13, 222–228.

32 M. W. Greenlee et al. / Multisensory Research (2016)
Takahashi, K., Gu, Y., May, P. J., Newlands, S. D., DeAngelis, G. C. and Angelaki, D. E. (2007).Multimodal coding of three-dimensional rotation and translation in area MSTd: comparisonof visual and vestibular selectivity, J. Neurosci. 27, 9742–9768.
Uesaki, M. and Ashida, H. (2015). Optic-flow selective cortical sensory regions associated withself-reported states of vection, Front. Psychol. 6, 775. DOI:10.3389/fpsyg.2015.00775.
Upadhyay, U. D., Page, W. K. and Duffy, C. J. (2000). MST responses to pursuit across opticflow with motion parallax, J. Neurophysiol. 84, 818–826.
Valko, Y., Lewis, R. F., Priesol, A. J. and Merfeld, D. M. (2012). Vestibular labyrinth contribu-tions to human whole-body motion discrimination, J. Neurosci. 32, 13537–13542.
Vallar, G., Sterzi, R., Bottini, G., Cappa, S. and Rusconi, M. L. (1990). Temporary remission ofleft hemianesthesia after vestibular stimulation. A sensory neglect phenomenon, Cortex 26,123–131.
Van den Berg, A. V. (1993). Perception of heading, Nature 365(6446), 497–498.von Holst, E. and Mittelstaedt, H. (1950). Das Reafferenzprinzip, Naturwissenschaften 37, 464–
476.Wall, M. B. and Smith, A. T. (2008). The representation of egomotion in the human brain, Curr.
Biol. 18, 191–194.Wallace, M. T., Roberson, G., Hairston, W. D., Stein, B. E., Vaughan, J. W. and Schirillo, J. A.
(2004). Unifying multisensory signals across time and space, Exp. Brain Res. 158, 252–258.Warren, W. H. and Hannon, D. J. (1988). Direction of self-motion is perceived from optical
flow, Nature 336(6195), 162–163.Warren, W. H. and Hannon, D. J. (1990). Eye movements and optical flow, J. Opt. Soc. Am. A
7, 160–169.Watanabe, J., Hayashi, S., Kajimoto, H., Tachi, S. and Nishida, S. (2007). Tactile motion af-
tereffects produced by appropriate presentation for mechanoreceptors, Exp. Brain Res. 180,577–582.
Wexler, M., Panerai, F., Lamouret, I. and Droulez, J. (2001). Self-motion and the perception ofstationary objects, Nature 409(6816), 85–88.
Yu, C. P., Page, W. K., Gaborski, R. and Duffy, C. J. (2010). Receptive field dynamics underly-ing MST neuronal optic flow selectivity, J. Neurophysiol. 103, 2794–2807.
Zhang, T. and Britten, K. H. (2011). Parietal area VIP causally influences heading perceptionduring pursuit eye movements, J. Neurosci. 31, 2569–2575.
Zhang, T., Heuer, H. W. and Britten, K. H. (2004). Parietal area VIP neuronal responses toheading stimuli are encoded in head-centered coordinates, Neuron 42, 993–1001.
zu Eulenburg, P., Baumgärtner, U., Treede, R.-D. and Dieterich, M. (2013). Interoceptive andmultimodal functions of the operculo-insular cortex: tactile, nociceptive and vestibular rep-resentations, NeuroImage 83, 75–86.