multivariate analysis for dummies
TRANSCRIPT
Multivariate Data Analysis
FOR
DUMmIES‰
CAMO SOFTWARE SPECIAL EDITION
by Brad Swarbrick, CAMO Software
A John Wiley and Sons, Ltd, Publication
Multivariate Data Analysis For Dummies®, CAMO Software Special EditionPublished by John Wiley & Sons, Ltd The Atrium Southern Gate Chichester West Sussex PO19 8SQ England www.wiley.com
Copyright © 2012 John Wiley & Sons, Ltd, Chichester, West Sussex, EnglandPublished by John Wiley & Sons, Ltd, Chichester, West SussexAll Rights Reserved. No part of this publication may be reproduced, stored in a retrieval system or transmitted in any form or by any means, electronic, mechanical, photocopying, recording, scanning or otherwise, except under the terms of the Copyright, Designs and Patents Act 1988 or under the terms of a licence issued by the Copyright Licensing Agency Ltd, Saffron House, 6-10 Kirby Street, London EC1N 8TS, UK, without the permission in writing of the Publisher. Requests to the Publisher for permission should be addressed to the Permissions Department, John Wiley & Sons, Ltd, The Atrium, Southern Gate, Chichester, West Sussex, PO19 8SQ, England, or emailed to [email protected], or faxed to (44) 1243 770620.Trademarks: Wiley, the Wiley logo, For Dummies, the Dummies Man logo, A Reference for the Rest of Us!, The Dummies Way, Dummies Daily, The Fun and Easy Way, Dummies.com, Making Everything Easier, and related trade dress are trademarks or registered trademarks of John Wiley & Sons, Inc., and/or its affiliates in the United States and other countries, and may not be used without written permission. All other trademarks are the property of their respective owners. John Wiley & Sons, Inc., is not associated with any product or vendor mentioned in this book.
LIMIT OF LIABILITY/DISCLAIMER OF WARRANTY: THE PUBLISHER AND THE AUTHOR MAKE NO REPRESENTATIONS OR WARRANTIES WITH RESPECT TO THE ACCURACY OR COMPLETENESS OF THE CONTENTS OF THIS WORK AND SPECIFICALLY DISCLAIM ALL WARRANTIES, INCLUDING WITHOUT LIMITATION WARRANTIES OF FITNESS FOR A PARTICULAR PURPOSE. NO WARRANTY MAY BE CREATED OR EXTENDED BY SALES OR PROMOTIONAL MATERIALS. THE ADVICE AND STRATEGIES CONTAINED HEREIN MAY NOT BE SUITABLE FOR EVERY SITUATION. THIS WORK IS SOLD WITH THE UNDERSTANDING THAT THE PUBLISHER IS NOT ENGAGED IN RENDERING LEGAL, ACCOUNTING, OR OTHER PROFESSIONAL SERVICES. IF PROFESSIONAL ASSISTANCE IS REQUIRED, THE SERVICES OF A COMPETENT PROFESSIONAL PERSON SHOULD BE SOUGHT. NEITHER THE PUBLISHER NOR THE AUTHOR SHALL BE LIABLE FOR DAMAGES ARISING HEREFROM. THE FACT THAT AN ORGANIZATION OR WEBSITE IS REFERRED TO IN THIS WORK AS A CITATION AND/OR A POTENTIAL SOURCE OF FURTHER INFORMATION DOES NOT MEAN THAT THE AUTHOR OR THE PUBLISHER ENDORSES THE INFORMATION THE ORGANIZATION OR WEBSITE MAY PROVIDE OR RECOMMENDATIONS IT MAY MAKE. FURTHER, READERS SHOULD BE AWARE THAT INTERNET WEBSITES LISTED IN THIS WORK MAY HAVE CHANGED OR DISAPPEARED BETWEEN WHEN THIS WORK WAS WRITTEN AND WHEN IT IS READ. SOME OF THE EXERCISES AND DIETARY SUGGESTIONS CONTAINED IN THIS WORK MAY NOT BE APPROPRIATE FOR ALL INDIVIDUALS, AND READERS SHOULD CONSULT WITH A PHYSICIAN BEFORE COMMENCING ANY EXERCISE OR DIETARY PROGRAM.
For general information on our other products and services, please contact our Customer Care Department within the U.S. at 877-762-2974, outside the U.S. at 317-572-3993, or fax 317-572-4002.For technical support, please visit www.wiley.com/techsupport.Wiley publishes in a variety of print and electronic formats and by print-on-demand. Some material included with standard print versions of this book may not be included in e-books or in print-on-demand. If this book refers to media such as a CD or DVD that is not included in the version you purchased, you may download this material at http://booksupport.wiley.com. For more information about Wiley products, visit www.wiley.com.British Library Cataloguing in Publication Data: A catalogue record for this book is available from the British LibraryISBN 978-1-119-97722-3 (ebk)

Publisher’s AcknowledgmentsWe’re proud of this book; please send us your comments at http://dummies.custhelp.com. For other comments, please contact our Customer Care Department within the U.S. at 877-762-2974, outside the U.S. at 317-572-3993, or fax 317-572-4002.Some of the people who helped bring this book to market include the following:
Editorial and Vertical Websites
Project Editor: Simon BellCommissioning Editor: Scott SmithProject Manager: Kelly EwingProduction Manager: Daniel MerseyPublisher: David Palmer
Composition Services
Project Coordinator: Kristie ReesLayout and Graphics: Mark Pinto,
Lavonne RobertsProofreader: Jessica Kramer
Publishing and Editorial for Consumer Dummies
Kathleen Nebenhaus, Vice President and Executive PublisherKristin Ferguson-Wagstaffe, Product Development DirectorEnsley Eikenburg, Associate Publisher, TravelKelly Regan, Editorial Director, Travel
Publishing for Technology Dummies
Andy Cummings, Vice President and PublisherComposition Services
Debbie Stailey, Director of Composition Services

Contents at a GlanceIntroduction ............................................................................................... 1Chapter 1: Getting Your First Look at Multivariate Data Analysis ...... 5Chapter 2: Exploratory Data Analysis ................................................... 13Chapter 3: Using Regression Analysis and Predictive Models .......... 19Chapter 4: Sorting with Classification Models .................................... 25Chapter 5: Ten Facts to Remember about Multivariate
Data Analysis ..................................................................................... 29

Table of ContentsIntroduction . . . . . . . . . . . . . . . . . . . . . . . . . . . . . . . . . . . . . .1
About This Book ........................................................................ 1Foolish Assumptions ................................................................. 1How This Book Is Organised .................................................... 2Icons Used in This Book ............................................................ 2Where to Go from Here ............................................................. 3
Chapter 1: Getting Your First Look at Multivariate Data Analysis . . . . . . . . . . . . . . . . . . . . . . . . . . . . . . . . . . .5
The World Is Multivariate ......................................................... 5Comparing Multivariate to Classical Statistical
Approaches ............................................................................. 7Applications of Multivariate Data Analysis .......................... 11
Chapter 2: Exploratory Data Analysis . . . . . . . . . . . . . . .13Finding the Hidden Structure ................................................. 13The Relationship Between Samples and Variables ............. 14Examining the Methods Used in EDA .................................... 15Getting an Inside Look at PCA ................................................ 16
Chapter 3: Using Regression Analysis and Predictive Models . . . . . . . . . . . . . . . . . . . . . . . . . .19
Getting Up to Speed with Regression Analysis .................... 19Exploring Multivariate Regression Methods ........................ 21Examining the Outputs of Multivariate Regression ............. 22Applying Multivariate Regression .......................................... 22
Chapter 4: Sorting with Classification Models . . . . . . .25Defining Classification ............................................................. 25Classification in Practice ......................................................... 27
viii Multivariate Data Analysis For Dummies
Chapter 5: Ten Facts to Remember about Multivariate Data Analysis . . . . . . . . . . . . . . . . . . . . . .29
MVA Is All about the Pictures ................................................ 29Only Certain Info Matters........................................................ 29Data Isn’t Hidden Anymore ..................................................... 30MVA Is More Efficient .............................................................. 30You Can Make Predictive Models .......................................... 30You Can Perform Complex Classification ............................. 30MVA Is Fast and Detailed ........................................................ 30Don’t Overlook Validation ...................................................... 31DoE Goes Hand in Hand with MVA ........................................ 31Correlation Doesn’t Necessarily Mean Causation ............... 31
Introduction
W elcome to Multivariate Data Analysis For Dummies, your guide to the rapidly growing area of data mining
and predictive analytics. Multivariate analysis is set to change the mindset of many industries and the way they approach the daunting task of analyzing large sets of data to extract the information they really need.
About This BookMultivariate data analysis provides the foundation of some of the buzz phrases being used for data analysis applications, but what exactly is multivariate analysis all about and why is it an essential part of the data analyst’s toolkit? This book is about taking the complexity out of the methodology, introducing the terminology, stating the facts and outlining some examples of how multivariate data analysis is used in industry.
This book attempts to provide a starting point to those who need a better way of getting the most out of their important intellectual property, such as their data. The tools used by multivariate analysis provide true meaning to data mining and predictive analytics. Once you get started, multivariate analy-sis will open a whole new world and lead you to outcomes you would never have achieved using classical statistical and simple plotting procedures.
Foolish AssumptionsIn writing this book, we’ve made some assumptions about you. We assume that
✓ You work with large data sets in a variety of industries or are a member of a research and development group.
Multivariate Data Analysis For Dummies 2 ✓ You’re struggling with the methods you currently use to
get the most out of your data and are looking for a viable alternative.
✓ You’ve seen or heard about multivariate analysis from a website or from a colleague, but the first steps seem too daunting to make any real progress.
✓ You’ve heard the buzz phrases but want to know exactly what they mean and how they apply to you.
How This Book Is OrganisedMultivariate Data Analysis For Dummies is organised into five discrete and informative chapters:
✓ Chapter 1 explains the motivation behind multivariate methods of analysis and the advantages of the multivari-ate approach over classical approaches.
✓ Chapter 2 describes the concept of hidden structure in a data set and the methods used to reveal such struc-ture. We introduce the concepts of cluster analysis and Principal Component Analysis (PCA).
✓ Chapter 3 describes the elements of multivariate regres-sion and how you can develop these models to reliably estimate future values so as to make well-informed deci-sions based on past events.
✓ Chapter 4 describes how you can use multivariate meth-ods to classify objects from simple measurements right through to the most complex of data.
✓ Chapter 5 highlights ten important things to remember about multivariate data analysis and how you can apply it in real life.
Icons Used in This BookTo make navigation to particular information even easier, these icons highlight key text:
This icon highlights important information to bear in mind.

Introduction 3 This icon flags up places you can go for more information.
This icon indicates a real-life example to illustrate a point.
This icon marks the place where technical matters are high-lighted and where you may need to think a little more care-fully about something.
Where to Go from HereAs with all For Dummies books, you can dip in and out of this guide as you like or read it from cover to cover. Use the head-ings to guide you to the information you need. And if you need more information, please contact us at [email protected].

Multivariate Data Analysis For Dummies 4
Chapter 1
Getting Your First Look at Multivariate Data Analysis
In This Chapter▶ Introducing multivariate data analysis▶ Looking at multivariate and classical approaches▶ Applying MVA in real-life situations
F rom an early age, most people are taught that the best way to investigate a problem is to investigate it one vari-
able at a time. For some problems, this approach is perfectly acceptable, especially when the variables have a simple one-to-one relationship.
However, when the relationships become more complex, a single variable can’t adequately describe the system. This is where Multivariate Analysis (MVA) is most useful.
The World Is MultivariateIf you could solve all problems by taking a single measure-ment on a system, the world would be a much simpler place to live in. However, complex systems require multiple mea-surements to better understand them.
Take, for example, predicting the weather. To adequately pre-dict the temperature for a particular day, meteorologists require information on pressure, wind conditions, humidity, season and so on. This data enables them to build a model, which in turn allows for an estimate of what the future may hold.
Multivariate Data Analysis For Dummies 6Multivariate data analysis is the investigation of many vari-ables, simultaneously, in order to understand the relation-ships that may exist between them. MVA can be as simple as analysing two variables right up to millions.
Multivariate analysis adds a much-needed toolkit when compared to the usual way people look at data. This highly graphical approach seeks to explore what is ‘hidden’ in the numbers. The old saying ‘A picture is worth a thousand words’ is true. Rather than just presenting many disjointed graphs to analyse complex data, multivariate analysis com-bines it all into one interpretable picture. It’s like viewing the maze from the top down so that you can get a clear path to the solution.
Wanted and unwanted variabilityMVA is the study of variability and its sources. Variability may be defined as wanted or unwanted.
✓ Wanted variability may include turning the knobs on a machine to assess the impact it has on the quality of a process or exposing samples to seasonal changes to assess the impact it has on the quality of the product.
✓ Unwanted variability results from the inability to control something and is usually random in nature. For example, setting a machine up with specific operating parameters leads to highly inconsistent results after you run it a few times, such as when thermostat failure in an oven can lead to inconsistent cooking times.
A model is a summary of your best knowledge of a system at the time of investigation. You can use a good model to predict future events with confidence. You can validate a good model to show that it’s fit for its intended purpose.
A multivariate model is capable of showing the influence that both types of variability (wanted and unwanted) can have on a system so that it can be better understood or improvements can be made (if required).
Chapter 1: Getting Your First Look at Multivariate Data Analysis 7
Types of multivariate analysisMVA can be broadly classified into three main areas:
✓ Exploratory Data Analysis (EDA): Sometimes called data mining this area is useful for gaining deeper insights into large, complex data sets. (See Chapter 2.)
✓ Regression analysis: Develops models to predict new and future events. Is useful for predictive analytics appli-cations. (See Chapter 3.)
✓ Classification for identifying new or existing classes: This area is useful in research, development, market analysis, and so on. (See Chapter 4.)
Each method, used alone, can lead to better insights. However, when used together, these methods can further enhance the understanding of a system.
Comparing Multivariate to Classical Statistical Approaches
Imagine that you were given a spreadsheet with 10 columns of data (the variables) measured on 50 rows (the samples [objects]). How would you go about analysing such data?
Finding additional infoYou can visit the following websites to find out more about multivariate data analysis:
✓ CAMO Software: www.camo.com
✓ Wikipedia www.wikipedia.org
Multivariate Data Analysis For Dummies 8Your classical training probably tells you to
✓ Plot the columns together two at a time
✓ Plot each variable for all samples and look for trends
Both of these approaches lead to frustration in a very short period of time because of information overload and the time and effort required to make each plot. Therefore, most people tend to make assumptions because they don’t have an effec-tive way to analyse all data simultaneously. This is the reason why a straight univariate (or one variable at a time) analysis often misses important conclusions. It is too simplistic for measuring complex data.
You’ve probably heard of mean or average, standard devia-tions and a lot of other statistics that describe one variable, but provide no information on how that one variable relates to others. A straight univariate approach only provides part of the overall picture.
The pitfalls of univariate analysisWhile univariate approaches serve their purposes for inves-tigating and understanding simple systems, they tend to fail when more complex systems are being analysed in the follow-ing respects
✓ They may provide an oversimplistic and overoptimistic assessment of the data. This approach plays to human nature as we are often looking for the easy answer and avoid problems that become even slightly complex.
✓ They fail to detect the relationships that may exist between the variables being studied because they treat all such variables as being independent of each other.
This second point is known as covariance or correlation and is a central theme in MVA. Covariance describes the influence that one variable has on others and is often missed when a simple data analysis approach is used. It’s important to emphasise that a strong correlation between variables doesn’t necessarily explain causality.
Chapter 1: Getting Your First Look at Multivariate Data Analysis 9
The benefits of multivariate analysisThe advantages of the MVA approach are provided in the following:
✓ MVA identifies variables that contribute most to the overall variability in the data.
✓ MVA helps to isolate those variables that are related – in other words, that co-vary with each other. You should take these variables into account in further developments.
✓ The highly graphical manner of presenting results allows for better interpretation (a picture is worth a thousand words) and helps to take some of the fear factor out of data analysis.
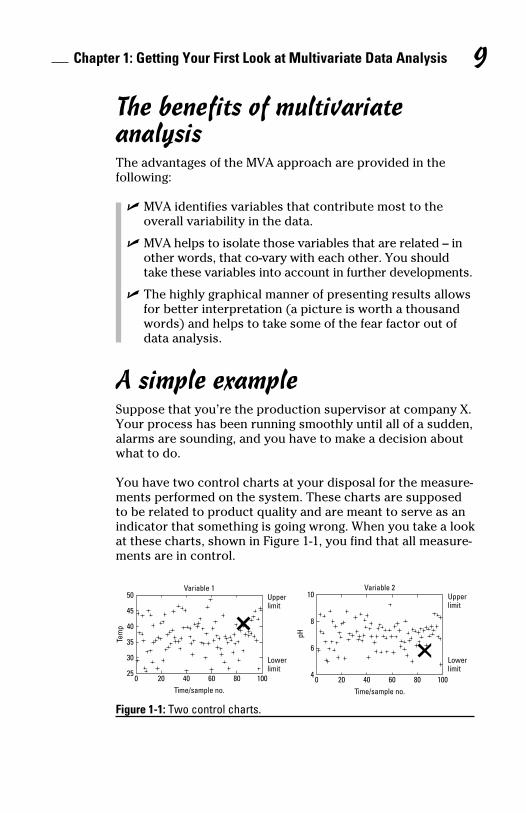
A simple exampleSuppose that you’re the production supervisor at company X. Your process has been running smoothly until all of a sudden, alarms are sounding, and you have to make a decision about what to do.
You have two control charts at your disposal for the measure-ments performed on the system. These charts are supposed to be related to product quality and are meant to serve as an indicator that something is going wrong. When you take a look at these charts, shown in Figure 1-1, you find that all measure-ments are in control.
Time/sample no.
Tem
p
pH
Variable 1
0 20 4025
30
35
40
45
50 10
8
6
460 100
Lower limit
Upperlimit
80Time/sample no.
Variable 2
0 20 40 60 100
Lowerlimit
Upperlimit
80
Figure 1-1: Two control charts.
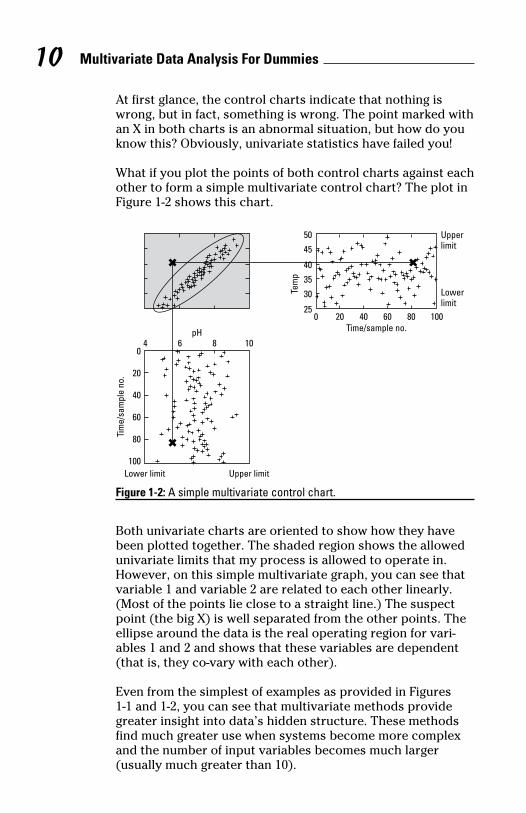
Multivariate Data Analysis For Dummies 10At first glance, the control charts indicate that nothing is wrong, but in fact, something is wrong. The point marked with an X in both charts is an abnormal situation, but how do you know this? Obviously, univariate statistics have failed you!
What if you plot the points of both control charts against each other to form a simple multivariate control chart? The plot in Figure 1-2 shows this chart.
Time/sample no.pH
Time/
sam
ple
no.
Tem
p
Upper limit
Upperlimit
Lowerlimit
Lower limit
0
10860
20
40
60
80
100
4
1002025
5045403530
60 8040
Figure 1-2: A simple multivariate control chart.
Both univariate charts are oriented to show how they have been plotted together. The shaded region shows the allowed univariate limits that my process is allowed to operate in. However, on this simple multivariate graph, you can see that variable 1 and variable 2 are related to each other linearly. (Most of the points lie close to a straight line.) The suspect point (the big X) is well separated from the other points. The ellipse around the data is the real operating region for vari-ables 1 and 2 and shows that these variables are dependent (that is, they co-vary with each other).
Even from the simplest of examples as provided in Figures 1-1 and 1-2, you can see that multivariate methods provide greater insight into data’s hidden structure. These methods find much greater use when systems become more complex and the number of input variables becomes much larger (usually much greater than 10).
Chapter 1: Getting Your First Look at Multivariate Data Analysis 11
Applications of Multivariate Data Analysis
You can apply multivariate analysis to any set of data that involves measurement on more than one variable. Although this statement is general, it’s also very true. With a change in mindset from traditional data analysis approaches to the multivariate mindset (and, of course, a little bit of a learning curve and some confidence), this approach will open a whole new world of opportunities and bring your data to life.
MVA has found widespread use in the following sectors:
✓ Pharmaceutical and biotechnology, particularly in Quality by Design (QbD) initiatives
✓ Petrochemical and refining operations, including early fault detection and gasoline blending and optimisation
✓ Food and beverage applications, particularly for con-sumer segmentation and new product development
✓ Agricultural analysis, including real-time analysis of pro-tein and moisture in wheat, barley and other crops
✓ Business Intelligence and marketing for predicting changes in dynamic markets or better product placement
✓ Oil and gas and mining, including analysis of machinery performance and locating new sources of commodities
Applications in the physical sciencesMVA is ideally suited to the following types of data:
✓ Spectroscopic applications, including nondestructive quantitative analysis of samples and raw material identification
✓ Genetics and metabolomics where very large data sets are generated and the search for new proteins/genomes is critical
Multivariate Data Analysis For Dummies 12 ✓ The combination of information from many isolated pro-
cess variables into a single model for predicting product quality during manufacturing
Applications in the social sciencesMVA was founded in the area of psychology and extends to the entire social sciences field as a means to understand:
✓ The influence of multiple stimuli on various patient groups
✓ How demographics relate to various social issues
Applications in business intelligenceIn Business Intelligence (BI), multiple factors act dynamically to influence the state of, or trends in, particular markets. You can use MVA to:
✓ Undertake true data mining in order to isolate new busi-ness sectors to approach with an existing portfolio
✓ Predict market or environmental trends leading to proac-tive change
✓ Better allocate resources to take advantage of current market situations and product placements
Applications in consumer scienceCompanies are always seeking new markets for their prod-ucts and better ways to sell them. Multivariate analysis is useful for
✓ Isolating demographics where products lines are better suited
✓ Assessing sensory data for new product introductions
✓ Formulating better products to meet consumer needs
Chapter 2
Exploratory Data AnalysisIn This Chapter▶ Looking for the hidden structure▶ Exploring cluster analysis▶ Delving into Principal Component Analysis (PCA)
W ith today’s data collection systems and databases, a wealth of information is available, but what should
you do with it to get the most out of it? The challenge of ana-lysing very large data sets may make you feel burdened by the sheer mass of data available and cause you to look to the usual classical approaches. However, those approaches typi-cally get you nowhere.
In this chapter, we discuss Exploratory Data Analysis (EDA). EDA is a powerful approach for extracting the information you need from such massive amounts of data.
Finding the Hidden StructureMost data is presented in the form of a spreadsheet. However, unless the spreadsheet is small in size, the information isn’t usually apparent visually – in other words, the information is hidden in the numbers.
Exploratory Data Analysis (EDA), which is sometimes known as data mining, attempts to find the hidden structure in large, complex data sets. This information helps you make a more informed decision and can sometimes lead to breakthroughs that wouldn’t have otherwise been observed using other methods of analysis.
Multivariate Data Analysis For Dummies 14Hidden structure results from the influence of all variables acting simultaneously – not just the influence of one variable – and is rarely obtainable using simple methods of analysis. Extracting this hidden information reveals the following:
✓ It shows important patterns or groupings. These patterns can give you the ability to classify new data into similar groups.
✓ It allows visualisation of interesting trends in the data, which can help you identify variables that have a time influence on the system.
✓ It reveals whether you can find any information at all in the data and helps you decide whether a different strat-egy may be better than the current one.
All this information is valuable in any practical situation.
The Relationship Between Samples and Variables
In MVA, the following principles hold, and the general termi-nology is used:
✓ The units you perform measurements on are called sam-ples or objects.
✓ In order to measure a sample, you need a set of variables that adequately describe them. For example, in order to see your computer (object), you need your eyes. (The variable is sight.)
✓ Samples can’t exist without variables to describe them, and you can’t define variables unless you have some-thing to measure them on. (The age old question – does an object exist if you can’t see it?)
In short, samples and variables are by necessity related to each other, and EDA tries to establish the importance of the variables you use in describing the samples you want to better understand.
Chapter 2: Exploratory Data Analysis 15
Examining the Methods Used in EDA
In most EDA applications, two main methods find the hidden structure of a data set:
✓ Cluster analysis
✓ Principal Component Analysis (PCA), or another method that generates so-called latent variables
Although PCA is also applied to visualise clusters in the data, it’s defined separately because it has many special properties that make it extremely useful for better under-standing systems.
While other EDA methods exist, the ones described in this chapter are some of the most common.
Cluster analysisCluster analysis is defined as the task of separating objects into groups (clusters) where the members of a particular cluster are similar to each other.
Principal Component AnalysisPrincipal Component Analysis (PCA) is the analysis of vari-ability (or the search for truth) in a particular set of data. PCA is known as the workhorse of multivariate methods. PCA provides some of the most powerful graphical tools for under-standing the relationships between samples and variables.
PCA is a universal data mining tool that you can apply to any situation where more than one variable is being measured on numerous samples. It is better suited to larger data sets – with more than 10 variables and 100 samples. PCA has wide appli-cability in both industry and research. In some applications, PCA is used to detect the onset of failure in processes.
Here are some common examples:
Multivariate Data Analysis For Dummies 16 ✓ Market analysis: Isolate consumer groups based on taste
testing panels. This can be useful for the wine and food and beverage sectors.
✓ Drug discovery: Select target molecules for investigation in the development of new drug substances for either blockbuster drugs or personalised medicines.
✓ Systems biology: Classify new genomic sequences by combination of PCA with micro-array or chromato-graphic data.
✓ Pharmaceutical analysis: Identify raw material lots using PCA and Near Infrared (NIR) spectroscopy.
✓ Business Intelligence: Isolate bottleneck in key pro-cesses or better utilise resources through the combina-tion of PCA and well-informed decision-making strategies.
For more details on how PCA works, see the next section.
Getting an Inside Look at PCAUsing PCA, you search the data for variables or combinations of variables that answer questions such as:
✓ Why do certain samples group together?
✓ Why do different groups (clusters) separate from each other?
✓ Why do samples trend the way they do?
✓ Is there any information in my data at all?
PCA answers these questions by separating the data into prin-cipal components (PCs). Each PC contributes to explaining the total variability, and the first PC describes the greatest source of variability. A PC therefore
✓ Defines which variables most contribute to the greatest sources of variability.
✓ Shows which variables are related to each other and which ones are not.
✓ Describes whether a particular set of variables are describing important structure or are just random noise.
Chapter 2: Exploratory Data Analysis 17
When all PCs are combined, the goal is to describe as much of the information in the system as possible in the fewest number of PCs, and whatever is left can be attributed to noise (no infor-mation). The general PCA relationship can be defined as follows:
DATA = INFORMATION + NOISE
In this case, the information is defined by the PCs, and the noise is what is left over. The total sum of PCs and noise must make up the original data.
Now, to better understand this concept, you need graphi-cal tools that show this information. PCA uses two powerful graphical visualisation tools that must be displayed together:
✓ Scores plot: Provides a map of the samples
✓ Loadings plot: Provides a map of the variables.
For more information on Scores and Loadings plots, please visit www.camo.com.
Other important plots in PCAPCA has wide applicability in both industry and research. In some applications, PCA is used to detect the onset of failure in processes. In order to do so, PCA requires some power-ful outlier detection tools. Here’s a list of some of the more important graphical tools:
✓ The influence plot shows in one plot how well each sample is modeled (from the X-residual distance) and how far each sample lies from the overall center of the model (from the leverage). X-residuals should be close to zero for well described samples. Leverage is on a scale from zero to one, with a leverage of 1 describing samples with extreme properties.
✓ The explained variance plot is used to determine how many PCs are required to describe a set of data.
✓ Sample and variable residual plots describe the impor-tance of each variable and how well a sample is modelled.
Multivariate Data Analysis For Dummies 18
Some general PCA guidelinesWhen interpreting the output of a PCA model, take into account the following guidelines:
✓ Always look at the explained variance plot first to see how many PCs are required to describe a reasonable portion of the variability. The less required, usually the better. If it takes many PCs to describe < 50 per cent of the data, the data set most likely contains only noise.
✓ After deciding how many PCs to use (from the explained variance plot), look at a scores plot of PC1 versus PC2 (and plot combinations for all PCs you have decided to use) and look for patterns. These patterns may reveal smaller data structures related to other phenomena occurring in the data.
✓ Use the loadings plots to interpret which variables most contribute to the sample groupings (if any exist). This helps you get a better picture of what is happening in your data set and also reveals any variables that interact with each other.
✓ Use the influence plot to determine whether all samples are described well by the model and use the leverage values to determine whether any extreme samples are present.
Simple models contain the fewest PCs and are most interpre-table, so always use the KISS principle (Keep It Simple, Stupid).
PCA and classificationWhen you can find distinct and definable clusters in a data set, you can develop separate PCA models for these clusters. These models define a library of known sample classes that you can use to classify new samples.
The most common method incorporating PCA models for clas-sification is called Soft Independent Modeling of Class Analogy (SIMCA). We describe this method further in Chapter 4.
In order to use PCA models for classification, or for early event detection, there has to be some limits defined around the model to show that a new sample belongs. If a new sample lies outside of these boundaries, it needs to be excluded.
Chapter 3
Using Regression Analysis and Predictive Models
In This Chapter▶ Looking at regression analysis▶ Experimenting with different multivariate regression methods▶ Analysing and applying the results of multivariate regression
R egression analysis and predictive models go hand in hand. In this chapter, we look at methods for developing
a model from the available data and assessing the quality of that model for predicting new results.
Getting Up to Speed with Regression Analysis
Regression analysis is the process of developing a model from the available data to predict a desired response (or responses). Regression analysis, unlike exploratory data analysis (see Chapter 2), requires two data tables, one of inde-pendent variables and one of dependent variables:
✓ Independent variables are the readily available mea-surements that you want to make a model on to predict the response of interest. These variables are also known as predictors. If you’re predicting weather, for example, you can forecast the daily temperature using a predic-tive model based on the pressure, humidity and other
Multivariate Data Analysis For Dummies 20relevant data currently available at the time. In this case, the response is temperature, and the predictors are pres-sure, humidity and so on.
✓ Dependent variables are the responses you’re trying to model from the independent variables. Responses depend on the independent variables used in the model. Examples of dependent data may include the strength of a pharmaceutical tablet, the uniformity of a chemi-cal reaction or the expected stock price of a particular investment.
The regression model relates one table to the other. You can then use the model to predict future samples.
Validation is criticalFor any multivariate modelling task, a model is only as good as its validation. Validation is the testing of a models fit-for-purpose characteristics.
You can validate a multivariate model in a number of ways. Besides validation at the conceptual or scien-tific level to confirm the underlying theory or background knowledge, the common principles for validation in multivariate data analysis are
✓ Cross-validation: Defined sample sets are left out of the modeling process, and a model is developed on the remaining samples. The omitted samples are checked against the model developed for quality of fit and are then put back into the pool of samples. A new segment of data is removed, and the process repeated until all samples have
been used up for modelling and validation.
✓ Test set validation: This method is the best way of validating a multivariate model as it uses a separate set of data to validate the model – in other words, the samples used in the training set aren’t used in the validation set.
The major benefits of validation include
✓ Finding the simplest and most reliable model
✓ Isolation of samples that highly influence the model
✓ Better interpretability of the model
✓ Assurance that the greatest vari-ability has been covered in the model with respect to the train-ing set
Chapter 3: Using Regression Analysis and Predictive Models 21
A regression model is only as good as the quality of the data used. If the independent variables are of high quality and the dependent variables are of poor quality, the model will also be of poor quality (and vice versa). Acceptable models are easy to interpret, are simple and can be validated. (For more on the importance of validation, see the nearby sidebar.)
Exploring Multivariate Regression Methods
Remember back to high school when you were confronted with a single independent variable and a single dependent variable, and you would plot the two variables together, with the independent variable on the x-axis and the depen-dent variable on the y-axis. If the plotted points resembled a straight line, then you’d fit the line of ‘best fit’ (in other words, the least squares line) of the form y = mx + b.
Multivariate regression is an extension of the simple straight line model case.
There are three commonly used multivariate regression methods, although others do exist:
✓ Multiple Linear Regression (MLR)
✓ Principal Component Regression (PCR)
✓ Partial Least Squares Regression (PLSR)
The last two methods are known as latent regression methods, which take advantage of the hidden structure in the data set. Based on PCA, these methods extract the most important information from the data. Using this latent information a model is fit that best models the response.
The major benefits of latent regression methods over other methods (such as MLR) is that they provide all the graphics associated with PCA – scores, loadings, explained variance and influence, to name a few. These extras allow better inter-pretability of the developed models and also provide a means of assessing the quality of future predictions.
Multivariate Data Analysis For Dummies 22 For more information on the specific multivariate regression
methods, please visit www.camo.com/resources.
Examining the Outputs of Multivariate Regression
When developing an MLR model, the main outputs are
✓ Analysis of variance (ANOVA) table
✓ Regression coefficients plot
✓ Predicted versus reference plot
✓ Residuals analysis
When developing a PCR/PLSR model, the main outputs are
✓ Scores plot
✓ Loadings plot (and the loadings weights plot for PLSR only)
✓ Regression coefficients plot
✓ Predicted versus reference plot
✓ Residuals analysis
✓ Various plots for detecting any outliers
Applying Multivariate Regression
Multivariate regression has found most extensive use in relation to the large amounts of data generated by modern scientific instruments, such as spectroscopy. The following list describes some important applications of multivariate regression in selected industries:
✓ Agriculture: When a delivery of grain is made to a receiv-ing point, analysis is made on the spot with the aid of Near Infrared spectroscopy. This instrument contains several multivariate models for predicting protein,
Chapter 3: Using Regression Analysis and Predictive Models 23moisture, starch and ash in the deliveries based on the collected spectra. From there, the farmer can be paid on the spot, without having to send many samples off to a laboratory for reference chemistry.
✓ Wine-making and viticulture: The wine-making indus-try has used multivariate regression for some time to quickly assess the quality of grapes in a nondestructive way before making table or fine wines. Other applications include predicting the quality of a wine fermentation and assessing the quality of finished wines in the bottle (without having to open them) using advanced analytical technologies.
✓ Marketing and product placement: In the food and bev-erage sectors, both trained panels and consumer target groups perform sensory analysis. Multivariate regression is used to develop preference maps that show the agree-ment between the trained panel and the consumers. Where relationships are strongest, this type of analysis is used for better product placement.
✓ Business Intelligence and predictive analytics: In dynamic markets or where a mass of data is collected into databases and traditional data-mining approaches just relay the same information, multivariate models provide the only real way to develop reliable predictive analytics.
Although this is a broad definition, the ability to model out unimportant influences and focus only on those that are important provide the best estimates of future conditions.

Multivariate Data Analysis For Dummies 24
Chapter 4
Sorting with Classification Models
In This Chapter▶ Using unsupervised and supervised classification▶ Looking at the different types of supervised classification▶ Classification in practice
H uman beings are curious by nature. Our deeds and exploits in science, medicine and technology results
from curiosity, as do many future breakthroughs. A fundamen-tal driver is behind these breakthroughs – the need to classify (or sort) objects into classes that we can better understand.
Defining ClassificationClassification is the separation (or sorting) of a group of objects into one or more classes based on distinctive features in the objects. For example, given a group of mammals and birds, you can easily separate these two classes based on their distinguishing features. The next step in this problem is the further classification of the birds and mammals into their species.
The following sections describe two main approaches to classification: unsupervised and supervised.
Multivariate Data Analysis For Dummies 26
Unsupervised classificationUnsupervised classification involves taking a larger group of objects (samples) and measuring certain properties (variables) on them. Based on these properties, unsupervised classifica-tion then attempts to group the samples based on the similar-ity/dissimilarity of the samples. Unsupervised classification uses these methods.
✓ K-means
✓ K-medians
✓ Hierarchical cluster analysis
✓ Principal Component Analysis
If these classification methods result in distinct groups (clus-ters) that agree with your prior knowledge, then you’d con-clude that the measured properties are capable of classifying the samples. If not, then you’d conclude that you need to find other properties that can distinguish your samples.
Unsupervised classification is always the first step in any clas-sification problem
Supervised classificationSupervised classification is the next step in the classification. It builds rules for further classifying new samples.
The rules you build “supervise” or determine whether the new sample is a member of a particular class or a member of none of the available classes based on membership limits. Some common methods used in the multivariate classification problems are
✓ Soft Independent Modeling of Class Analogy (SIMCA) by use of PCA
✓ Linear Discriminant Analysis (LDA)
✓ Logistic regression
✓ Partial Least Squares Discriminant Analysis (PLS-DA)
✓ Support Vector Machine Classification (SVMC)
Chapter 4: Sorting with Classification Models 27
Discriminant analysis is another way of saying supervised classification and uses a discriminant rule (or a number of them) to classify new samples. For more information on Classification methods please visit www.camo.com/resources.
Classification in PracticeClassification methods are routinely used in many industrial and research applications. In the pharmaceutical industry, classification is used for raw material identification and selec-tion of candidates for drug discovery and so on.
Other applications of classification analysis include:
✓ Classifying food samples accordingly to different char-acteristics for authenticity (for example, olive oil, wine, honey and so on).
✓ Determining authenticity of automotive spare parts using handheld instruments.
✓ Sorting products on high-speed production lines into relevant groups according to product qualities.
✓ Classifying different blends of crude oil to better under-stand the most efficient refining processes.
✓ Using classification models to identify narcotics and/or counterfeit products.
✓ Classifying the disease state of tumours using MVA and imaging data.
✓ Determining the origin of archaeological samples from classification models.

Multivariate Data Analysis For Dummies 28
Chapter 5
Ten Facts to Remember about Multivariate
Data AnalysisIn This Chapter▶ Including pictures is key▶ Using best estimates to make predictive models▶ Making the complex simple
I n this chapter, we give you our best shot at listing the top ten facts to remember about multivariate analysis.
MVA Is All about the PicturesMultivariate analysis is highly graphical in its approach. Although you can analyse large masses of data, the old saying ‘A picture is worth a thousand words’ holds true.
Only Certain Info MattersUnlike classical statistical approaches, multivariate analysis doesn’t require data fitting theoretical distributions. MVA is concerned only with the information contained in the data you’re analysing.
Multivariate Data Analysis For Dummies 30
Data Isn’t Hidden AnymoreThe tools used by multivariate analysis, especially methods like Principal Component Analysis, can help reveal the under-lying structure in a large data set, therefore giving true mean-ing to terms like exploratory data analysis and data mining.
MVA Is More EfficientMultivariate analysis allows you to simultaneously analyse all the data you collected and avoids making assumptions about whether some variables are important. It shows all sample and variable groupings and relationships so that you don’t have to make such assumptions in the first place.
You Can Make Predictive ModelsMultivariate regression allows you to make predictive models that you can use to estimate the values of new samples/events based on the best knowledge you have at the time. This is a fundamental requirement of reliable Predictive Analytics.
You Can Perform Complex Classification
You can perform complex classification tasks using multivari-ate models. These tools find much use in both industrial and research applications and can help you reach meaningful con-clusions in a shorter timeframe.
MVA Is Fast and DetailedWhen faced with even a relatively small set of data, we tend to spend much time plotting variables and samples against each other trying to find a link between the variables or samples.
Chapter 5: Ten Facts to Remember about Multivariate Data Analysis 31The tools of multivariate data analysis can achieve this objec-tive in a short period of time and can reveal much more infor-mation than simple plotting techniques.
Don’t Overlook ValidationValidation is a critical part of multivariate modeling and deter-mines the quality and reliability of any models when used as future predictors of quality, for example.
DoE Goes Hand in Hand with MVA
Design of Experiments (DoE) is a related subject to multivari-ate analysis, and its prime application is the development of rational designs that require minimal experimental effort but result in maximal information extraction.
Correlation Doesn’t Necessarily Mean Causation
To take an example, on a hot day, the sales of ice creams and sunglasses increase at the same rate as each other, but this isn’t the relationship of interest, because there is no meaning-ful relationship between sunglasses and ice cream sales. Both are correlated to the fact that the temperature has increased. Be careful how you interpret relationships!

The Unscrambler® X combines advanced multivariate data analysis with exceptional ease of use.
Download a free trial at www.camo.com
YOUR DATA MIGHT BE COMPLEX,BUT YOUR SOFTWARE SHOULDN’T BE.
Bring data to life
Cutting through complex datasets to underlying structures…is simplicity itself.
““