multivariate statistical analysis of bakken completions: aiming … · 2016-08-24 · multivariate...
TRANSCRIPT
Multivariate Statistical Analysis of Bakken Completions: Aiming for Optimal Design
2016 Williston Basin Petroleum Conference May 24-26, 2016
Mark Lenko, Managing Director (interim) - Intelligence and Engineering DirectorB.Sc., B.A., M.Ec., P.Eng.
Samantha Foster, Intermediate EngineerB.Sc., M.Sc., P.Eng.

Disclaimer
Disclaimers
The information contained herein has been prepared solely for information purposes and is not intended to be used for trading or investment purposes or as an offer to sell or the solicitation of an offer to buy any security or financial product. The information has been compiled by Canadian Discovery from internal sources as well as prepared from various public and industry sources that we believe are reliable, but no representation or warranty, expressed or implied is made by Canadian Discovery, its affiliates or any other person as to the accuracy or completeness of the information. Such information is provided with the expectation that it will be read as part of a mosaic of analyses and should not be relied upon on a stand-alone basis. Past performance should not be taken as an indication or guarantee of future performance, and Canadian Discovery makes no representation of warranty regarding future performance. The opinions expressed in this report (presentation) reflect the judgment of Canadian Discovery as of the date of this report and are subject to change without notice. This report (presentation) is not an offer to sell or a solicitation of an offer to buy any securities. To the full extent provided by law, neither Canadian Discovery nor any of its affiliates, nor any other person accepts any liability whatsoever for a direct or consequential loss arising from any use of this report (presentation) or the information contained herein. As in all aspects of oil and gas evaluation, there are uncertainties in the interpretation of engineering, reservoir and geological data: therefore, the recipient should rely solely on its own independent investigation, evaluation, and judgment with respect to the information contained herein and any additional information provided by Canadian Discovery or its representatives. All trademarks, service marks, and trade names not owned by Canadian Discovery are the property of their respective owners.
Forward-Looking Statements
This presentation may contain certain forward-looking information as defined in applicable securities laws (referred to herein as “forward-looking statements”). Forward-looking statements involve known and unknown risks, uncertainties and other factors which are beyond Canadian Discovery’s ability to predict or control and may cause Canadian Discovery’s actual results, performance or achievements to be materially different from any of its future results, performance or achievements expressed or implied by forward-looking statements.
Accordingly, readers should not place undue reliance on forward-looking statements. The forward-looking statements contained herein are made as of the date hereof, or such other date or dates specified in such statements. Canadian Discovery undertakes no obligation to update publicly or otherwise revise any forward-looking statements contained herein whether as a result of new information or future events or otherwise, except as may be required by law. If the Company does update one or more forward-looking statements, no inference should be drawn that it will make additional updates with respect to those or other forward-looking statements.


CAPABLE OPERATORS WITH VARYING RESULTS
• Within Viewfield, the Estimated Ultimate Recovery (EUR) varies widely
81 mboe is the median EUR
20 active operators, 2,529 total wells
• Operators also see a range of recoveries.
Median EUR, mboe
• CPG 100
• PBN 74
• TOG 62
• MSO 111
CPG PBN TOG MSO0
50
100
150
200
250
300
350
EUR
(m
bo
e)
median EUR = 81100
7462
111
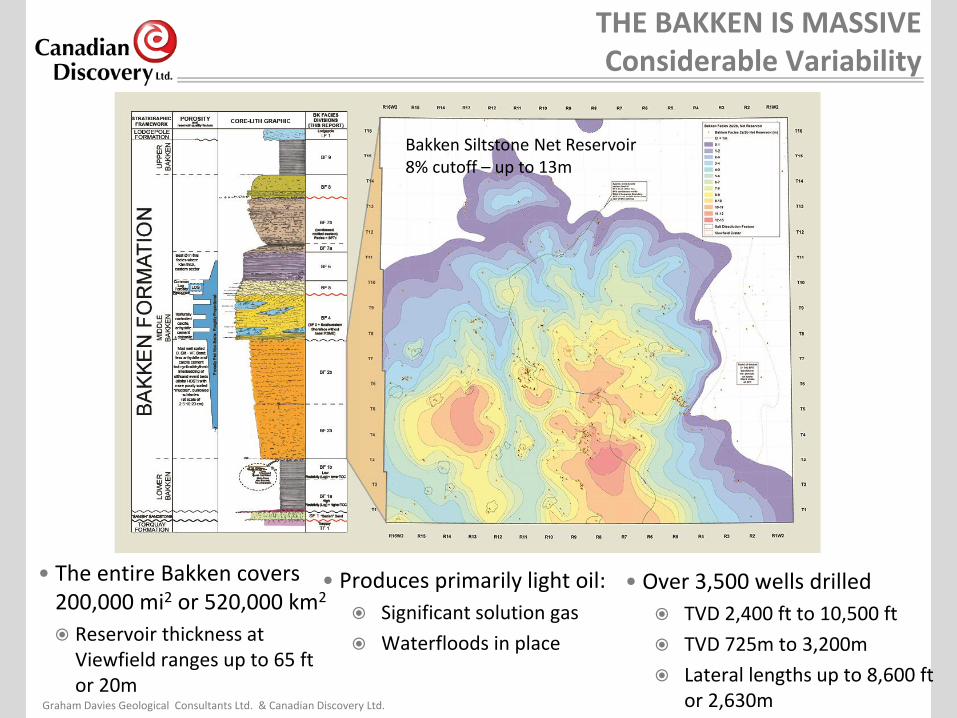
THE BAKKEN IS MASSIVEConsiderable Variability
• The entire Bakken covers 200,000 mi2 or 520,000 km2
Reservoir thickness at Viewfield ranges up to 65 ftor 20m
• Produces primarily light oil:
Significant solution gas
Waterfloods in place
• Over 3,500 wells drilled
TVD 2,400 ft to 10,500 ft
TVD 725m to 3,200m
Lateral lengths up to 8,600 ftor 2,630mGraham Davies Geological Consultants Ltd. & Canadian Discovery Ltd.
Bakken Siltstone Net Reservoir8% cutoff – up to 13m

NOT ALL BAKKEN IS CREATED EQUALLYFive Distinct Play Areas
Canadian Discovery Ltd.
(Aquifer)
(Aquifer)
(Aquifer)
(Aquifer)
(High Oil Saturation)
• Facies
4 stacked reservoir facies
• Temperature
Determines maturity of hydrocarbons
Oil window – migrated from ND – Thanks!
• Pressure > Hydrogeological Regimes
High Oil Saturation at Viewfield
Surrounded by Aquifers

VARIABLE OUTCOMESUncontrollable vs. Controllable Factors
• Uncontrollable variables are beyond what operators can influence:
Reservoir characteristics: pressure, temperature, porosity, permeability
Rock properties: ductility, geochemistry, rock stress
• Controllable variables are design and operational decisions that influence outcomes
Drilling: fluid systems, well spacing, lateral length, casing system
Completions: technology, fluid (type, volume), proppant (type, blend, tonnage), stages (number, spacing)
Factors in All Completions Designs


What and Why
• Relationship between well performance and geologic/engineering variables is:
Non-linear
Dominated by complex interactions between variables
• Multivariate statistics aims to:
Identify variables that have the largest effect on outcome
Group wells according to similar inputs and outputs
Discover complex relationships in your data
0
50
100
150
200
250
300
350
0 500 1000 1500 2000 2500
EUR
(m
bo
e)
Lateral Length (m)
EUR vs Lateral Length
R² = 0.025
R² = 0.0339
0
50
100
150
200
250
300
350
0 20 40 60 80
EUR
(m
bo
e)
Stages
EUR vs Stages
R² = 0.0339
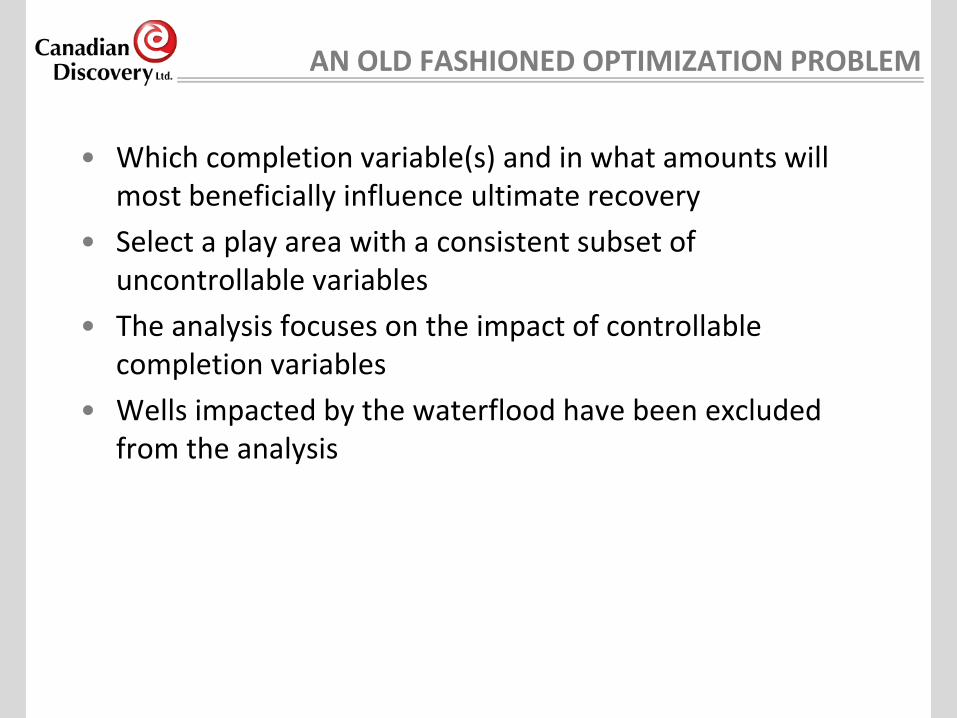
AN OLD FASHIONED OPTIMIZATION PROBLEM
• Which completion variable(s) and in what amounts will most beneficially influence ultimate recovery
• Select a play area with a consistent subset of uncontrollable variables
• The analysis focuses on the impact of controllable completion variables
• Wells impacted by the waterflood have been excluded from the analysis

EUR
Completion Technology
Open vs Cased
Stimulation Fluid
Energizer
Use of Foam
Proppant per Stage
Fluid per Stage
Number of Stages
Horizontal Length
Proppant TypeWellbore Direction
Vertical Depth
Fracture Spacing
BUILDING A DECISION TREEEstablishing Differences
Proppant Composition
Step 1:
Is there dependence between EUR and any of the variables?
Yes: Go to Step 2
No: Stop growing the tree
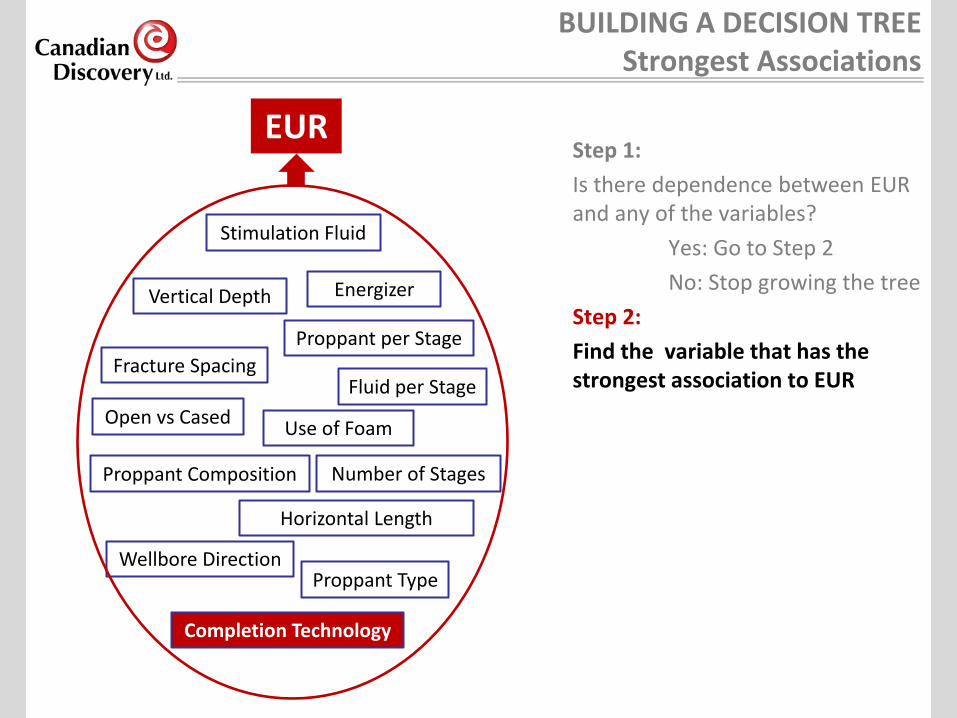
BUILDING A DECISION TREEStrongest Associations
EUR
Completion Technology
Open vs Cased
Stimulation Fluid
Energizer
Use of Foam
Proppant per Stage
Fluid per Stage
Number of Stages
Horizontal Length
Proppant Composition
Proppant TypeWellbore Direction
Vertical Depth
Fracture Spacing
Step 1:
Is there dependence between EUR and any of the variables?
Yes: Go to Step 2
No: Stop growing the tree
Step 2:
Find the variable that has the strongest association to EUR

0
50
100
150
200
250
300
350
EUR
(m
bo
e)
Completion Technology
EUR vs Completion Technology
Technology = CT Cut/Port(Packer)
Ball&Seat
BUILDING A DECISION TREEIdentifying The Impact
Step 1:
Is there dependence between EUR and any of the variables?
Yes: Go to Step 2
No: Stop growing the tree
Step 2:
Find the variable that has the strongest association to EUR (using a Chi squared test)
Step 3:
Find the split point of the variable that results in the largest difference between the mean of two groups
Ball & Seat, Plug&Perf CT Cut/Port (Packer)
Group median =
76 mboe
Group median =
107 mboe
0
50
100
150
200
250
300
350
EUR
(m
bo
e)
Completion Technology
EUR vs Completion Technology
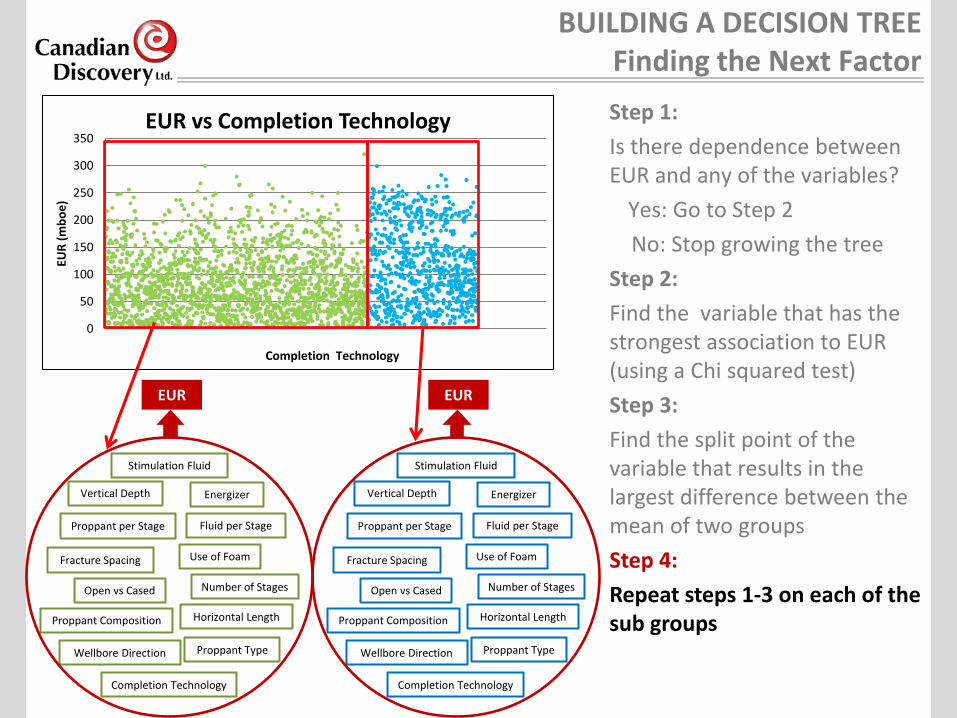
BUILDING A DECISION TREEFinding the Next Factor
EUR
Completion Technology
Open vs Cased
Stimulation Fluid
Energizer
Use of Foam
Proppant per Stage Fluid per Stage
Number of Stages
Horizontal LengthProppant Composition
Proppant TypeWellbore Direction
Vertical Depth
Fracture Spacing
Step 1:
Is there dependence between EUR and any of the variables?
Yes: Go to Step 2
No: Stop growing the tree
Step 2:
Find the variable that has the strongest association to EUR (using a Chi squared test)
Step 3:
Find the split point of the variable that results in the largest difference between the mean of two groups
Step 4:
Repeat steps 1-3 on each of the sub groups
EUR
Completion Technology
Open vs Cased
Stimulation Fluid
Energizer
Use of Foam
Proppant per Stage Fluid per Stage
Number of Stages
Horizontal LengthProppant Composition
Proppant TypeWellbore Direction
Vertical Depth
Fracture Spacing

RECURSIVE PARTITIONINGResulting Decision Tree


OPTIMAL PATHToward Maximum EUR
• The path to the group with the highest median EUR
• Three key factors to maximize EUR
Completions Technology –Coiled Tubing (packer)
Proppant Tonnage –> 4 tonnes/stage
Number of Stages -> 24 stages
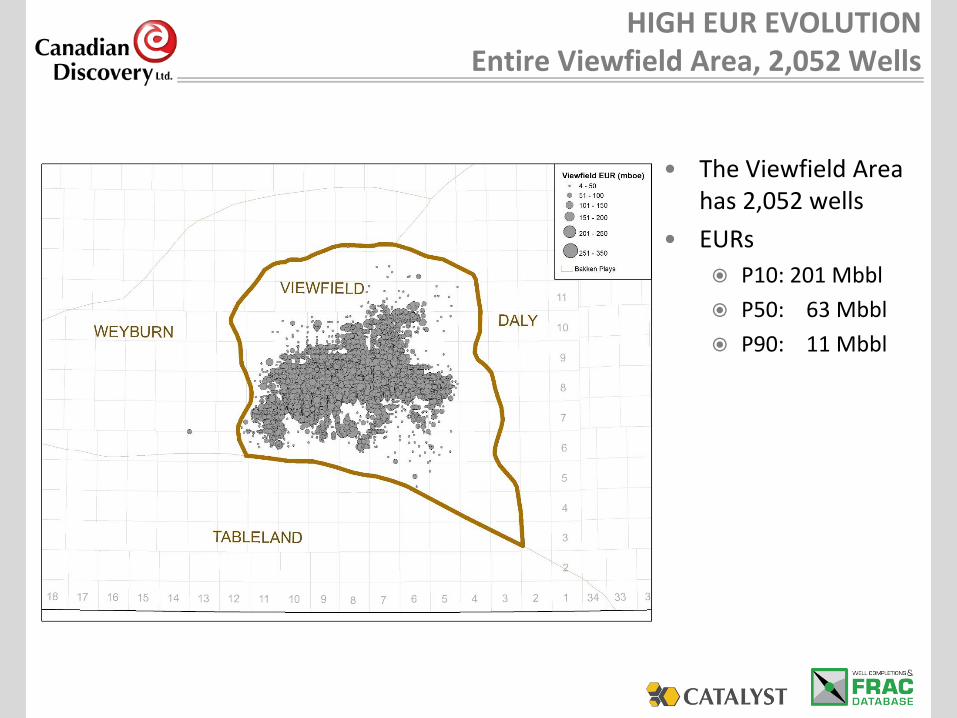
HIGH EUR EVOLUTION Entire Viewfield Area, 2,052 Wells
• The Viewfield Area has 2,052 wells
• EURs
P10: 201 Mbbl
P50: 63 Mbbl
P90: 11 Mbbl

HIGH EUR EVOLUTIONEntire Viewfield Area, 2,052 Wells
• Focus on the top 5 original operators out of 20 active in the area
2005 2006 2008 2009 2010 2012 2013 2014 2016
Ori
gin
al O
pe
rato
r
Completion Date
CPG
PBN
TOG
MSO
LEG
0
50
100
150
200
250
0 12 24 36 48 60
Raw
Oil
Rat
e (
bb
l/d
)
Time (Month)
All Viewfield P10
All Viewfield P50
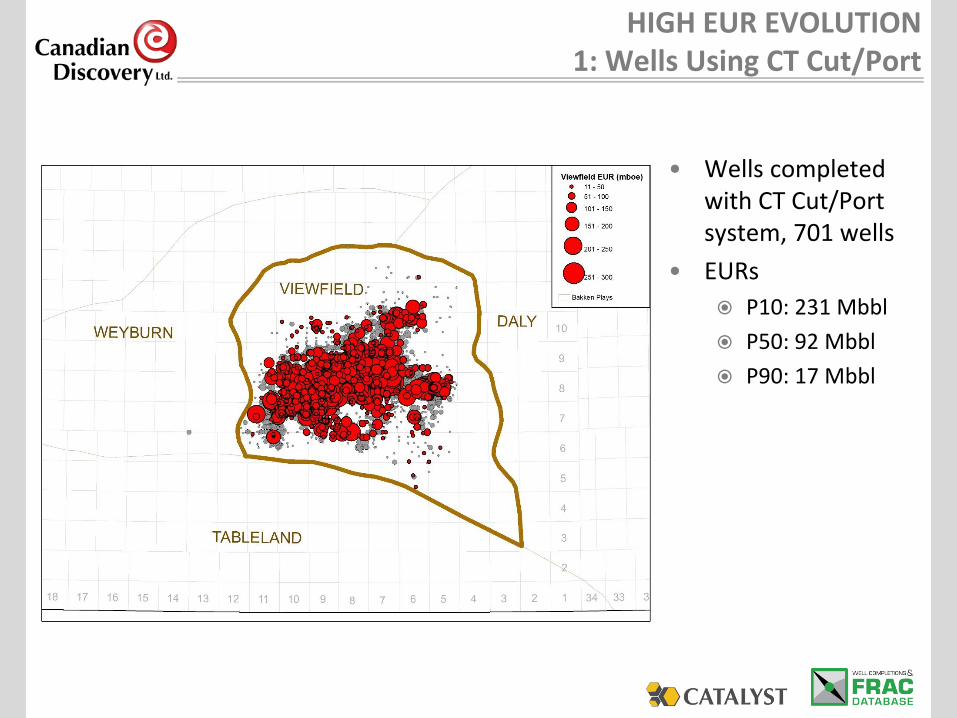
HIGH EUR EVOLUTION1: Wells Using CT Cut/Port
• Wells completed with CT Cut/Port system, 701 wells
• EURs
P10: 231 Mbbl
P50: 92 Mbbl
P90: 17 Mbbl
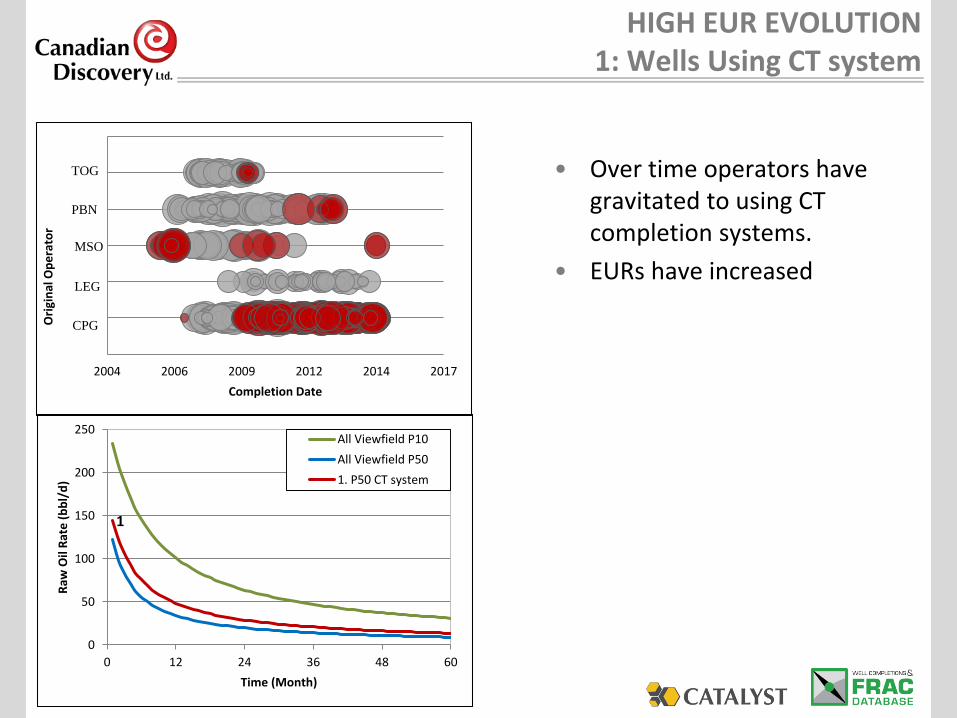
HIGH EUR EVOLUTION1: Wells Using CT system
• Over time operators have gravitated to using CT completion systems.
• EURs have increased
2004 2006 2009 2012 2014 2017
Ori
gin
al O
pe
rato
r
Completion Date
CPG
PBN
TOG
MSO
LEG
0
50
100
150
200
250
0 12 24 36 48 60
Raw
Oil
Rat
e (
bb
l/d
)
Time (Month)
All Viewfield P10
All Viewfield P50
1. P50 CT system
1

HIGH EUR EVOLUTION2: Proppant – more than 4 tonnes per stage
• Wells completed using a CT completion systems and and more than 4 tonnes of proppant per stage, 408 wells
• EURs
P10: 251 Mbbl
P50: 103 Mbbl
P90: 21 Mbbl

HIGH EUR EVOLUTION2: Proppant - > 4 t/stage
• As operators continue operations, higher tonnages have become the norm.
• Median EURs are consistently higher than the lower tonnage pumped.
2004 2006 2009 2012 2014 2017
Ori
gin
al O
pe
rato
r
Completion Date
CPG
PBN
TOG
MSO
LEG
0
50
100
150
200
250
0 12 24 36 48 60
Raw
Oil
Rat
e (
bb
l/d
)
Time (Month)
All Viewfield P10
All Viewfield P50
1. P50 CT system
2. P50 Proppant . 4t/st
1 2
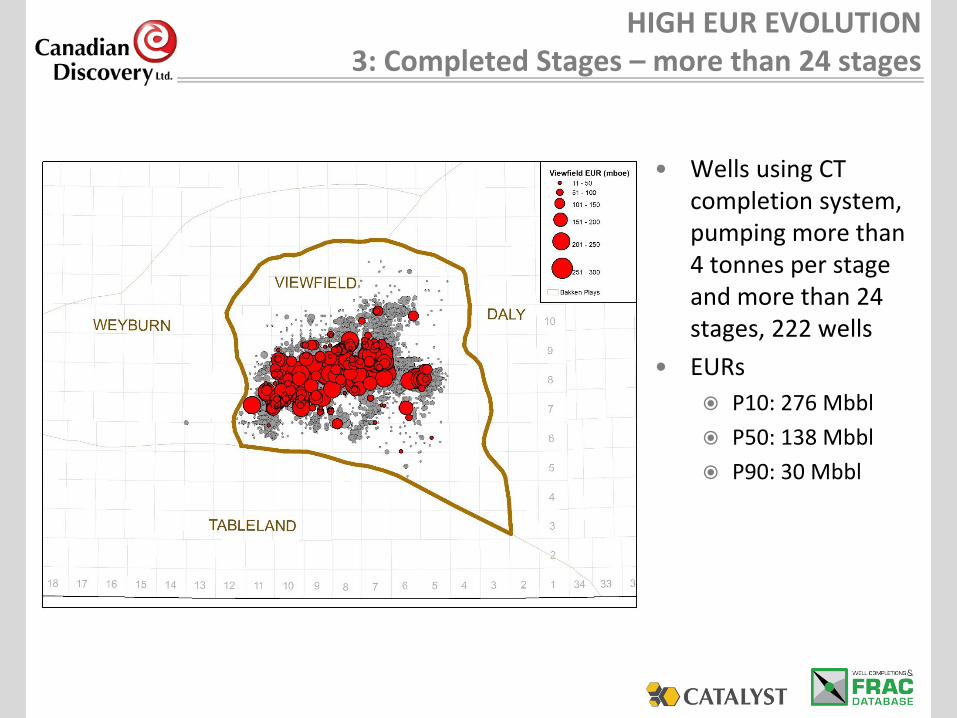
HIGH EUR EVOLUTION3: Completed Stages – more than 24 stages
• Wells using CT completion system, pumping more than 4 tonnes per stage and more than 24 stages, 222 wells
• EURs
P10: 276 Mbbl
P50: 138 Mbbl
P90: 30 Mbbl
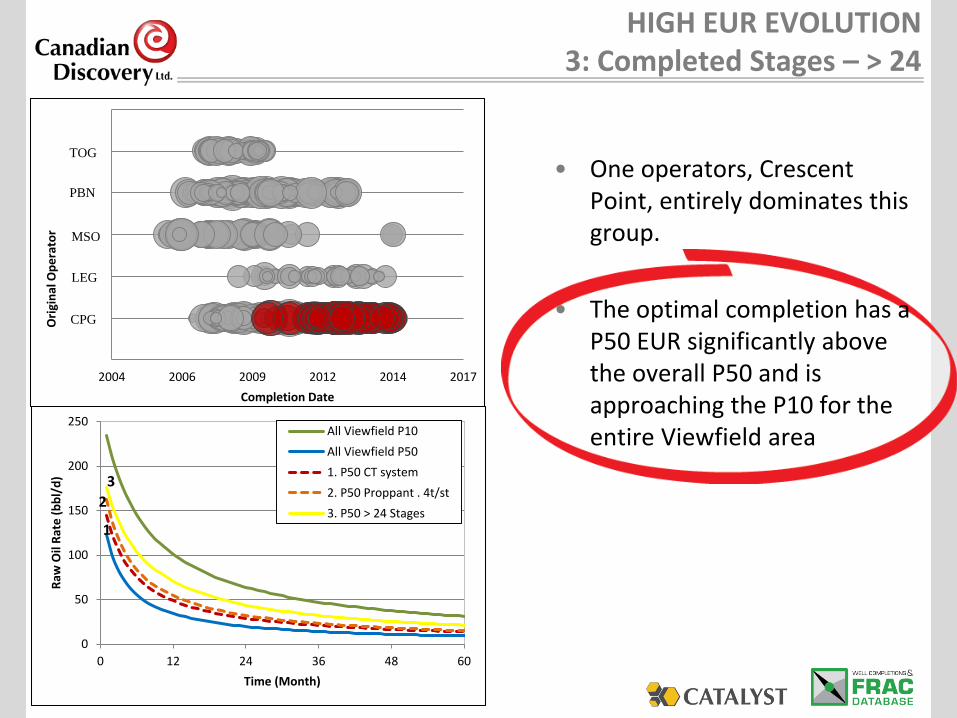
HIGH EUR EVOLUTION3: Completed Stages – > 24
2004 2006 2009 2012 2014 2017
Ori
gin
al O
pe
rato
r
Completion Date
CPG
PBN
TOG
MSO
LEG
• One operators, Crescent Point, entirely dominates this group.
• The optimal completion has a P50 EUR significantly above the overall P50 and is approaching the P10 for the entire Viewfield area
0
50
100
150
200
250
0 12 24 36 48 60
Raw
Oil
Rat
e (
bb
l/d
)
Time (Month)
All Viewfield P10
All Viewfield P50
1. P50 CT system
2. P50 Proppant . 4t/st
3. P50 > 24 Stages
1
2
3
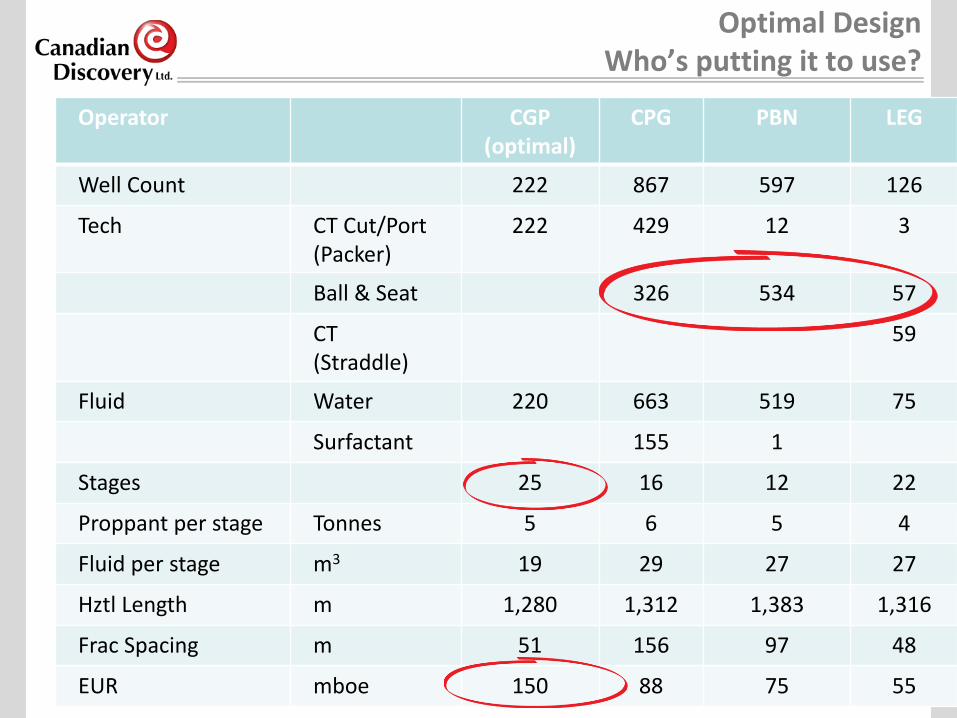
Operator CGP(optimal)
CPG PBN LEG
Well Count 222 867 597 126
Tech CT Cut/Port (Packer)
222 429 12 3
Ball & Seat 326 534 57
CT (Straddle)
59
Fluid Water 220 663 519 75
Surfactant 155 1
Stages 25 16 12 22
Proppant per stage Tonnes 5 6 5 4
Fluid per stage m3 19 29 27 27
Hztl Length m 1,280 1,312 1,383 1,316
Frac Spacing m 51 156 97 48
EUR mboe 150 88 75 55
Optimal DesignWho’s putting it to use?

Operator CPG (optimal)
CPG PBN LEG
Well Count 222 867 597 126
Median Cost, $000’s
Completion 560 530 499 587
Drilling 1,017 992 1,148 1,137
Half Cycle 1,576 1,522 1,647 1,724
Efficiency, $ per boe
Completion 3.74 5.79 7.35 11.16
Drilling 6.78 11.08 15.21 22.22
Half Cycle 10.52 16.87 22.56 33.38
Efficiency, $000’s per 100m hztl section
Completion 42 39 40 40
Drilling 78 75 87 86
Half Cycle 120 114 127 126
Efficiency, mboe per 100m hztl section 11.3 6.6 6.0 3.9
Optimal DesignHow’s it working?

Operator CPG (optimal)
CPG LEG
Well Count 31 149 7
Tech CT Cut/Port (Packer) 31 148
CT (Straddle) 7
Fluid Water 30 148 7
Surfactant 1
Stages 25 25 28
Prop per stage Tonnes 5 3 3
Fluid per stage m3 20 16 26
Hztl Length m 1303 1314 1223
Frac Spacing m 52 53 43
EUR, recent (187) mboe 138 80 38
EUR, overall (2,052) mboe 150 88 55
Recent ActivityWhat have you done lately? (Since January 2014)
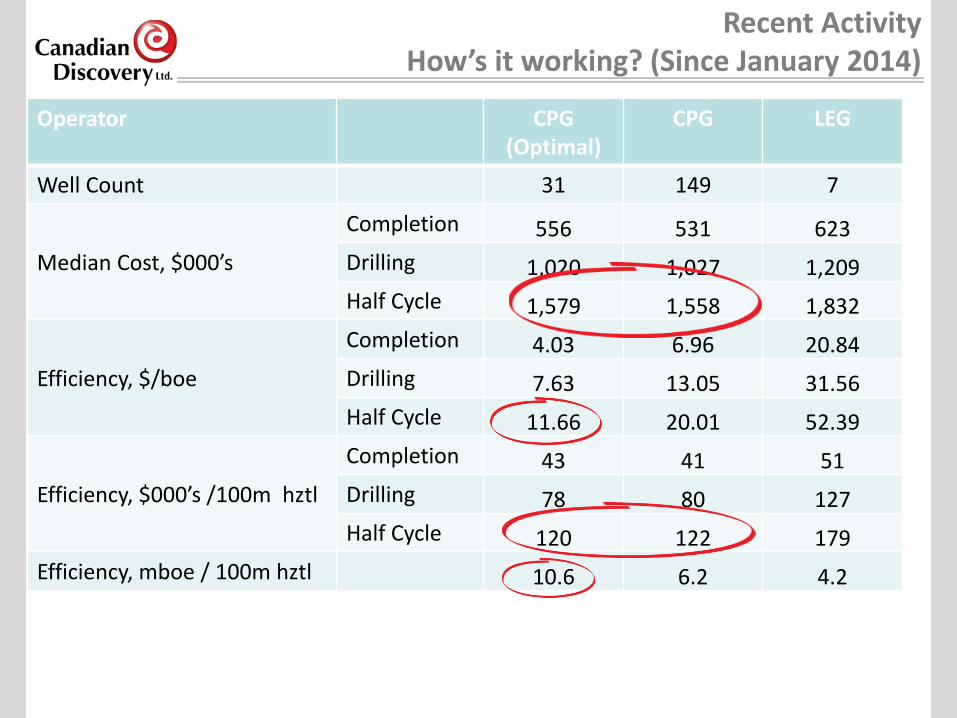
Operator CPG (Optimal)
CPG LEG
Well Count 31 149 7
Median Cost, $000’s
Completion 556 531 623
Drilling 1,020 1,027 1,209
Half Cycle 1,579 1,558 1,832
Efficiency, $/boe
Completion 4.03 6.96 20.84
Drilling 7.63 13.05 31.56
Half Cycle 11.66 20.01 52.39
Efficiency, $000’s /100m hztl
Completion 43 41 51
Drilling 78 80 127
Half Cycle 120 122 179
Efficiency, mboe / 100m hztl 10.6 6.2 4.2
Recent ActivityHow’s it working? (Since January 2014)
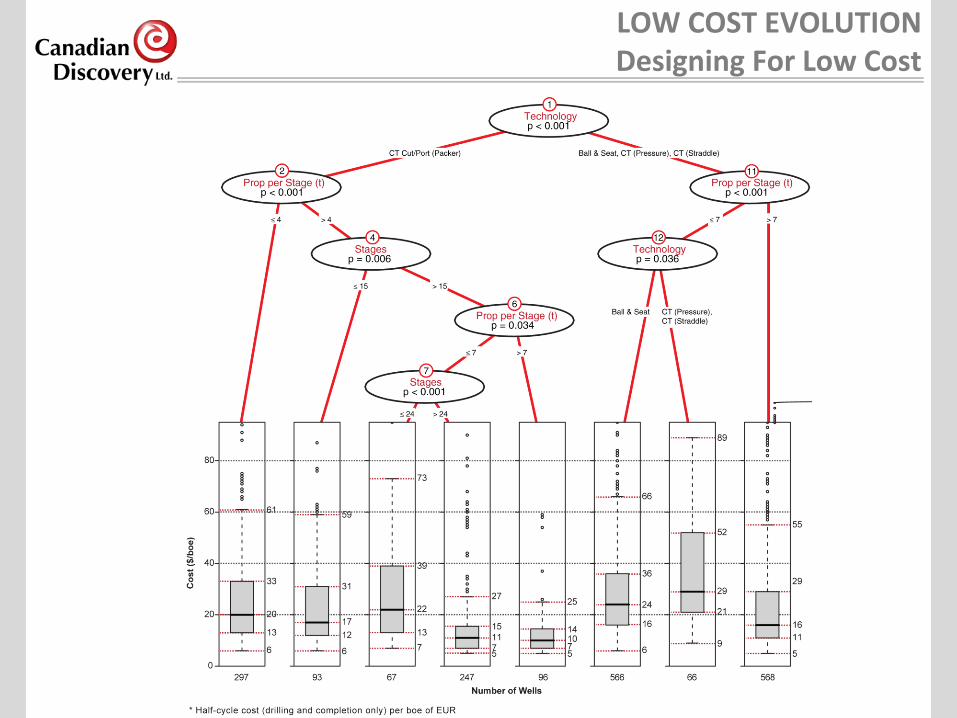
LOW COST EVOLUTIONDesigning For Low Cost

LOW COST EVOLUTION
• The path to the group with the lowest median half-cycle cost per boe
• Lowest median cost is $10.03 per boe of EUR, half-cycle
• Three key factors to minimize unit cost
Technology – CT Cut/Port (packer)
Proppant – greater than 7 tonnes per stage
Stages – greater than 15 stages
• 96 wells in this group: operated by CPG (87 wells), Taqa (4),Shelter Bay (3),Pinecrest (1), Landex (1)


Conclusions
• Multivariate statistical analysis can illuminate
Completions practices to engage and avoid to maximize EUR
Completion practices to engage and avoid to minimize cost per barrel
The value of detailed data collection
The variables to focus effort/money on
Guide technical question – ie. Why is a certain fluid or proppantperforming better than others?
• CDL’s MV analytics provides a method to test individual D&C design parameters against actual results.
• With tuning of design some operators have lifted their P50 results to what used to be the area P10
• Analysis can guide new entrants in an area to a higher point on the learning curve

WCSB Deepest Penetration by Section
Thank you to other contributors
• Joshua Lee – type curves/EUR data
• Meridee Fockler – organizer
• Zenith Phillips – graphic designer
• Candace Keeler – cartographer
• Alison Lane – administration
CDL products used for this presentation:
Powered by IHS Data

Contact Information
For inquiries with respect to this presentation, please contact:
403.269.3644
Find us on: