mumbai, india - amazon web services
TRANSCRIPT
MORGAN STANLEY INDIA SUMMITMumbai, India
June 12, 2019

DISCLAIMER
This presentation may contain statements which reflect Management’s current views and
estimates and could be construed as forward looking statements. The future involves
certain risks and uncertainties that could cause actual results to differ materially from the
current views being expressed. Potential risks and uncertainties include such factors as
general economic conditions, foreign exchange fluctuations, competitive product and
pricing pressures and regulatory developments.
Responses can only be given to questions which are not price sensitive.
2

ASIAN PAINTS TODAY
No. 1Paint Company
in India
Over
$ 2.7 Billion
Group revenue
3Times nearest
Competitor
in India
3rd Largest Paint
Company in Asia
9thLargest Paint
Co In the World
Operations in
16countries
27Paint
Manufacturing
Plants
Part of
30 share
BSE
S&P SENSEX
50+Years of Market
Leadership in India
Forbes Asia’s Fab
50Company; Fifth
times in a row
Part of NSE Nifty
50
Servicing
Consumers in over
65 Countries
7500+
Employees
worldwide
Offerings
across:
Paints
Chemicals
Wall Coverings
Waterproofing
Kitchen
Bath fittings
Adhesives
3

Sales
-
2.0
4.0
6.0
8.0
10.0
12.0
14.0
16.0 14.8
11.6 11.5
5.4 5.0
4.8 4.4
2.9 2.6
2.2 2.0
1.6 1.5 1.0
0.9
In B
illio
n U
SD
* Coatings World Magazine - 2018 Rankings (only revenue from coatings sales considered for the ranking)
COATINGS INDUSTRY – GLOBAL STANDING
Source : Coatings World Magazine (July 2018 issue)

Deco India : Paints, Water Proofing, Wall Coverings & Adhesives
International – Operations outside India (Asia, Africa, Middle East and South Pacific)
Industrial – Includes only AP-PPG revenues
Home Improvement – Bath & Kitchen business in India
BUSINESS SEGMENTS - PORTFOLIO
83%
12%
3% 2%
FY 2018-19
Deco - India International Industrial Home Improvement

Growth closely linked to GDP
Growth
Low per Capita Paint
Consumption at ~3.75 Kgs
70:30
Organized sector to Unorganized
Paints soldthrough Mom &
Pop Shops
75:25
Decorative Paints to Industrial Paints
Global average @ 12-15 Kgs
Servicing directly by company
50:50 Global Ratio
Potential for growth
` 500 Billion
Industry
1 to 1.5 times Real GDP Growth
INDIAN PAINT INDUSTRY - DYNAMICS

❖ Urbanization & Nuclear Family phenomenon; Smart Cities; Affordable Housing
❖Family involvement in decision making
❖ Upgradation, trendy colours, wall coverings, designer walls etc.
❖ Higher awareness influencing customer preferences
❖ Quality, Decorative and Protective features of paints
❖ Unorganized to Organized shift with GST implementation from July 2017
❖ GST rate reduction – latest reduction from 28% to 18% (July 2018)
❖ Infrastructure growth viz. Roads, Ports, Refineries etc.
❖ Benefits Industrial Paint segment
❖ Automobile majors’ India focus and Making India an Export hub
❖ Benefits Auto Paint segment
INDIAN PAINT INDUSTRY - GROWTH DRIVERS

❖Largest business unit – 83% of group revenues
❖ Leveraging its distribution strength (60,000+ dealers across the country)❖Introduced new categories like Water-proofing, Adhesives, Wallpapers etc
❖ State of the art, highly automated decorative paint manufacturing plants – Eight plants across the country for an efficient distribution footprint❖Total manufacturing capacity of 1.63 million KL/annum of Decorative paint products ❖Some of the largest single location automated paint manufacturing capacities across
the world❖Mysuru (Karnataka) plant commissioned in Sept 2018 with initial capacity of 0.3
million KL/annum and Vizag (Andhra Pradesh) plant commissioned in Jan 2019 with initial capacity of 0.3 million KL/annum
❖Mysuru plant can be scaled upto 0.6 million KL/annum and Vizag plant can be scaled upto 0.5 million KL/annum in a phased manner
DECO INDIA – BUSINESS FOOTPRINT

LAST 20 YEARS………❖Increased Market Share by over 20%
❖Exploded emulsion growth – especially in exteriors
❖Upgraded distempers to emulsions
❖Launched over 150 new products
❖Re-invented the brand - moved into Décor & services – APHS, Paint Total, ColourPro, Colour Consultancy
VISION:-‘To be the fore runner of inspiring décor and to actively
empower customers to create their dream homes’
DECO INDIA

DECO INDIA – CHANGING WITH TIMES
❖ Lifting the brand into a modern, contemporary space
❖ Unique, Vibrant, Colourful
❖ Symbol of creativity and décor
1954 2002 2012

The key has been continuously attempting to understand and meet the changing needs of the ever-changing consumer
❖Refashioned retailing – focus on dealer influencing the consumer
❖Increased reach – 15,000 retailers to 60,000+ retailers (46,000+ ColourWorlds –proprietary tinting system)
❖Achieved a premium image; high sale of faux finishes.
❖Leader across all geographies except Kashmir
❖70% of sale on 3 day payment
❖Use Information Technology across all areas of operations
❖135 depots servicing over 60,000 customers yet reduced FG inventories
❖20 to 30 new products every year
❖Built the largest and most modern factories in the world
❖Branched into waterproofing, painting tools, premium wood finishes, adhesives
DECO INDIA

❖Network Expansion
❖About 3000 dealers added every year
❖4000 ColourWorlds additions per annum
❖25 Colour Ideas additions per annum
❖Most products sell at a 5 to 10% premium to competition while gaining share.
❖Research & Development
❖225 scientists at the Research & Technology Centre near Mumbai
❖Continuous Sourcing / Formulation efficiency; New Product Development
❖Training & Development
❖ Painter training for skill development /upskilling -100,000 trainings in FY18-19.
DECO INDIA

DECO INDIA – INNOVATION IN RETAILING
46,000+ Colour World -
Paints tinted at dealer outletsTraditional Hardware
shops
❖ Innovating the retailing footprint with 400+ Colour Ideas stores❖ Showcasing latest product and solution offerings❖ Enabling consumers to get inspired, try and decide – helped by a consultant
Colour Ideas – Modern dealer outlets
– end to end home décor solutions

❖ Experimenting with AP Homes❖Multi-category integrated décor store offering products & solutions across categories of
paints, wallpapers, kitchen, bath fittings, sanitaryware, furnishings, light fittings, etc.
DECO INDIA – INNOVATION IN RETAILING
AP Homes - Multi-category décor stores
at Coimbatore, New Delhi, Kochi,
Raipur, Karur & Tumkur

❖ Participating in the Indian Industrial coatings segment through 2 Joint ventures with PPG Inc. of USA, the global coatings leader
❖ Industrial business makes up about 3% * of the group revenues
❖ Servicing the entire spectrum of Industrial coatings products - Automotive coatings, Refinishes, Protective coatings, Floor coatings, Powder coatings
❖Market leader in the Auto Refinish segment
❖ Second largest player in the Auto OEM segment
❖ Expanding Industrial coatings manufacturing capacity to cater to OEM demand
❖Many Auto OEMs (including Ford, Hyundai, General Motors) focused on using India as a base for servicing overseas markets
INDUSTRIAL COATINGS INDIA
* Includes only AP-PPG revenues

❖ Contributes about 12% of group revenues operating in 15 countries outside India
❖ In top three in all markets in Decorative paints, except in Singapore, Oman & Indonesia
❖ Significant presence in Middle East and South Asia
❖ Expanding its international presence with key focus on Africa and South East Asia❖ Set up greenfield operation in Indonesia with capacity of 24,550 KL/annum❖ Acquired the 2nd largest paint company, Causeway, in Sri Lanka in April 2017❖ Acquired the 2nd largest paint company, Kadisco, in Ethiopia in 2015
❖ Divested operations in Caribbean in 2017 to realign the portfolio towards high growth emerging markets
INTERNATIONAL BUSINESS
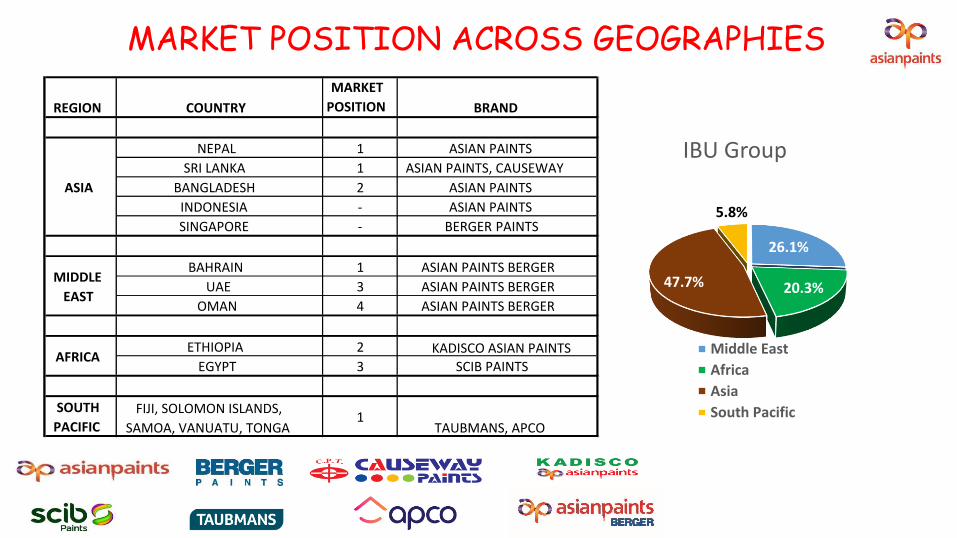
MARKET POSITION ACROSS GEOGRAPHIES
26.1%
20.3%47.7%
5.8%
IBU Group
Middle East
Africa
Asia
South Pacific
REGION COUNTRY
MARKET
POSITION BRAND
NEPAL 1 ASIAN PAINTS
SRI LANKA 1 ASIAN PAINTS, CAUSEWAY
BANGLADESH 2 ASIAN PAINTS
INDONESIA - ASIAN PAINTS
SINGAPORE - BERGER PAINTS
BAHRAIN 1 ASIAN PAINTS BERGER
UAE 3 ASIAN PAINTS BERGER
OMAN 4 ASIAN PAINTS BERGER
ETHIOPIA 2 KADISCO ASIAN PAINTS
EGYPT 3 SCIB PAINTS
ASIA
MIDDLE
EAST
FIJI, SOLOMON ISLANDS,
SAMOA, VANUATU, TONGA
SOUTH
PACIFIC TAUBMANS, APCO1
AFRICA

❖ Forayed in this business segment six years back with a vision of being a complete décor solutions provider to help customers create their dream homes
❖ Currently offering products and solutions in 2 categories ❖ Kitchens – engaged in business of manufacturing, selling and distributing complete
modular kitchens, kitchen components including wire baskets, cabinets, appliances, accessories, etc; ❖Recently introduced Wardrobes
❖ Bath Fittings❖Introduced sanitaryware recently
❖ Currently contributes 2% of group revenues but a key focus area for future growth alongside the growth potential in main coatings business
❖ Leveraging our distribution strength and customer understanding around Décor
HOME IMPROVEMENT SEGMENT

❖ Company’s philosophy founded on fairness, accountability, disclosures and
transparency
❖ Comprehensive disclosures, structured accountability in exercise of powers, adhering
to best practices and commitment to compliance with regulations - Integral part of
business
❖ Experienced Board of Directors – Independent Directors with strong industry
knowledge & experience
HIGHEST STANDARDS OF CORPORATE GOVERNANCE
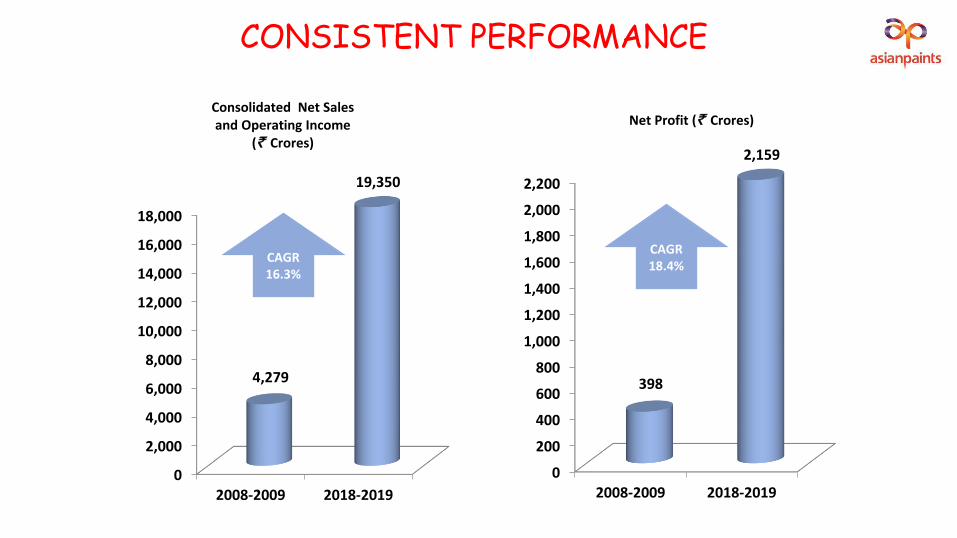
CONSISTENT PERFORMANCE
0
2,000
4,000
6,000
8,000
10,000
12,000
14,000
16,000
18,000
2008-2009 2018-2019
4,279
19,350
Consolidated Net Sales and Operating Income
(` Crores)
CAGR 16.3%
0
200
400
600
800
1,000
1,200
1,400
1,600
1,800
2,000
2,200
2008-2009 2018-2019
398
2,159
Net Profit (` Crores)
CAGR 18.4%

SUSTAINED VALUE CREATION
Current Market Cap at ~ ` 1431 Billion
0%
10%
20%
30%
40%
50%
60%
20
08
-09
20
09
-10
20
10
-11
20
11
-12
20
12
-13
20
13
-14
20
14
-15
20
15
-16
20
16
-17
20
17
-18
20
18
-19
54.0%
39.0%
46.0% 47.0%49.0%
51.0% 52.6% 54.2% 53.1% 53.1%56.8%
Dividend Payout Ratio
0
5,000
10,000
2008-2009 2018-2019
7,539
143,179
Market Cap (` Crores)

23
STANDALONE FINANCIALS : FY 2018-19
• Revenue from Operations up by 12.2%
• PBDIT flat at ` 842 crores – Impact of higher
material prices & higher media spends
• PBDIT Margin of 19.9% in Q4-FY19 as
compared to 22.4% in Q4-FY18
• PAT marginally lower than LY – Additional
impact of higher depreciation for the 2 new
plants
-
500
1,000
1,500
2,000
2,500
3,000
3,500
4,000
4,500
Revenue PBDIT PAT
4,235
842 480
3,775
844 492
Standalone Q4 (Rs. crs)
Q4 - FY19 Q4 - FY18
-
2,000
4,000
6,000
8,000
10,000
12,000
14,000
16,000
18,000
Revenue PBDIT PAT
16,392
3,587
2,135
14,154
3,198 1,895
Standalone 12M (Rs. crs)
12M - FY19 12M - FY18
• Revenue from Operations up by 15.8%
• PBDIT at ` 3,587 crores; growth of 12.2%
• PBDIT Margin of 21.9% for full year
compared to 22.6% in previous year
• PAT at ` 2,135 crores; growth of 12.7%

24
CONSOLIDATED FINANCIALS : FY 2018-19
-
1,000
2,000
3,000
4,000
5,000
6,000
Revenue PBDIT PAT
5,018
880 487
4,492
879 496
Consolidated Q4 (Rs. crs)
Q4 - FY19 Q4 - FY18
-
5,000
10,000
15,000
20,000
Revenue PBDIT PAT
19,350
3,752 2,212
16,844
3,418 2,028
Consolidated 12M (Rs. crs)
12M - FY19 12M - FY18
• Revenue from Operations up by 11.7%
• PBDIT flat at ` 880 crores
• PBDIT Margin of 17.5% in Q4-FY19 as
compared to 19.6% in Q4-FY18
• PAT marginally lower than LY
• Revenue from Operations up by 14.9%
• PBDIT at ` 3,752 crores; growth of 9.8%
• PBDIT Margin of 19.4% for full year
compared to 20.3% in previous year
• PAT at ` 2,212 crores; growth of 9.1%

THANK YOU