munich personal repec archive - uni-muenchen.de 3 5 $ munich personal repec archive distribution of...
TRANSCRIPT

MPRAMunich Personal RePEc Archive
Distribution of Government Spending onEducation in Indonesia
Gek Sintha Mas Jasmin Wika and Tri Widodo
Economics Department, Faculty of Economics and Bunisiness,Gadjah Mada University
11 March 2012
Online at https://mpra.ub.uni-muenchen.de/79501/MPRA Paper No. 79501, posted 3 June 2017 04:58 UTC

1
Distribution of Government Spending on Education in Indonesia
Gek Sintha Mas Jasmin Wika Master Program, Economics Department, Faculty of Economics and Business, Gadjah Mada University, Indonesia
and
Tri Widodo Economics Department, Faculty of Economics and Business, Gadjah Mada University, Indonesia
Corresponding author: Tri Widodo is the Head of Economics Department, Faculty of Economics and
Business, Universitas Gadjah Mada, Jl. Sosio Humaniora No. 1, Bulaksumur, Yogyakarta, 55281, Indonesia; Email: [email protected]; [email protected]

2
Distribution of Government Spending on Education in Indonesia
Abstract
This paper aims to analyze the benefit incidence of government spending on education
sector between each population group (different per capita household consumption groups) that
divides the population into sub-group (quintile or deciles) using survey data (IFLS) in Indonesia
in 2007. Benefit incidence analysis (BIA) is applied to know who benefit from government
spending on education. The result shows that overall government spending on education sector is
less progressive; it tends to provide more benefit to middle class and the rich one. The poor
receive largest benefit on primary education, while government spending in higher education
seems not to be pro-poor which is shown by the less benefit received by those groups. In
contrast, the richest receive largest benefit on secondary and higher education. It proves that
spending on secondary and higher education are regressive and pro-rich.
Keywords: benefit incidence, education, government spending
JEL Classification: H52, I21
I. Introduction
Education is understood as the basic need in the fight against poverty. Improvement of
education outcomes gives intrinsic value in raising capabilities and freedoms of individuals, as
well instrumental value of higher potential to obtain better revenues. World Bank suggests the
combination of growth and development of human capital as strategy to reduce poverty. To carry
out this strategy, government spending must be invested in the sector that is able to enhance
human capital to provide benefits to the poor.
Government spending for social services has two basic objectives: efficiency and equity
(Castro et al, 2000). Efficiency can be achieved when public spending generates external benefits
or is able to correct market failures, including the role of government in public procurement.

3
Equality is intended to improve the distribution of economic welfare, or, more equitable income
distribution, in the other words. Education sector is one of government spending that gets special
attention. Duflo (2000) noted that investment in basic education infrastructure increased years of
school enrollment. For each school built per 1000 children, the average years of education
increased. This investment translated into wage increases from 1.5 percent to 2.7 percent for
each additional school built per 1000 children. Demery (2000) stated that the poor are unlikely to
the higher education level, so that the greater the share of government spending allocated to
higher education level, the lower the share of education spending accruing to the poor.
The poor group often has limited access that makes them difficult to escape from poverty.
The government is expected to provide public goods, which is education in this case, to be pro-
poor. The questions need to be answered are how to ensure that increase in public expenditure
will truly reach the poor; and, who are the ones actually receive benefits from public spending on
education sector? Meerman (1979) stated that country that intent to use public expenditure as a
tool to fight against poverty should ensure ho receive this resource.
Benefit incidence Analysis (BIA) is an instrument used to assess how government
spending affects the distribution of welfare in the population. In the other words, BIA evaluates
the distribution of government spending among different groups in the population, especially
among different per-capita-household-consumption groups. In the literature, most of the BIA
divides the population into sub-group (quintile or deciles) based on per capita household
consumption. BIA provides valuable information about inefficiency and inequity in the
allocation of government resources for social services and also on the utilization of such services
by the community. BIA has been incorporated into an experimental tool kit for the World Bank
Poverty and Social Impact Analysis (PSIA) of economic policy.

4
In the case of Indonesia, the government has been giving more attention in education for
several years. Indonesian government, step by step, increased spending on education sector. In
2005 education received 9.76 percent of total national expenditure by function. This number
increased to be 10.23 percent in 2006, and was 20.95 percent in 2007 (the highest this far),
respectively - contributed 10.87 percent, 12.51 percent, 11.6 percent in 2008, 2009, and 2010.
Levels of education included in the formal school system in Indonesia consist of primary
education, secondary education and higher education. Primary education is the foundation for
secondary education. It takes the form of primary schools, that is, Sekolah Dasar or other schools
at the same level; and junior secondary school, that is, Sekolah Menengah Pertama or other
schools at the same level. Primary education takes twelve years to be completed. Secondary
education is the continuation of basic education. It comprises of general secondary education,
that is, Sekolah Menengah Atas and other schools with the same level; and vocational secondary
education, that is, Sekolah Menengah Kejuruan (SMK) or other schools with the same level.
Secondary education takes three years to be completed. Higher education is the level of
education after secondary education. It consists of diploma, bachelor, master, specialized
postgraduate programs and doctorate programs imparted by a higher education institution.
Higher education can be in the form of academy, polytechnic, college, institute, or university and
shall provide education, research and community services.
The aim of this paper is to analyze the benefit incidence of government spending on
education sector between each population groups (different per capita household consumption
groups) that divides the population into sub-group (quintile or deciles). This paper focuses on the
Indonesian government expenditure on education sector in 2007. The rest of the paper is
organized as follows. Section II discusses the literature review of Benefit Incidence Analysis

5
(BIA) related studies in various countries. Section III describes the data and methodology that
will be used to estimate the benefit incidence. The results of the study are presented in section
IV. Finally, section V provides conclusions.
II. Literature Review
There have been many researchers studying Benefit analysis incidence on education
spending across countries. The pioneers are Selowsky (1979) who analyzed education spending
in Colombia; and Meerman (1979) who studied the same case for Malaysia. Selowsky (1979)
revealed that the total subsidy to education was distributed evenly between quintiles. Subsidies to
primary education was very progressive, but the reverse subsidy for higher education highly
regressive. Meerman (1979) used a sample survey of households developed by the Malaysian
department of statistics. Four important related sectors were studied in household level of
Malaysia, which were: education, medical care, agriculture and public utilities (water, electricity,
and sewerage). It was found that the distribution of subsidies to primary education gave higher
benefit to households of the lowest per capita consumption. On the contrary, subsidies spent for
higher education was pro-rich.
Selden and Wasylenko (1992) used benefit incidence approach to estimate the impact on
the distribution of public education spending in Peru. They found slightly progressive on pro-
poor incidence in this education spending. One rationale was a lower proportion of poor children
compared to middle-to-high-income-household children for the group of ages 6 to 12 years old
who enrolled in primary school. It was also found that female got less benefit than male.
However, another incidence study of Gertler and Glewwe (1989) who used a behavioral
6
approach, found that rural households, including the poor, were willing to pay high enough fees
to cover operational costs of development of new secondary school in their village.
Demery (2000) estimated benefit incidence analysis in three countries, which were
Indonesia (1989), Colombia (1992) and Cote d'Ivoire (1995). The subsidies were distributed to
expenditure quintiles. In Indonesia and Cote d'Ivoire, quintile was defined across individuals; on
basis of household per capita expenditure which was they belonged. But for Colombia, the
analysis based on quintiles household. In Indonesia benefits were expressed on monthly basis,
while for Colombia and Cote d'Ivoire annual estimation were reported. He noted that the poorest
quintile benefited only 15 percent of total education spending in Indonesia, 13 percent in Cote
d'Ivoire, and 23 percent in Colombia. He concluded that the subsidy was not well targeted to the
poorest quintile of population (the poorest quintiles gained significantly less than their share in
the total population). It was progressively distributed-in relation to their income or expenditure.
Peter lanjoouw et al (2001) investigated BIA on education spending in Indonesia using
Susenas data 1998. They provided evidence that expenditure on primary education was pro-poor.
Most of benefit spending on junior secondary schools was used by middle quintile. For
secondary level, benefits were distributed very regressively and pro-rich. They also examined
marginal incidence of government spending on education and found that spending in both junior
and senior secondary school were much progressive.
Hamid et al (2003) analyzed benefit incidence of public spending on education by using
more than 80 sources covering 56 countries for period of 1960-2000. They found that, (i)
spending on primary education was pro-poor and progressive on average. The finding of pro-
poor spending was explained mainly by the pro-poor incidence of spending in the Western

7
Hemisphere and the Middle East and North Africa. Spending on primary education in PRGF-
eligible countries was not well-targeted; (ii) spending on secondary and tertiary education mainly
benefited to the non-poor and the middle-class one; and (iii) countries that tent to have more pro-
poor incidence of education spending also tent to have more pro-poor incidence of health
spending. A more pro-poor benefit incidence structure was associated with better education and
health outcomes, higher per capita income, better governance, wider availability of information,
and closer location of health facilities to the poor.
Nakar et al (2007) estimated benefit incidence on education spending for Chad. They
found that the richest strata benefit more from government transfer than do the poor strata and
for all social service include education. Moreover, primary education expenditure was more
progressive than secondary for higher education expenditure.
III. Methodology
III.1 Benefit Incidence Analysis (BIA)
This study utilizes Benefit Incidence Analysis (BIA) to analyze the distribution of
education expenditure. It brings together elements of the supply and demand for public service
and can provide valuable information on efficiencies (inefficiencies) and equities (inequities) in
government allocation of resources for social service and on the public utilization of these
services. BIA is an easy-to-use tool for ex ante designs as well as ex post monitoring and
evaluation of effectiveness of social spending programs.
The BIA approach was pioneered by World Bank studies by Selowsky (1979) in
Colombia and Meerman (1979) in Malaysia. The main goal of this method is to identify who
benefits from public spending and how much they receive. The essence of the approach is to use

8
information on the cost of public goods and service together with information on their use by
different per capita household consumption group to estimate the distribution of benefits
(Wawan, 2009).
BIA involves four steps processes that can be easily implemented using spreadsheet
software programs (Hamid et al, 2003). First, obtain the average unit cost of providing a public
service by dividing government spending on the service by total number of users of service.
Second, define the average benefit from government spending on a service as the average unit
cost of providing the service. This simple assumption ‘attributes’ or ‘imputes’ benefits from
government in-kind transfer to household or individuals welfare as measured by their per capita
household consumption. Third, rank the population of users from poorest to richest using welfare
measure and aggregate them into group (e.g. quintiles or deciles) with equal number of users.
Total monthly per capita household consumption is taken as a proxy for welfare measure. And
finally, derive the distribution of benefits by multiplying the average benefit calculated
previously by the number of users of the service in each per capita household consumption
group.
The procedure on how to estimate benefit incidence is given below:
j = 1, 2, 3, 4, 5 (1)
Where is benefit incidence accruing to per capita household consumption group j;
represents the number of enrolled students in education i from group j; is the total number of
enrolled students in a certain education level for all per capita household consumption group;
represents total expenditure on education level i; / is the unit cost of providing education at

9
level i; subscript i represents level of education (primary, secondary and tertiary) and subscript j
represents population ranked from poorest to richest using household per capita consumption and
aggregate them into quintile.
The share of benefits accrued to quintiles j from total government spending on
education (S) is given by:
Where, is the quintile j share of total student enrolled at primary, secondary and higher level
and is share of government spending of each level education i in total education spending. The
(e) and (s) reflect the behavior of households in term of enrollment decision and government in
term of budget allocation levels of schooling. The incidence of public expenditure on percentile j
thus depends on two factors: the intra-sector allocation of the budget, notably in favor of the
services most used by group j and the relative frequentation of these services by group j (Nakar
et al, 2007).
III.2 Data
The data used in this study are as follows. (i) Government spending on a service. Data of
actual expenditure of the government on education (primary, secondary, tertiary level and total
government spending on education) in 2007 were obtained from the ministry of finance. (ii)
Public utilization of the service. Data of Public utilization of the service in 2007 were obtained
from the family life survey Indonesia (IFLS). IFLS is an ongoing longitudinal household surveys
that collect a vast amount of information about individuals, households, communities and

10
facilities. The first wave of the survey (IFLS1) field in 1993 was representative of 83%
population of Indonesia. Since then there have been three subsequent survey waves, IFLS2
(1997), IFLS3 (2000), and IFLS4 (2007) (Witoelar, 2009). In this research, the survey is used to
estimate (1) the welfare measure (households are arranged from poorest to richest based on
welfare indicator, named per capita household consumption); and (2) The number of enrolled
students. Users of government services are referred as beneficiaries of the service. For
educational service, beneficiaries include students enrolled each level (primary, secondary and
higher) from each group of per capita household consumption.
IV. The Empirical Result and Analysis
IV.1 Realization of Government Budget
Realization of government spending in 2007 according to its function is shown in Table
1. Table 1 shows each of government expenditure which is divided into eleven functions. Among
eleven functions in 2007, the government allocated 20.96 percent to education function. For this
year of 2007, education was also the largest government spending. The allocation of education
budget in 2007 was the largest allocation compared to preceding years. Primary education
received the largest share of 8.87 percent compared with the other educational levels, where
secondary education got 1.71 percent, 3.26 percent for higher education and 7.01 percent for
others.
Table 1 is about here
IV.2 Incidence of Public Expenditure on Education
Table 2 shows that the largest allocation of government spending on education is primary
education level, which is about Rp 23,147,968 billion or 64.32 percent of the total government
spending on education (total of primary, secondary and higher level), while secondary gets Rp

11
4,411,167 billion or 12.26 percent, and higher one receives Rp 8,427,765 billion or 23.41 percent
of total government spending on education. The poorest quintile receives the largest share of
total government spending on primary level that is Rp 6,071,317 billion. Nevertheless, they
receives the smallest share in total government spending on secondary and higher level that is Rp
652.450 billion and Rp 305.208 billion. The richest receives Rp 4,776,519 billion at the higher
level which is the largest share at that level and only receives Rp 2,582,448 billion at the primary
level. For the secondary level, middle class receives the largest share. Table 2 also shows that
26.23 percent of total students enrolled in primary level come from the poorest quintile, but only
3.62 percent of total enrolled of students at the higher level come from this quintile. A very large
discrepancy occurred between the presence of primary and university level. In contrast, only
11.16 percent of the total students enrolled at primary level come from the richest quintile while
56.7 percent of total enrolled of students at higher level come from them. Above reflects the fact
that most of poor households send their children to primary level and very rarely to reach the
higher education. This result is in line with Seldon and Wasylenko’s finding (1992) that the
reason of less benefit received by the poorest in higher level of education was the lower
proportion of enrolled in higher level compared with children of the middle-to-high-income-
household class.
Table 2 is about here
Table 3 is about here
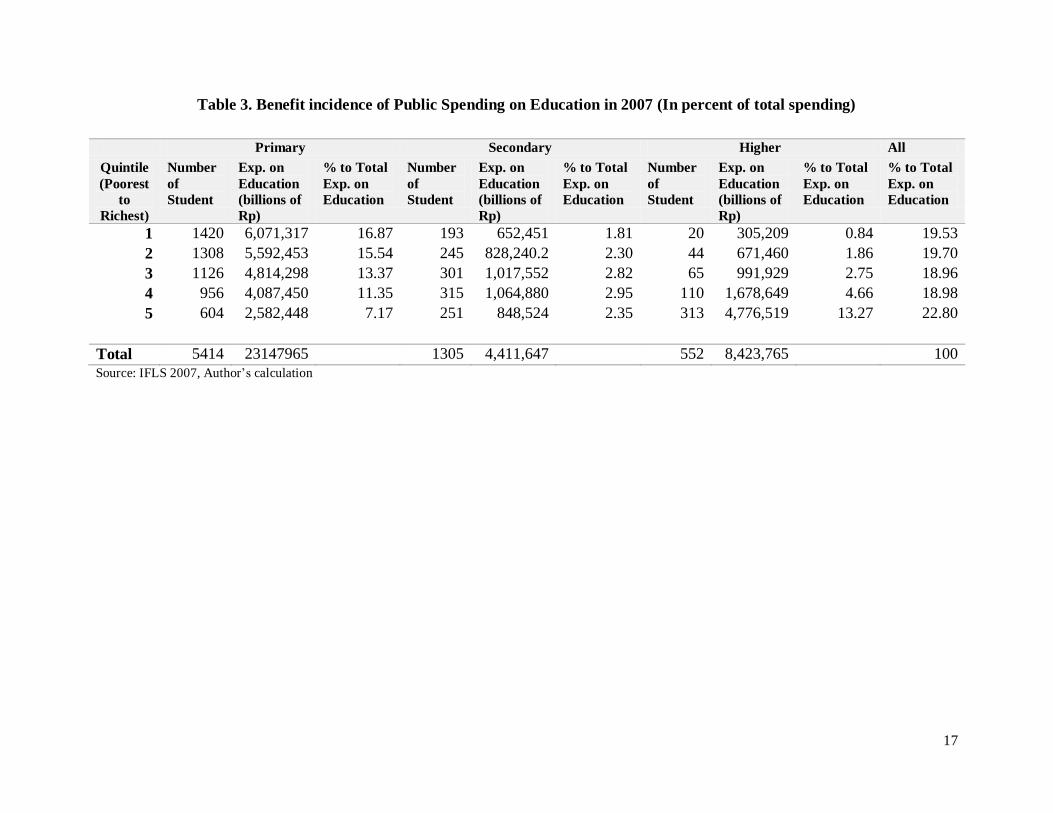
Table 3 shows the benefit incidence of government spending from total education
spending on all three sectors, in contrast to table 2 which only shows the benefit incidence of
government spending based on each education level. Table 2 is derived from equation 1 and

12
Table 3 from equation 2. Equation 2 reveals the intuitive appeal and simplicity of the BIA. This
shows that the more government spending on education widely utilized by a given quintile, the
more the quintile receives benefits. In the other words, benefit incidence depends on the
composition of the users of education services that are classified by the composition of economic
level in education spending. Estimation of benefit incidence captures the joint behavior of users
and government. In other words, the determinants of the benefit incidence of each quintile are
the average participation quintile, or the average utilization of educational services provided by
the government, and intra-sectoral allocation of education spending by the government as well.
By examining equation 2 and the results in Table 3, we can accurately capture the total benefits
received by each quintile of total government expenditure on education (primary, secondary, and
higher). This gives more information compared to the use the first equation that is only able to
capture the benefits solely based on expenditure per level of education.
Total government spending on the education shows that the richest quintile receives
about 22.80 percent of benefit, while the poorest receives only 19.53 percent of total spending on
education. It can be concluded that overall spending on education is still pro-rich. However,
spending on primary education is pro-poor and progressive. The poorest quintile of the
population receives 16.87 percent of total government spending on education. They receive the
largest share at primary level. The richest receives the smallest benefit at primary education level
that is only 7.17 percent of total government spending on education. Primary education is often
viewed as an important instrument to ensure the universal access to formal education system, the
build of human capital, and attempt against poverty. Spending on secondary and higher level
especially benefits to the non-poor. It is shown in table 3 that the richest receives about 13.27
percent of benefit from higher education spending while the poorest receives the smallest share
13
which is 0.84 percent. Government policy tends to pro-rich and regressive at this educational
level.
V. Conclusion
This research analyzes incidence of public education spending in Indonesia in 2007 using
Benefit Incidence Analysis (BIA). The question we attempt to answer is who benefits from
public spending on education? In 2007, overall government spending on education sector is less
progressive; tend to provide more benefit to middle class and the rich. Nevertheless, government
spending on primary education is pro-poor and progressive while government spending in higher
education seems to be not pro-poor which is shown by the less benefit received by those groups.
In contrast, the richest receives largest benefit on secondary and higher education. It proves that
spending on secondary and higher education is regressive and pro-rich.
The above finding should be considered as challenge to policymaker to improve public
social spending policy in favor of the poor. The big question for policymaker is what policies
should be adopted to improve targeting of social spending? Policymakers should increase the
budget allocation of public spending towards the poor and increase utilization of public services
by the poor, at least to create a progressive service. Several issues related to this problem are
quality of public education, formal and informal (out of pocket) costs faced by the poor,
governance, gender bias, and location of public education services.
References
Castro, Leal F., J.Dayton, L. Demery and K. Mehra, 'Public Spending on Health Care in Africa:
do the poor benefit?', Bulletin of the World Health Organization, 200: 78 (1).

14
Cuena,Janet S., 2008. ‘Benefit Incidence Analysis of Public Spending on Education in the
Philippines: a methodological note', Phillipine Institute for Development Studies: 2008-
09
Davoodi, R Hamid, Tiongson, R Erwin and Asawanuchit, S Sawitree, 2003. ’How Useful Are
Benefit Incidence Analyses of Public Education and Health Spending’, IMF Working
Paper WP/03/227
Demery, Lionel, 2000. ‘Benefit Incidence: A Practitioner’s Guide, Poverty and Social
Development Group African Region, The World Bank.
Duflo, Esther, 2000. ‘Schooling and Labor Market Consequences of Schooling Construction in
Indonesia: evidence from an unusual policy experiment’, National Bureau of Economic
Research Working Paper: 7860
Gertler, Paul and Paul Glewwe, 1989. ‘The Willingness to Pay for Education in Developing
Countries: evidence from rural Peru', Living Standards Measurement Study Working
Paper: 54.
Hyman, N. David, 2008. Public Finance: a contemporary application of theory to policy, 9th
Edition. South-Western Cengage Learning.
Juswanto, Wawan, 2009. ‘Distribution of Government Expenditure and Demand for Education
Services: the case of Indonesia’.
Kruse, Ioana, Menno Pradhan and Robert Sparrow, 2011. ‘Marginal Benefit Incidence of Public
Health Spending: evidence from Indonesia sub-national data’.
Lanjau Peter, Pradan Menno, Saadah Fadia, Sayed Haneen, Sparrow Robert, 2001 ‘Poverty,
Education and Health in Indonesia: Who Benefits from Public Spending?’, World Bank,
PolicyResearch Publication: 2739.
Meerman, Jacob, 1979.’Public Expenditure in Malaysia, Who Benefits and Why?’, World Bank
Research Publication, Oxford University Press.
Ministry of Finance. Budget Statistic. Various Edition.
Ministry of Education. http://www.kemdiknas.go.id/kemdiknas/index.php.
Selowsky, Marcelo, 1979.’Who Benefits From Government Expenditure? A Case Study of
Colombia’, World Bank Research Publication, Oxford University Press.
Syntyche, Nakar D., Tabo Symphorien N. and Toinar Mogota A, 2007. ‘Who Benefits From
Social Expenditure in Chad? An Incidence Analysis Using Survey Data’, PMMA
Working Paper: 2007-11

15
van de Walle, Dominique, 'Public Spending and The Poor: what we know, what we need to
know', World Bank.
Witoelar, Firman, 2009. 'Note on The Construction of The IFLS Consumption Expenditure
Aggregates'. The World Bank Research.

16
Table 1. Realization of Government Expenditure 2007 by Function
Government
Expenditure
Billion of
Rupiah
Percent
General services 50,056,017 19.40
Defense 32,722,067 12.68
Security and order 29,210,737 11.32
Economy 51,249,635 19.86
Environment 5,478,493 2.12
Housing and public
facilities
10,659,482 4.13
Health 17,467,051 6.77
Tourism and culture 1,676,261 0.65
Religion 2,208,113 0.86
Education 54,067,138 20.96
- Primary 23,147,965 8.97
- Secondary 4,411,647 1.71
- Higher 8,423,764 3.26
Other 18,083,761 7.01
Social security 3,209,749 1.24
Total expenditure 258,004,744.70 100
Source: Directorate general of Treasury, MOF, Indonesia
Table 2. School Enrollment and Distribution of Expenditure on Education in 2007
Quintile
(Poorest
to
Richest)
Primary Secondary Higher Number
of
Student
Exp. on
education
(billion of
Rp)
% to
Total
Exp. on
Primary
Education
Number
of
Student
Exp. on
education
(billion of
Rp)
% to
Total
Exp. on
Secondary
Education
Number
of
Student
Exp. on
education
(billion of
Rp)
% to
Total
Exp. on
Higher
Education
1 1,420 6,071,317 26.23 193 652,450.5 14.79 20 305,208.9 3.62
2 1,308 5,592,453 24.16 245 828,240.2 18.77 44 671,459.5 7.97
3 1,126 4,814,298 20.8 301 1,017,552 23.07 65 991,928.8 11.78
4 956 4,087,450 17.66 315 1,064,880 24.14 110 167,8649 19.93
5 604 2,582,448 11.16 251 848,523.7 19.23 313 4,776,519 56.7
Total 5,414 23,147,965 100 1,305 4,411,647 100 552 8,423,765 100
Source: IFLS 2007, author calculation
Note: Actual data of total expenditure on education in each level of education is taken from ministry of
finance. Sample data of total number student is taken from The Indonesian Life Family Survey (IFLS).
17
Table 3. Benefit incidence of Public Spending on Education in 2007 (In percent of total spending)
Source: IFLS 2007, Author’s calculation
Primary Secondary Higher All
Quintile
(Poorest
to
Richest)
Number
of
Student
Exp. on
Education
(billions of
Rp)
% to Total
Exp. on
Education
Number
of
Student
Exp. on
Education
(billions of
Rp)
% to Total
Exp. on
Education
Number
of
Student
Exp. on
Education
(billions of
Rp)
% to Total
Exp. on
Education
% to Total
Exp. on
Education
1 1420 6,071,317 16.87 193 652,451 1.81 20 305,209 0.84 19.53
2 1308 5,592,453 15.54 245 828,240.2 2.30 44 671,460 1.86 19.70
3 1126 4,814,298 13.37 301 1,017,552 2.82 65 991,929 2.75 18.96
4 956 4,087,450 11.35 315 1,064,880 2.95 110 1,678,649 4.66 18.98
5 604 2,582,448 7.17 251 848,524 2.35 313 4,776,519 13.27 22.80
Total 5414 23147965 1305 4,411,647 552 8,423,765 100

18