munich personal repec archive - uni-muenchen.de · international trade and economy as shown in...
TRANSCRIPT

MPRAMunich Personal RePEc Archive
Bilateral Trade Balance of Bangladeshwith BRICS Countries: A Static PanelData Analysis
Nobinkhor Kundu
Assistant Professor, Department of Economics, Comilla University,Bangladesh
10. June 2015
Online at http://mpra.ub.uni-muenchen.de/66091/MPRA Paper No. 66091, posted 14. August 2015 05:23 UTC

Journal of Economics and Development, Vol.17, No.2, August 2015, pp. 53-68 ISSN 1859 0020
Bilateral Trade Balance of Bangladesh
with BRICS Countries: A Static Panel
Data Analysis
Nobinkhor Kundu
Assistant Professor
Department of Economics, Comilla University, Bangladesh
Email: [email protected]
Abstract
This paper explores the phenomenon of gravity modeling to examine the crucial relationships
between the trade balances of Bangladesh with BRICS countries. Specifically, the relative
factors determining trade in the popular gravity model have effects on the trade balance model.
The trade balance depends on the relative GDP, relative per capita GNI, real exchange rate and
import-weighted distance proxies for transportation cost of the partner countries to the home
country. Using standard panel data techniques during the 1991-2013 period, the model is
empirically tested and the results show significant effects of all the relative factors on the
bilateral trade balance of Bangladesh in trading with BRICS countries. The robustness check of
the model ensures the validity of the specification. The static panel data analysis explores the
cross-country variations as well as the time-invariant country-specific effects on trade balance
with heterogeneous economies and finds significant effects of all relative factors on the trade
balance of Bangladesh.
Keywords: Bilateral Trade, BRICS, Panel Data Model
JEL Classification: F41, C23
Journal of Economics and Development, Vol.17, No.2, August 2015, pp. 53-68 ISSN 1859 0020
1. Introduction
The BRICS1 countries are chosen on the basis of their importance as a trading partner of
Bangladesh. BRICS has witnessed immense growth in national GDP, contribution to world GDP
and contribution to world trade. Starting with a share of a little over 10% in world GDP and 4%
in world trade in 1990, currently BRICS contributes about 21% of world GDP and 15% of world
trade, 46% of the world‟s work force, and 19 % of the world´s nominal GDP. Undeniably, China
is the largest trade partner for each of the other BRICS countries with a trade share ranging
between 72% and 85%, followed by India with a share ranging between 8% and 26% (BRICS,
2014). The increasing trend of growth signifies the economic importance of these countries in
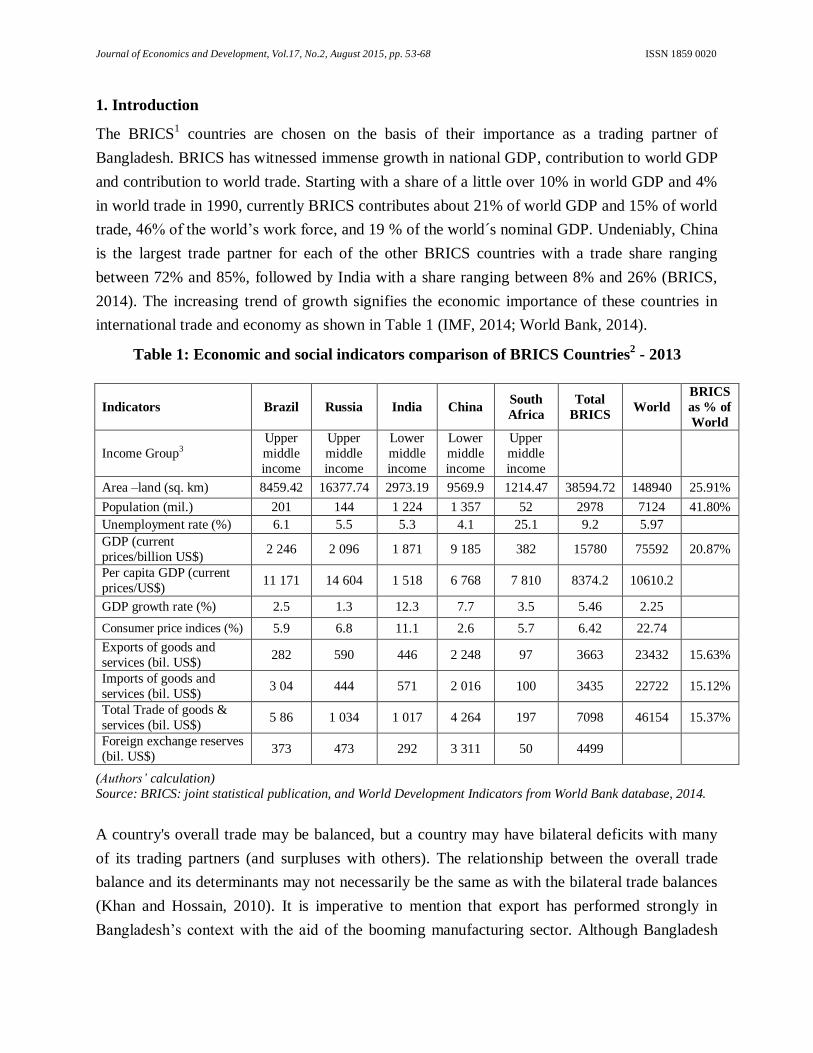
international trade and economy as shown in Table 1 (IMF, 2014; World Bank, 2014).
Table 1: Economic and social indicators comparison of BRICS Countries2 - 2013
Indicators Brazil Russia India China South
Africa
Total
BRICS World
BRICS
as % of
World
Income Group3 Upper
middle
income
Upper
middle
income
Lower
middle
income
Lower
middle
income
Upper
middle
income
Area –land (sq. km) 8459.42 16377.74 2973.19 9569.9 1214.47 38594.72 148940 25.91%
Population (mil.) 201 144 1 224 1 357 52 2978 7124 41.80%
Unemployment rate (%) 6.1 5.5 5.3 4.1 25.1 9.2 5.97
GDP (current
prices/billion US$) 2 246 2 096 1 871 9 185 382 15780 75592 20.87%
Per capita GDP (current
prices/US$) 11 171 14 604 1 518 6 768 7 810 8374.2 10610.2
GDP growth rate (%) 2.5 1.3 12.3 7.7 3.5 5.46 2.25
Consumer price indices (%) 5.9 6.8 11.1 2.6 5.7 6.42 22.74
Exports of goods and
services (bil. US$) 282 590 446 2 248 97 3663 23432 15.63%
Imports of goods and
services (bil. US$) 3 04 444 571 2 016 100 3435 22722 15.12%
Total Trade of goods &
services (bil. US$) 5 86 1 034 1 017 4 264 197 7098 46154 15.37%
Foreign exchange reserves
(bil. US$) 373 473 292 3 311 50 4499
(Authors‟ calculation) Source: BRICS: joint statistical publication, and World Development Indicators from World Bank database, 2014.
A country's overall trade may be balanced, but a country may have bilateral deficits with many
of its trading partners (and surpluses with others). The relationship between the overall trade
balance and its determinants may not necessarily be the same as with the bilateral trade balances
(Khan and Hossain, 2010). It is imperative to mention that export has performed strongly in
Bangladesh‟s context with the aid of the booming manufacturing sector. Although Bangladesh

Journal of Economics and Development, Vol.17, No.2, August 2015, pp. 53-68 ISSN 1859 0020
performed impressively in increasing her exports, but imports at the same time were enhanced to
a greater degree together with the presence of a narrow export basket (Rahman, 2006; Rahman
2009). Utmost, it is to be noted that Bangladesh‟s exports grew by about five times over the last
decade (Khan et al., 2013). In this regard, it should be pointed out that the BRICS countries have
already shown clear ambitions in foreign trade policies. Thus, BRICS seems to challenge the
trade balance of the international position.
Trade balance has been long considered the driver of the economic engine in developing
countries. Bangladesh, as a comparatively new player in the trade game, has made considerable
progress. Bangladesh‟s trade growth has been one of the trade-mark characteristics of the
country for the last couple of decades. Specifically, export has displayed robust growth in the
face of diverse economic and political setbacks, both in the local and the global context.
Kowalski and Bottini (2011) mention what country‟s exports or imports are driven by the
expansion of it‟s (and it‟s trading partners‟) income and to what extent they may be driven by
trade and other policy influences.
The objective of the research paper is firstly, how to identify the trade gap between Bangladesh
with BRICS countries for reduced trade deficit. And secondly, the paper examines how a gravity
model for bilateral trade of Bangladesh with BRICS countries may be calibrated using the panel
data in a fixed effects approach for promoting international trade.
The organisation of the rest of the paper is as follows. Section ii presents the stylized facts of the
bilateral trade performance of Bangladesh. Section iii presents model specification and data with
a discussion of the theoretical foundation and empirical method of the trade balance model.
Section iv shows how the tests of the trade balance model - multicollinearity, heteroscedasticity
and autocorrelation - characterize the model for better specification and estimation. The
individual test confirms the existence of individual (country specific) effects and the Hausman
test results suggest that the Fixed Effects Model of panel estimation is the appropriate model
relevant for the current study. Section v reports the empirical results of the trade balance model.
The last section vi provides the conclusion and summary of the study.
2. Bilateral trade of Bangladesh
2.1. Bilateral export performance
Bangladesh followed an inward looking trade policy and had high anti-export bias in the
immediate post-independence period. By the end of the 1970s, Bangladesh partially changed its
anti-export bias policies and by the mid-1980s it undertook policies and programmes that
resulted in consistent improvement in the incentive to export. By the 1990s Bangladesh became

Journal of Economics and Development, Vol.17, No.2, August 2015, pp. 53-68 ISSN 1859 0020
more export oriented and significant improvements have been made in export policy and
administration.
Figure 1: Bilateral export performance of Bangladesh with BRICS countries
Source: Direction of Trade Statistics database from IMF, 2014
Major export partners of Bangladesh are the USA, the European economy (Germany, UK,
France, Belgium, Italy, and the Netherlands), China, India, Canada and Japan. Analysis of
BRICS countries exports in Figure 1, shows that despite the debilitating effects of the
international trade among BRICS countries, the highest value of which for Bangladesh was with
India, where the export earnings of Bangladesh from 1991 to 2002 were sluggish, by 2002 export
earnings had a value of 50 US million dollars. Afterwards, the export earnings of Bangladesh
with India from 2002 to 2008 rose sharply, with a value of around 325 million US dollars in
2008. In the global financial crisis in 2008 the export growth of Bangladesh with India was
falling slightly and again in 2010 export growth was rising (Bhattacharya and Hossain, 2006).
And the second highest export earnings of Bangladesh which were with China, rose sharply after
2002. But the rest of the BRICS countries export growth with Bangladesh from 2010 was
gradually rising (WDI, 2014). Since the early 1990s, overall growth of exports has been fairly
robust with the exception of 1996, 2002 and 2008 when there was a sharp drop in this growth.
2.2. Bilateral import performance
In the early 1970s, Bangladesh adopted more restrictive import policies to protect the local
import substituting industries. It began to liberalize its import regime in the early 1980s under the
Structural Adjustment Policy (SAP) and later in the mid 1980s under the Enhanced SAP, but not

Journal of Economics and Development, Vol.17, No.2, August 2015, pp. 53-68 ISSN 1859 0020
much liberalization was achieved. Trade deficits further widened in most of the developing
countries since the early 1990s because of rapid trade liberalization that resulted in a surge of
imports, particularly where protection in the past was excessive and import-substitution
strategies were not successful in establishing competitive industries. This also happened because
the liberalization was not accompanied by appropriate structural or policy changes in the
developing countries to adapt to the new challenges.
Figure 2: Bilateral import performance of Bangladesh with BRICS countries
Source: Direction of Trade Statistics database from IMF, 2014
Analysis of BRICS countries imports in Figure 2 shows that the import payments of Bangladesh,
which were highest with India from 1991 to 2000, were moderate, the value being around 1,000
million US dollars in 2000. Afterwards, import payments of Bangladesh with India from 2000 to
2005 was sharply rising, to a value of around 2,000 million US dollars in 2005. The second
highest import payments of Bangladesh with China from 1991 to 2005 were sharply rising, to a
value of around 2,000 million US dollars in 2005. The highest import payments of Bangladesh
with China after 2005 were in 2013, when they reached around 7,000 million US dollars.
Interesting is that in 2005 and 2008, import payments of Bangladesh with China and India were
congruent. For the other BRICS countries import payments of Bangladesh from 1991 to 2000
were negligible and after 2001 were sluggishly rising (WDI, 2014).
2.3. Net trade performance
Trade deficits further widened in most of the developing countries since the early 1990s, and
growth of exports has been fairly robust with the exception of 1996, 2002 and 2008 when there
was a sharp drop in this growth. The robust growth of exports put the country in the league of top

Journal of Economics and Development, Vol.17, No.2, August 2015, pp. 53-68 ISSN 1859 0020
20 countries demonstrating the fastest export expansion (Bhattacharya and Hossain, 2006). At
the same time, Bangladesh was in the process of graduating from a predominantly aid-dependent
economy to a trading economy in this decade as pointed out earlier.
Figure 3: Bilateral net trade balance of goods of Bangladesh with BRICS countries
Source: Direction of Trade Statistics database from IMF, 2014
We have analysed the bilateral net trade balance of goods value of Bangladesh as a percentage of
BRICS countries in Figure 3. Since 1991 to 1994, the net trade balance of goods value of
Bangladesh as a percentage of BRICS countries is stagnant, and after that the net trade balance
of goods value direction is rising sharply in 1999. On the contrary, the net trade balance of goods
value is falling from 2000 to 2013 but the net trade balance of goods value is rising in 2004-05.
This also happens because liberalization is not accompanied by appropriate structural changes in
the developing countries to adapt to the new challenges. Finally, the net trade of goods deficit
has gradually shrunk, and the current account balance of merchandise items has reached a steady
situation near the first half of the 2020s.
3. Model specification and data
3.1. Theoretical foundation
The Gravity Model of trade pioneered by Tinbergen (1962), Poyhonen (1963), Linneman (1966)
and Anderson (1979) also represents a reduced form of a four-equation partial equilibrium model
of export supply and import demand as in former approaches. The Gravity model is a bilateral
trade model and in its most rudimentary form relates trade between two countries to their size
(measured by national income and population) and the geographical distance between them (as a
proxy of transport costs and home bias).
Journal of Economics and Development, Vol.17, No.2, August 2015, pp. 53-68 ISSN 1859 0020
We have used the Gravity model specified by Deardorff (1997), Matyas (1997), and Anderson
and Wincoop (2003) to estimate the trade balance function for Bangladesh. Volume of trade is a
function of a country‟s income (GNPs or GDPs), population and distance (proxy for
transportation costs). The gravity model was originally formulated in multiplicative form and
also the model was assumed by fixed relative prices4. It denotes the relative prices - the price of a
country‟s exports relative to the foreign price of related goods expressed in a common currency.
The overall inflation or rise in the price level raises the real effective exchange rate and hence
affects the trade (Roy and Rayhan, 2011).
The basic idea of the new approach is that in bilateral trade the “absolute size” of the country in
terms of income and population is not so important, rather the “relative size” of the trading
partners determines the export supply and import demand. The extended model of Khan and
Hossain (2010) expresses the bilateral trade balance of country-i with partner country-j (TBij)5 as
the ratio of exports over imports (Xij/Mij), which according to Bahmani-Oskooee (1991),
Bahmani-Oskooee (2001), Thapa (2002), Hussain et al. (2003), and Shepherd (2012) is unit free
and can be interpreted as nominal or real trade balance, and it allows focusing on the specific
causes of trade imbalance between a country and its major trading partners. The extended model
is presented as follows:
jiij
j
i
j
i
ijij MWDRERy
y
Y
YTBTB ,,,
TBij = TBij (RGDPij , RPGNIij , RERij , MWDji (1)
Where, RGDPij = Relative GDP = Yi/Yj = GDPi /GDPj
RPGNIij = Relative per capita income = yi/yj
RERij = Real exchange rate between country-i and country-j, and
MWDji = Import-weighted distance between country-i and country-j
3.2. Empirical method
In general, the bilateral trade balance of Bangladesh with BRICS countries is used in the
empirical estimation based on different estimation techniques of static panel data analysis. To
test empirically, ordinary least square (OLS) regression is applied to log-linear transformed for
estimation, and adding time subscripts (t) and an error term itu to equation (1) the of trade
balance in the following way:
ln(TBij) = β0 + β1ln(RGDPij) + β2ln(RPGNIij)t + β3(RERij)t + β4ln(MWDji)t + uit (2)

Journal of Economics and Development, Vol.17, No.2, August 2015, pp. 53-68 ISSN 1859 0020
We have introduced RGDPij, RPGNIij, and MWDji in natural log (ln) forms but semi-elasticity of
the trade balance (TBij) with respect to the RERij. That can reduce the problem of
heteroskedasticity because it compresses the scale in which the variables are measured, thereby
reducing a tenfold difference between two values to a twofold difference.
The signs for the estimators associated with the variables in the model are expected to be similar
to traditional theoretical expectations. That is, β1 is expected to be negative. In other words, an
increase in GDP of partner country-j relative to GDP of home country-i (RGDPij = GDPi /GDPj)
will see a deterioration in the trade balance of the home country. If country-j (partner country)
demands more of her domestic goods due to higher relative per capita GNI (RPGNIij) then
demands more of country-i‟s goods due to this income (absorption) rise, the sign of β2 will be
positive. It is expected that the effects of the real exchange rate (RERij)6 on trade balance is
positive and the sign of β3 will be positive. The more the real exchange rate (RERij) index raise
the more there is a depreciation of the exporter‟s (country-i‟s) currency with respect to the
currency of her trading partner (countryj‟s), hence the trade balance (TBij) improves with
increasing export competitiveness (elasticity approach). In our model we take bilateral import-
weighted distance (MWDji)7 as a proxy for transportation (Khan and Kalirajan, 2011). The effects
of import-weighted distance (MWDji) has a negative impact on the trade balance and the sign of
β4 will be negative.
3.3. Data
For the purpose of econometric analysis, the bilateral trade balance of Bangladesh comprising
trade with her major trading partner BRICS countries, the data were collected from various
sources from the period 1991 to 2013. Country-specific annual data required in the analysis
relate to Gross Domestic Product (GDP at a constant 2005 US$ value), per capita Gross National
Income (GNI at a constant 2005 US$ value), consumer price index (CPI at a constant 2005
value) and official exchange rates (units of foreign currency per BDT) for exporting and
importing countries. Data on GDP, per capita GNI, exchange rates and CPI are obtained from the
World Development Indicators (WDI) from the World Bank database, 2014. And also the
geographical distance between Dhaka (capital of Bangladesh) and capital cities of respective
partner countries-j are obtained from the World Bank website (www.econ.worldbank.org).
Data on Bangladesh‟s bilateral export to and import from the sample trading partners during the
study period have been collected from the Direction of Trade Statistics (DOT) database from the
International Monetary Fund (IMF) website. There were some missing data, which are filled in
from the Bangladesh Bank publications - Export Receipts and Import Payments (various issues).
The econometric software package Eviews 7 is used to do the analysis. In the case of estimation
of some of the techniques that are modified MS Excel has been used.

Journal of Economics and Development, Vol.17, No.2, August 2015, pp. 53-68 ISSN 1859 0020
4. Test of the trade balance model8
To test the presence of the individual effects we must first estimate the unrestricted specification
of the model in equation (2) that includes the effects of interest. The test results, the Eviews
output, are displayed in Table 2. There are three sets of tests - the first set consists of two tests
that evaluate the joint significance of the cross-section effects using sums-of-squares (F-test) and
the likelihood function (Chi-square test) (Wooldridge, 2006). The two statistical values (7.78)
and (43.14) and the associated p-values strongly reject the null that the effects are redundant. It
indicates the presence of strong individual effects (country-specific effects).
Table 2: Test of individual effects
Redundant Fixed Effects Tests
Test Cross-Section and Period Fixed Effects
Dependent Variable: LNTB
Sample: 1991 2013; Periods: 23; Cross-sections: 6 Total panel (balanced) observations: 138
Effects Test Statistic d.f. Prob.
Cross-section F 7.78 (5,106) 0.00
Cross-section Chi-square 43.14 5 0.00
Period F 3.70 (22,106) 0.00
Period Chi-square 78.75 22 0.00
Cross-Section/Period F 4.33 (27,106) 0.00
Cross-Section/Period Chi-square 102.63 27 0.00
The second set also consists of two tests that evaluate the joint significance of the period effects
using the same two tests (F-test and Chi-square test). The two statistical values and the
associated p-values also reject the null that the period effects are redundant. It means there is also
the presence of period effects. The third test result evaluates the joint significance of all of the
effects using the same two tests statistics. The results suggest that the corresponding effects are
statistically significant. Therefore, cross-section specific (i.e. country-specific) effects tests of the
model have been performed, and the presence of this type of effect is confirmed by the test
result.
Table 3: Hausman test
Correlated Random Effects - Hausman Test
Test Cross-Section Random Effects Sample: 1991 2013; Periods: 23; Cross-sections: 6
Total panel (balanced) observations: 138
Test Summary Chi-Sq. Stat. Chi-Sq. d.f. Prob.
Cross-section random 22.87 4 0.00
Cross-section random effects test comparisons:
Variable Fixed Random Var(Diff.) Prob.
LNRGDP 0.99 -8.56 14.724 0.01
LNRPGNI -1.81 8.17 13.655 0.00

Journal of Economics and Development, Vol.17, No.2, August 2015, pp. 53-68 ISSN 1859 0020
LNMWD -0.68 -0.79 0.0018 0.00
RER -0.01 0.02 0.0003 0.04
To perform the Hausman test, first a model with random effects specification has to be estimated
(Hausman, 1978). The Eviews output in Table 3 presents the high value of Hausman Chi-square
statistics (that is, low p-value) favour Fixed Effects Modelling and the low value of Hausman
Chi-square statistics (that is, high p-value) favour Random Effects Modelling. Results show that
there is a difference between the two estimators, with only the exception of RER. These results
suggest that the Fixed Effects Model (FEM) is the appropriate panel data estimator for the
present study, since the statistic provides no evidence against the null hypothesis that there is no
misspecification.
All variables in the model are tested for multicollinearity. To check whether there is
multicollinearity in the model we adopt the following procedure. We take the first column of
Table 4, this gives the correlation of LNTB with the other LNRGDP, LNRPGNI, RER and
LNMWD.
Table 4: Coefficients of Correlation Matrix
LNTB LNRGDP LNRPGNI LNMWD RER
LNTB 1.00
LNRGDP 0.62 1.00
LNRPGNI 0.63 0.99 1.00
LNMWD -0.80 -0.89 -0.89 1.00
RER -0.01 -0.31 -0.30 0.30 1.00
Where 0.62 is the correlation between TB and RGDP, 0.63 is the correlation between LNTB and
LNRPGNI, and so on, suggesting that there is no collinearity problem. As we can see, several of
these pair-wise correlations are quite high, suggesting that there may be a severe collinearity
problem. Only the correlation coefficient between LNTB and LNRPGNI is a bit higher, though it
is still less than 0.80 (r = 0.63). Therefore it can be concluded that there is no severe
multicollinearity in the model. And also we measure covariance as a multicollinearity problem of
the relationship between LNTB with the LNRGDP, LNRPGNI, RER and LNMWD. As we
expect, the values of the covariance indicates that the p-value is statistically significant, and are
presented in Table 5.
Table 5: Analysis of Covariance Matrix
Journal of Economics and Development, Vol.17, No.2, August 2015, pp. 53-68 ISSN 1859 0020
LNTB LNRGDP LNPRGNI LNMWD RER
LNTB 2.20
---
LNRGDP 1.06 1.32
(0.00) ---
LNRPGNI 1.05 1.29 1.28
(0.00) (0.00) ---
LNMWD -2.63 -2.26 -2.22 4.87
(0.00) (0.00) (0.00) ---
RER -0.15 -3.55 -3.44 6.64 100.42
(0.00) (0.00) (0.00) (0.00) ---
In the panel data analysis homoscedasticity is an underlying assumption. To test the
heteroscedasticity in the model the Park test method has been adopted, which has good power of
detecting herteroscedasticity of unknown form (Gujarati et al., 2009). The Park test of model (2)
has detected the existence of heteroscedasticity in the observations within the group and in every
observation. So, the most popular remedy for heteroscedasticity called - heteroscedasticity
corrected standard errors technique is used for estimation of fixed effects of the model as shown
in Table 6. It focuses on improving the estimation of the standard errors of estimators without
changing the estimates of the slope coefficients.
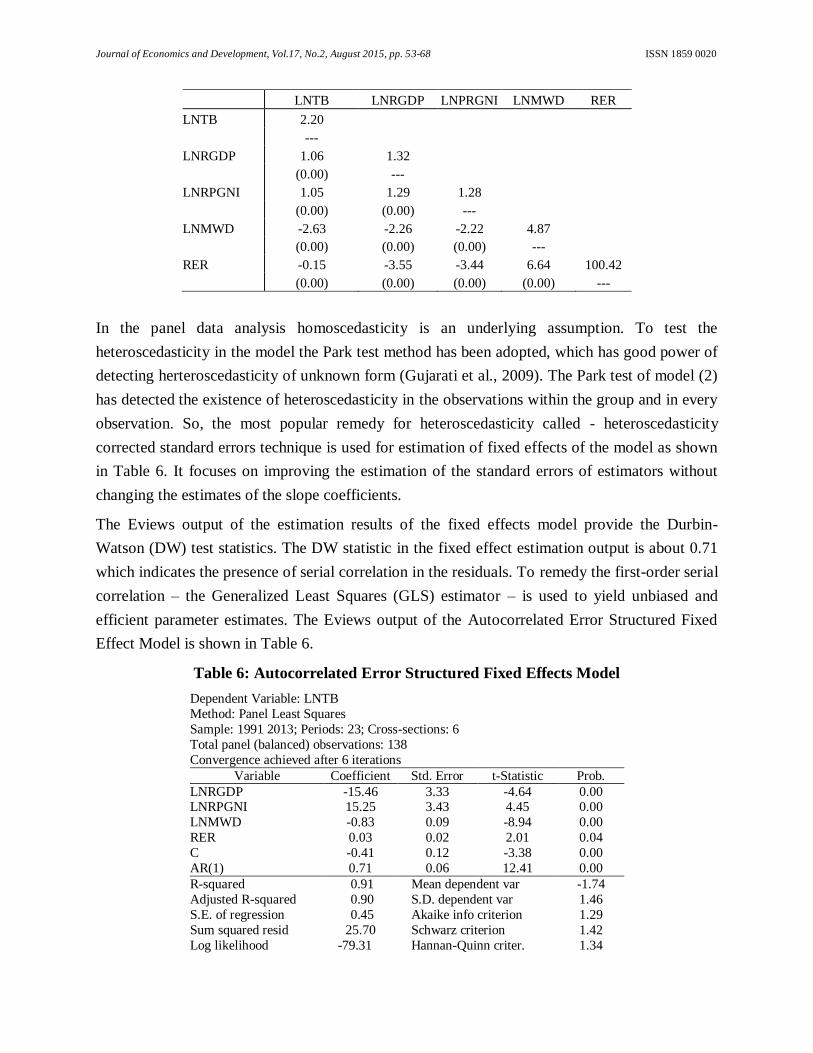
The Eviews output of the estimation results of the fixed effects model provide the Durbin-
Watson (DW) test statistics. The DW statistic in the fixed effect estimation output is about 0.71
which indicates the presence of serial correlation in the residuals. To remedy the first-order serial
correlation – the Generalized Least Squares (GLS) estimator – is used to yield unbiased and
efficient parameter estimates. The Eviews output of the Autocorrelated Error Structured Fixed
Effect Model is shown in Table 6.
Table 6: Autocorrelated Error Structured Fixed Effects Model
Dependent Variable: LNTB
Method: Panel Least Squares
Sample: 1991 2013; Periods: 23; Cross-sections: 6
Total panel (balanced) observations: 138
Convergence achieved after 6 iterations
Variable Coefficient Std. Error t-Statistic Prob.
LNRGDP -15.46 3.33 -4.64 0.00 LNRPGNI 15.25 3.43 4.45 0.00
LNMWD -0.83 0.09 -8.94 0.00
RER 0.03 0.02 2.01 0.04
C -0.41 0.12 -3.38 0.00
AR(1) 0.71 0.06 12.41 0.00
R-squared 0.91 Mean dependent var -1.74
Adjusted R-squared 0.90 S.D. dependent var 1.46
S.E. of regression 0.45 Akaike info criterion 1.29
Sum squared resid 25.70 Schwarz criterion 1.42
Log likelihood -79.31 Hannan-Quinn criter. 1.34

Journal of Economics and Development, Vol.17, No.2, August 2015, pp. 53-68 ISSN 1859 0020
F-statistic 248.49 Durbin-Watson stat 1.88
Prob(F-statistic) 0.00
Inverted AR Roots 0.71
As a rule of thumb, with 132 panel (balanced) observations and only four independent variables,
the DW statistic value is DL=1.679 and DU= 1.788. Computed DW, d =1.884, is greater than
DU= 1.788. Thus there is no evidence of positive first-order serial correlation. In this error
corrected model AR(1) tends to have better behaved standard errors differing slightly causing
different t-scores) and the estimates of the slope coefficients tend to be identical and have similar
signs, depending on the convergence characteristics.
5. Trade balance of Bangladesh - the empirical results
In the present model, the bilateral trade balance of Bangladesh with BRICS countries is used in
the empirical estimation based on different estimation techniques of static panel data analysis. To
test empirically, the intercept term βo is considered to be country-specific and the slope
coefficients are considered to be the same for all countries. The country-specific fixed effects are
reported in Table 7.
Table 7: Country-Specific Effects
Table 8 reports the regression result. The coefficient of relative GDP (RGDP) is negative (-8.14)
and highly significant (p-value is 0.02). This implies that the trade balance of Bangladesh
deteriorates when the GDP of partner countries increases relatively more than that of
Bangladesh. This happens when the GDP of the partner country increases at a higher rate than
that of Bangladesh. This means the partners‟ production and exporting capacity increase at a
higher rate than that of Bangladesh. In bilateral trade, this usually results in more exports to
Bangladesh or fewer imports from Bangladesh, and hence, adversely affects the balance of trade
of Bangladesh.
Table 8: Hetero-Corrected Fixed Effect Model
Dependent Variable: LNTB
Method: Panel Least Squares
Country Effect
Bangladesh 1.70
Brazil -0.80
China -1.64
India -0.22
Russia 0.06
South Africa 0.90

Journal of Economics and Development, Vol.17, No.2, August 2015, pp. 53-68 ISSN 1859 0020
Sample: 1991 2013; Periods: 23; Cross-sections: 6
Total panel (balanced) observations: 138
White cross-section standard errors & covariance (no d.f. correction)
Variable Coefficient Std. Error t-Statistic Prob.
LNRGDP -8.14 3.57 -2.27 0.02
LNRPGNI 7.01 2.59 2.71 0.01
LNMWD -0.73 0.04 -16.07 0.00
RER 0.04 0.02 2.10 0.03
C -2.27 0.77 -2.93 0.00
Effects Specification
Cross-section fixed (dummy variables)
R-squared 0.82 Mean dependent var -1.68
Adjusted R-squared 0.81 S.D. dependent var 1.49
S.E. of regression 0.65 Akaike info criterion 2.05 Sum squared resid 54.46 Schwarz criterion 2.26
Log likelihood -131.66 Hannan-Quinn criter. 2.14
F-statistic 65.08 Durbin-Watson stat 0.59
Prob(F-statistic) 0.00
The coefficient of the relative per capita GNI is positive (7.01) and also highly significant as
expected. Since the per capita GNI is the determinant of the absorption capacity of a country,
the, higher relative per capita GNI (RPGNI) implies a higher absorption capacity of the country.
Due to the increase in absorption capacity, it is expected that the country imports more. Trading
partners of Bangladesh with higher RPGNI relatively import more from Bangladesh, improving
its balance of trade. The relative per capita GNI gives the income differential between country
pairs, denoting the differences in factor endowment between trade pairs. So, from the trade
perspective, the positive sign of this coefficient also indicates that the Heckcher-Ohlin effect9
dominates the Linder effect10
in the case of Bangladesh.
The positive sign of the coefficients of real exchange rate (RER) is consistent with a priori
expectations. The coefficients are highly significant, though their value is low at 0.04. The
positive sign of the coefficient of the real exchange rate (RERij) implies that the more the index
of RERij increase the more there is depreciation of the Bangladeshi Taka (as the exporter‟s
currency) with respect to the currencies of her partners. This will increase the export
competitiveness of Bangladesh and hence will improve her trade balance (TBij).
On the contrary, the negative sign of the coefficients of the import-weighted distance (MWD) is
consistent and highly significant, though their value is at -0.73. The import-weighted distance
(MWDji) as a proxy of transport cost represents an obstacle (or „resistance‟) to trade. The
significant negative value of the coefficient of MWDji indicates that Bangladesh tends to import
relatively more from neighbouring countries than it exports and this results in a negative effect
on her trade balance. But the elasticity of transport cost (proxied by MWDji) is not high (-0.73),
indicating that the trade balance of Bangladesh is not very sensitive to transport cost. The value
of the coefficient -0.73 indicates that when the distance between Bangladesh (country-i) and
Journal of Economics and Development, Vol.17, No.2, August 2015, pp. 53-68 ISSN 1859 0020
partner country (country-j) increases by 1%, the bilateral trade balance, expressed as a ratio of
export to import, decreases by 0.73%.
Table 7 reports the country-specific effects (fixed effects) of White‟s heteroscedasticity corrected
model. The estimates of the country specific effects do not report the standard errors, since
Eviews treat them as nuisance parameters for the purpose of estimation. The reported R-square
and F-statistics of the regression output of Table 8 are based on the difference between the
residuals sums of squares from the estimated model, and sums of the squares from a single
constant-only specification, not from a fixed-effect-only specification. As a result, the
interpretation of these statistics is that they describe the explanatory power of the entire
specification, including the estimated fixed effects reported in Table 7. The R-square is 0.82 and
F-statistics are highly significant, in which the p-value is 0.00. This implies that including
estimated fixed effects, the entire model explains 82 percent of variations in the trade balance.
The autocorrected error structured model of Table 6 also supports the above analysis though the
values of the coefficient are slightly different for explanatory variables. The reason might be that
the estimation drops one observation for each cross-section (country) when performing
autocorrelation correction AR(1) differencing. The magnitude and the sign of the coefficients are
very similar.
6. Summary and conclusions
The analysis shows that the economy of Bangladesh in recent years has improved its growth
performance and strengthened its macroeconomic structure, despite an unfavourable trade
balance position. The factors determining trade in the popular gravity model have effects on the
trade balance model. The trade balance depends on the relative size of a country measured by the
relative GDP, and relative absorption capacity of a country measured by the relative per capita
GNI of the partner countries to the home country. It also depends on the conventional variables
like real exchange rate and import-weighted distance of the partners. Here import-weighted
distance proxies for transportation cost which is more appropriate than the absolute distance in
the gravity model. The static cross country panel data analysis of the bilateral trade balance of
Bangladesh has been the main focus of the study.
In static panel data models, Fixed-Effects estimators are used. Bangladesh‟s trade with her
trading partner BRICS countries over the period from 1991 to 2013 has applied a static panel
data analysis technique. The individual test confirms the existence of individual (country
specific) effects and the Hausman test results suggest that the Fixed Effects Model of panel
estimation is the appropriate model for the study. The coefficients of correlation and covariance
matrix do not detect the existence of multicollinearity of the explanatory variables of the model.
The White's test detected heterscedasticity in the observations within the group and in each
Journal of Economics and Development, Vol.17, No.2, August 2015, pp. 53-68 ISSN 1859 0020
observation. Accordingly, White‟s heterscadasticity corrected covariance matrix estimator,
which is considered as a robust method, is used for estimation of the fixed effects model.
The empirical result shows that the coefficient of relative GDP (RGDPij) is negative and highly
significant, implying deterioration of the trade balance of Bangladesh with the increase in the
relative GDP of partner countries. The significant positive impact of relative per capita GNI
(RPGNIij) implies that an increase in partners' per capita income differential with Bangladesh
improves the trade balance of Bangladesh, since it increases the absorption capacity of the
partners comparatively, inducing them to import more. The positive sign of the coefficient of the
real exchange rate (RERij) implies that an increase in the index of RERij with respect to the
currency of her partner will increase the export competitiveness of Bangladesh and hence will
improve her trade balance (TBij). The significant negative sign of import weighted distance
(MWDji) indicates that the greater the MWDji the lower the trade. The results also provide some
useful insights into the trade balance of Bangladesh and the effects of trade regime change on her
trade balance. The static panel data analysis explores the cross-country variations as well as the
time-invariant country-specific effects on trade balance with heterogeneous economies and finds
significant effects of all relative factors on the trade balance of Bangladesh.
Notes:
1. BRICS -- coined by Jim O'Neill of Goldman Sachs in 2001 in the context of forecasting global economic
trends -- has actually brought together leaders from disparate countries - Brazil, Russia, India, China and
South Africa to form a global alliance of emerging economies.
2. Table-1 shows all data in 2013. Here exports and imports of goods and services (bil. US$) in 2012, and
South Africa in 2011; foreign exchange reserves (bil. US$) in 2012; GDP (current) of South Africa in 2012; per capita GDP (current prices/US$) and growth rate of South Africa in 2011; Trade ratio of goods
and services (%) in 2012; economically active population (%) in 2012; unemployment rate (%) Brazil and
South Africa in 2012.
3. The groups are all classified World Bank member economies. These are: low income, $995 or less; lower
middle income, $996–3,945; upper middle income, $3,946–12,195; and high income, $12,196 or more.
Other analytical groups based on geographic regions are also used. Geographic classifications and data
reported for geographic regions are for low-income and middle-income economies only. Low-income and
middle-income economies are sometimes referred to as developing economies.
4. Relative price is a reasonable assumption for Bangladesh at the aggregate level as the terms of trade (TOT) has moved around 100 for a long time with some deterioration in recent years.
5. The “relative size” of the trading partners determines the export supply and import demand. Since the trade
balance of a country is denoted by the ratio of her exports and imports (Xij/Mij), in bilateral trade the GDP
of country-i relative to her partner country-j has impact on her trade balance. The trade balance can be
expressed as d
ij
s
ijij M
XTB .

Journal of Economics and Development, Vol.17, No.2, August 2015, pp. 53-68 ISSN 1859 0020
6. Data on exchange rates are available in national currency per US dollar for all countries. These rates are
converted into the national currency of all countries in terms of Bangladesh‟s currency, which is per BDT
exchange rate ( ijER ). In measuring ijRER (= 1/ ijER .Pi/Pj), Pi/Pj is proxied by CPIi/CPIj== Real
exchange rate between country-i and country-j.
7. Import-weighted distance: In measuring import-weighted distance between country-i and country-j
( jiMWD ), the weight (Wji) is the ratio of bilateral import volume from respective partners to total import
volume of Bangladesh. jiMWD = ratio of bilateral import volume of country-i and country-j × distance.
8. After operating the analysis in software EViews 7 version, we got a significant result and observing the obtained result we can illustrate the macroeconomic variables in Bangladesh.
9. The proposition of the Heckscher-Ohlin effect is that a country has “comparative advantage” in the
production of that commodity which uses more intensively the country's more abundant factor.
10. Linder hypothesis suggests that, the demand structure in two countries will be similar for the similarities of
per capita income.
References
Anderson, J. (1979), „A Theoretical Foundation for the Gravity Model‟, American Economic
Review, Vol. 69, No. 1, pp. 106.
Anderson, J. E., & Wincoop, E. v. (2003), „Gravity with Gravitas: A Solution to the Border
Puzzle‟, American Economic Review, Vol. 93, No. 1, pp. 170-192.
Bahmani-Oskooee, M. (1991), „Is There a Long-Run Relation Between the Trade Balance and
the Real Effective Exchange Rate of LDCs?‟, Economic Letters, Vol. 36, No. 4, pp. 403-
407.
Bahmani-Oskooee, M. (2001), „Nominal and Real Effective Exchange Rates of Middle Eastern
Countries and their Trade Performance‟, Applied Economics, Vol. 33, No. 1, pp. 103-111.
Bhattacharya, D. & Hossain, S. S. (2006), An Evaluation of the Need and Cost of Selected Trade
Facilitation Measures in Bangladesh: Implications for the WTO Negotiations on Trade
Facilitation, ARTNeT Working Paper Series, No. 9.
BRICS, (2014), Joint statistical publication, Instituto Brasileiro de Geografia e Estatística -
IBGE, - Rio de Janeiro: 2014, Data from BRICS: http://www.itamaraty.gov.br/brics
Deardorff, A. (1997), „Determinants of Bilateral Trade: Does Gravity Work in a Classical
World?‟, The Regionalization of the World Economy, ed. by Jeffrey Frankel. Chicago:
University of Chicago Press.
Gujarati, D.N., Porter, D.C. and Gunasekar, S. (2009), Basic Econometrics, 5th edition, Tata
McGraw Hill Edition.

Journal of Economics and Development, Vol.17, No.2, August 2015, pp. 53-68 ISSN 1859 0020
Hausman, J. (1978), „Specification Test in Econometrics‟, Econometrica, Vol. 46, pp. 1251-
1271.
Hussain, H., Sen, L.K. and Keong, C.C. (2003), „The Impact of Devaluation on Malaysia Trade
Balance‟, Discussion paper, Asia Pacific Environment Conference, Malaysia.
International Monetary Fund (2014), International Financial Statistics (IFS) CD-ROM 2014, Data
from IMF database: www.imfstatistics.org/DOT
Khan, M. Z. S. and Hossain, M. I. (2010), „A Model of Bilateral Trade Balance: Extensions and
Empirical Tests‟, Economic Analysis and Policy, Vol. 40, No. 3, pp. 377-391.
Khan, T.I, Akbar, M.I., and Sadique, M.Z. (2013), „Impact of Trade Cost on Bangladesh‟s Trade
A Gravity Model Approach‟, Prepared for Conference on Empirical Investigations in
Trade and Investment, Phuket, Thailand.
Khan, I. U., & Kalirajan, K. (2011), „The impact of trade costs on exports: An empirical
modeling‟, Economic Modeling, Vol. 28, No. 3, pp. 1341-1347.
Linneman, H. (1966), „An Econometric Study of International Trade Flows‟, North Holland,
Amsterdam.
Matyas, Laszlo. (1997), „Proper Econometric Specification of the Gravity Model‟, World
Economy, Vol. 20, No. 3, pp. 363–368.
Poyhonen, P. (1963), „Toward A General Theory of International Trade‟, Ekonomiska
Samfundets Tidskrift, Tredje serien, Argang, Vol. 16, pp. 69-77.
Kowalski, P. and Bottini, N. (2011), „Comparative Advantage and Export Specialisation
Mobility‟, in Globalisation, Comparative Advantage and the Changing Dynamics of
Trade, OECD Publishing.
Rahman, M. M. (2006), „The Determinants of Bangladesh‟s Trade: Evidences from the
Generalized Gravity Model‟, The Economic Society of Australia‟s 33rd Conference of
Economists 2004, The University of Sydney, Australia.
Rahman, M.M. (2009), „The Determinants of Bangladesh's Imports: A Gravity Model Analysis
under Panel Data‟, Indian Journal of Economics, Vol. XC, No. 357, pp. 773-787.
Roy, M., & Rayhan, M. I. (2011), „Trade Flows of Bangladesh: A Gravity Model Approach.
Economics Bulletin‟, Vol. 31, No. 1, pp. 950-959.
Shepherd, B. (2012), „The Gravity Model of International Trade: A User Guide‟, Bangkok:
UNESCAP.
Thapa, N.B. (2002), „An Econometric Analysis of the Impact of Real Effective exchange Rate of
Economic Activities in Nepal‟, Economic Review: Occasional Paper, Vol. 14, pp. 17-36.

Journal of Economics and Development, Vol.17, No.2, August 2015, pp. 53-68 ISSN 1859 0020
Tinbergen, J. (1962), „Shaping the World Economy: Suggestions for an International Economic
Policy‟, The Twentieth Century Fund, New York.
Wooldridge, J.M. (2006), Introductory Econometrics – A Modern Approach, 3rd
Edition,
Thomson South-Western.
World Bank (2014), World Development Indicators (WDI) CD-ROM 2014, World Bank,
Washington D.C. Data from World Bank database: www.econ.worldbank.org