munich personal repec archive - uni-muenchen.de · munich personal repec archive is islamic stock...
TRANSCRIPT

MPRAMunich Personal RePEc Archive
Is Islamic stock index secured againstinterest rate risk? Evidence fromWavelet analysis
Yasmin Abd Rahim and Mansur Masih
INCEIF, Malaysia, INCEIF, Malaysia
25. June 2015
Online at http://mpra.ub.uni-muenchen.de/65259/MPRA Paper No. 65259, posted 25. June 2015 09:45 UTC

Is Islamic stock index secured against interest rate risk? Evidence from
Wavelet analysis
Yasmin Binti Abd Rahim 1 and Mansur Masih2
Abstract
This research is motivated by the desire to see the difference on interest rate risk exposure
between Islamic and conventional equity across different investment horizons using wavelet
analysis. Seven types of interest rates were tested with FTSE Bursa Malaysia Hijrah Shariah
Index and FTSE Bursa Malaysia KLCI Index using data ranging from 1st March 2007 till 31st
December 2014. The exposure to interest rate risk for both indices was highest at longer term
investment horizon which is between 256 to 512 days; followed by investment horizon between
64-128 days. However, short term investment horizon which is between 2-4 days and 4-8 days
has the lowest exposure to interest rate risk. High correlations between indexes across
investment horizons had been demonstrated empirically. Hence, the hypothesis that an
application of Islamic ethical screen would ‘save’ Islamic finance from interest rate risk is not
accepted.
1 Yasmin Binti Abd Rahim, Graduate student in Islamic finance at INCEIF, Lorong Universiti A, 59100
Kuala Lumpur, Malaysia.
2 Corresponding author, Professor of Finance and Econometrics, INCEIF, Lorong Universiti A, 59100
Kuala Lumpur, Malaysia. Phone: +60173841464 Email: [email protected]

Is Islamic stock index secured against interest rate risk? Evidence from
Wavelet analysis
1.0 Introduction
The modern Islamic finance industry was born since 1960s driven by intention to comply with
Shariah requirements in conducting financial transactions. The last few years witnessed a
tremendous growth in Islamic finance industry. Chong and Liu (2009) reported that Islamic
finance was practiced by more than 50 countries worldwide with the value of Islamic assets
across the globe was about US$250 billion in 2004 and rose to US$700 billion in the year of 2008
duly reported by the Economist. The value of Islamic asset under management further had grown
tremendously in 2014 to US$ 3.5 trillion dollar (Shamsuddin, 2014). Hence, strong evidence of
growing popularity in Islamic finance is justified.
Securities Commission Malaysia reported that the number of shariah compliant securities had
increased from 652 in the year on 2013 to 673 as at 31st December 2014 with total market
capitalisation worth RM 1,012.14 billion representing 61.3 percent to total market capitalisation in
Malaysia.
Revisit the intention to have shariah compliant financial institutions, general guiding principle for
Islamic transactions had been clearly mentioned in the Quran and the hadith. Despite that,
Islamic scholars from the various of school of thought namely mazhab have concede that interest
or usury which translated as ‘excess’ or ‘increase’ is totally banned outright in the Quran. Besides
that, Muslims must avoid financial transaction which highly exposed to uncertainty which is known
as gharar, outright gambling (maysir) and religious forbidden products as well as immoral
activities. Instead, Islamic finance further urged to concentrates its investment in real sector or
industries such as telecommunications, technology, health care, utilities, construction as well as
real estate and engineering.
Therefore, following the guiding principles, theoretically, Islamic Finance is different from
conventional finance because Islamic finance is asset based and asset driven whereas
conventional system is interest based and driven by debt. With this, Islamic market shall not
decouple from conventional counterparts.
In regards to Islamic investment activities, the companies listed in the stock indices had to
undergo two tier of ethical and ratio screenings. Firstly, exclusion of non shariah compliant
companies such as involving in haram product such as pork based, liquor and tobacco, gambling,
entertainment, and conventional financial sector. Secondly, the screens on highly leveraged
company based on financial ratio such as debt to equity ratio. In consequences, Islamic stock
indices are expected to be more resilient to crisis as compared to conventional stock index.
However, it is important to note that restrictions may also deprive Islamic stock from enjoying the
advantages of portfolio diversification. Hence, lead Islamic stock indices to concentrate in certain

sectors only. Therefore, the restriction imposed to Islamic investment activities might overruled
the portfolio diversification theory by Markowitz; thus, leads Islamic product even riskier than
conventional. Kamil et al (2012) investigate the effect of restrictions using compliant and non
shariah compliant sector indices of Malaysia and United States adopting Multivariate GARCH-
DCC. Authors concur with Markowitz portfolio diversification theory when they found that the
exclusion on non Shariah compliant stocks disallow investor of shariah compliant to benefits from
portfolio diversification.
Since Islamic equity in Malaysia need to comply with guidelines duly set up by Securities
Commissions and Shariah Advisory Council (SAC) of Central Bank; hence, we are expecting that
the return in investing in Islamic stock will be more resilient to the changes in interest rate as
compared to the conventional. In other words, the return in investment in shariah compliant stock
will less sensitive towards the changes in interest rates. Inconsistency in theoretical framework as
well as empirical data lead the issue remains unresolved. Therefore, this research is a humbly
attempt to investigate whether the return in Islamic stock index dampen to interest rate risk or
have the same exposure as conventional market at different investment horizon with an
application of wavelet CWT and MODWT.
Malaysia Islamic stock index which represents by FTSE Bursa Malaysia Hijrah Shariah Index
have the same exposure to interest rate risk as per exposure to Malaysia conventional stock
index which is represented by of FTSE Bursa Malaysia KLCI Index across different investment
horizon and across varieties of interest rates. Highly correlations between indexes had been
proved empirically; hence, the hypothesis of application of Islamic ethical screens would ‘save’
Islamic finance is rejected.
The paper is organised as follows: Section 2 provides the literature review. Section 3 details on
the methodology used to study the lead-lag between FTSE Bursa Malaysia Hijrah Shariah Index
and FTSE Bursa Malaysia KLCI Index against few degrees of interest rates as well as the
correlations between these variables. Section 4 analyzes the results and summary while the
implication of the result will be discussed in section 5. Section 6 discussed on the limitation and
suggestions for future research.
2.0 Literature Review
Interest rate is an important macroeconomic variable which generally considered as the cost of
capital. In other words, means the price paid for the use of money for a period of time. From
borrower’s perspective, interest rate is the cost of borrowing money; while, from lender’s point of
view, interest rate is the fee charged for lending money which also known as lending rate. Interest
is forbidden in Islam due to it attempt to create money over money without any counter value to
the contracting party especially when it was calculated on compounded basis (Alam and Uddin,
2009).

Interest rate further becomes concern to people due to several reasons. Firstly, the increase in
interest rates will lead to increment in the interest expense especially to highly leveraged
companies, thus; will reduce in the cash flows available for future dividends. Consequently, leads
to negative impact to the share price of the company. In addition to that, the fluctuations in
interest rates will affect the market value of financial assets and liabilities held by firms. Volatilities
in interest rates also might affect the opportunity cost of equity investment. The higher the interest
rate will make bonds more attractive given their risk-return characteristics, therefore; motivates
investors to adjust their portfolios by buying bonds and selling stocks which lead to depressing
the stock prices. Finally, the changes in interest rates will affect the equity prices via adjusting the
expectations of future cash flow of the company (Moya et al., 2013). Hence, exposure to interest
rate risk should be carefully managed as might lead to a disaster to the company; directly to the
investors.
In relation to this, Chapra (2008) suggests that excessive lending, highly leverage in the system
and the lack of tool and market discipline would leads to global crisis. Author further trust that the
principles in Islamic finance can assist to pave the way for a better discipline into markets and
prevent the occurrence of new crisis.
Despite that, Ahmad (2009) confident that global crisis indicates mismanagement of risk at
institutional, organizational and product level. Therefore, attendant to principles in Islamic finance
might assist in preventing the global crisis from happening.
Theoretical argument had been proof by Moya et al.(2013). Authors tested relationship between
interest rate changes and stock returns in Spain adopting wavelet approach. The result shows
that Spanish stock market has a remarkable degree of exposure to interest rate risk across
industries. Unsurprisingly, they found that heavily indebted industries such as real estate, food
and beverages as well as utilities and banking industries emerge as the most sensitive to interest
rate. Hence, the argument made by Chapra (2008) and Ahmad (2009) shall be considered.
However, Shamsuddin (2014) highlighted that the literature in Islamic banking is vast, but not the
literature in Islamic investment. Despite that, literature in Islamic investment mostly covers on the
performance of Islamic equity indices and mutual funds only. Author did not found any study on
interest rate sensitivity of Islamic stocks; however, considerable attention has been stress in the
literature to study on interest rates exposures to Islamic stocks. Aged literature found pertaining
to this issue; and normally research conducted to examine the relationship between interest rate
changes and financial stock price. Hence, this relationship can be the proxy used as a proxy to
measure interest rate exposure.
Many literatures concurred that interest rates has significant negative relationship with share price.
However, surprising finding for Malaysia that interest rate has no relation with share price but
changes of interest rate has negative relationship with changes of share price (Alam and Uddin,
2009).

Chong and Liu (2009) investigate whether Islamic banking in Malaysia are interest free or interest
based tested using Engle Granger error correction. They found that Islamic deposits are not
interest-free, furthermore, closely to conventional deposits. The changes in conventional deposit
lead to the changes in Islamic investment rates, however, not the other way around. Despite that,
Islamic investment rates are positively correlated to conventional rates in the long term. Based on
these findings, the exposure of Islamic finance to interest rate risk perhaps would be the same as
if in the conventional finance.
Dewandaru et. al (2015) comprehensively analyse the risk return characteristics in Islamic indices
as compared to conventional at different investment horizons via applying wavelet analysis on
Dow Jones indices of 11 countries which is world , Canada, India, Japan, Kuwait, Malaysia, Sri
Lanka Turkey, U.S., U.K., China and GCC including 10 global sectors between the year of 2008
until 2012. Remarkably consistent with Chong and Liu (2009) findings, Dewandaru et al (2015)
conclude that both Islamic and conventional indicates similar tendency in the betas at longer
investment horizon. Since beta indicates the risk; hence, both conventional and Islamic indices
have the same exposure to risk in the longer investment horizon. However, the differences in
betas between Islamic and conventional indices at most of timescales are not statistically
significant.
Krasicka and Nowak (2012) experiment the response of Malaysian Islamic and conventional
security prices towards macroeconomic factors. Again, the Islamic and conventional bond and
equity prices are driven by common factors and the gap between Islamic and conventional
financial practices is weaken.
An attempt made by Ajmi et al. (2014) to examine the eventual link between the Islamic and
global conventional stock markets, and between the Islamic stock market and several global
economic and financial shocks using linear Granger causality and nonlinear Granger. Authors
found that significant linear and nonlinear causality between Islamic and conventional stock
markets. Therefore, Islamic market and their conventional counterparts are not decoupling.
Furthermore, Islamic stock market and interest rates found to have a significant relationship with
interest rates as well as interest-bearing securities. Authors highlighted that the result obtained
was inconsistent with the shariah guiding principle.
Similar findings disclosed by Hammoudeh et. al (2014) which further suggest that the
enforcement to Shariah compliance rules are not restrictive enough as to make the global Islamic
equity market index contrast from conventional indices. Authors further emphasize that
decoupling hypothesis of the Islamic equity universe from conventional financial system is not
supported by their empirical evidence.
Interestingly, Shamsuddin (2014) found that the aggregate portfolio of Islamic stocks is immune
to interest rate risk only at sectoral level, while some Islamic equity portfolios proof to expose to
interest rate risk. However, Shamsuddin (2014) proof that the interest rate risk exposure is less

pronounced among Islamic sector portfolios than that conventional in their mainstream
counterparts. Author is testing Dow Jones Islamic market index from U.S., U.K., Canada, Japan,
Switzerland, Australia, France, Taiwan, Germany, muslim countries and other using ARCH,
GARCH and TGARCH. The result suggests that the changes in long term interest rate and
volatility of the long term interest rate will not influence the return behaviour of the DJ Islamic
Market Index. Hence, concluded that pre-screening methodology is effective to ensure that
aggregate Islamic equity portfolio immune to interest rate movements.
3.0 Methodology
3.1 Wavelet
Financial markets are extremely complex in the system. It consists of thousands of
heterogeneous traders and investor; making decision based on different investment horizon. For
example, big institutional investors like pension fund have long-term investment horizon while
speculator just entered the market for just few days and even for just few minutes! The main
advantages of wavelet is its ability to decompose any signal into time scale components, flexibility
to handle non-stationary data and their capacity to provide an alternative representation of the
variability and association structure between variables according to varies investment horizons.
The sensitivity of stock returns to movements in long-term interest rate is substantially greater
than the sensitivity to changes in short terms rates.
Hence, the application of wavelet to test the exposure of Islamic equity to vary types of interest
rates across different investment horizon will assist investors, portfolio managers, corporate
managers and policy makers to obtain critical information for risk management, asset allocation
as well as for portfolio management or policy decision making.
3.2 Continuous Wavelet Transformation (CWT)
Original time series being mapped in CWT and will representing a function of a variable time-
separate into function of two different variable such as time and frequency. The advantage of
CWT as compared to DWT and MODWT is that the number of time horizons will be generated by
itself according to the length of data. CWT provides two dimensional figure of the correlations;
hence, enables researcher to identify and interpret the patterns. In this research, least
asymmetric wavelet filter of length L=8 denoted by LA (8) based on eight non-zero coefficients
were used.
3.3 Maximal Overlap Discrete Wavelet Transform (MODWT)
The MODWT generally known as stationary wavelet transform. It is highly redundant, non-
orthogonal transform; hence, allow alignment of decomposed wavelet and scaling coefficient at
each level with the original time series. As a result, comparison between the series and it
decomposition can be obtained.
4.0 Results and Discussions
4.1 Data analysis

In this research, the return on FTSE Bursa Malaysia Hijrah Shariah Index is used as a proxy for
the Malaysian Islamic stock index. Whereby, the return in FTSE Bursa Malaysia KLCI Index is
used as a proxy for the Malaysian conventional stock index. Varieties of interest rates such as
Overnight Policy Rate (OPR), KLIBOR one month, KLIBOR two month, KLIBOR three month,
KLIBOR six month, KLIBOR nine month and KLIBOR one year being used to be a proxy for
interest rate risk against Malaysian Islamic stock index. While Malaysian conventional stock index
used as control variable for a comparison purpose, hence; the result would allow identifying
whether Malaysian Islamic stock index or Malaysian conventional stock index exposed more to
interest rate risk. FTSE Bursa Malaysia Hijrah Shariah Index and FTSE Bursa Malaysia KLCI
were chosen in this research as both indices shared a similarity in term of consists of thirty (30)
strongest companies in each indexes. Hence, due to the same underlying principle; research was
expected to be more consistent. Table 1 below lists the variables being considered in this
research.
Table 1 : Selected Variables for Research
Symbol Definition
HJS FTSE Bursa Malaysia Hijrah Shariah index
KCI FTSE Bursa Malaysia KLCI index
OPR Overnight policy rate
KOM KLIBOR one month
KTM KLIBOR two month
KTHM KLIBOR three month
KSM KLIBOR six month
KNM KLIBOR nine month
KOY KLIBOR one year
Daily time series closing price data for both indices as well as interest rates were collected
starting from 1st March 2007 till 31st December 2014. All data are taken from Thomson-Reuters
DataStream database except for Overnight Policy Rate (OPR) which is extracted from Bank
Negara Malaysia website. Table 2 presents some descriptive statistics of the data.
Table 2 : Descriptive Statistics of The Data
Mean Std. Dev. Skewness Kurtosis
Jarque-Bera
Probability Observations
HJS 0.000303 0.008553 -1.257548 20.96218 28003.21 0.000 2043
KCI 0.000196 0.007859 -1.268007 19.46215 23616.54 0.000 2043
OPR -3.86E-05
0.014242 -2.227747 127.9985 1331735 0.000 2043
KOM -2.37E-05
0.007802 -22.18845 677.3544 38878557 0.000 2043
KTM 1.32E-05 0.007455 -24.47687 737.8632 46173532 0.000 2043
KTHM 2.47E-05 0.007038 -25.07165 757.7412 48704147 0.000 2043

KSM 2.44E-05 0.007003 -24.79609 743.7425 46917395 0.000 2043
KNM 2.42E-05 0.007109 -24.65098 736.6739 46027775 0.000 2043
KOY 2.15E-05 0.006899 -24.22874 722.6002 44279691 0.000 2043
Volatility represents by standard deviation. Based on the result, Overnight Policy Rate (OPR)
shows the highest volatility followed by FTSE Bursa Malaysia Hijrah Shariah Index and FTSE
Bursa Malaysia KLCI index; while, the least volatile is KLIBOR one year. The standard deviation
indicates that absolute time independent volatility of the return.
Negative values in skewness for all variables indicate that variables are asymmetric property in
the distributions; hence, leading to lower variability and risk.
Kurtosis represent the fatness of the distributions which finally describe how concentrated the
data are around the mean distribution. From the table 2, kurtosis values are all more than 3;
therefore indicates that all variables are not normally distributed which leads to higher risk.
Jarque – Bera test results shows that all variables are significant; meaning that the non-normality,
variability and higher risk of the return for the variables are further strengthened.
4.2 Exposure of FTSE Bursa Malaysia Hijrah Shariah Index to wide range of interest
rates at different investors’ investment horizons –CWT
Figure 2 until Figure 7 shows the exposure of FTSE Bursa Malaysia Hijrah Shariah to different
types of interest rate at different investment horizon from scale 1 (one day) up to scale of 8
(approximately two market years of 512 days). Vertical axis referred to investment horizon. Scale
1 refers to investment horizon between 2-4 days, scale 2 to between 4-8 days, scale 3 refers to
investment horizon between 8-16 days, scale 4 refers to investment horizon between 16-32 days,
scale 5 between 32-64 days, scale 6 between 64-128 days, scale 7 between 128-256 days and
scale 8 between 256 to 512 days. Time is shown on the horizontal axis in term of the date of
trading tenure. The figure follows a colour code as illustrated on the right ranges from blue to red
represents the correlation between FTSE Bursa Malaysia Hijrah Shariah and selected interest
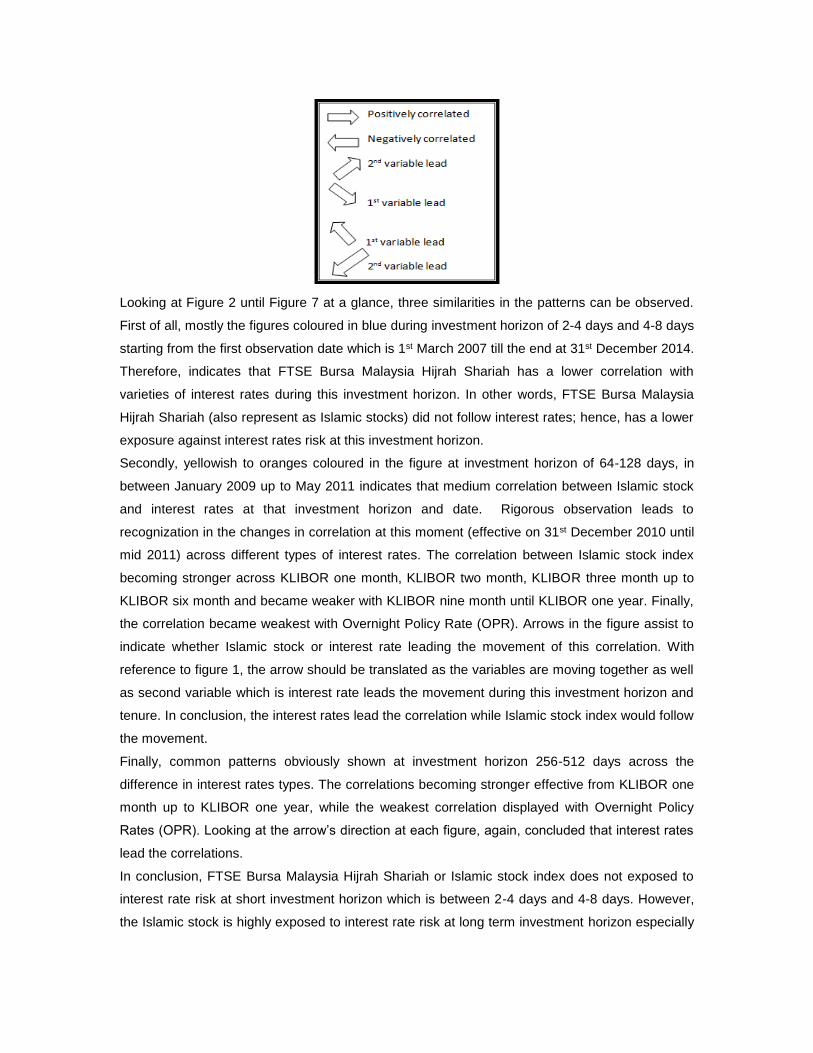
rate. If you eyeball the figure, the direction of arrow would provide the signal of lead-lag
relationship between FTSE Bursa Malaysia Hijrah Shariah and selected interest rate.
Figure 1: Lead-Lag Relationship Indicates By Arrow in CWT
Looking at Figure 2 until Figure 7 at a glance, three similarities in the patterns can be observed.
First of all, mostly the figures coloured in blue during investment horizon of 2-4 days and 4-8 days
starting from the first observation date which is 1st March 2007 till the end at 31st December 2014.
Therefore, indicates that FTSE Bursa Malaysia Hijrah Shariah has a lower correlation with
varieties of interest rates during this investment horizon. In other words, FTSE Bursa Malaysia
Hijrah Shariah (also represent as Islamic stocks) did not follow interest rates; hence, has a lower
exposure against interest rates risk at this investment horizon.
Secondly, yellowish to oranges coloured in the figure at investment horizon of 64-128 days, in
between January 2009 up to May 2011 indicates that medium correlation between Islamic stock
and interest rates at that investment horizon and date. Rigorous observation leads to
recognization in the changes in correlation at this moment (effective on 31st December 2010 until
mid 2011) across different types of interest rates. The correlation between Islamic stock index
becoming stronger across KLIBOR one month, KLIBOR two month, KLIBOR three month up to
KLIBOR six month and became weaker with KLIBOR nine month until KLIBOR one year. Finally,
the correlation became weakest with Overnight Policy Rate (OPR). Arrows in the figure assist to
indicate whether Islamic stock or interest rate leading the movement of this correlation. With
reference to figure 1, the arrow should be translated as the variables are moving together as well
as second variable which is interest rate leads the movement during this investment horizon and
tenure. In conclusion, the interest rates lead the correlation while Islamic stock index would follow
the movement.
Finally, common patterns obviously shown at investment horizon 256-512 days across the
difference in interest rates types. The correlations becoming stronger effective from KLIBOR one
month up to KLIBOR one year, while the weakest correlation displayed with Overnight Policy
Rates (OPR). Looking at the arrow’s direction at each figure, again, concluded that interest rates
lead the correlations.
In conclusion, FTSE Bursa Malaysia Hijrah Shariah or Islamic stock index does not exposed to
interest rate risk at short investment horizon which is between 2-4 days and 4-8 days. However,
the Islamic stock is highly exposed to interest rate risk at long term investment horizon especially

at investment horizon between 64-126 days and 256 to 512 days as interest rates lead the
correlations.
Figure 2: Continuous Wavelet Transform – HJS and KOM
Perio
d
WTC:Hijrah Shariah vs Klibor 1 month
500 1000 1500 2000
4
8
16
32
64
128
256
512
0
0.1
0.2
0.3
0.4
0.5
0.6
0.7
0.8
0.9
1
Figure 3: Continuous Wavelet Transform – HJS and KTM
Perio
d
WTC:Hijrah Shariah vs Klibor 2 month
500 1000 1500 2000
4
8
16
32
64
128
256
512
0
0.1
0.2
0.3
0.4
0.5
0.6
0.7
0.8
0.9
1
Figure 4: Continuous Wavelet Transform – HJS and KTHM
Inv
estm
ent
ho
rizo
n
1/3/07 29/1/09 30/12/10 29/11/11 31/12/14
1/3/07 29/1/09 30/12/10 29/11/11
31/12/14
Inv
estm
ent
ho
rizo
n

Perio
d
WTC:Hijrah Shariah vs Klibor three month
500 1000 1500 2000
4
8
16
32
64
128
256
512
0
0.1
0.2
0.3
0.4
0.5
0.6
0.7
0.8
0.9
1
Figure 5: Continuous Wavelet Transform – HJS and KSM
Perio
d
WTC:Hijrah Shariah vs Klibor 6 month
500 1000 1500 2000
4
8
16
32
64
128
256
512
0
0.1
0.2
0.3
0.4
0.5
0.6
0.7
0.8
0.9
1
Figure 6: Continuous Wavelet Transform – HJS and KNM
Perio
d
WTC:Hijrah Shariah vs Klibor 9 month
500 1000 1500 2000
4
8
16
32
64
128
256
512
0
0.1
0.2
0.3
0.4
0.5
0.6
0.7
0.8
0.9
1
Figure 7: Continuous Wavelet Transform – HJS and KOY
Inv
estm
ent
ho
rizo
n
1/3/07 29/1/09 30/12/10 29/11/11
31/12/14
1/3/07 29/1/09 30/12/10 29/11/11
31/12/14
1/3/07 29/1/09 30/12/10 29/11/11 31/12/14
Inv
estm
ent
ho
rizo
n
Inv
estm
ent
ho
rizo
n

Perio
d
WTC:Hijrah Shariah vs Klibor 1 year
500 1000 1500 2000
4
8
16
32
64
128
256
512
0
0.1
0.2
0.3
0.4
0.5
0.6
0.7
0.8
0.9
1
Figure 8: Continuous Wavelet Transform – HJS and OPR
Perio
d
WTC:Hijrah Shariah vs OPR
500 1000 1500 2000
4
8
16
32
64
128
256
512
0
0.1
0.2
0.3
0.4
0.5
0.6
0.7
0.8
0.9
1
4.3 Exposure of FTSE Bursa Malaysia KLCI Index to wide range of interest rates at
different investor’s investment horizon – CWT
Three identical patterns as discussed in the correlations between FTSE Bursa Malaysia Hijrah
Shariah Index (being proxy for Islamic stock index) and interest rates displayed the same patterns
in the correlations between FTSE Bursa Malaysia KLCI Index (representing conventional stock
index) across the varieties of interest rates shown in Figure 9 till Figure 15.
This is including the lowest correlations between FTSE Bursa Malaysia KLCI Index with respect
to interest rates at investment horizon between 2-4 days and investment horizon between 8-16
days. Thus, the return in investment in FTSE Bursa Malaysia KLCI Index will have slight
exposure to the interest rate risk at this investment horizon.
1/3/07 29/1/09 30/12/10 29/11/11
31/12/14
Inv
estm
ent
ho
rizo
n
1/3/07 29/1/09 30/12/10 29/11/11
31/12/14
Inv
estm
ent
ho
rizo
n

However, the exposure to the interest rate risks getting stronger in the investment horizon 64-128
days across KLIBOR one month till KLIBOR one year as translated by the correlations.
Nevertheless, the correlation between conventional stock index displayed the weakest correlation
with Overnight Policy Rate (OPR). In regards to lead-lag relationship between the conventional
stock index and interest rates, the arrows demonstrate that interest rates leading the movement
of conventional stock index at this moment.
In regards to investment horizon between 256-512 days, getting stronger in the investment
horizon 64-128 days across KLIBOR one month till KLIBOR one year, but very mild correlation
with Overnight Policy Rate (OPR). Again, the arrows indicate those interest rates leading the flow
of conventional stock index at this moment; directly affecting the return on investments.
From the similarities found in the exposure to varieties of interest rates at different investment
horizon, FTSE Bursa Malaysia Hijrah Shariah Index and FTSE Bursa Malaysia KLCI Index is
suspect to have highly correlation, leads to another puzzle.
Figure 9: Continuous Wavelet Transform – KLCI and KOM
Perio
d
WTC:KLCI vs Klibor 1 month
500 1000 1500 2000
4
8
16
32
64
128
256
512
0
0.1
0.2
0.3
0.4
0.5
0.6
0.7
0.8
0.9
1
Figure 10: Continuous Wavelet Transform – KLCI and KTM
Perio
d
WTC:KLCI vs Klibor 2 month
500 1000 1500 2000
4
8
16
32
64
128
256
512
0
0.1
0.2
0.3
0.4
0.5
0.6
0.7
0.8
0.9
1
1/3/07 29/1/09 30/12/10 29/11/11 31/12/14
Inv
estm
ent
ho
rizo
n
1/3/07 29/1/09 30/12/10 29/11/11
31/12/14
Inv
estm
ent
ho
rizo
n

Figure 11: Continuous Wavelet Transform – KLCI and KTM
Perio
d
WTC:KLCI vs Klibor 3 month
500 1000 1500 2000
4
8
16
32
64
128
256
512
0
0.1
0.2
0.3
0.4
0.5
0.6
0.7
0.8
0.9
1
Figure 12: Continuous Wavelet Transform – KLCI and KSM
Perio
d
WTC: KLCI vs Klibor 6 month
500 1000 1500 2000
4
8
16
32
64
128
256
512
0
0.1
0.2
0.3
0.4
0.5
0.6
0.7
0.8
0.9
1
Figure 13: Continuous Wavelet Transform – KLCI and KNM
1/3/07 29/1/09 30/12/10 29/11/11 31/12/14
Inv
estm
ent
ho
rizo
n
1/3/07 29/1/09 30/12/10 29/11/11 31/12/14
Inv
estm
ent
ho
rizo
n

Per
iod
WTC:KLCI vs Klibor 9 month
500 1000 1500 2000
4
8
16
32
64
128
256
512
0
0.1
0.2
0.3
0.4
0.5
0.6
0.7
0.8
0.9
1
Figure 14: Continuous Wavelet Transform – KLCI and KOY
Perio
d
WTC:KLCI vs Klibor 1 year
500 1000 1500 2000
4
8
16
32
64
128
256
512
0
0.1
0.2
0.3
0.4
0.5
0.6
0.7
0.8
0.9
1
Figure 15: Continuous Wavelet Transform – KLCI and OPR
Inv
estm
ent
ho
rizo
n
1/3/07 29/1/09 30/12/10 29/11/11
31/12/14
Inv
estm
ent
ho
rizo
n
1/3/07 29/1/09 30/12/10 29/11/11 31/12/14

Perio
d
WTC:KLCI vs OPR
500 1000 1500 2000
4
8
16
32
64
128
256
512
0
0.1
0.2
0.3
0.4
0.5
0.6
0.7
0.8
0.9
1
4.4 Is FTSE Bursa Malaysia Hijrah Shariah Index exposed more to interest rates risk as
compared to FTSE Bursa Malaysia KLCI Index at different investment horizons?
The similarities in the correlation between FTSE Bursa Malaysia Hijrah Shariah Index (which
represents Islamic stock index) and FTSE Bursa Malaysia KLCI Index (which represents
conventional stock index) to varieties of interest rates even at different investment horizon leads
to unresolved puzzle. Secondly, question rose whether Islamic stock index leads the correlation
or lagging behind conventional stock index?
CWT used to test the correlation between FTSE Bursa Malaysia Hijrah Shariah Index and FTSE
Bursa Malaysia KLCI Index. Result in Figure 16 answered both queries.
First, highly correlations between FTSE Bursa Malaysia Hijrah Shariah Index and FTSE Bursa
Malaysia KLCI Index at all investment horizons explained the similarities in the patterns and
exposure between the indexes against varieties of interest rates.
Secondly, most of the arrows pointed to the right which indicates that the indexes are moving
together. At time investment horizon 256 days, shows that Islamic stock index leads the
movement of conventional stock index.
Based on these results, we might conclude that FTSE Bursa Malaysia Hijrah Shariah Index or
Malaysian Islamic stock index have the same exposure to the interest rate risk as per Malaysian
conventional stock index which represented by FTSE Bursa Malaysia KLCI Index even the
Islamic stocks passed the requirement to be established as Shariah compliant stock; such as not
interest based and lower leverage or debt to equity ratio which expected to be a shield against
highly interest rates risk exposure.
Figure 16: Continuous Wavelet Transform – HJS and KLCI
1/3/07 29/1/09 30/12/10 29/11/11
31/12/14
Inv
estm
ent
ho
rizo
n

Perio
d
WTC:Hijrah Shariah vs KLCI
500 1000 1500 2000
4
8
16
32
64
128
256
512
0
0.1
0.2
0.3
0.4
0.5
0.6
0.7
0.8
0.9
1
4.5 Robustness of research – MODWT Transformation
To further give confidence to results from 4.2 until 4.4, Maximum Overlap Discrete Wavelet
Transform (MODWT) applied to the data. Using the newly generated MODWT return series, the
correlations between FTSE Bursa Malaysia Hijrah Shariah Index vis-à-vis interest rates across
the investment horizon displayed in Table 3 below. Secondly, the correlations of FTSE Bursa
Malaysia KLCI vis-à-vis interest rates shown in Table 4; finally, the correlations of FTSE Bursa
Malaysia Hijrah Shariah Index vis-à-vis FTSE Bursa Malaysia KLCI Index displayed in Table 5.
The results are remarkably consistent with the result obtained in the CWT analysis.
Table 3 : Correlations of FTSE Bursa Malaysia Hijrah Shariah Index vis-à-vis interest rates – MODWT Transformations
Scaling (Days)
KOM KTM KTHM KSM KNM KOY OPR
2-4 0.04 0.04 0.04 0.04 0.04 -0.04 0.01
4-8 -0.03 -0.03 -0.03 -0.03 -0.03 -0.05 -0.03
8-16 0.00 -0.01 -0.01 0.00 -0.01 -0.01 0.02
16-32 0.07 0.08 0.08 0.08 0.07 0.09 0.07
32-64 0.20 0.23 0.23 0.27 0.27 0.27 0.13
64-128 0.33 0.38 0.38 0.34 0.31 0.28 0.28
128-256 -0.04 -0.04 -0.04 0.00 0.01 0.02 -0.07
256-512 -0.85 -0.85 -0.85 -0.86 -0.88 -0.87 -0.80
Table 4 : Correlations of FTSE Bursa Malaysia KLCI Index vis-à-vis interest rates – MODWT
Transformations
Scaling KOM KTM KTHM KSM KNM KOY OPR
1/3/07 29/1/09 30/12/10 29/11/11
31/12/14
Inv
estm
ent
ho
rizo
n

(Days)
2-4 0.05 0.05 0.05 0.05 0.05 -0.04 0.02
4-8 -0.01 -0.01 -0.01 -0.01 -0.01 -0.05 -0.01
8-16 -0.02 -0.03 -0.03 -0.03 -0.03 -0.03 0.02
16-32 0.08 0.09 0.08 0.09 0.08 0.10 0.08
32-64 0.25 0.28 0.30 0.30 0.30 0.29 0.17
64-128 0.36 0.41 0.40 0.37 0.34 0.31 0.32
128-256 0.12 0.12 0.14 0.17 0.19 0.20 0.10
256-512 -0.81 -0.83 -0.84 -0.86 -0.88 -0.88 -0.73
Table 5 : Correlations of FTSE Bursa Malaysia Hijrah Shariah Index vis-à-vis FTSE Bursa
Malaysia KLCI Index – MODWT Transformations
Scaling (Days) HJS-KCI
2-4 0.92
4-8 0.93
8-16 0.93
16-32 0.94
32-64 0.95
64-128 0.95
128-256 0.95
256-512 0.99
4.6 Why FTSE Bursa Malaysia Hijrah Shariah Index highly correlated with FTSE Bursa
Malaysia KLCI Index? Which means, why FTSE Bursa Malaysia Hijrah Shariah Index
(represent Malaysia Islamic stock index) has the same exposure to interest rate risk even
after Shariah screening process? Which restricted on the debt to equity ratio and highly
leverage stocks?
The results obtained in 4.2 until 4.4 and remarkably consistent with MODWT robustness test in
4.5 rose questions. How could this happen to Islamic stock index? Islamic stock index expected
to have a lower exposure to interest rate risks as compared to conventional stock index due to
diligent screening methodology. Similar result obtained by Hassan et. al (2005) which conclude
that the application of Islamic ethical screens do not have an adverse impact on investment
performance.
An attempt to eye ball on the constituents listed in both indexes to seek for answer to this puzzle.
However, due to limitation of data, the comparison at supersector breakdown listed in the indexes,

taking into consideration on the highly exposure sector in the indexes as well as the weightage
being referred to FTSE Factsheet as at 31st March 2015. We found that FTSE Bursa Malaysia
Hijrah Shariah Index own 0.7 percent investment in financial institutions whereas, FTSE Bursa
Malaysia KLCI Index own 31.67 percent in financial services. Hence, the conventional suppose
more exposed toward the changes in interest rate risk. However, revisit the tremendous progress
in financial engineering; conventional markets had been facilitated and allow to fully utilizing
several kinds of hedging tools against risk. Hence, would assist conventional market from highly
affected by any unwanted shock.
Despite that, it is noticed that FTSE Bursa Malaysia Hijrah Shariah Index can be the subset of
FTSE Bursa Malaysia KLCI Index. In other words, constituents in FTSE Bursa Malaysia Hijrah
Shariah Index can be the constituents in FTSE Bursa Malaysia KLCI Index as well. Finally, leads
to highly correlations between these indexes. Therefore, the exclusives of shariah compliant
stock will not be adore by investors.
5.0 Summary of the Results and Policy implications
Malaysia Islamic stock index which represents by FTSE Bursa Malaysia Hijrah Shariah Index
have the same exposure to interest rate risk as per exposed to Malaysia conventional stock index
which is represented by of FTSE Bursa Malaysia KLCI Index across different investment horizon
as well as across varieties of interest rates. Highly correlations between indexes had been proved
empirically; hence, the hypothesis of application of Islamic ethical screens would ‘save’ Islamic
finance from interest rate risk is not accepted.
In this research, the exposure to interest rate risk was highest at long term investment horizon
which is between 256 to 512 days; followed by investment horizon between 64-128 days.
However, short term investment horizon which is between 2-4 days and 4-8 days has the lowest
exposure to interest rate risk.
Investor with long term investment horizon such as pension fund, mutual fund and Tabung Haji is
advisable to engage into derivatives in order to minimize the impact of interest rate risk to their
investment returns.
Regulators shall strengthen Islamic financial system via facilitating the best armor in order to
combat with de trop possessions. Despite that, regulators shall recognize the benefit of large
diversifications to the investor; without violating shariah rules. Therefore, the advantages of
Islamic Finance as compared to conventional finance will be recognized and appreciate across
the globe.

6.0 Limitations / Suggestions for Future Research
The analysis in this paper mainly empirical in nature and more economic explanations in regards
to highly correlations between Islamic and conventional stock index is needed.
The breakdown in the constituents in the indexes as well as the weightage shall be observed as
the constituent will be changing on semi annually basis. With this information, more explanations
might be provided to investors regards to the exposure of the indexes to the interest rate risk.
Finally, lead to more appropriate decision made by investors whom have a different
investment horizon.

7.0 References
Ahmed, H. (2009). Financial crisis risks and lessons for Islamic Finance. ISRA
International Journal of Islamic Finance 1, 7-32
Ajmi, A. N., Hammoudeh, S., Nguyen, D. K., & Sarafrazi, S. (2014). How strong are the causal
relationships between Islamic stock markets and conventional financial systems?
Evidence from linear and nonlinear tests. Journal of International Financial Markets,
Institutions & Money 28, 213-227
Alam, M. M., & Uddin, M. G. S., (2009). Relationship between interest rate and stock price:
Empirical evidence from develop and developing countries. International Journal of
Business and Management 3, 43-51
Chong, B. S., & Liu, M. H., (2009). Islamic Banking: interest-free or interest-based? Pacific Basin
Finance Journal 17, 125-144
Dewandaru, G., Bacha, O. I., Masih, A. M. M., & Masih, R. (2015). Risk-return characteristics of
Islamic equity indices: Multi-timescales analysis. Journal of Multinational Financial
Management 29, 115-138
Hammoudeh, S., Mensi, W., Reboredo, J. C., & Nguyen, D. K., (2014). Dynamic dependence of
the global Islamic equity index with global conventional equity market indices and risk
factors. Pacific-Basin Finance Journal 30, 189-206
Hassan, A., Antonious, A., & Paudyal, D.K. (2005). Impact of ethical screening on
investment performance: the case of the Dow Jones Islamic Index. Islamic
Economies Studies 12 (2), 67-97, 13(1)
Kamil, N. K. M., Bacha, O. I., & Masih, A. M. M (2012). Do ’sin stocks’ deprive islaic stock
portfolios of diversification? Some insight from the use of MGARCH-DCC. Capital Market
Review 20, 43-64
Krasicka, O., & Nowak, S. (2012). What’s in it for me? A primer on differences between
Islamic and conventional finance in Malaysia. Journal of Applied Finance and
Banking 2(2), 149-175
Moya, P. M., Lapena. R. F., & Sotos, F. E.(2013). Relationship between interest rate changes
and stock returns in Spain: A wavelet-based approach. Working paper.
Shamsuddin, A. (2014). Are Dow Jones Islamic equity indices exposed to interest rate risk?.
Economic Modelling 39, 273-281