munich personal repec archive - uni-muenchen.de · munich personal repec archive ... (nestle Â...
TRANSCRIPT
MPRAMunich Personal RePEc Archive
Effect of Branded Components onConsumer Perception of Quality andBrand Preference
Ali Raza and Emadul Karim and omair abbas and Prof. Dr.
Shair Sultan and Syed Waqarul Hasan
Khadim Ali Shah Bukhari Institute of Technology (KASBIT),Karachi, Greenwich University, Karachi, Greenwich University,Karachi, Greenwich University, Karachi, Greenwich University,Karachi
6 February 2013
Online at https://mpra.ub.uni-muenchen.de/75463/MPRA Paper No. 75463, posted 8 December 2016 14:53 UTC

1
Effect of Branded Components on Consumer Perception of
Quality and Brand Preference
Ali Raza*, Emadul Karim**, Omair Abbas***, Prof. Dr. Shair Sultan**** and Syed Waqarul Hasan*****
ABSTRACT
The reason for conducting this study was to determine the effect of branded components on
consumer perception of quality and brand preference. The continual determination of firms to survive and grow in a competitive market space has led marketers to gradually turn towards brand associations - a marketing approach that brings together a couple of different trademarks to work in partnership to market a product. The primary motivating factor for implementing this form of component branding, is it’s support to the primary brand to progress on facets such as distribution accessibility, assists in its differentiation from the products of other producers, and augments the capital of the primary brand by sending out a positive image to consumers of the combined product offering the individual benefits of each brand in one package. More recently, a vast majority of empirical studies which focus on such alliances and trademarked components have been conducted. In another study which sought answers as to the effects of a trademarked component on appraisals of a primary brand, the introduction of an eminent labelled component resulted in favorable product assessments of the unknown as well as the well-known primary brands, more so in cases where an unknown branded component was present. The reliance on survey method has been adopted in this research to investigate this very phenomenon. The research design has been formulated in such a manner that it allows researchers of the study to isolate causes and effects. Whereas primary data has been collected from the research sample through the use of questionnaires, the secondary data has been carefully extracted from various researches, marketing journals, and research articles carried out on this subject. It is recommended that in order to have branded computers made available in the market, the government should lower down the current tariffs and promote the import of such IT components so that IT industry may grow in Pakistan and at all levels high tech computing machines could be introduced. Keywords: Branded Components, Consumer Perception, and Brand Preference
INTRODUCTION Brands constitute a significant informational role for buyers of that product. Low and Fullerton
(1994), in their various studies researching the history of the growth of brands, concluded that trademarked products gave a chance to purchasers of assigning a particular identity to it. Further exploration into this subject has also concluded that as soon as a product available in the market launched a new iteration, the buyers ended up assigning it a worth based on their perceptions of it (in relation to the primary product) in order to make evaluations of the new product (Aaker and Keller, 1990). These additions can sometimes prove to be advantageous as they decrease the price of introducing the latest offering in the market, and increase the likelihood of these introductions being successful. Similarly, an extension which fails in the market can end up hurting the manufacturer due to the negative perceptions spawned via such a failure (Aaker,1996).
*Student of Khadim Ali Shah Bukhari Institute of Technology (KASBIT), Karachi **Assistant Professor at Greenwich University, Karachi ***Student of Greenwich University, Karachi ****Director Quality Enhancement cell (QEC), Greenwich University, Karachi *****Assistant Director Quality Enhancement cell (QEC), Greenwich University, Karachi

2
Managers have taken keen interest to understand whether these extensions play a part in contributing towards an existing brands’ equity, more so if brand or line extensions are taken into context. A great deal of studies have been conducted on component or co-branding of nationally owned brands (Park et al., 1996, McCarthy and Norris, 1999), but the effect of co-branding them to a private component hasn’t yet been investigated. Although some studies investigating the broadening role for privately owned labels concluded that producers of national labels could benefit from the introduction of privately owned premium brands, they remain limited in scope for not being able to determine the effects of these national brands partnering with private labels as components. (Narasimhan, 1999). However, private brands taking advantage through nationally branded components (Nestle  chocolate with Kroger brand cookies), have begun to appear more recently in literature (McCarthy and Norris, 1999).
For a company to be successful in the present day and age, the brand image has become vitally important, attracting widespread attention from researchers in the past few decades. Towards the late 1980's, brand managers seeking ways to build lasting brands increasingly learned of the concept of brand equity. As a result of this, higher-ups in the management realized the importance of this concept and brands increasingly came to be viewed as strategic assets. Various researchers of brand management in the recent past have also begun to emphasize the strategic importance created by a well-known brand. (Kapferer, 1997; Urde, 1997; Melin, 1997; Aaker, 1991, 1996; de Chernatony & McDonald, 1998; Keller, 1998)
The problem existing in the branded product has two components that are consumed jointly. Furthermore, each component can be either a brand name or "un- branded." The consumer has no control across the option of the components in the bundle; the seller decides what form of brand components (i.e., branded, or un-branded) to offer. We assume that the product that is marketed eventually relishes a monopoly. Therefore, the research questions are given as under:
Research Questions: The main research questions were: 1. Do brand components have an influence on consumer perception? 2. Does increase in consumer perception of quality result in an increase in brand preference? 3. Does a difference exist between the consumer perception of quality and their brand
preferences?
Objectives of the study: This study was carried out under the following specific objectives: • To understand whether there is a link between the brand components on consumer
perception. • To investigate whether increase in consumer perception of quality do increase in brand
preference. • To understand the existence of a difference in a buyer’s perception of quality, and their brand
preference.
3
Hypotheses: H1: A relationship exists between brand components and consumer perception. H2: Increase in consumer perception of quality results in an increase in brand preference. H3: A difference between the consumer perception of quality and brand preferences exists.
LITERATURE REVIEW
In recent times, various empirical studies have been conducted that shed light on brand
alliances and branded components. One of these was a taste-test study which was conducted to examine the influence of a labeled component on a primary product. Levin et al. (1996) concluded the addition of a reputable product led to better evaluations by buyers of the commodity for both the lesser known as well as the noteworthy primary product, but not as much with a lesser known primary product. In a similar study on a well-known raisin brand, Vaidyanathan et al. (1999) concluded that its addition to a fake brand of raisins led to an improvement in both the perceptive quality and attitudes of the consumers concerning the product. Although the findings of each study is significant in its own right, the limiting factor in both is the scope, whereby both studies made use of atleast one primary or complementary product which was fake. So the question of whether buying a well known product with another equally well known complementary product yield better results in the eyes of the customer, compared to just buying the primary brand remains unanswered. Rao et al. (1997), taking into consideration the effects brand alliances have on buyer perceptions, conducted further studies to examine whether a brand alliance leads to an unobservable increase in the product’s value in the minds of the consumers, when this could not have been achieved by the brand itself.
Brand alliances where firms link together by means of their products or other areas such as
marketing with other firms or brands, is called component or complementary branding, as stated by Desai and Keller (2002). A single part of a product produced by the host firm is signified as the component brand. Consumers rate such co-branded products more favorably, and it leads to improvement in the integrity of the primary product. This also yields the component brand with increased bargaining power and greater consumer awareness.
Since studies show that an individual’s perception of a product experience is largely influenced by any information provided prior to the experience, such as advertisement or word of mouth, branded components are able to effect buyer evaluations as well as their perceptions of taste as a result. (Hoch and Ha, 1986; Deighton, 1984; Levin and Gareth, 1988). As such, if the branded components increase quality perceptions, consumers further evaluate and perceive the product as superior. Consumers are more likely to purchase products or indicate higher reservation prices (the maximum price they are willing to pay) for products with branded components, due to the fact that buyers prefer higher quality products.
When a customer buys a product, they are not only buying the physical aspects of that good such as utility, function, and performance, but also its intangible aspects such as the image and status associated with it (Terpstra and Sarathy, 1997). As such, there are more implications associated with customer merchandise than their evident utility, function, and commercial significance (Mick, 1986). (Elliot, 1997), concluded in his study that “Buyers don’t consume products for their material utilities, but consume the symbolic meaning of those products as

4
portrayed through their perceptions of it”. It is safe to say therefore, that the purchased products are not only physical commodities featuring a set of benefits to the consumer, but also carry intangible symbolic connotations that are based on their perceptions of it. As such, it can be said that there is a greater probability for consumers to buy a product if they identify with its image or it matches with the beliefs / values of a sub-group. (Markus and Kitayama, 1991)
This fact was proven in another study conducted by Bhat and Reddy (1998), which concluded that branded products hold a symbolic value for buyers. This symbolic value attached to products and stemming from its image, is frequently disseminated via the continual purchase or consumption of these brands. As a result, it indicates the existence of a significant connection between not only brand images and their own symbolic importance, but also their ability to signify the consumers’ own value-set or personal image. This means that Individuals who believe that a brand whose personality intimately matches their own are more likely to buy that product, than if the opposite was true. In the same manner, when consumers select some brands over others, it is a subconscious way for them to express themselves, since they visualize their personalities to be consistent with the one associated with the brand (Aaker, 1999).
METHODOLOGY
The research design allows researchers to isolate causes and effect, and determines the effect
of several marketing variables on further variables. The variable causing the change is the independent variable, while the one which is being altered as a result is the dependent variable.
This research utilizes two different sets of data, that is, primary and secondary data. Secondary
data has been collected through marketing journals, former research articles and studies, while primary data has been collected from the research sample by means of the questionnaire.
The questionnaire has been used as the primary instrument for the purpose of data collection
from the sample. The answers were then analyzed and evaluated through various statistical tests for the purpose of this research.
The sample population selected for this research includes students of Greenwich University,
as well as staff members. The appropriate sample size was chosen through a sample size calculator out of the Greenwich University population that included both staff members and students numbering 50 individuals.
DATA ANALYSIS, FINDINGS, AND DISCUSSION
H1: There is a relationship between the brand components on consumer perception .
Z Test of Hypothesis for the Mean
Data
Null Hypothesis = 3
Level of Significance 0.05
Population Standard Deviation 0.066326531
Sample Size 50
Sample Mean 0.928571429

5
Intermediate Calculations
Standard Error of the Mean 0.009379988
Z Test Statistic -220.834887
Two-Tailed Test
Lower Critical Value -1.959963985
Upper Critical Value 1.959963985
p-Value 0
Reject the null hypothesis
The Null hypothesis is rejected because the value of P=0 which is lesser than 0.05 (Level of significance) therefore it concludes that null hypothesis is rejected and alternative accepted. H2: Increase in consumer perception of quality results in an increase in brand preference.
Z Test of Hypothesis for the Mean
Data
Null Hypothesis = 3
Level of Significance 0.05
Population Standard Deviation 0.913469388
Sample Size 50
Sample Mean 3.971428571
Intermediate Calculations
Standard Error of the Mean 0.12918408
Z Test Statistic 7.519723589
Two-Tailed Test
Lower Critical Value -1.959963985
Upper Critical Value 1.959963985
p-Value 5.4845E-14
Reject the null hypothesis
The Null hypothesis is rejected because the value of P=0 which is lesser than 0.05 (Level of significance) therefore it concludes that null hypothesis is rejected and the alternative accepted.

6
H3: A direct relationship exists between the consumer perception of quality and brand preferences.
Z Test of Hypothesis for the Mean
Data
Null Hypothesis = 3
Level of Significance 0.05
Population Standard Deviation 0.7804
Sample Size 50
Sample Mean 4.14
Intermediate Calculations
Standard Error of the Mean 0.110365226
Z Test Statistic 10.32934047
Two-Tailed Test
Lower Critical Value -1.959963985
Upper Critical Value 1.959963985
p-Value 0
Reject the null hypothesis
The Null hypothesis is rejected because the value of P=0 which is lesser than 0.05 (Level of significance) therefore it concludes that null hypothesis is rejected and alternative accepted.
Statistics
Better Computer
N Valid 50
Missing 0
Better Computer
Frequency Percentage Valid Percentage
Cumulative
Percentage
Valid Intel 49 98.0 98.0 98.0
Unbranded 1 2.0 2.0 100.0
Total 50 100.0 100.0
7
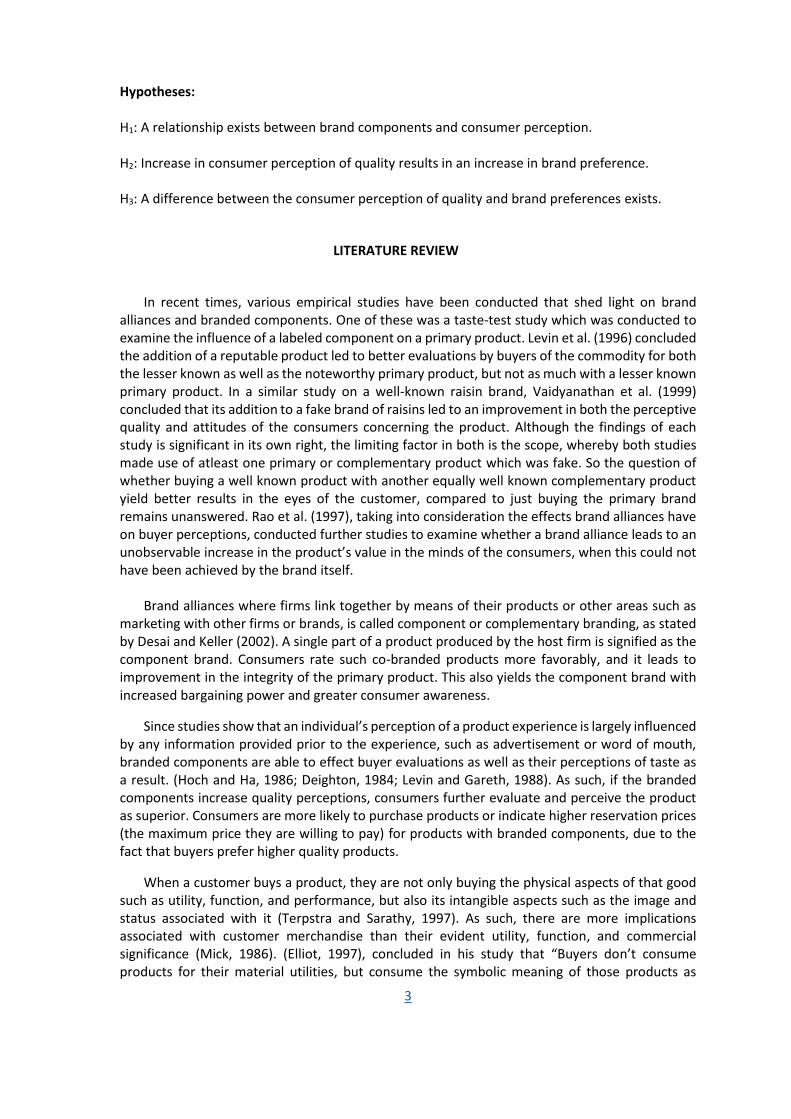
Statistics
Brand of Processor
N Valid 50
Missing 0
Brand of Processor
Frequency Percentage Valid Percentage
Cumulative
Percentage
Valid Yes 49 98.0 98.0 98.0
No 1 2.0 2.0 100.0
Total 50 100.0 100.0
8
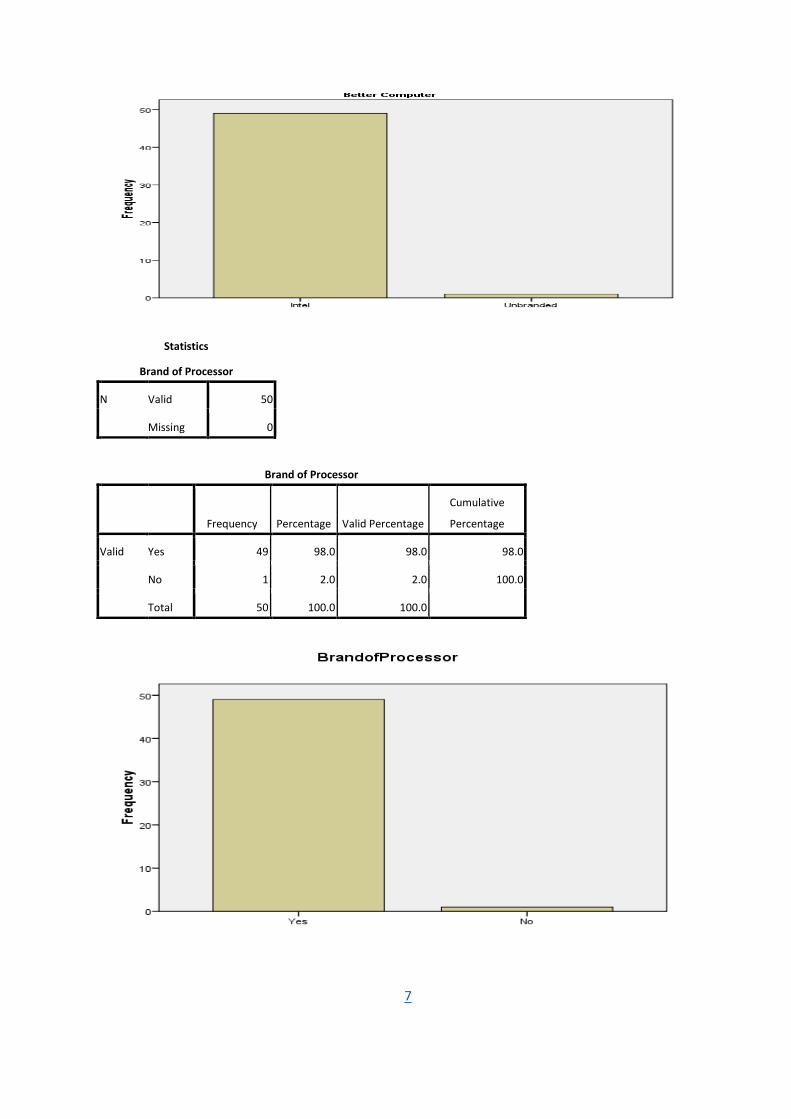
Statistics
Switching Brand
N Valid 50
Missing 0
Switching Brand
Frequency Percentage Valid Percentage
Cumulative
Percentage
Valid Yes 29 58.0 58.0 58.0
No 21 42.0 42.0 100.0
Total 50 100.0 100.0
Statistics
Price
N Valid 50
Missing 0
Price
Frequency Percentage Valid Percentage
Cumulative
Percentage
Valid Intel 48 96.0 96.0 96.0
Unbranded 2 4.0 4.0 100.0
Total 50 100.0 100.0

9
Statistics
Gender
N Valid 50
Missing 0
Gender
Frequency Percentage Valid Percentage
Cumulative
Percentage
Valid Male 37 74.0 74.0 74.0
Female 13 26.0 26.0 100.0
Total 50 100.0 100.0

10
Statistics
Age
N Valid 50
Missing 0
Age
Frequency Percentage Valid Percentage
Cumulative
Percentage
Valid 16-23 29 58.0 58.0 58.0
32-39 21 42.0 42.0 100.0
Total 50 100.0 100.0
11
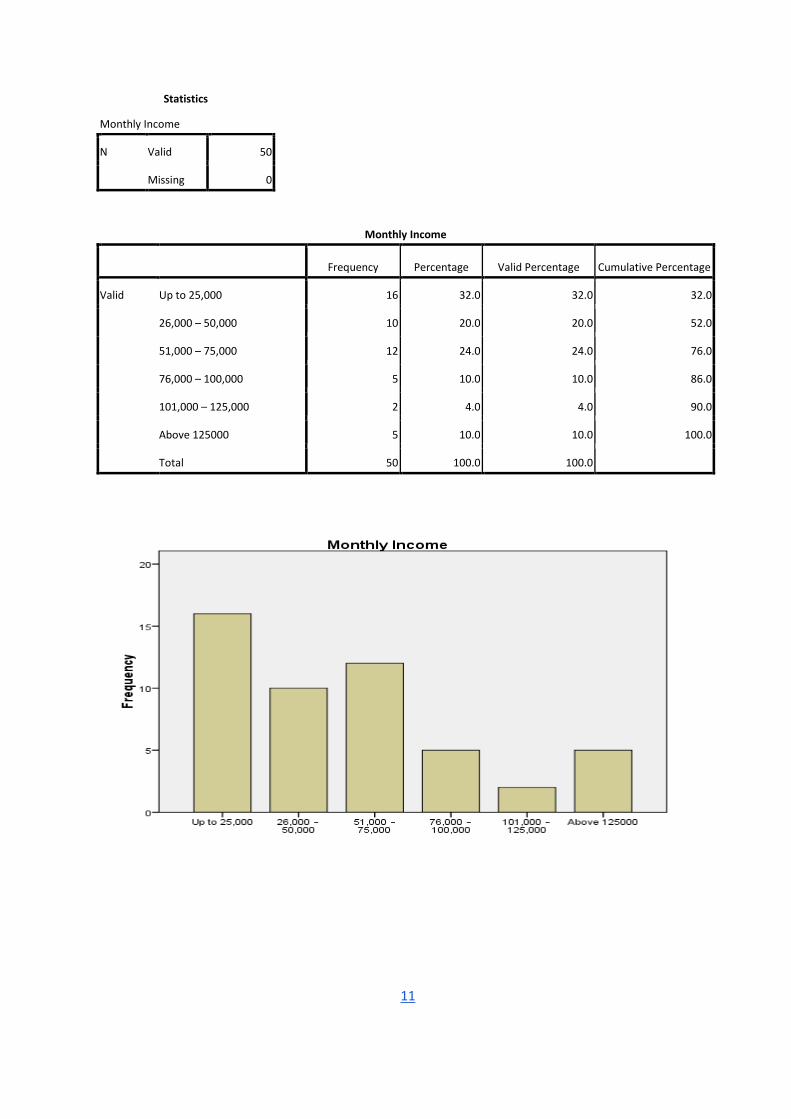
Statistics
Monthly Income
N Valid 50
Missing 0
Monthly Income
Frequency Percentage Valid Percentage Cumulative Percentage
Valid Up to 25,000 16 32.0 32.0 32.0
26,000 – 50,000 10 20.0 20.0 52.0
51,000 – 75,000 12 24.0 24.0 76.0
76,000 – 100,000 5 10.0 10.0 86.0
101,000 – 125,000 2 4.0 4.0 90.0
Above 125000 5 10.0 10.0 100.0
Total 50 100.0 100.0

12
CONCLUSION
Although there are many factors that greatly influence consumer perception of quality and brand preference, especially with regard to computers, a few are not considered to be as important or relevant when taking account of consumer’s perception of quality generally. I recommended that in order to have branded computers made available in the market, the government should lower the current tariffs and promote the import of such IT components so that IT industry may grow in Pakistan and at all levels high tech computing machines could be introduced. Most of the companies put such elements in their products, which hit directly on consumer’s mind. The research shows that brand components will have a significant impact on consumer perception and consumer will prefer those brands, which have branded components. The research has been conducted in which the purpose was to find out the impact of brand components on the quality and brand preference. Close-ended questionnaire was developed and filled by the general consumers. The correlation statistics was applied in which the results were found significant. The results show that a positive correlation exists between brand components and brand preference, however a negative correlation exists between brand components and the switch. Based on the results, we can conclude that there is a significant impact of brand components on brand preference and perception of quality.

13
REFERENCES
Aaker, D.A., Keller, K.L (1990), "Consumer evaluations of brand extensions", Journal of Marketing, Vol. 54 pp.27-41.
Aaker, J.L. 1999. The malleable self: the role of self-expression in persuasion. Journal of Marketing Research, 36(1), 45-57. Allison, R, Uhl, P (1964), "Effect of brand identification on perception of product quality", Journal of Marketing Research, Vol. 1 pp.36-9. Bellizzi, J.A., Martin, W.S. (1982), "The influence of national versus generic branding on taste perceptions", Journal of Business Research, Vol. 10 pp.385-96.
Bhat, S. & Reddy, S. K. 1998. Symbolic and functional positioning of brands. Journal of Consumer Marketing, 15(1), 32-43.
Deighton, J. (1984), "The interaction of advertising and evidence", Journal of Consumer Research, Vol. 11 pp.763-70. Desai, Kalpesh K. and Kevin L. Keller (2002), “The Effects of Component Branding Strategies on Host Brand Extendibility,” Journal of Marketing, 66(1), 73-93. Dodds, W.B, Monroe, K.B., Grewal, D (1991), "Effects of price, brand, and store information on buyers’ product evaluations", Journal of Marketing Research, Vol. 28 pp.307-19.. Elliott, R. 1997. Existential consumption and irrational desire. European Journal of Marketing, 31(3/4), 285-96. Ericksen, M.K. 1996. Using self-congruity and ideal congruity to predict purchase intention: a European perspective. Journal of Euro-Marketing, 6(1), 41-56. Fisher, L.M. (1994), "Pentium flaw creates confusion for PC buyers", New York Times, pp.C1, C6. Graeff, T.R. 1996. Using promotional messages to manage the effects of brand and self-image on brand evaluations. Journal of Consumer Marketing, 13(3), 4-18.
Hileman, B (1996), "Smoldering aspartame controversy reignites", Chemical and Engineering News, Vol. 74 pp.10.. Hite, C.F., Hite, R.E., Minor, T (1991), "Quality uncertainty, brand reliance, and dissipative advertising", Journal of the Academy of Marketing Science, Vol. 19 pp.115-21.

14
Hoch, S.J., Ha, Y.H. (1986), "Consumer learning: advertising and the ambiguity of product experience", Journal of Consumer Research, Vol. 13 pp.221-33. Holt, D.B. 1995. How consumers consume: a typology of consumption practices. Journal of Consumer Research, 22(June), 1-15. Jacoby, J., Olson, J.C., Haddock, R.A (1971), "Price, brand name, and product composition characteristics as determinants of perceived quality", Journal of Applied Psychology, Vol. 55 pp.570-9. Jamal, A. & Goode, M. 2001. Consumers and brands: a study of the impact of self-image congruence on brand preference and satisfaction. Marketing Intelligence & Planning, 19 (7), 482-492. Keller, K.L (1993), "Conceptualizing, measuring, and managing customer-based brand equity", Journal of Marketing, 1-22, Vol. 57. Keller, Kevin Lane and David A. Aaker (1992), “The Effect of Sequential Introduction of Brand Extensions,” Journal of Marketing Research, 29(1), 35-50.