municipal consolidation and local...
TRANSCRIPT

Hitotsubashi University Repository
Title
Municipal Consolidation and Local Government
Behavior: Evidence from Japanese Voting Data on
Merger Referenda
Author(s) Miyazaki, Takeshi
Citation
Issue Date 2013-05
Type Technical Report
Text Version publisher
URL http://hdl.handle.net/10086/25675
Right

Discussion Paper Series A No.588
Municipal Consolidation and Local Government Behavior:
Evidence from Japanese Voting Data on Merger Referenda1
Takeshi Miyazaki
(Department of Economics, Kyushu University)
May 2013
Institute of Economic Research
Hitotsubashi University
Kunitachi, Tokyo, 186-8603 Japan

1
Municipal Consolidation and Local Government Behavior: Evidence from Japanese Voting Data on Merger Referenda1
Takeshi Miyazaki2,3
Department of Economics, Kyushu University, Fukuoka, Japan 6-19-1 Hakozaki, Higashi-ku Fukuoka 812-8581 Japan
May 2013
Abstract The empirical literature investigating the role of key features of local governments regarding decisions on consolidation tends to use a dummy that takes 1 if adjacent local governments decide to merge. Under the estimation method, it is difficult to identify which governments have no incentive to merge. The current study presents an empirical test of decision on consolidation using voting data from Japanese local referenda that distinctively identify the preferences of specific individual municipalities. I find evidence that municipalities that could enjoy large economies of scale from a merger prefer consolidation, and large and small municipalities are likely to merge. Key words: Boundary reform, economics of scale, local referenda, median voter model, municipal consolidation JEL classification: H11, H76, H77
1 I would like to thank Ben Lockwood, Katsuyoshi Nakazawa, Masashi Nishikawa, and the seminar participants at the 67th Congress of the International Institute of Public Finance (IIPF) held at Ann Arbor, Michigan, from August 7 through 11, 2011, the 2011 Japanese Economic Association Spring Meeting at Kumamoto Gakuen University, the seminar at Doshisha University, and the 67th meeting of the Japanese Institute of Public Finance at Shiga University, for their helpful comments. 2 Tel.: +81-(0)92-642-4272, Fax: +81-(0)92-642-4272, E-mail: [email protected]. 3 This work was supported by the JPSP Grant-in-Aid for Young Scientists (B) 22730256 and Joint Usage and Research Center, Institute of Economic Research, Hitotsubashi University.

2
I. Introduction
For a period after World War II, comprehensive boundary reforms took place in several European countries, including Sweden, Norway, Denmark, and West Germany. In Sweden, for example, the number of local governments decreased from 2,500 in 1950 to fewer than 300 today through two major boundary reforms. Voluntary consolidation of municipalities also occurred in Japan, where the number of municipalities dropped dramatically from 3,232 to 1,719 between March 31, 1999, and January 1, 2012. It is stated in the literature that consolidation likely improves administrative and financial efficiencies through economics of scale in the production of local public services. Unfortunately, however, consolidation also increases costs for diverse minority populations under a framework of Tiebout sorting (e.g., Alesina and Spolaore, 2003). A vast amount of theoretical work has investigated endogenous boundary reform and consolidation. Most theoretical studies have focused on the trade-off between the efficiency of large municipalities and the loss of unitary provision of local public goods (e.g., Alesina and Spolaore, 1997; Bolton and Roland, 1997). The costs and benefits of decentralization were first formalized by Oates (1972). Several more recent studies have developed an explicit model of governmental behavior to overcome the problem of uniform provision under centralization (e.g., Besley and Coate, 2003; Lockwood, 2002). Besides, Ellingsen (1998) formalized the trade-off between internalization of interjurisdictional externalities and costs to ignore minority preference, showing that regardless of distribution of taste, small regions are less likely to integrate with large regions to avoid losing a chance to free ride. Dur and Staal (2008) also used a typical median voter model to show the importance of size effects in the choice of integration or separation, and transfer from the central government. These predictions provided by theoretical models have been tested in several empirical models. The literature finds evidence for trade-off between scale economy and heterogeneity of preference, particularly with respect to income and race (e.g., Alesina, Baqir, and Hoxby, 2004; Alesina and Spolaore, 2003; Austin, 1999; Brasington, 1999, 2003a, 2003b; Gordon and Knight, 2009; Nelson, 1990; Sorensen, 2006).4 These empirical studies employed a discrete choice model to investigate the role of economics of scale, heterogeneous preference, and tax base gains in merger decisions. A dependent 4 Several works have reported the role of key features influencing municipal consolidation in Japan, including size of population and area, fiscal conditions, and heterogeneity of income (e.g., Hirota, 2007; Miyashita and Nakazawa, 2009; Miyazaki, 2006; Nishikawa, 2002; Weese, 2008).

3
variable of the models is a consolidation dummy that takes 1 for merging jurisdictions and 0 if at least one of two or more jurisdictions chooses separation, implying the difficulty of identifying which jurisdictions prefer separation if the dummy takes 0. To avoid the drawbacks associated with this difficulty, Austin (1999) and a series of papers by Brasington (1999, 2003a, 2003b) estimated by a bivariate probit model developed by Poirier (1980) or a similar model. Gordon and Knight (2009) developed a simulation-based estimator derived from a calculation of the probability of a merger in matching games. Still, the less informative nature of data on individual preference in consolidation continues to gives rise to a difficulty in rigorous estimation of local government behavior. For example, Meng and Schmidt (1985) found the cost of the partial observability model to be high. This paper uses Japanese voting data from local referenda that distinctly identify the preferences of specific individual jurisdictions. The data track the percentages of voters who approve of mergers with potential consolidation partners, or who are in favor of establishing a merger consultation committee, which was made a mandatory part of the consolidation process in Japan. The data cover 308 referenda cases, including almost all of the municipalities that held local referenda and obtain affirmative rates of consolidation. The current study presents an empirical test of the effects of economics of scale, size, heterogeneity of preference, and financial factors on decision about municipal consolidation. The unique voting data on local referenda render this work different from the existing empirical literature. Data for the percentage share of affirmative voters for consolidation are more informative about the preferences of an individual municipality on consolidation than the bivariate merger variables usually used in the literature. As mentioned earlier, to overcome the problems discussed above, several empirical works estimated the Poirier’s bivariate probit or similar logit model, and developed a simulation-based estimator. However, there would likely remain some shortcomings in these approaches since the bivariate probit model suffers from lack of information, and an estimation model using a matching game imposes various strong restrictions on the justification of the theoretical framework. Moreover, because merger with more than two municipalities is allowed in Japanese consolidation, an estimation based on a one-sided matching game, such as that proposed by Gordon and Knight (2009), could not be applied to Japanese cases. On the other hand, the share data this paper employs allow for distinguishing preferences of distinct municipalities, further enabling a

4
measurement of the strength of preferences in each municipality.5 Besides, the findings of this paper could be used in an elaborate investigation of the predictions in the theoretical literature. The theory studies a median voter model of consolidation decision in jurisdictions where consolidation requires the consent of a decisive voter in all of the merging jurisdictions. The data set used here includes special information on the level of preference for a merger, thus allowing a richer examination of local government behavior. The findings of this paper shed light on the role of key features in municipal consolidation decisions. First, municipalities that could enjoy large-scale economy in cost through merging prefer consolidation. A municipality is likely to receive a large financial benefit from consolidation and choose to merge when disparity of per capita expenditures between the merging municipality and the merged one is large. The estimation result is consistent with the predicted theory and the existing empirics (Alesina, Baqir, and Hoxby, 2004; Brasington, 1999, 2003a; Gordon and Knight, 2009; Sorensen, 2006). Second, with regard to size effects, large and small municipalities are more likely to merge. As predicted from the theory, this result means that large municipalities want to merge as they could be the decisive voter in a post-merger municipality and provide public goods according to their preference. On the other hand, the findings on size effects of small municipalities, not predicted from the theory, would probably relate to the government’s policy to promote the merger of small municipalities, and the anticipated financial difficulties they would face due to the advent of an aging society. This result is, however, consistent with Ferris and Graddy (1988) and Brasington (1999), which present evidence that local governments with large and small population are likely to provide public services jointly with other local governments. Third, municipalities receiving a large proportion of unconditional grants are unlikely to merge. Regarding unconditional grants as a lump sum intergovernmental transfer,6 the larger the unconditional grant a municipality receives, the less likely it is to merge, as predicted from a theoretical analysis. Fourth, unlike the theoretical
5 Brink (2004) also employed voting data on municipal partition to estimate key factors affecting municipal boundary reform. However, the study comprised only 24 observations due to the shortage of boundary reform cases in Sweden. Further, the length of the data employed ranged from 1978 to 1999, a period so long that socioeconomic conditions might have changed during that time. Additionally, the study used data pertaining to local referenda on municipality partitioning to investigate the median voter’s behavior in boundary reform. This is in contrast with most empirical works that have studied the mergers of school districts and local governments, such as Brasington (1999, 2003a, 2003b), which used a data set of about 300 urban communities in Ohio that belonged to a consolidated school district or provided schooling independently, and Gordon and Knight (2009), which employed 12,234 samples at the school district border level, including 50 merger cases in Iowa during the 1990s. 6 Some studies state that unconditional grants, called Local Allocation Tax (LAT) in Japan, are calculated following the non-arbitrary formula, and may be considered as a lump sum transfer (Mochida, 2006; Reschovsky, 2007).

5
prediction, tax base effects, heterogeneity of preferences, and other financial factors could not capture the voting behavior of residents. However, the result on heterogeneity of preference is consistent with some recent empirical works that mention that scale economy and tax base effects affect consolidation decision more importantly than heterogeneity (Brasington, 2003b; Gordon and Knight, 2009). This paper is organized as follows. The next section reviews the methodology and the findings of the previous literature. Section III develops the theoretical model. Section IV presents background information regarding Japanese local government system and boundary reform. Sections V and VI discuss the empirical model and data, respectively. The main results are outlined in Section VII, and Section VIII presents the conclusions.
II. Literature Review
Several empirical works have brought to light factors underlying municipal consolidation. Nelson (1990) examined how the degree of heterogeneity of resident preference for locally provided public good explains the differences in local government structure in the U.S. and in state regulation of local government organization, and its production of varying local government patterns. He found that greater heterogeneity of citizen preferences results in larger numbers of general-purpose and special-district governments, which is in line with the predictions from the theory. Using the number of jurisdictions, including school districts and municipalities in the U.S., Alesina, Baqir, and Hoxby (2004) showed the existence of an important trade-off between racial heterogeneity and economies of scale, and that this trade-off is greater than that with income heterogeneity. This empirical literature dealt with fragmentation and annexation without focusing on the identities of potential consolidation partners. On the other hand, Austin (1999) and Brasington (1999) focused on the consolidation decisions of each community using the bivariate discrete choice model, where the binary choice depended on the joint decision of both decision makers. Using data for U.S. cities in the 1950s, Austin (1999) employed the bivariate logit, a model of economic and political choice, in which annexation decisions of the city and suburb were determined simultaneously to estimate the theoretical equation. He showed that cities respond to economic factors other than the additional tax base, and that racial rather than political effects motivate cities to annex suburbs. Unlike other empirics, Brasington (1999) found that the consolidation of
6
298 pairings of school districts in Ohio was more likely between local governments of different size. Brasington (2003a, 2003b) then conducted a series of studies on consolidation of school districts in Ohio using the bivariate probit model developed by Poirier (1980), and obtains the results that small districts and like districts are more likely to merge. Relative to these analyses, Gordon and Knight (2009) developed an econometric model of spatial merger estimation focusing on the important features of political integration: two-sided decision-making, multiple potential merger partners, and spatial interdependence. They showed that state financial incentives are important for driving mergers, and that heterogeneity of preference plays an important role in consolidation decisions. These recent empirical works develop a sophisticated econometric method of discrete choice to identify the decisions of individual jurisdictions. The dependent variable in their estimation is a dummy variable that takes 1 if both neighboring jurisdictions decide to merge and 0 if one of them does not approve consolidation. The dummy dependent variable is less informative to identify which municipalities refuse to merge among potential consolidate partners as consolidation does not realize, and what proportion of residents who live in the jurisdiction in question approve of consolidating with potential partners. With regard to investigating merger decisions, the dummy variable provides information only on whether both districts approve of the merger or at least one of the districts chooses separation. One of the contributions of the current study is to show the role of factors that potentially influence the consolidation decision, using affirmative rates for consolidation that enable us to measure the degree of preference for consolidation in specific individual municipalities. III. Some Background on the Local Government System and Boundary Reform in
Japan A. Local Government System in Japan Japan is a homogeneous unitary state where the local government system consists of 47 prefectures and about 1,700 municipalities under prefecture-level governments (as of January 1, 2012). Compared to the average local government expenditure of other member countries of the OECD, local government expenditure in Japan is large, amounting to more than 70 percent of general government expenditure (MIC, 2011). However, a large proportion of local expenditure is subject to centralized regulation and

7
financial controls. The Japanese local government system is said to be more centralized than that of most other countries with respect to its personnel system and administrative functions. Under a system of personnel exchange, senior positions in the prefectural and municipal administration are filled by central government dispatches, while some local government officials are placed with central government ministries and agencies (Akizuki, 2001). Personnel exchanges are used as a functional instrument, manifested to be effective for implementing national projects.7 On the administrative side, the other centralized systems concern the delegation of major projects and control by the Ministry of Internal Affairs and Communications (henceforth, MIC).8 Under the delegation system, the central government delegates the execution of major programs to prefecture and municipal chief executives. The MIC possesses several administrative and financial instruments to control local governments. The Japanese local financing system has been also highly centralized. Local governments typically raise only about 30 percent of their revenue through local taxes. The main sources of local tax for municipalities are property tax and inhabitant tax. Property tax and inhabitant tax account for 41 percent and 47.1 percent of tax revenues, respectively (FY 2008 settlement). Inhabitant tax consists of tax on personal income (proportional to 10 percent) and tax on corporate income. Personal and corporate income taxes account for 34.4 percent and 12.7 percent of municipal tax revenues, respectively. As OECD (2005) reports, the self-taxing power of Japanese local governments is nearly equal to that of Northern European countries, and the tax rates of personal inhabitant tax and property tax are nearly uniform throughout the country. However, local governments are authorized to set tax rates within limited ranges (Mochida, 2006, p.164). Specific-purpose and unconditional grants account for a large share of other revenue, 12 percent and 16.9 percent, to the total revenue of municipalities, respectively (FY 2008 settlement). Specific grants, called National Government Disbursement in Japan, are resources that are provided by the central government for specific expenditures such as education, health care, agriculture, public works, and disaster relief projects. The central government uses specific grants to guide the implementation of these projects through 7 Moreover, there is not much opposition among local governments to the system because dispatches from the central government are well trained and their quality is typically high. 8 See, for example, Akizuki (2001) and Mochida (2001, 2006).
8
budgets, and as a means for economic stimulus and the reduction of interregional distribution of income. Unconditional grants, called the Local Allocation Tax in Japan, are a fiscal transfer system to reduce vertical and regional fiscal imbalances. A vertical imbalance is the difference in the share of tax revenue and expenditures between the central government and local governments. All transfers are nearly formula driven, with formulas taking into account population, area, and so on, and are paid to local governments to provide a standard set of public services, depending on the disparity between their tax revenue-raising capacity and total expenditures.9 Because poor municipalities are much more reliant on grants than their richer counterparts are, the equalization system reduces regional fiscal inequalities. B. Municipal Consolidation in Japan The number of municipalities in Japan declined from 3,232 to 1,719 between for March 31, 1999 and January 1, 2012, respectively. There has been a major increase in the number of municipal mergers, known as the Great Merger of Heisei, which was promoted by the central government as a way of strengthening the administrative and financial foundations of municipalities.10 The government of Japan has clarified its reasons for promoting municipal mergers. These include the recent requirement that local governments maintain autonomy to carry out a diversified and intricate administrative role, despite facing a reduction in population that causes a loss of efficiency in administrative management and provision of local public services. With expansion in the sphere of life, local governments need to provide public services beyond the traditional boundaries. In order to improve administrative efficiency, some have found it necessary to annex small municipalities to offset severe financial deficits. Municipalities did not voluntarily merge, since the Special Law for Municipal Mergers (henceforth, SLMM) enacted in 1965 did not supply a positive impetus for consolidation. However, after the adoption of amendments to the SLMM in 1999, the number of consolidations increased rapidly. After its amendment, the SLMM provided a strong financial and economic incentive to stimulate municipal consolidation, including a grace period during which local governments could avoid the reduction of unconditional grants from the government resulting from mergers. Another incentive covered permissions for the issue of local bonds, from which municipalities could
9 See Mochida (2006) and Reschovsky (2007). 10 See, for example, CLAIR (2009), MIC (2006b, p.41), and Yokomichi (2007).

9
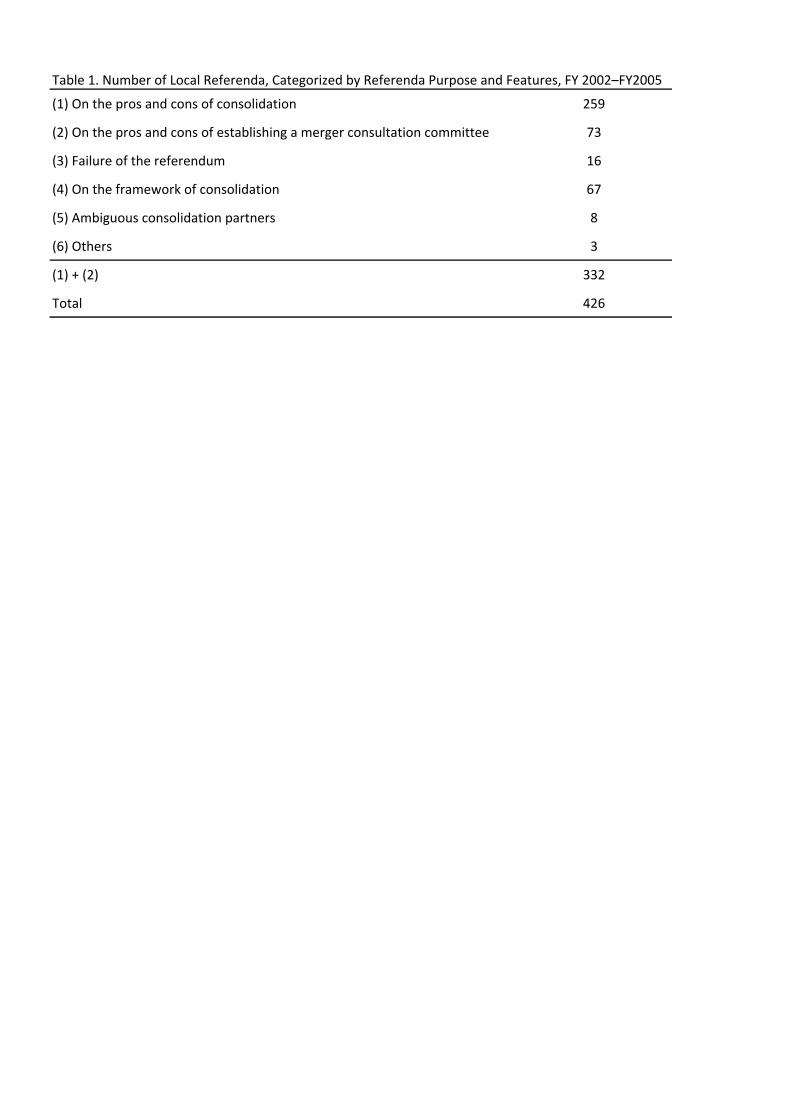
eventually receive unconditional grants to finance additional costs stemming from the merger. Furthermore, the Japanese government proposed to make prefectures report merger patterns for municipalities in 1999, and in 2001, even constructed a headquarters to provide assistance in matters pertaining to municipal mergers.11 Figure 1 is inserted here. A local referendum or a questionnaire survey on consolidation was frequently used by local administrative chiefs to get a clear idea of public opinion in Japan. Figure 1 shows the number of municipalities, consolidations, and local referenda during the years 1999 and 2008 in Japan. The number of municipalities has declined precipitously between 2003 and 2005, as a large number of consolidations occurred. Local referenda were held over periods preceding the decrease in municipalities and increase in consolidations, since referenda are used as an instrument to confirm the will of the residents before mergers of this kind are allowed to take place. Table 1 is inserted here. Table 1 contains the number of local referenda separated into a subsample based on the purposes and features of each referendum:12 on the pros and cons of consolidation, on the pros and cons of establishing a consolidation consultation committee (which is the mandatory council municipalities that have to set up before they decide to merge), failure of the referendum (which often occurred as a turnout of votes was below the minimum required to validate the referendum), on the consolidation framework, on ambiguous consolidation partners (for referenda in which the potential consolidation partners are not identified), and others. Among 426 referendum cases,13,14 332 cases 11 However, municipal mergers have not been made compulsory by law in Japan. Rather, consolidations have taken place more voluntarily than in the past (Yokomichi, 2007). 12 Data on the properties of local referenda on consolidation were collected by the author. The construction of the database is described in Appendix A. 13 The total number of referenda (426) is close to that recorded by the MIC (2010b) (418), and thus, almost all referendum cases are likely to have been covered. The difference in numbers can be explained by the fact that the MIC counted some referenda as a single case when two or more referenda were held for identical consolidation plans, whereas the author counted each referendum separately in such cases. 14 According to the MIC (2010b), there are totally 418 local referenda from FY 1999 to FY 2005. 66 local referenda on the issue of establishing the merger consultation committee were conducted on the basis of a partial amendment to the SLMM in 2002. The 2002 amendment to the SLMM stipulates that, in the event that more than one-sixth of the voters ask for the establishment of the mandatory council after it is rejected by a local legislature and the mayor does not found the council, the municipality must hold a local referendum on the pros and cons of the settlement of a mandatory council. The merger consultation committee has to be established if a majority of the electorate approve settlement. During the same period, 352 local referenda were held following the establishment of an ordinance on local referenda, the purpose mainly being to decide for or against a merger with specific adjacent municipalities. Of the 352 referenda, 305 were votes on whether to consolidate with a group of potential merger partners, and 47 on
10
((1) + (2)) presented the shares of voters who agreed with the consolidation or the establishment of a committee, results that could thus be used in this estimation. In practice, 308 referendum cases are employed in regressions in the current study. Table 1 also shows that municipalities preferred to vote to decide the pros and cons of consolidation rather than the establishment of a consulting committee. Among the other samples, referenda on the framework of consolidation (which municipalities should be partners and whether to consolidate) accounted for a large proportion. While the results of the referenda do not necessarily ensure implementation of the choice/idea by local administrative chiefs, they are widely taken into consideration; the ideas of residents were adopted in more than 90 percent of the cases.
IV. Theoretical Model
A. The Model I consider a country consisting of two municipalities. The two municipalities are different in size, and the residents have heterogeneous preferences and different income levels. The population size of municipality is denoted as for 1, 2 . I assume that municipality 1 is larger than municipality 2, . Individuals cannot move across municipalities, and are homogeneous on preference and income within a municipality. There are two governmental structures. Under separation, each local government decides on the level of public good, and public expenditures are financed by income taxes on inhabitants of each municipality. Under consolidation, or a combination of the two municipalities, the level of public goods and income tax rates are uniform across municipalities. Consolidation must be approved by both municipalities, and inhabitants in one municipality are supposed to be able to refuse to merge with the other if their utility level is higher under separation than under consolidation. For purposes of political process, the median voter in each municipality becomes the decisive voter, whose utility is maximized by political decision as a result. The model has two periods. In the first stage, consolidation decisions are implemented by the inhabitants. In the second stage, each local government chooses public good levels and tax rates so as to maximize the utility of the median voter. which municipalities to merge with (MIC, 2010b).
11
The utility function of individuals in municipality is ln , 1
where is a preference parameter for the publicly provided goods , which is the number of units of the public goods, and is private good consumption. The individual’s budget constraint is
1 , 2 where is the income tax rate and is the individual’s income. The levels of tastes and initial income may or may not be equal across the municipalities, although those who live in the same municipality have homogeneous preferences and income levels. Inhabitants in each municipality are characterized by their tastes for public goods and initial income levels. Each government imposes an income tax on inhabitants and collects revenue to finance the costs of the public good provision. The total cost of providing units of local public good is , where is per unit cost to provide public services. I assume for simplicity that is dependent only on the number of inhabitants in the municipality and that it is decreasing in population size, or ′ 0. This property explains a kind of economics of scale for production of the public good, implying that consolidation, particularly in the case of small municipalities, gives rise to a reduction of costs through scale economies. Under separation, the local government’s budget constraint is
. 3 Under consolidation, the government’s budget constraint is
2 . 4 Note that merger government imposes the same income tax rate on both municipalities and its amount of the local public good is homogeneous across municipalities. B. Public Goods Provision and Voting Behavior Suppose that there is a separation. The median voter in municipality maximizes (1) with respect to and subject to the budget constraints (2) and (3). The equilibrium outcomes are given by the first-order condition:
. 5
Obviously, higher preference for the public good and larger population increase the level of the public good provided by local governments.

12
If municipalities 1 and 2 merge and provide the public good jointly, then the inhabitants in municipality 1 are in the majority and constitute the median voter in the newly merged municipality. The median voter decides the level of income tax rates, , and public good, , so as to maximize utility subject to the individual’s and the government’s budget constraints (2) and (4), respectively. The resulting public good at equilibrium is
, 6
where /2 , which is population per municipality, and / , which is per capita income in a merged municipality. If the two
municipalities are identical except for taste parameter, then and , and then the public good level is / 2 , suggesting that the merged government provides the larger number of the public good than municipality 1 due to lower marginal costs. In addition, since it does not take into account the preference of inhabitants in municipality 2, the difference in preference between these municipalities does not affect a motivation for their consolidation. By comparing the median voter’s utility under separation and under consolidation, I can investigate how inhabitants in each municipality decide whether or not to vote to consolidate public good provision. I obtain the median voter’s utility at the separation equilibrium, , by substituting (5) into the utility function and calculating. It follows that under consolidation, , I substitute (6). Utility gain from consolidation for municipalities is expressed as follows:
ln ln ln , 7
where ln 1 . Equation (7) explains the benefit of consolidation. A benefit is reflected in the difference in the cost of providing public goods, and is also dependent on how disparities in public service levels between separation and consolidation affect the total tax burdens the municipalities collect. Further, decision on consolidation depends on the difference between preferences and median incomes. In the first term of (7), marginal cost under separation is compared with that under
13
consolidation in municipality . This term describes the effect of scale economies on merger decisions. Larger disparities in population enhance the incentive for merger by virtue of efficiency gains. Because , the less populous area, municipality 2, is more likely to merge. The second term of (7) explains tax base effect in population, which is change of tax base resulting from variation in population. If is becoming larger than , meaning that , then per region tax base after consolidation increases for municipality , therefore suggesting that merger incentive for municipality will enhance. If , municipality has an incentive to consolidate with municipality , and vice versa. Thus, municipality 1 is unlikely to merge, but municipality 2 likely, in respect of tax base effect in population. The third term of (7) presents tax base effect in per capita income. The effect reflects the change of tax base through variation in per capita income. The larger per capita income in a merged municipality, , i.e., the larger income in municipality , compared to that in municipality , the larger per capita tax base after consolidation for municipality . If municipality ’s median income exceeds that of municipality , the third term is positive, suggesting that municipality prefers consolidation to separation. The fourth term of (7) shows two types of incentive effects for the median voter in merging municipalities: utility gains from being the majority in a merged municipality, and utility loss from disparities of preference and median income between municipalities. Function is strictly concave, and takes the maximum value 0 when / 1 . From (7), if and , but , or efficiency gains and tax base effects were equal in both municipalities, then municipality 1 would be more likely to consolidate, since municipality 1 can determine the level of public good so as to maximize its utility. Moreover, heterogeneity of preference has an impact on the incentive to merge. The consolidation decision of municipality 1 does not depend on differences in preference as municipality 1 can make a decision on the public good level as a decisive voter irrespective of the tastes of municipality 2. On the other hand, the fourth term of (7) means that large differences in preference for public good and in median income deteriorate municipality 2’s incentive to consolidate with municipality 1 unless both differences are in the direction to cancel out, that is, for example, as and
.

14
Next, I examine how national transfers to municipalities improve or diminish the incentives to merge. It is assumed that the national government gives a lump sum transfer, , to municipality under separation, and the total for the two municipalities’ transfers, , to the merged one. Lump sum transfers are independent of population size and public expenditure. Each government’s budget constraint is rewritten as follows: under separation; 2 under consolidation. Then, utility gain from consolidation for
municipality is modified as
for . 8
The first term in the numerator of (8) expresses municipality ’s utility gain from lump sum transfer under consolidation, resulting from the fact that municipality can enjoy municipality ’s transfer under consolidation. In contrast, the second term in the numerator of (8) is the utility loss municipality ’s must incur when it merges. After consolidation, transfer , all of which municipality could enjoy under separation, is shared with municipality , thus weakening municipality ’s motivation to merge. The effect of transfers on consolidation incentives is also ambiguous. As in (8), utility gain for municipality from consolidation depends on the relative sizes of population, median income, and lump sum transfer. Except for population, the magnitude relations of income and transfer between municipalities and are not assumed, implying from (8) that it is not determined clearly whether there is a utility gain from consolidation when lump sum transfers exist. However, it is easily confirmed from (8) that a larger transfer for municipality gives municipality a stronger incentive to merge, whereas when the transfer for municipality increases, its motivation for consolidation diminishes.
V. Empirical Model
The existing empirical literature suggests that dummy variables predicting whether consolidation will occur should be regressed on proxies of efficiency gains, tax base effects, size effects, heterogeneity of preference, and financial factors (e.g., Alesina, Baqir, and Hoxby, 2004; Alesina and Spolaore, 2003; Austin, 1999; Brasington, 1999, 2003a, 2003b; Gordon and Knight, 2009; Nelson, 1990; Sorensen, 2006). The econometric model in the current study takes proxies of these five factors as regressors,

15
whereas the dependent variable is not a dummy variable on consolidation, but on the rates of residents who approve consolidation. The estimation model is expressed as
f , , , ,
, , ,
, and . 9
Figure 2 is inserted here. Difference in predicted cost captures efficiency gains that are improvements in efficiency from economy of scale due to the merger. Many works on consolidation show that economies of scale frequently prevails in public schooling and political integration, and that efficiency gains are a regular impetus behind consolidation (e.g., Alesina, Baqir, and Hoxby, 2004; Gordon and Knight, 2009). In the current model, efficiency gains are calculated as follows. Because it is well known that the logarithm of per capita cost function of public service provision is U-shaped in the logarithm of population in Japan (e.g., CLAIR, 2009), it is modeled for population number and its square as follows:
ln ln ln , 10 where denotes per capita expenditure, and represent the population and squared population of a municipality , respectively, and is the city dummy, which takes value 1 if a municipality is a city. is a random error term. Figure 2 depicts the logarithm of expenditure (yen/people) against that of the population (per thousand people) in 2000, suggesting that the per capita cost function is U-shaped in Japan. Using the estimation results, efficiency gains are defined as the difference in the predicted cost between an original municipality and a group of potential merger partners. Coefficients of population and squared population are and , respectively; negative
and positive are expected if economies of scale could be allowed for small municipalities, and diseconomies of scale for large municipalities. Size effects are expressed as Share of population, the percentage of the original population to that of the merged population, and Squared share of population. Ferris and
16
Graddy (1988) found that large and small local governments are likely to provide public services jointly by contracting with a private firm, a non-profit organization, and local governments. Brasington (1999) also included the difference in the number of pupils between two neighboring school districts to investigate the relationship between attitude toward consolidation and difference in size, and showed that large and small districts are likely to consolidate. If the share of population is negative and its square is positive, then large and small municipalities are most likely to merge, and medium-sized municipalities are most likely to separate. In contrast, inspired by Ellingsen’s (1998) majority voting model of separation/consolidation, Brasington (2003a) used Poirier’s bivariate probit model and split the sample into larger and smaller communities, to show that larger districts that could be a decisive voter after consolidation preferred to merge. If the share of population is significantly positive but its square is insignificant, the size effect curve is linear and upward, suggesting that a larger municipality wants to consolidate with a smaller one. As predicted from the theory, change of per capita taxable income in a municipality affects the decision to consolidate, since the median voter’s benefit from consolidation is also dependent on the difference in taxable income. According to the theoretical analysis, the effects of the tax base are separated into tax base effect in population, which is change of taxable income via variation in population resulting from consolidation, and tax base effect in per capita income, which is the change being caused by variation in per capita income. The tax base effect in population is measured by Difference in population, population of the municipality in question minus that after potential consolidation; tax base effect in per capita income by Difference in income, or per capita taxable income of municipality in question minus that after potential consolidation. Many empirical studies present evidence that local governments with a large per capita tax base are less likely to merge (e.g., Brasington, 2003a, 2003b; Brink, 2004). As pointed out in the existing literature, heterogeneity of preference plays a crucial role in the extent of welfare gains from consolidation (e.g., Brasington, 2003b). As the proxies of heterogeneity of preference, I use the median income, share of those who have at least graduated from university to total population and population density. The type of residents having different preference over public service provisions could be

17
reflected in their median income.15 Part of difference in preference is therefore measured by Difference in median income, which is defined as the original median income minus that of the potential consolidation partners, calculated in absolute value. To explain the effect of education background, Difference in education is employed, which is defined as the percentage of residents who have at least graduated from university in the municipality in question minus that in potential merged municipalities, calculated in absolute value in 2000. Difference in population density is population density of the municipality in question minus that after potential consolidation, calculated in absolute value. The greater the heterogeneity of preference, in general, the less likely the merger. Racial composition, an important feature that may affect preference for local public services (Brasington, 2003b), is not taken into account because, by and large, Japan is composed of one race. The model includes control variables on debt and intergovernmental transfers to explain financial factors that may affect the consolidation decision. Hinnerich (2009) found that a local government with a strong tendency to free ride increases its per capita debt before annexation. Difference in accumulated debt, accumulated municipal bond per capita in the jurisdiction in question minus that after potential consolidation, is used as the proxy for a free-riding effect, which is a common pool problem caused by boundary reform (Hinnerich, 2009). Intergovernmental transfers comprise two types of intergovernmental grants: specific grants to municipalities from the national and prefectural governments, and unconditional grants from the national government to municipalities. As Gordon and Knight (2009) demonstrated, financial incentives to municipalities may have a significant impact on their consolidation behavior.16 As predicted in the theoretical analysis, larger and smaller lump sum grants received by a municipality and its potential consolidation partners respectively, weaken the motivation to merge. It is assumed here that specific and unconditional grants are proxies of lump sum grants. Note, however, that both specific and unconditional grants are, to be precise, not lump sum grants. Specific-purpose grants in Japan are said to be decided in accordance with the allocation standard that while being objective, is set by bureaucratic institutions (Reed, 2001). Unconditional grants, such as the Local Allocation Tax in Japan, play the
15 The method of calculation employed for the median income is presented in Appendix B. 16 Johansson (2003) showed that intergovernmental grants are used as a device to win votes.

18
role of the fiscal equality transfer system and are allocated according to a formula based on the difference in basic expenditure needs and fiscal capacity of local governments (Mochida, 2006). Therefore, municipality mergers have usually given rise to the reduction of unconditional grants because fiscal expenditure needs are calculated considering economics of scale. As per the 1999 amendment to the SLMM, however, unconditional grants for the merged municipalities that had merged by FY 2006 were calculated as if consolidation did not take place for a certain time (e.g., CLAIR, 2009), implying that unconditional grants are forecasted not to be changed after consolidation. Therefore, unconditional grants are more likely to have a property of a lump sum grant than a specific grant. Table 2 provides the definition, units, and statistical sources of variables. Table 2 is inserted here.
VI. Data The data set employed here consists of referenda results, estimated costs, population, per capita income, shares of population, median income, the number of people who have graduated from university at least, population density, cumulative debts, specific grants, and unconditional grants for 308 municipalities that held local referenda on consolidation, where the pros and cons of consolidation or the establishment of a consultation committee were voted upon, during 2002–2005. The method of referenda data collection is described in Appendix C, while the selection strategy appears in Appendix A. Table 3 is inserted here. Table 3 presents descriptive statistics for approval rates for consolidation during the years 2002–2005. The number of municipalities that held local referenda on consolidation increased during 2002 to 2004 and decreased precipitously in 2005. The mean of approval rates in 2005 is much larger than that in the other years. Table 4 is inserted here. Table 4 provides descriptive statistics on all control variables, mainly in the form of differences. In particular, statistics on predicted per capita costs, population, per capita
19
income, and shares of population are also listed for the original municipalities and the merged ones. In rows 1 and 2, the means of the predicted cost variables fall considerably after potential consolidation, resulting from economies of scale of the cost function in population size. Row 7 shows that the mean of Share of population is also low, implying that many municipalities are expected to account for a small part of the merged municipalities. The reported variables in rows 11–16 are potential controls for testing whether approval variables of referenda are correlated with heterogeneity of preference and financial factors. Variables pertaining to the financial health of the municipalities (rows 14–16) show that, on average, accumulated debt and specific and unconditional grants in merging municipalities exceed those in merged municipalities, thereby suggesting that municipalities holding a referendum are less likely to merge than other merging partners because of the loss of grants, but are likely to merge because of the reduction of debts.
VII. Estimation and Results A. Regression Results Column (1) of Table 5 presents the estimates of cost function, equation (10), using the data from 2000. This is because after 2000, a valid estimation of the cost function is difficult due to the surge in municipal consolidation, which transformed the relationship between the cost and the population size. As is negative and is positive in column (1), the cost function is U-shaped in 2000. This is realistic in Japan: many empirical works have articulated that per capita total expenditure in Japanese municipalities is strongly U-shaped and have predicted that municipalities with less than 100–200 thousand inhabitants could enjoy efficiency gains from increasing population (e.g., MIC, 2008). However, the data from 2002–2005 are also used in an additional estimation of the cost function, in order to use the explanatory variables in the same periods as referenda were held and to check robustness. Table 5 is inserted here. Table 6 is inserted here.

20
The estimation results of municipal-level data on local referenda are reported in Table 6. All estimates shown in columns (1)–(4) include year dummies to explain economic performance and reformation of financial incentive schemes for consolidation, and prefecture dummies to capture economic situations and attitudes to municipal consolidation varying from prefecture to prefecture.17 To begin with, consider column (1) in Table 6, which reports the results of baseline estimation of specification (9). Similar to the existing literature (e.g., Alesina, Baqir, and Hoxby, 2004; Alesina and Spolaore, 2003; Austin, 1999; Brasington, 1999, 2003a, 2003b; Gordon and Knight, 2009; Nelson, 1990; Sorensen, 2006), the estimated coefficient of Difference in predicted cost is positive and highly significant, indicating that economies of scale provide an incentive for municipalities to tend to merge. However, the results of tax base effects are different from the empirical literature. First, the coefficient of Difference in population is significantly positive. The estimation result shows that the municipality whose population is small compared to the other potential consolidation partners is likely to have a strong incentive to merge, because its per region income increases after consolidation. Second, Difference in income is statistically insignificant, implying that the tax base effect brought about by change of per capita income is not observed. This may be attributed to the fact that, generally, the inhabitants do not take the income levels of consolidation partners into account. The estimation results of Share of population and Squared share of population show that the affirmative rates of consolidation are significantly U-shaped for the population size, implying that, as shown in Ferris and Graddy (1988) and Brasington (2003a), large and small municipalities want to merge. The effect coincides with theoretical predictions that a large city that can be a decisive voter in a merged jurisdiction prefers to merge more strongly than a small city (Dur and Staal, 2008; Ellingsen, 1998). On the other hand, according to the theory, small municipalities are less likely to merge, whereas the empirical results are conflicted. One explanation of the results is that the Japanese government promoted municipality consolidation to improve the efficiency of municipal administrative management, in particular small ones such as villages and towns, many of which faced financial difficulties and would not maintain their autonomies, anticipating population loss in the future (MIC, 2005c, p.39). It could be often argued that many of these small municipalities felt they had no choice other than
17 Financial supports for mergers were reviewed nearly annually from 1999 through 2006 in order to spur municipal mergers.

21
consolidation for their survival (e.g., Konishi, 2003). While the coefficient of Difference in median income has the expected negative sign, it is insignificant. The result differs from that of many other studies, which mention that larger the heterogeneity of median income, the less likely a merger. Furthermore, I also tested whether the other preference variables are related to approval rates of votes. The estimates in column (1) present clear evidence that Difference in education and Difference in population density are insignificant. Unlike the literature, the estimates indicate that preferences of inhabitants are indifferent to the decision on whether municipalities merge. One possible reason is that in Japan the central government has controlled local governments strictly, and has rectified inequality among local governments through specific and unconditional intergovernmental grants. Thus, under this system, local governments might have provided civil services without reflecting on inhabitants’ preferences (e.g., Akizuki, 2001).18 For financial factors, Difference in debt is highly insignificant with a small point estimate. Difference in specific grant is also not significant. Unlike the results of previous empirical work (e.g., Hinnerich, 2009), therefore, it is not likely that fiscal gains in terms of accumulated debt and specific grant will explain the rates of affirmative voters. In contrast, Difference in unconditional grant is negative and significant as expected, meaning that an increase of 100 thousand yen (about thousand USD) in per capita grants produces a reduction in 3% in affirmative rates. It means that a municipality is reluctant to merge when it receives a larger amount of intergovernmental grants compared to the other potential consolidation partners. Column (2) presents the estimates of a regression that ignores the potential of the effects of heterogeneity of preference. As for variables significant in the baseline model, the same sign and significance are obtained. Analogous to the results in column (1), Difference in predicted cost and Difference in population have the expected sign for coefficients and are significant. Share of population and its square also remain significantly negative and positive, respectively, as expected, implying the U-shaped
18 Akizuki (2001) has called the Japanese central-local relationship “controlled decentralization,” under which the central government designs and controls many governmental functions, such as policing and education, by using the various channels such as personnel exchanges between national and local governments, and distribution of grants. It is well known that although Japanese local expenditure accounts for about 60% of general government expenditure, a large amount of local expenditure is not under the local government’s control because a large share of local revenue is provided by the central government. The latter can stipulate usage of a part of local expenditure by law, and provides guidance to the local administration (Akizuki, 2001; Mochida 2006).

22
form of affirmative rates on population share. Further, the unconditional grant also presents nearly the same result as the baseline model. In column (3), I omitted Squared share of population from the regression, since it has been not included in some empirical works (e.g., Brasington, 2003b; Gordon and Knight, 2009). The result shows that approval rate of consolidation is not linear in the share of population, and therefore, the specification to omit its square would be invalid. However, column (3) displayed very nearly the same estimates as column (1) except for share of population. Furthermore, I estimated the probit model where its dependent variable is a dummy that takes 1 if the municipalities employed in estimation actually consolidate with their potential consolidation partners, for the period beginning with the year after the local referendum to 2011, to assess the relationship between decision on actual consolidation and various variables employed in the estimation. Column (4) gives evidence that efficiency gains and unconditional grant have the expected signs and are significant. Unlike the previous estimations, population share and its square are statistically insignificant with a small point estimate. Difference in median income (a variable to explain heterogeneity of preference) presents the expected signs at a highly significant level. The distinct estimates may reflect the fact that the dummy variable on the implementation of consolidation explains the inhabitants’ preference for consolidation on the ground adequately, since to realize consolidation, there are many obstacles to be overcome, such as approval by local legislature in all the related municipalities, the mayor’s wishes, and public opinion, and it is difficult to realize consolidation. However, because the same results as the baseline model are obtained in efficiency gains and unconditional grant, the estimates could be considered robust. B. Robustness Check Table 7 is inserted here. In this subsection, I first estimate the same specification as in the baseline model in Table 6, except for excluding the year dummy or the prefectural dummy. Column (1) in Table 7 shows that the variables significant in Table 6, such as efficiency gains, size effects and unconditional grant, remain significant as before. As shown in column (2),

23
omitting prefecture dummies also renders efficiency gains and the variables share of population significant, but, in contrast, the coefficient of unconditional grant becomes insignificant although has an expected sign. The much lower than normal level of the coefficient of determination in column (2), however, indicates that the estimation excluding prefectural dummies may be not credible. Next, I estimate a series of the model including dummy variables on the form of consolidation and local referendum. There are two types of merger: One is the “creation of a new municipality,” which means creating a new municipality by annexing some municipalities evenly; and the other is “municipality absorption,” which means that a merging municipality absorbs the other consolidation partners, and basically becomes the center of the merged municipality.19 Column (3) provides the estimates of a regression model analogous to the baseline model in Table 5, including a dummy that takes 1 when a new municipality is created and 0 otherwise (expressed as Dummy for creating municipality). The estimates do not change significantly, and are valid and robust against the estimation that includes the dummy. Column (4) presents the estimation results including Dummy for consolidation, a dummy that takes 1 for municipalities holding a referendum on whether to merge and 0 for those holding a referendum on whether to establish a merger consultation committee. Municipality behavior might be affected by the purpose of the local referendum, part of which is reflected in the dummy. All the coefficients on efficiency gains, the variables on population share, and unconditional grant are statistically significant and have the expected signs. In column (5), I estimate the baseline model including the cross-term, Dummy for creating municipality times Dummy for consolidation, as a dummy to capture the behavior of the municipalities that held a vote on consolidation by which a new municipality would be created. Even after controlling for the dummy, the coefficients of efficiency gain, the variables on population share, and unconditional grant remain significant with expected signs of the parameters.
19 Creation of new municipality is called “Shinsetsu gappei” in Japanese. Municipality absorption called “Hennyu gappei.”

24
Figure 3 is inserted here. For fear of censoring, I estimated a Tobin model with lower and upper limits for censoring. Figure 3 depicts an example of distribution of approval rates for consolidation. By the central limit theorem, the distribution of the average number of votes becomes asymptotically normal. However, the data on approval rates may be censored on both sides, given that should the mayor or legislature recognize whether the majority of residents are in favor of or against the merger, he or it would be unlikely to hold a local referendum. Therefore, the so-called two-limit tobit is employed to test the robustness of estimates, assuming that the lower limit is the minimum observed in the data, and the upper limit, the maximum. The results of the two-limit tobit appear in column (6) of Table 7. The coefficients and standard errors obtained are similar to those obtained from the baseline regression, column (1) of Table 6. Finally, I analyze heterogeneous consolidation behaviors of large and small municipalities. The theoretical analysis of local government consolidation, expressed in equation (7), shows that a larger municipality makes decision on consolidation independent of difference in preference between larger and smaller municipalities, whereas a smaller one’s decision is dependent on the difference. Taking into account the relationship between size and motivation to consolidation, Brasington (2003a) looked at the influence of size difference on consolidation decision via splitting the sample into larger and smaller municipalities. The current study scrutinizes such an effect by splitting the data into majority municipalities that account for more than 50% of population in merged municipalities and minority municipalities for less than 50%. Since as in the previous estimates, approval rates are U-shaped in share of population, its square is anticipated to be insignificant in the new regression, and thus, Squared share of population is omitted from the estimation. Columns (7) and (8) provide the estimation results for majority and minority municipalities, respectively. According to the regressions, the coefficients of efficiency gain have a significantly positive sign as expected. Moreover, population share variables are significantly positive in majority municipalities, but negative in minority ones, as anticipated. The parameter of unconditional grant is, however, insignificant, in contrast to the previous results in the majority sample. One explanation for the results may be lack of a sufficient number of observations in the majority case.
25
Table 8 is inserted here. Table 8 presents the estimation for the other robustness check, which is identical to that in Table 6 excerpt for using the predicted costs estimated from data for 2002–2005, whose coefficients are provided in column (2) in Table 5. As shown in column (1) – (3) of Table 8, efficiency gains, share of population and its square, and unconditional grant have the expected sign and are sufficiently significant, analogous to the estimates in Table 6. The other estimation results mostly remain the same as that in Table 6 as well. In sum, the estimation results of the robustness check imply that the estimates of efficiency gain, population share and its square, and unconditional grant are consistent with the results of the base line model. Note, however, that unconditional grant is less robust than efficiency gain and population share variables.
VIII. Conclusion Boundary reforms of local governments were frequently seen in several European countries during the period after World War II. There has been much theoretical and empirical work investigating the factors giving rise to integration of countries, local governments, and school districts. In estimating a discrete choice model of consolidation, most existing empirical studies choose a discrete variable on mergers that takes 1 for merging jurisdictions and 0 if at least one of the jurisdictions decides not to merge. Several discrete choice models have been developed that consistently estimate the impacts of key features of local governments on consolidation. However, the discrete variable on consolidation is less informative with respect to the decisions of the individual local government than the share data referring to the percentage of voters who agree. This work uses voting data of local referenda in Japan from 2002 to 2005, including figures for shares of voters who approved to merge or to establish a merger consultation committee. This paper reveals some important findings. First, municipalities with a large difference in predicted cost between the original and merged municipalities are likely to consolidate. The data concerning approval rates for consolidation confirm that efficiency gains from consolidation are one of the key impetus for deciding to merge. Second, voting data show that large and small municipalities are more likely to merge,

26
although this finding was not necessarily consistent with the theoretical analysis. It is inferred that large municipalities tend to merge because they would be a decisive voter in the merged municipality, but small ones prefer consolidation as it would help solve financial difficulties anticipated due to the rapidly aging population resulting from a decline in the birthrate. Third, larger unconditional grants weaken the consolidation incentive of a municipality. As unconditional grants could be regarded as lump sum transfers for all intents and purposes, the empirical result established the theoretical prediction obtained in the current study. On the other hand, tax base effects, heterogeneity of preferences, and the other financial factors have the unexpected sign or are insignificant in most estimates. However, heterogeneity of preference has been recently claimed to have less impact on consolidation decision than efficiency gains and financial factors (e.g., Brasington, 2003b; Gordon and Knight, 2009), partly consistent with this work. Using unique data of local referendum on consolidation, the results obtained demonstrate the importance of efficiency gains, size effects, and unconditional grant, and the limited role of disparity of preference in explaining consolidation decision. One caveat is that the results of this analysis may not generalize to other countries, because Japan has very little racial heterogeneity, and Japanese local government system is quite different from those in other countries. To my knowledge, however, such large amounts of local referenda on municipality consolidation could not be found in other countries, and the empirical findings using the data are interesting.
Appendix A. Data Used in the Estimation 426 referendum cases were principally collected from the Digital Archives of Mergers (henceforth, DAM), which is the internet homepage of the MIC (MIC, 2006), and each municipality’s homepage. In the 426 referenda, 94 cases were eliminated because we could not identify approval rates of these referenda, which are a must for the estimation in the current study. The eliminated cases comprised incomplete referenda due to shortage of votes, referenda on framework of consolidation (for example, choice of consolidation partners), referenda that did not specify potential consolidation partners, and so on. 332 referendum cases (=426–94) included municipalities that held elections

27
by which approval rates for consolidation with some potential partners were obtained as an outcome of the referendum. After eliminating outliers from the database, 308 municipalities were eventually selected for the estimation in the current study. Outliers have some particular characteristics, such as consolidations including enclaves and isolated islands, where large amounts of subsidies are often supplied by the central government.
Appendix B. Calculation of Median Income The median income of the municipality is not calculated by the Japanese government. As a result, median incomes of municipalities needed to be estimated in the current study, using taxable income for inhabitant tax (local income tax for residents) categorized by an amount of inhabitant tax, and the number of residents in each category. Inhabitant tax thresholds are composed as follows: below 50 thousand yen,20 50–100 thousand yen, 100–200 thousand yen, 200–400 thousand yen, 400–600 thousand yen, 600–800 thousand yen, 800–1,200 thousand yen, 1,200–1,600 thousand yen, 1,600–2,000 thousand yen, 2,000–3,000 thousand yen, 3,000–4,000 thousand yen, 4,000–5,500 thousand yen, 5,500–7,000 thousand yen, 7,000–10,000 thousand yen, 10,000–20,000 thousand yen, and over 20,000 thousand yen. The estimation proceeded as follows. First, the median income category was identified using the data of local income taxpayers. Second, the average of taxable income in each category and the cumulated distribution of taxpayers at the thresholds were calculated. Third, the median income was estimated for every municipality by linear interpolation around the category that included the median income earner. Median incomes were also estimated for the newly merged municipalities.
Appendix C. Local Referendum Data The referendum data were originally constructed as follows. First, municipalities holding a consolidation referendum were identified using DAM. Other local referendum cases were also identified from the homepage operated by each municipality, and other documents describing the committee, such as newspaper articles (since DAM covers only those cases where consolidation is realized after the referendum). Second, based on the list created in the first step, information on referendum, in particular approval rates of residents for consolidation, was obtained from the sources used in the first step of the 20 One hundred yen is equal to about one USD.

28
procedure.
References Akizuki, Kengo, “Partnership in Controlled Decentralization: Local Governments and the Ministry of Home Affairs” in Local Government Development in Post-War Japan edited by Muramatsu, Michio, Iqbal, Farrukh, and Kume, Ikuo, Oxford University Press, New York, (2001). Alesina, Alberto, and Enrico Spolaore, “On the Size and Number of Nations,” Quarterly Journal of Economics 112 (1997), 1027–1056. Alesina, Alberto, and Enrico Spolaore, The Size of Nations, Cambridge: MIT Press (2003). Alesina, Alberto, Reza Baqir, and Caroline Hoxby, “Political Jurisdictions in Heterogeneous Communities,” Journal of Political Economy 112 (2004), 348–396. Austin, D. Andrew, “Politics vs. Economics: Evidence from Municipal Annexation,” Journal of Urban Economics 45 (1999), 501–532. Besley, Timothy, and Stephen Coate, “Centralized vs. Decentralized Provision of Local Public Goods: A Political Economy Approach,” Journal of Public Economics 87 (2003), 2611–2637. Bolton, Patrick, and Gerard Roland, “Distributional Conflicts, Factor Mobility and Political Integration,” American Economic Review 86 (1996), 99–104. Bolton, Patrick, and Gerard Roland, “The Break-up of Nations: A Political Economy Analysis,” Quarterly Journal of Economics 112 (1997), 1057–1089. Brasington, David, “Joint Provision of Public Goods: The Consolidation of School Districts,” Journal of Public Economics 73 (1999), 373–393.

29
Brasington, David, “Size and School District Consolidation: Do Opposites Attract?” Economica 70 (2003a), 673–690. Brasington, David, “Snobbery, Racism, or Mutual Distaste: What Promotes and Hinders Cooperation in Local Public Good Provision?” Review of Economics and Statistics 85:4 (2003b), 874–883. Brink, Anna, “The Break-up of Municipalities: Voting Behavior in Local Referenda,” Economics of Governance 5 (2004), 119–135. CLAIR (Council of Local Authorities for International Relations), “Municipal Mergers in Japan,” CLAIR Fact Sheet (2009). Dur, Robert, and Staal Klaas, “Local Public Good Provision, Municipal Consolidation, and National Transfers,” Regional Science and Urban Economics 38 (2008), 160–173. Ellingsen, Tore, “Externalities vs. Internalities: A Model of Political Integration,” Journal of Public Economics 68 (1998), 251–268. Ferris, J. and E. Graddy, “Production Choices for Local Government Services,” Journal of Urban Affairs 10 (1988), 273–289. Gordon, Nora, and Brian Knight, “A Spatial Merger Estimator with an Application to School District Consolidation,” Journal of Public Economics 93 (2009), 752–765. Hinnerich, Bjorn Tyrefors, “Do Merging Local Governments Free Ride on Their Counterparts When Facing Boundary Reform?,” Journal of Public Economics 93 (2009), 721–728. Hirota, Hiroaki, “Shichoson no Sentaku Kodo to Gappei Yoin no Kensho (Verification of Municipal Incorporation with Discrete Choice Model),” Keikakugyosei 30:4 (2007), 75–81. Johansson, E., “Intergovernmental Grants as Tactical Instrument: Some Empirical Evidence from Swedish Municipalities,” Journal of Public Economics 87 (2003), 883–915.

30
Kenny, Larry, and Amy Schmidt, “The Decline in the Number of School Districts in the U.S.: 1950–1980,” Public Choice 79 (1994), 1–18. Konishi, Sachio, “Shichoson Gappei to Chiho Zaisei Seido, Shichoson no Zaisei Un-ei (Municipal Consolidation, the System of Local Public Finance, and Municipality’s Financial Management),” Jichi Kenkyu 79 (9) (2003), 22–49. Lockwood, Ben, “Distributive Politics and the Costs of Centralization,” Review of Economic Studies 69 (2002), 313–337. Meng, Chun-Lo and Peter Schmidt, “On the Cost of Partial Observability in the Bivariate Probit Model,” International Economic Review 25 (1) (1985), 71–85. MIC (Ministry of Internal Affairs and Communications), “Digital Archives of Mergers (DAM)” (http://www.gappei-archive.soumu.go.jp/) (2006a) MIC (Ministry of Internal Affairs and Communications), “Kokusei Chosa (Population Census of Japan)” (2000). MIC (Ministry of Internal Affairs and Communications), “Shichoson Kessan Jokyo Shirabe (Settlement of Municipality Finances)” (2002a–2005a). MIC (Ministry of Internal Affairs and Communications), Shichoson Zei Kazei Jokyo Tou no Shirabe (Taxation of Municipal Taxes) (2002b–2005b). MIC (Ministry of Internal Affairs and Communications), White Paper on Local Public Finance (2005c, 2006b, 2008, 2010a, 2011). MIC (Ministry of Internal Affairs and Communications), “Heisei no Gappei ni Tsuite (On Heisei Municipality Consolidation),” Report (2010b). Miyashita, Tomohisa, and Katsuyoshi Nakazawa, “Gappeigoikeisei Cost no Jissho Bunseki (Empirical Analysis of Cost for Consensus Building),” ZaiseiKenkyu 5 (2009), 254–275.

31
Miyazaki, Takeshi, “Kouritsuteki Jichitai ni yoru Houtei Gappei Kyogikai no Secchi (Creation of Merger Conferences by Cost-efficient Municipalities),” JCER Economic Journal 54 (2006), 20–38. Mochida, Nobuki, “Taxes and Transfers in Japan’s Local Finances,” in Local Government Development in Post-War Japan edited by Muramatsu, Michio, Iqbal, Farrukh, and Kume, Ikuo, 85–111, Oxford University Press, New York, (2001). Mochida, Nobuki, “Local Government Organization and Finance: Japan,” Public Sector Governance and Accountability Series, Washington, DC: World Bank (2006). Nelson, Michael, “Decentralization of the Subnational Public Sector: An Empirical Analysis of the Determinants of Local Government Structure in Metropolitan Areas in the U.S.,” Southern Economic Journal 57:2 (1990), 443–457. Nishikawa, Masashi, “Shichoson Gappei no Seisaku-hyoka (Policy Evaluation of Municipal Consolidation),” JCER Economic Journal 46 (2002), 61–79. Oates, Wallace, Fiscal Federalism, New York: Harcourt Brace Jovanovich (1972). OECD (Organization for Economic Co-operation and Development), Economic Surveys: Japan, (2005), Paris: OECD. Poirier, Dale, “Partial Observability in Bivariate Probit Models,” Journal of Econometrics 12 (1980), 209–217. Reed, Steven. “Impersonal Mechanisms and Personal Networks in the Distribution of Central Grants to Local Governments in Japan,” in Local Government Development in Post-War Japan edited by Muramatsu, Michio, Iqbal, Farrukh, and Kume, Ikuo, 112–131 Oxford University Press, New York, (2001). Reschovsky, Andrew. “Compensating Local Governments for Differences in Expenditure Needs in a Horizontal Fiscal Equalization Program,” in Intergovernmental Fiscal Transfers edited by Boadway, Robin, Shah, Anwar, The World Bank, Washington DC, (2007).

32
Sorensen, Rune, “Local Government Consolidations: The Impact of Political Transaction Costs,” Public Choice 127 (2006), 75–95. Yokomichi, Kiyotaka, “The Development of Municipal Mergers in Japan,” COSLOG Up-to-date Documents on Local Autonomy in Japan No.1 (2007), Council of Local Authorities for International Relations (CLAIR). Weese, Eric, “Political Mergers as Coalition Formation: Evidence from Japanese Municipal Amalgamations,” Global COE Hi-Stat Discussion Paper Series 017, (2008).
(1) On the pros and cons of consolidation 259
(2) On the pros and cons of establishing a merger consultation committee 73
(3) Failure of the referendum 16
(4) On the framework of consolidation 67
(5) Ambiguous consolidation partners 8
(6) Others 3
(1) + (2) 332
Total 426
Table 1. Number of Local Referenda, Categorized by Referenda Purpose and Features, FY 2002–FY2005

Variable Unit SourceReferendum Percentage of voters who agree with consolidation Percentage
Difference in predicted cost Predicted per capita expenditure of municipality in question minusthat after potential consolidation
Million yen/population 1
Difference in population Number of population of municipality in question minus that afterpotential consolidation
1,000 population 1
Difference in income Per capita taxable income of municipality in question minus that afterpotential consolidation
1,000 yen/population 1,2
Share of population Share of population of municipality in question to that after potentialconsolidation
Percentage 1
Squared share of population Square of Share of population Percentage 1
Difference in median income Median income of municipality in question minus that after potentialconsolidations (calculated in absolute value)
1,000 yen 2
Difference in education Percentage of residents who have graduated from university at leastin the municipality in question to residents who have graduated fromuniversity at least in potentially merged municipalities (calculated inabsolute value)
Percentage 1,3
Difference in population density Population density of the municipality in question minus that afterpotential consolidation (calculated in absolute value)
1,000 population/ha 1
Difference in debt Accumulated municipal bond per capita in the municipality inquestion minus that after potential consolidation
1,000 yen/population 1
Difference in specific grants Per capita specific grants provided by the central government andprefecture to the municipality in question minus that after potentialconsolidation
1,000 yen/population 1
Difference in unconditional grants Per capita general grants provided by the central government to themunicipality in question minus that after potential consolidation
1,000 yen/population 1
Definition
Note: Predicted per capita cost (row 2) is calculated from the prediction of logarithmic cost function that comprises per capita expenditure as adependent variable, and population, squared population, and a city dummy as explanatory variables. One yen is equal to about 0.01 USD.Source: 1 = MIC (2002a–2005a); 2 = MIC (2002b–2005b); 3 = MIC (2000).
Table 2. Variable Definition, Unit, and Sources

Year MeanStandardDeviation
Maximum Minimum Number
2002 49.68 10.70 68 30.1 14
2003 52.38 14.27 85.1 9.4 87
2004 51.37 15.64 86.6 11 204
2005 71.67 14.59 85.6 56.5 3
Total 51.81 15.13 86.6 9.4 308
Table 3. Descriptive Statistics for Approval Rates of Referenda, 2002–2005

Table 4. Descriptive Statistics for Key Variables
Variable MeanStandardDeviation
Maximum Minimum
Predicted cost 0.40 0.15 3.89 0.23
Predicted cost after consolidation 0.25 0.04 0.62 0.23
Difference in predicted cost 0.29 0.34 3.38 0.002
Population 18.8 23.9 203.4 0.5
Population after consolidation 143.3 149.1 773.3 6.7
Difference in population ‐22.9 48.0 123.0 ‐234.5
Share of population 13.1 14.5 81.8 0.4
Per capita income 3253.2 399.6 4159.1 2342.2
Per capita income after consolidation 3321.0 293.4 4157.1 2432.5
Difference in income ‐117.4 196.6 470.3 ‐797.7
Difference in median income 101.7 90.9 457.7 0.3
Difference in education 1.87 1.69 8.10 0.002
Difference in population density 0.27 0.40 2.51 0.0004
Difference in debt 142.1 403.9 2512.8 ‐389.4
Difference in specific grant 10.8 44.2 272.3 ‐49.2
Difference in unconditional grant 67.6 136.3 889.7 ‐275.8Note: Units are listed in Table 2. 308 observations were employed in calculation. Variables ondifference are calculated without any weights. Statistics of predicted cost are a weighted average inpopulation; those of predicted cost and population after consolidation are ones in population in amerged municipality. Statistics of per capita income are a weighted average in taxpayer; those ofper capita income after consolidation are ones in taxpayer in a merged municipality.

Table 5. Estimates of Cost Function
Dependent variable Per capita expenditure, 2000 Per capita expenditure, 2002–2005
(1) (2)
Log (population) ‐0.816*** ‐0.766***(0.015) (0.007)
Log (population)2 0.072*** 0.066***(0.002) (0.001)
City dummy 0.309*** 0.315***(0.014) (0.007)
Observations 3225 13365Adjusted R2 0.792 0.777Notes: Robust standard errors in parentheses. * significant at 10%, ** significant at 5%, *** significant at1%. Column (2) includes year dummy variables. City dummy takes 1 if the municipality is a city and 0otherwise. The data do not include merged municipalities.

Table 6. Estimates of Local Referenda
Baselinemodel
Excludepreferencevariables
Excludesquaredshare of
population
Estimation ofrealized
consolidation
(1) (2) (3) (4)
Difference in predicted cost 11.210** 9.433** 12.933*** 0.356**(4.671) (4.579) (4.529) (0.180)
Difference in population 0.073** 0.059** 0.052* ‐0.001(0.029) (0.029) (0.029) (0.001)
Difference in income ‐0.007 ‐0.007 ‐0.010 ‐0.0004*(0.008) (0.006) (0.008) (0.0002)
Share of population ‐0.493** ‐0.560*** ‐0.006 ‐0.011(0.204) (0.198) (0.067) (0.007)
Squared share of population 0.006** 0.007*** 0.000(0.002) (0.002) (0.000)
Difference in median income ‐0.009 ‐0.012 ‐0.0009**(0.013) (0.013) (0.0004)
Difference in education 0.574 0.899 ‐0.009(0.888) (0.885) (0.030)
Difference in population density 3.067 3.944* ‐0.104(2.322) (2.323) (0.099)
Difference in debt 0.004 0.004 0.005 ‐0.000(0.005) (0.005) (0.005) (0.000)
Difference in specific grant ‐0.031 ‐0.037 ‐0.034 0.000(0.038) (0.038) (0.037) (0.001)
Difference in unconditional grant ‐0.033** ‐0.029* ‐0.033** ‐0.001*(0.016) (0.015) (0.016) (0.000)
Observations 308 308 308 308Adjusted R2 0.146 0.148 0.128Log likelihood ‐179.570Notes: Robust standard errors in parentheses. * significant at 10%, ** significant at 5%, *** significant at 1%. Allregressions include year and prefecture dummy variables. All columns other than (4) are the results of OLSestimation. Column (4) is the result of the probit estimation, and reports marginal effects on average.

Table 7. Estimates of Local Referenda (Robustness Check)
Exclude yeardummy
Excludeprefecturedummy
Dummy forcreating
municipality
Dummy forconsolidation
(1) (2) (3) (4)
Difference in predicted cost 11.078** 9.363** 11.694** 11.473**(4.633) (4.557) (4.780) (4.732)
Difference in population 0.064** 0.037 0.064** 0.066**(0.030) (0.024) (0.030) (0.029)
Difference in income ‐0.008 ‐0.009 ‐0.008 ‐0.008(0.008) (0.008) (0.008) (0.008)
Share of population ‐0.487** ‐0.341* ‐0.507** ‐0.468**(0.204) (0.206) (0.203) (0.206)
Squared share of population 0.006** 0.005** 0.006*** 0.006**(0.002) (0.003) (0.002) (0.002)
Difference in median income ‐0.008 ‐0.007 ‐0.008 ‐0.009(0.013) (0.013) (0.013) (0.013)
Difference in education 0.381 0.477 0.569 0.438(0.881) (0.871) (0.887) (0.903)
Difference in population density 2.709 0.714 3.347 3.045(2.284) (1.803) (2.353) (2.354)
Difference in debt 0.004 0.004 0.003 0.004(0.005) (0.005) (0.005) (0.005)
Difference in specific grant ‐0.034 ‐0.061* ‐0.035 ‐0.032(0.037) (0.034) (0.038) (0.038)
Difference in unconditional grant ‐0.033** ‐0.019 ‐0.031* ‐0.032**(0.016) (0.017) (0.016) (0.016)
Dummy for creating municipality 2.906(2.193)
Dummy for consolidation 3.223(2.378)
Year dummy Yes Yes YesPrefecture dummy Yes Yes YesObservations 308 308 308 308Adjusted R2 0.145 0.031 0.148 0.148Log likelihoodNotes: Robust standard errors in parentheses. * significant at 10%, ** significant at 5%, *** significant at 1%. Allcolumns other than (6) are the results of OLS estimation. Column (6) is the estimation result of the two‐limit tobit.

Table 7. Estimates of Local Referenda (Robustness Check, continued)Cross‐term of
the twodummies
Tobitregression
Majoritymunicipalities
Minoritymunicipalities
(5) (6) (7) (8)
Difference in predicted cost 11.242** 11.308*** 912.049** 10.206**(4.678) (4.217) (148.044) (4.725)
Difference in population 0.072** 0.073*** ‐2.617* 0.073**(0.029) (0.023) (0.767) (0.033)
Difference in income ‐0.007 ‐0.007 ‐0.011 ‐0.006(0.008) (0.007) (0.064) (0.008)
Share of population ‐0.439** ‐0.493*** 3.083** ‐0.199*(0.204) (0.175) (0.615) (0.108)
Squared share of population 0.005** 0.006***(0.002) (0.002)
Difference in median income ‐0.010 ‐0.009 ‐1.229** ‐0.010(0.013) (0.012) (0.227) (0.013)
Difference in education 0.634 0.553 113.470** 0.934(0.881) (0.798) (23.691) (0.882)
Difference in population density 3.011 3.087 124.369* 1.955(2.303) (2.096) (34.296) (2.901)
Difference in debt 0.004 0.004 0.089* 0.004(0.005) (0.005) (0.030) (0.005)
Difference in specific grant ‐0.032 ‐0.036 ‐0.396 ‐0.030(0.038) (0.033) (0.228) (0.037)
Difference in unconditional grant ‐0.033** ‐0.033** ‐0.093 ‐0.027*(0.016) (0.014) (0.170) (0.016)
Dummy for creating municipality 35.540*** * Dummy for consolidation (6.961)
Year dummy Yes Yes Yes YesPrefecture dummy Yes Yes Yes YesObservations 308 308 31 277Adjusted R2 0.157 0.943 0.114Log likelihood ‐1213.279

Table 8. Estimates of Local Referenda: Cost Function Estimated by Using Data from 2002–2005
Baselinemodel
Excludepreferencevariables
Excludesquaredshare of
population
Estimation ofrealized
consolidation
(1) (2) (3) (4)
Difference in predicted cost 12.985** 10.893** 15.254*** 0.401*(5.622) (5.523) (5.409) (0.212)
Difference in population 0.072** 0.058** 0.052* ‐0.001(0.029) (0.029) (0.029) (0.001)
Difference in income ‐0.007 ‐0.007 ‐0.010 ‐0.0004*(0.008) (0.006) (0.008) (0.0002)
Share of population ‐0.482** ‐0.550*** 0.000 ‐0.010(0.205) (0.199) (0.067) (0.007)
Squared share of population 0.006** 0.007*** 0.000(0.002) (0.002) (0.000)
Difference in median income ‐0.009 ‐0.011 ‐0.0009**(0.013) (0.013) (0.0004)
Difference in education 0.565 0.888 ‐0.009(0.888) (0.884) (0.030)
Difference in population density 3.101 3.978* ‐0.104(2.327) (2.326) (0.099)
Difference in debt 0.004 0.004 0.004 ‐0.000(0.005) (0.005) (0.005) (0.000)
Difference in specific grant ‐0.031 ‐0.037 ‐0.033 0.000(0.038) (0.038) (0.037) (0.001)
Difference in unconditional grant ‐0.032** ‐0.029* ‐0.033** ‐0.001(0.016) (0.015) (0.016) (0.000)
Observations 308 308 308 308Adjusted R2 0.146 0.148 0.128Log likelihood ‐179.677Notes: The same as Table 6. Predicted costs are estimated using data from 2002–2005.
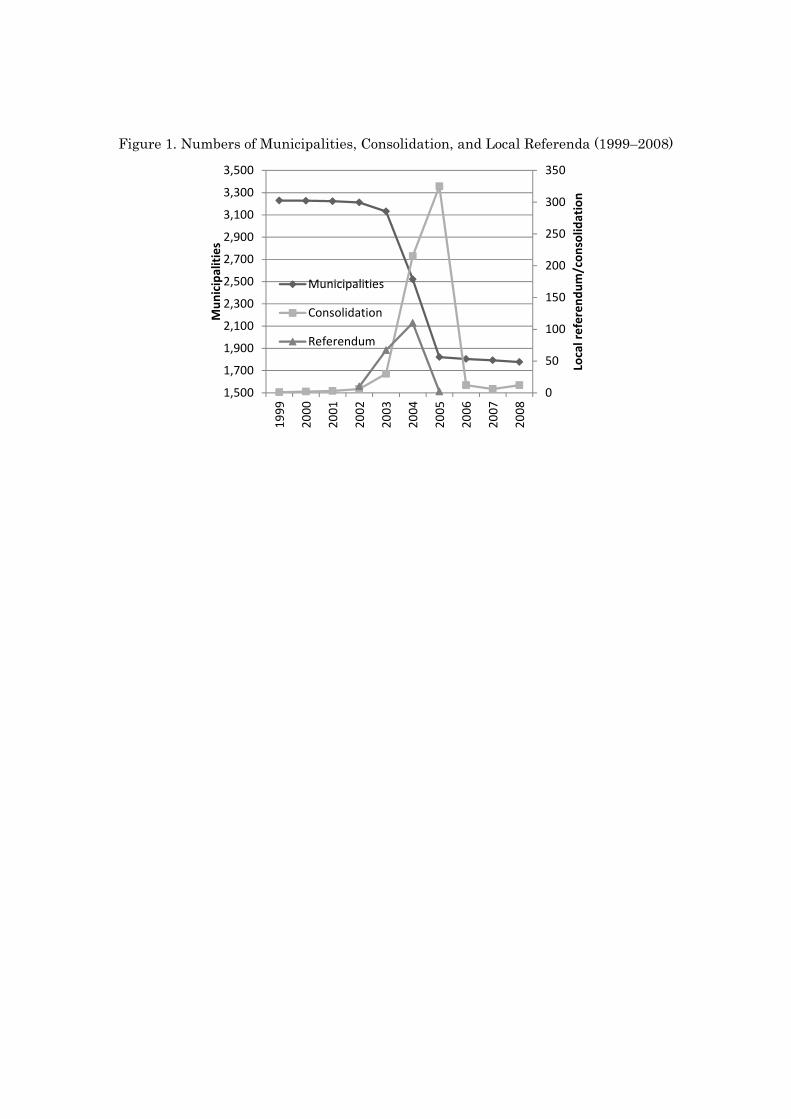
Figure 1. Numbers of Municipalities, Consolidation, and Local Referenda (1999–2008)
0
50
100
150
200
250
300
350
1,500
1,700
1,900
2,100
2,300
2,500
2,700
2,900
3,100
3,300
3,500
1999
2000
2001
2002
2003
2004
2005
2006
2007
2008
Local referen
dum/con
solid
ation
Mun
icipalities
Municipalities
Consolidation
Referendum

Figure 2. Logarithm of Expenditure against That of Population (2000)
Note: One yen is equal to about 0.01 USD.
56
78
9Loga
rith
m o
f exp
enditur
e (
yen/popula
tion)
-2 0 2 4 6 8Logarithm of population (1,000 population)

Figure 3. Distribution of Approval Rates of Consolidation Referenda
Approval rates
Density of approval rates
Minimum MaximunMean