municipal fixed income
TRANSCRIPT
A
©2018 Wilmington Trust Corporation and its affiliates. All rights reserved.
Municipal Fixed Income
Stephen Winterstein, Managing Director of Municipal Research & Head of Strategy
s U.S. Treasury (UST) interest rates trended higher over the first half of 2018, the tax-exempt municipal bond market followed suit and spent the entire first half underwater. But if the first three months of 2018 were decidedly negative, the second three months were a mirror image, producing an almost identical positive offset. As of March 31, the S&P Municipal Bond Index finished 1Q with a –0.923% return, with two of the three months falling in negative territory. Then in 2Q , as if to rewind the film, investors cobbled together two months of positive returns to print a +0.910% trailing three-month performance (Figure 1).
Despite the most recent counterpoising months—and most impressively, the S&P Municipal Bond Index’s +1.132% showing in May—the recovery was insufficient to bring year-to-date returns into the black. In point of fact, that same broad market benchmark printed a practically flat –0.021% return for the first six months of 2018. Interestingly, while three of the first six months of the year generated negative returns, the rolling trailing 1-year performance remained positive and was never in jeopardy of slipping underwater. Even in the wake of 2Q , investors continue to follow through with a constructive sentiment, and the S&P Municipal Bond Index sports a +0.441% total return, as of this writing. To close, it is apparent that domestic fixed income markets are captivated by global macro trends. The latest sociopolitical upheavals in Spain and Italy, the potential for a severe trade war with China, and President Trump’s meeting with Soviet President Vladimir Putin are but a few examples of pivotal events that can move market sentiment without so much as the slightest warning. All of that is to say that we are finally a bit more than back to even … for now.
Back to even … for now
QUARTERLY MARKE T COMMENTARY
c o n t i n u e d
2Q 2018
Robert Collins, CFAHead of Municipal Fixed [email protected]
MUNICIPAL RESEARCHStephen WintersteinManaging Director of Municipal Research & Head of Strategy [email protected]
Gerard DurrSenior Research [email protected]
Clyde Lane, Jr. Research Analyst [email protected]
Ted MolinSenior Research Analyst [email protected]
Karleen StrayerSenior Research [email protected]
Robert TiceResearch [email protected]
PORTFOLIO MGMT & TRADINGRebecca RogersDirector of Trading & Portfolio [email protected]
Maureen LawrenceSenior [email protected]
John MalloySenior Portfolio [email protected]
Please direct comments or questions to Robert Collins.
page 1 of 18
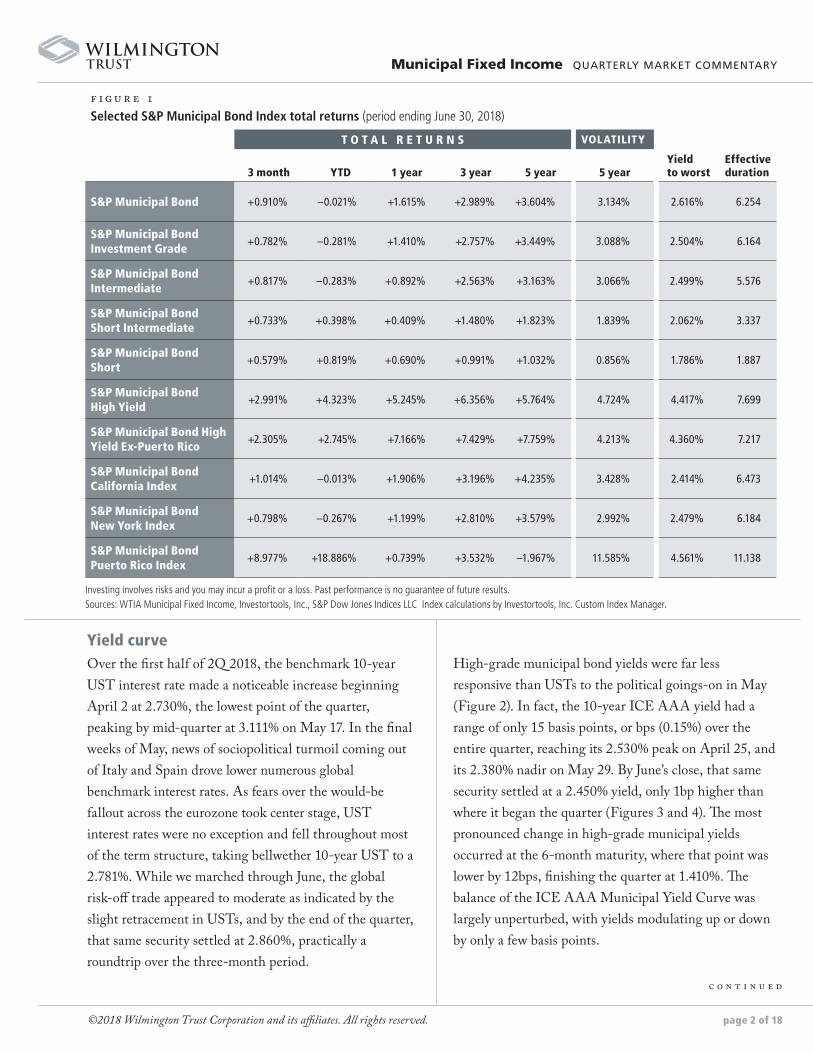
f i g u r e 1 Selected S&P Municipal Bond Index total returns (period ending June 30, 2018)
T O T A L R E T U R N S VOLATILITY
3 month YTD 1 year 3 year 5 year 5 year Yield to worst
Effective duration
S&P Municipal Bond +0.910% –0.021% +1.615% +2.989% +3.604% 3.134% 2.616% 6.254
S&P Municipal Bond Investment Grade
+0.782% –0.281% +1.410% +2.757% +3.449% 3.088% 2.504% 6.164
S&P Municipal Bond Intermediate
+0.817% –0.283% +0.892% +2.563% +3.163% 3.066% 2.499% 5.576
S&P Municipal Bond Short Intermediate
+0.733% +0.398% +0.409% +1.480% +1.823% 1.839% 2.062% 3.337
S&P Municipal Bond Short
+0.579% +0.819% +0.690% +0.991% +1.032% 0.856% 1.786% 1.887
S&P Municipal Bond High Yield
+2.991% +4.323% +5.245% +6.356% +5.764% 4.724% 4.417% 7.699
S&P Municipal Bond High Yield Ex-Puerto Rico
+2.305% +2.745% +7.166% +7.429% +7.759% 4.213% 4.360% 7.217
S&P Municipal Bond California Index
+1.014% –0.013% +1.906% +3.196% +4.235% 3.428% 2.414% 6.473
S&P Municipal Bond New York Index
+0.798% –0.267% +1.199% +2.810% +3.579% 2.992% 2.479% 6.184
S&P Municipal Bond Puerto Rico Index
+8.977% +18.886% +0.739% +3.532% –1.967% 11.585% 4.561% 11.138
Investing involves risks and you may incur a profit or a loss. Past performance is no guarantee of future results.Sources: WTIA Municipal Fixed Income, Investortools, Inc., S&P Dow Jones Indices LLC Index calculations by Investortools, Inc. Custom Index Manager.
Municipal Fixed Income QUARTERLY MARKET COMMENTARY
©2018 Wilmington Trust Corporation and its affiliates. All rights reserved. page 2 of 18
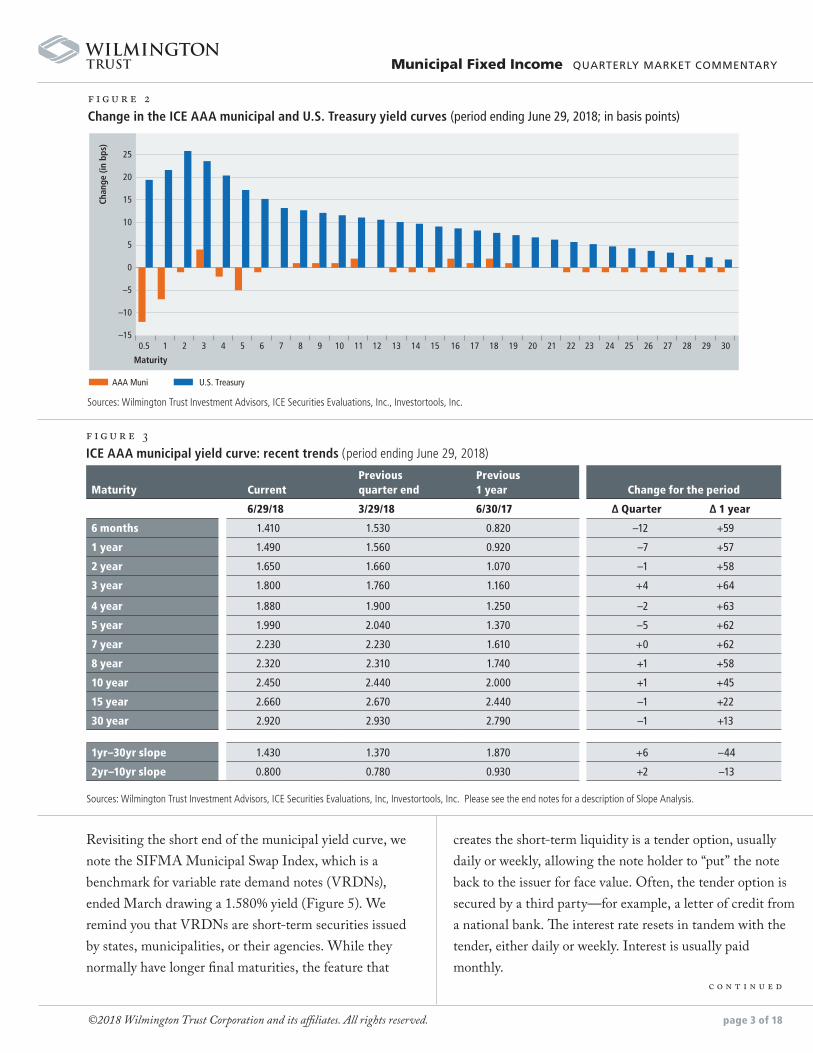
High-grade municipal bond yields were far less responsive than USTs to the political goings-on in May (Figure 2). In fact, the 10-year ICE AAA yield had a range of only 15 basis points, or bps (0.15%) over the entire quarter, reaching its 2.530% peak on April 25, and its 2.380% nadir on May 29. By June’s close, that same security settled at a 2.450% yield, only 1bp higher than where it began the quarter (Figures 3 and 4). The most pronounced change in high-grade municipal yields occurred at the 6-month maturity, where that point was lower by 12bps, finishing the quarter at 1.410%. The balance of the ICE AAA Municipal Yield Curve was largely unperturbed, with yields modulating up or down by only a few basis points.
Yield curveOver the first half of 2Q 2018, the benchmark 10-year UST interest rate made a noticeable increase beginning April 2 at 2.730%, the lowest point of the quarter, peaking by mid-quarter at 3.111% on May 17. In the final weeks of May, news of sociopolitical turmoil coming out of Italy and Spain drove lower numerous global benchmark interest rates. As fears over the would-be fallout across the eurozone took center stage, UST interest rates were no exception and fell throughout most of the term structure, taking bellwether 10-year UST to a 2.781%. While we marched through June, the global risk-off trade appeared to moderate as indicated by the slight retracement in USTs, and by the end of the quarter, that same security settled at 2.860%, practically a roundtrip over the three-month period.
c o n t i n u e d
c o n t i n u e d
Revisiting the short end of the municipal yield curve, we note the SIFMA Municipal Swap Index, which is a benchmark for variable rate demand notes (VRDNs), ended March drawing a 1.580% yield (Figure 5). We remind you that VRDNs are short-term securities issued by states, municipalities, or their agencies. While they normally have longer final maturities, the feature that
creates the short-term liquidity is a tender option, usually daily or weekly, allowing the note holder to “put” the note back to the issuer for face value. Often, the tender option is secured by a third party—for example, a letter of credit from a national bank. The interest rate resets in tandem with the tender, either daily or weekly. Interest is usually paid monthly.
©2018 Wilmington Trust Corporation and its affiliates. All rights reserved. page 3 of 18
Municipal Fixed Income QUARTERLY MARKET COMMENTARY
Chan
ge (i
n bp
s)
Maturity
AAA Muni U.S. Treasury
–15
–10
–5
0
5
10
15
20
25
0.5 1 2 3 4 5 6 7 8 9 10 11 12 13 14 15 16 17 18 19 20 21 22 23 24 25 26 27 28 29 30
f i g u r e 2 Change in the ICE AAA municipal and U.S. Treasury yield curves (period ending June 29, 2018; in basis points)
Sources: Wilmington Trust Investment Advisors, ICE Securities Evaluations, Inc., Investortools, Inc.
Sources: Wilmington Trust Investment Advisors, ICE Securities Evaluations, Inc, Investortools, Inc. Please see the end notes for a description of Slope Analysis.
f i g u r e 3 ICE AAA municipal yield curve: recent trends (period ending June 29, 2018)
Maturity CurrentPrevious quarter end
Previous 1 year Change for the period
6/29/18 3/29/18 6/30/17 ∆ Quarter ∆ 1 year
6 months 1.410 1.530 0.820 –12 +59
1 year 1.490 1.560 0.920 –7 +57
2 year 1.650 1.660 1.070 –1 +58
3 year 1.800 1.760 1.160 +4 +64
4 year 1.880 1.900 1.250 –2 +63
5 year 1.990 2.040 1.370 –5 +62
7 year 2.230 2.230 1.610 +0 +62
8 year 2.320 2.310 1.740 +1 +58
10 year 2.450 2.440 2.000 +1 +45
15 year 2.660 2.670 2.440 –1 +22
30 year 2.920 2.930 2.790 –1 +13
1yr–30yr slope 1.430 1.370 1.870 +6 –44
2yr–10yr slope 0.800 0.780 0.930 +2 –13
c o n t i n u e d
©2018 Wilmington Trust Corporation and its affiliates. All rights reserved. page 4 of 18
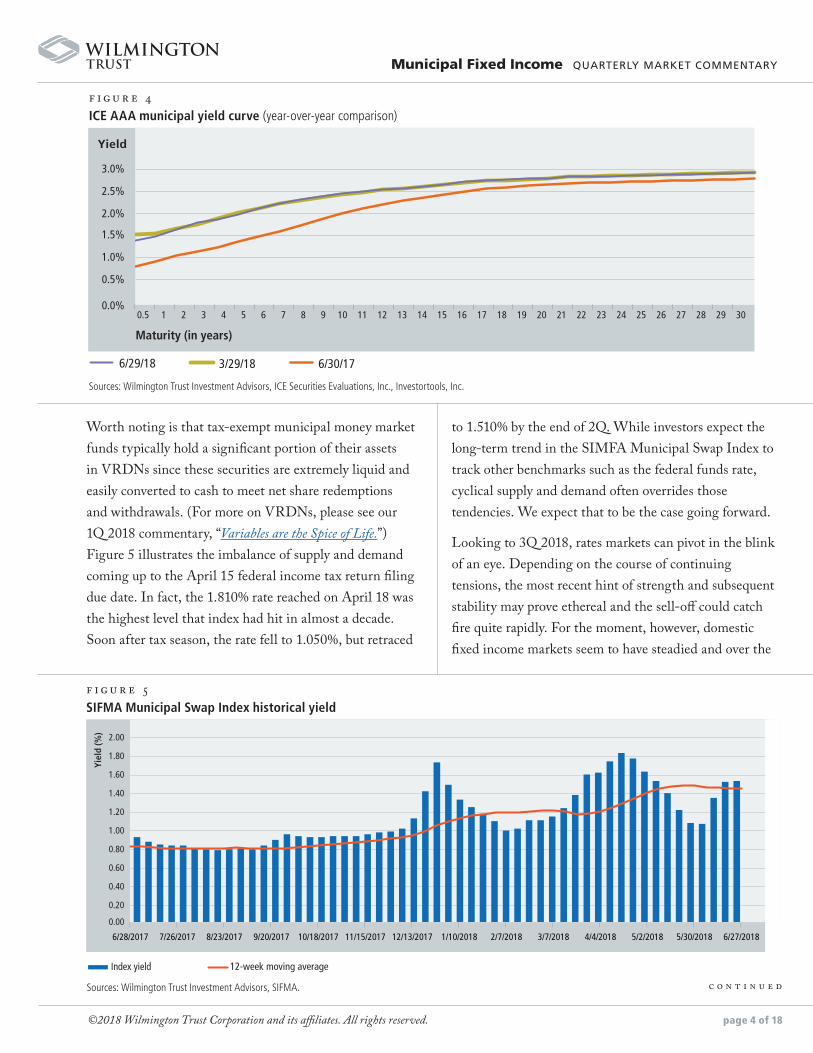
Worth noting is that tax-exempt municipal money market funds typically hold a significant portion of their assets in VRDNs since these securities are extremely liquid and easily converted to cash to meet net share redemptions and withdrawals. (For more on VRDNs, please see our 1Q 2018 commentary, “Variables are the Spice of Life.”) Figure 5 illustrates the imbalance of supply and demand coming up to the April 15 federal income tax return filing due date. In fact, the 1.810% rate reached on April 18 was the highest level that index had hit in almost a decade. Soon after tax season, the rate fell to 1.050%, but retraced
to 1.510% by the end of 2Q. While investors expect the long-term trend in the SIMFA Municipal Swap Index to track other benchmarks such as the federal funds rate, cyclical supply and demand often overrides those tendencies. We expect that to be the case going forward.
Looking to 3Q 2018, rates markets can pivot in the blink of an eye. Depending on the course of continuing tensions, the most recent hint of strength and subsequent stability may prove ethereal and the sell-off could catch fire quite rapidly. For the moment, however, domestic fixed income markets seem to have steadied and over the
Municipal Fixed Income QUARTERLY MARKET COMMENTARY
f i g u r e 4ICE AAA municipal yield curve (year-over-year comparison)
Sources: Wilmington Trust Investment Advisors, ICE Securities Evaluations, Inc., Investortools, Inc.
Yield
Maturity (in years)
6/29/18 3/29/18 6/30/17
0.0%
0.5%
1.0%
1.5%
2.0%
2.5%
3.0%
0.5 1 2 3 4 5 6 7 8 9 10 11 12 13 14 15 16 17 18 19 20 21 22 23 24 25 26 27 28 29 30
Sources: Wilmington Trust Investment Advisors, SIFMA.
f i g u r e 5 SIFMA Municipal Swap Index historical yield
Yiel
d (%
)
Index yield 12-week moving average
0.00
0.20
0.40
0.60
0.80
1.00
1.20
1.40
1.60
1.80
2.00
6/28/2017 7/26/2017 8/23/2017 9/20/2017 10/18/2017 11/15/2017 12/13/2017 1/10/2018 2/7/2018 3/7/2018 4/4/2018 5/2/2018 5/30/2018 6/27/2018
c o n t i n u e d
©2018 Wilmington Trust Corporation and its affiliates. All rights reserved. page 5 of 18
Municipal Fixed Income QUARTERLY MARKET COMMENTARY
near term will likely take their collective and direct cues from overseas news.
A few further thoughts on the yield curve. Returning to Figure 2, you can see the pronounced upward shift in UST interest rates across the entire term structure while high-grade municipal yields dropped in the 6-month and 1-year maturities, then vacillated slightly over the balance of the curve. The relative change in yields between USTs and high-grade municipal bonds caused tax-exempt securities
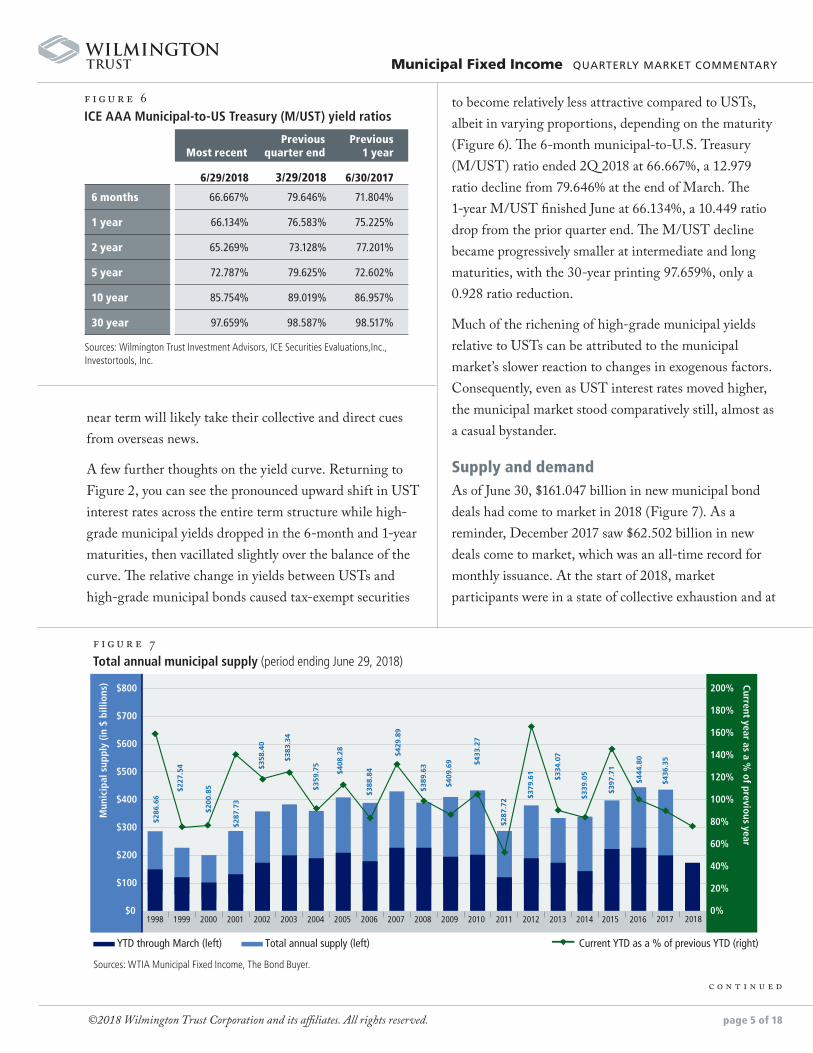
to become relatively less attractive compared to USTs, albeit in varying proportions, depending on the maturity (Figure 6). The 6-month municipal-to-U.S. Treasury (M/UST) ratio ended 2Q 2018 at 66.667%, a 12.979 ratio decline from 79.646% at the end of March. The 1-year M/UST finished June at 66.134%, a 10.449 ratio drop from the prior quarter end. The M/UST decline became progressively smaller at intermediate and long maturities, with the 30-year printing 97.659%, only a 0.928 ratio reduction.
Much of the richening of high-grade municipal yields relative to USTs can be attributed to the municipal market’s slower reaction to changes in exogenous factors. Consequently, even as UST interest rates moved higher, the municipal market stood comparatively still, almost as a casual bystander.
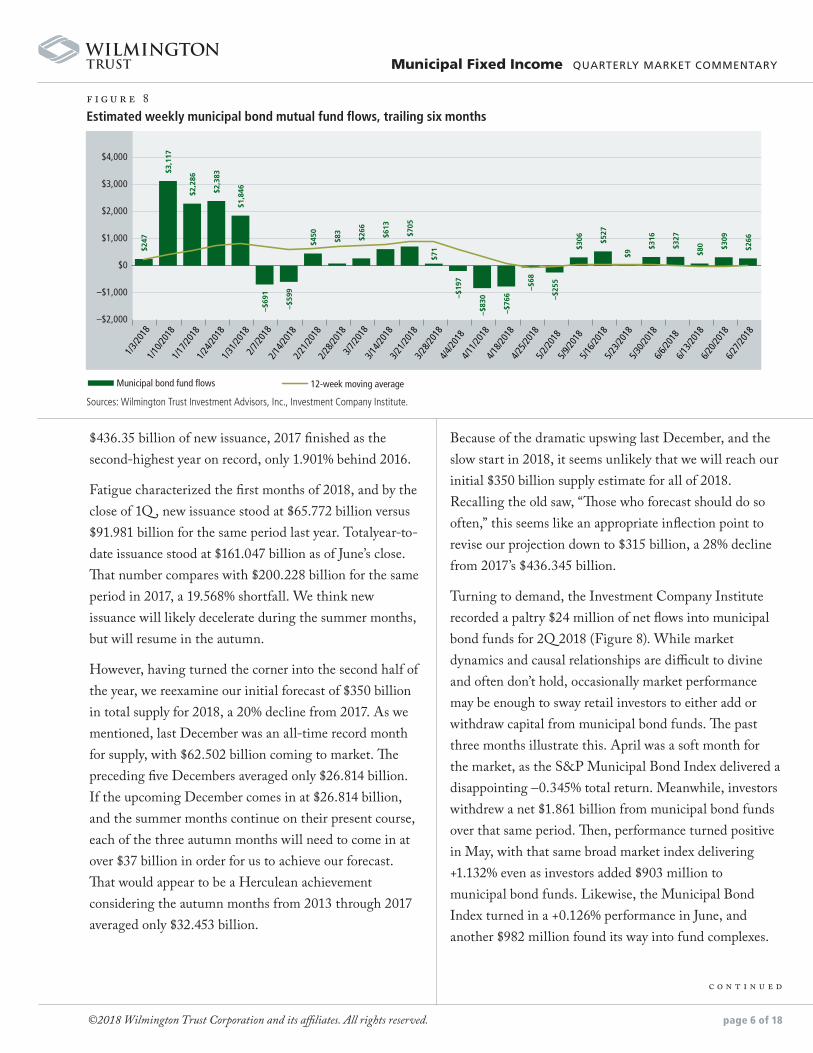
Supply and demandAs of June 30, $161.047 billion in new municipal bond deals had come to market in 2018 (Figure 7). As a reminder, December 2017 saw $62.502 billion in new deals come to market, which was an all-time record for monthly issuance. At the start of 2018, market participants were in a state of collective exhaustion and at
Most recentPrevious
quarter endPrevious
1 year
6/29/2018 3/29/2018 6/30/2017
6 months 66.667% 79.646% 71.804%
1 year 66.134% 76.583% 75.225%
2 year 65.269% 73.128% 77.201%
5 year 72.787% 79.625% 72.602%
10 year 85.754% 89.019% 86.957%
30 year 97.659% 98.587% 98.517%
Sources: Wilmington Trust Investment Advisors, ICE Securities Evaluations,Inc., Investortools, Inc.
f i g u r e 6 ICE AAA Municipal-to-US Treasury (M/UST) yield ratios
1998 1999 2000 2001 2002 2003 2004 2005 2006 2007 2008 2009 2010 2011 2012 2013 2014 2015 2016 2017 2018
Mun
icip
al s
uppl
y (in
$ b
illio
ns) Current year as a %
of previous year
YTD through March (left) Total annual supply (left) Current YTD as a % of previous YTD (right)
$286
.66
$227
.54
$200
.85
$287
.73
$358
.40
$383
.34
$359
.75
$408
.28
$388
.84
$429
.89
$389
.63
$409
.69 $4
33.2
7
$287
.72 $3
79.6
1
$334
.07
$339
.05
$397
.71
$444
.80
$436
.35
0%
20%
40%
60%
80%
100%
120%
140%
160%
180%
200%
$0
$100
$200
$300
$400
$500
$600
$700
$800
f i g u r e 7 Total annual municipal supply (period ending June 29, 2018)
Sources: WTIA Municipal Fixed Income, The Bond Buyer.
c o n t i n u e d
©2018 Wilmington Trust Corporation and its affiliates. All rights reserved. page 6 of 18
$436.35 billion of new issuance, 2017 finished as the second-highest year on record, only 1.901% behind 2016.
Fatigue characterized the first months of 2018, and by the close of 1Q , new issuance stood at $65.772 billion versus $91.981 billion for the same period last year. Totalyear-to-date issuance stood at $161.047 billion as of June’s close. That number compares with $200.228 billion for the same period in 2017, a 19.568% shortfall. We think new issuance will likely decelerate during the summer months, but will resume in the autumn.
However, having turned the corner into the second half of the year, we reexamine our initial forecast of $350 billion in total supply for 2018, a 20% decline from 2017. As we mentioned, last December was an all-time record month for supply, with $62.502 billion coming to market. The preceding five Decembers averaged only $26.814 billion. If the upcoming December comes in at $26.814 billion, and the summer months continue on their present course, each of the three autumn months will need to come in at over $37 billion in order for us to achieve our forecast. That would appear to be a Herculean achievement considering the autumn months from 2013 through 2017 averaged only $32.453 billion.
Because of the dramatic upswing last December, and the slow start in 2018, it seems unlikely that we will reach our initial $350 billion supply estimate for all of 2018. Recalling the old saw, “Those who forecast should do so often,” this seems like an appropriate inflection point to revise our projection down to $315 billion, a 28% decline from 2017’s $436.345 billion.
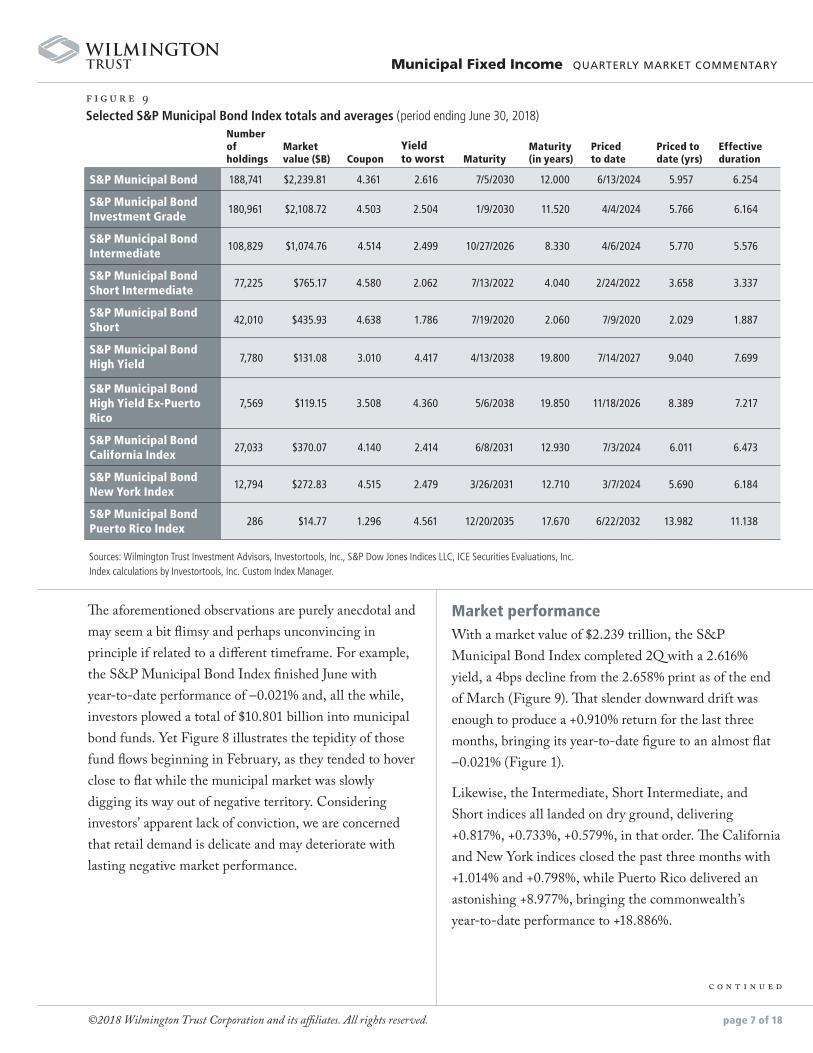
Turning to demand, the Investment Company Institute recorded a paltry $24 million of net flows into municipal bond funds for 2Q 2018 (Figure 8). While market dynamics and causal relationships are difficult to divine and often don’t hold, occasionally market performance may be enough to sway retail investors to either add or withdraw capital from municipal bond funds. The past three months illustrate this. April was a soft month for the market, as the S&P Municipal Bond Index delivered a disappointing –0.345% total return. Meanwhile, investors withdrew a net $1.861 billion from municipal bond funds over that same period. Then, performance turned positive in May, with that same broad market index delivering +1.132% even as investors added $903 million to municipal bond funds. Likewise, the Municipal Bond Index turned in a +0.126% performance in June, and another $982 million found its way into fund complexes.
Municipal Fixed Income QUARTERLY MARKET COMMENTARY
f i g u r e 8 Estimated weekly municipal bond mutual fund flows, trailing six months
Sources: Wilmington Trust Investment Advisors, Inc., Investment Company Institute.
Municipal bond fund �ows 12-week moving average
–$2,000
–$1,000
$0
$1,000
$2,000
$3,000
$4,000
3/28/2
018
4/4/20
184/1
1/201
84/1
8/201
84/2
5/201
85/2
/2018
5/9/20
185/1
6/201
85/2
3/201
85/3
0/201
86/6
/2018
6/13/2
018
6/20/2
018
6/27/2
018
3/21/2
018
3/14/2
018
3/7/20
18
2/28/2
018
2/21/2
018
2/14/2
018
2/7/20
18
1/31/2
018
1/24/2
018
1/17/2
018
1/10/2
018
1/3/20
18
$266
$309
$80 $3
27
$316
$9
$527
$306
–$25
5
–$68
–$76
6
–$83
0–$19
7
$71
$705
$613
$266
$83
$450
–$59
9
–$69
1
$1,8
46
$2,3
83
$2,2
86 $3
,117
$247
©2018 Wilmington Trust Corporation and its affiliates. All rights reserved.
c o n t i n u e d
page 7 of 18
Municipal Fixed Income QUARTERLY MARKET COMMENTARY
The aforementioned observations are purely anecdotal and may seem a bit flimsy and perhaps unconvincing in principle if related to a different timeframe. For example, the S&P Municipal Bond Index finished June with year-to-date performance of –0.021% and, all the while, investors plowed a total of $10.801 billion into municipal bond funds. Yet Figure 8 illustrates the tepidity of those fund flows beginning in February, as they tended to hover close to flat while the municipal market was slowly digging its way out of negative territory. Considering investors’ apparent lack of conviction, we are concerned that retail demand is delicate and may deteriorate with lasting negative market performance.
Market performanceWith a market value of $2.239 trillion, the S&P Municipal Bond Index completed 2Q with a 2.616% yield, a 4bps decline from the 2.658% print as of the end of March (Figure 9). That slender downward drift was enough to produce a +0.910% return for the last three months, bringing its year-to-date figure to an almost flat –0.021% (Figure 1).
Likewise, the Intermediate, Short Intermediate, and Short indices all landed on dry ground, delivering +0.817%, +0.733%, +0.579%, in that order. The California and New York indices closed the past three months with +1.014% and +0.798%, while Puerto Rico delivered an astonishing +8.977%, bringing the commonwealth’s year-to-date performance to +18.886%.
f i g u r e 9 Selected S&P Municipal Bond Index totals and averages (period ending June 30, 2018)
Sources: Wilmington Trust Investment Advisors, Investortools, Inc., S&P Dow Jones Indices LLC, ICE Securities Evaluations, Inc.Index calculations by Investortools, Inc. Custom Index Manager.
Number of holdings
Market value ($B) Coupon
Yield to worst Maturity
Maturity (in years)
Priced to date
Priced to date (yrs)
Effective duration
S&P Municipal Bond 188,741 $2,239.81 4.361 2.616 7/5/2030 12.000 6/13/2024 5.957 6.254
S&P Municipal Bond Investment Grade
180,961 $2,108.72 4.503 2.504 1/9/2030 11.520 4/4/2024 5.766 6.164
S&P Municipal Bond Intermediate
108,829 $1,074.76 4.514 2.499 10/27/2026 8.330 4/6/2024 5.770 5.576
S&P Municipal Bond Short Intermediate
77,225 $765.17 4.580 2.062 7/13/2022 4.040 2/24/2022 3.658 3.337
S&P Municipal Bond Short
42,010 $435.93 4.638 1.786 7/19/2020 2.060 7/9/2020 2.029 1.887
S&P Municipal Bond High Yield 7,780 $131.08 3.010 4.417 4/13/2038 19.800 7/14/2027 9.040 7.699
S&P Municipal Bond High Yield Ex-Puerto Rico
7,569 $119.15 3.508 4.360 5/6/2038 19.850 11/18/2026 8.389 7.217
S&P Municipal Bond California Index
27,033 $370.07 4.140 2.414 6/8/2031 12.930 7/3/2024 6.011 6.473
S&P Municipal Bond New York Index
12,794 $272.83 4.515 2.479 3/26/2031 12.710 3/7/2024 5.690 6.184
S&P Municipal Bond Puerto Rico Index
286 $14.77 1.296 4.561 12/20/2035 17.670 6/22/2032 13.982 11.138
©2018 Wilmington Trust Corporation and its affiliates. All rights reserved.
c o n t i n u e d
Core narrativeThe municipal bond market spent the first half of 2018 in negative territory. The past 90 days were far more constructive than the first 90; performance has finally turned the corner and appears to be on firm footing, at least temporarily. Often, negative news can spark a risk-off trade that prompts a flight to quality and consequent lower interest rates. We have seen examples of this in the past several months. That sociopolitical events can catalyze such trends is obvious and inevitable, yet these episodes are as a rule capricious. Meanwhile, the dearth of tax-exempt municipal supply has served as a price support mechanism and even if new issuance gathers measured momentum, we are comfortable that investors will be able to digest it without disruption.
Many affluent residents of New Jersey and other Northeastern states are likely to periodically take stock of the costs and benefits of continuing to reside in their high-tax, low-growth states. They might be wise to include in their cost-benefit analysis their states’ economic climates as well as the pros and cons of investing in state and local tax-exempt bonds. Over the past two years, Wilmington Trust’s Municipal Fixed Income team has found profitable opportunities for investment in New Jersey state and local debt. We made a call that New Jersey’s credit had reached an inflection point after a period of decline and was poised to improve, which has proven to be the case. At the same time, New Jersey faces new decisions related to taxing and spending policy that may affect its future growth potential.
The Garden State’s economy is largely flourishingEvery state has its challenges. New Jersey is no exception, and we will delve into a few of them later in this commentary contribution. Notwithstanding those
page 8 of 18
Municipal Fixed Income QUARTERLY MARKET COMMENTARY
Jersey Strong?Ted Molin, Senior Research Analyst
Sources: Bureau of Labor Statistics. Last pointed plotted: U.S. June 2018; New Jersey May 2018.
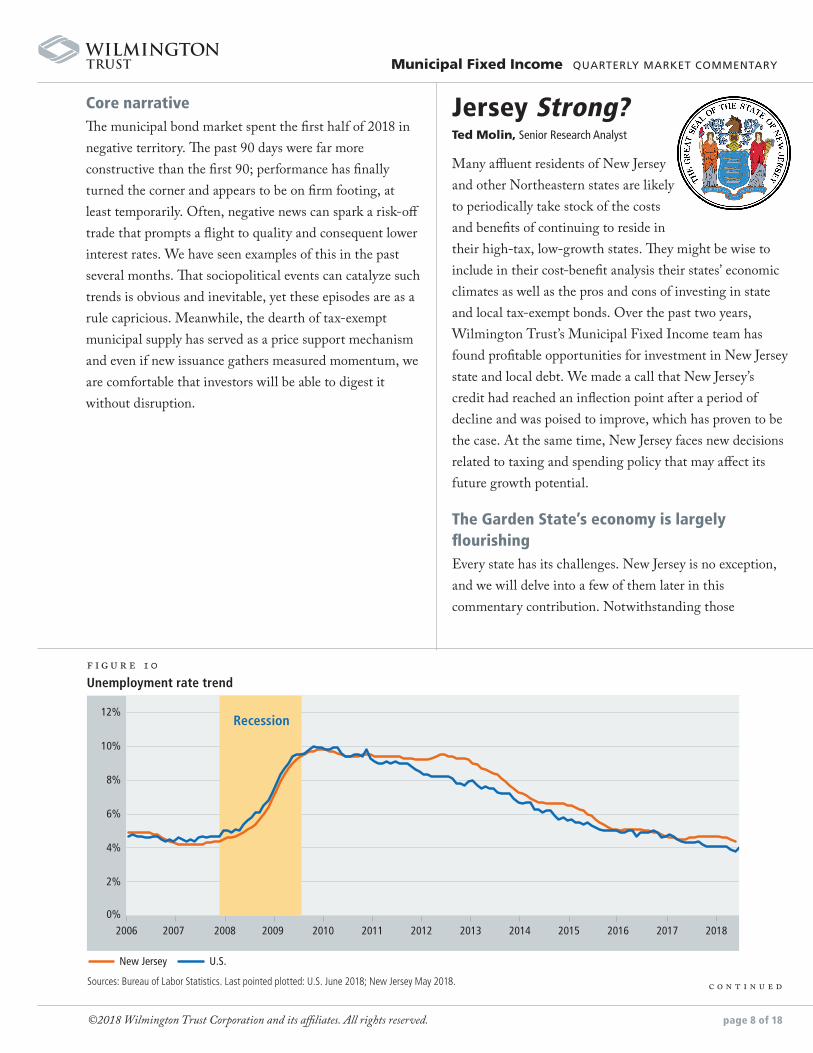
f i g u r e 10 Unemployment rate trend
0%
2%
4%
6%
8%
10%
12%
2006 2007 2008 2009 2010 2011 2012 2013 2014 2015 2016 2017 2018
New Jersey U.S.
Recession
©2018 Wilmington Trust Corporation and its affiliates. All rights reserved.
difficulties, however, it also has one of the U.S.’s most advanced and diverse economies with wealth and income levels far in excess of national averages. New Jersey’s economy is now doing acceptably well, although its recent growth has lagged the nation’s. Over the last five years, the state’s real GDP has grown at a low annual rate of 0.8%, compared to a good annual rate of 2.2% in the U.S.1
In 2018, employment in New Jersey was 4.3 million, down slightly from 2017 but up a great deal from the depths of the Great Recession. However, its average annual employment growth rate over the last 10 years has been low at 0.3%, compared to a moderate rate of 1.1% in the U.S. In May 2018, the New Jersey’s unemployment rate was moderate at 4.4%, down favorably from an average of 4.6% in 2017, but higher than the U.S. rate of 4% (Figure 10).
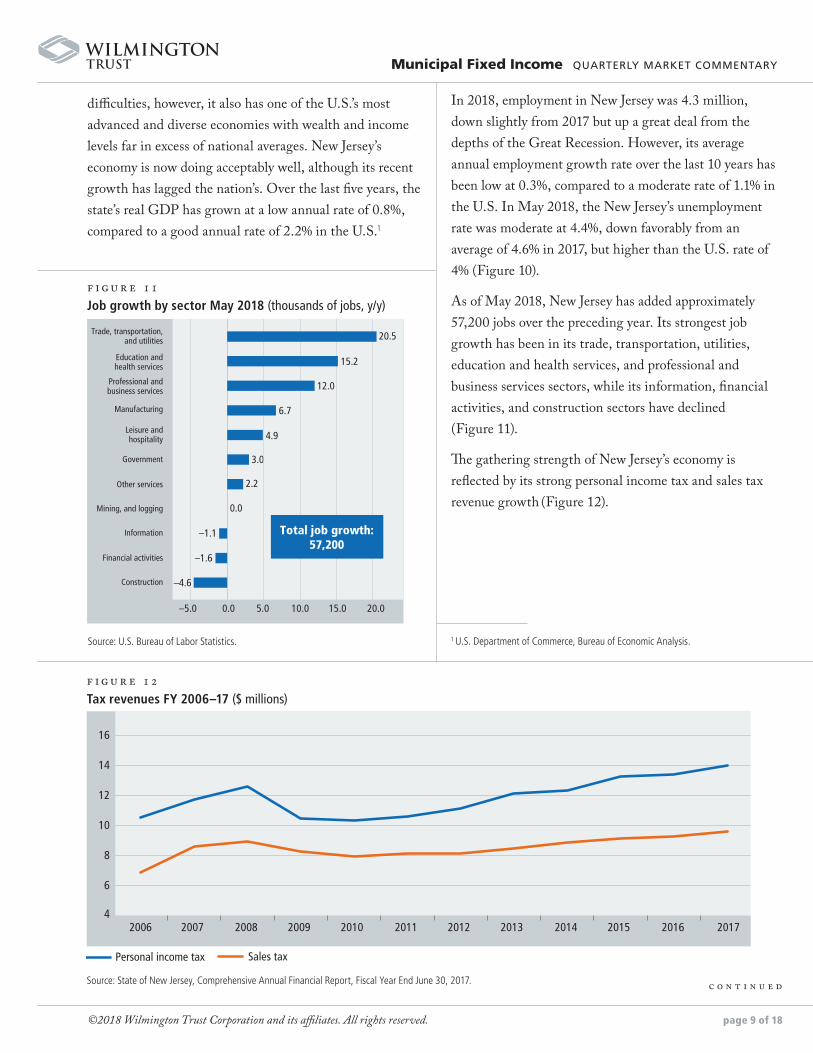
As of May 2018, New Jersey has added approximately 57,200 jobs over the preceding year. Its strongest job growth has been in its trade, transportation, utilities, education and health services, and professional and business services sectors, while its information, financial activities, and construction sectors have declined (Figure 11).
The gathering strength of New Jersey’s economy is reflected by its strong personal income tax and sales tax revenue growth (Figure 12).
page 9 of 18
c o n t i n u e d
Municipal Fixed Income QUARTERLY MARKET COMMENTARY
f i g u r e 11Job growth by sector May 2018 (thousands of jobs, y/y)
–1.6
–1.1
0.0
2.2
3.0
4.9
6.7
12.0
15.2
20.5
–5.0 0.0 5.0 10.0 15.0 20.0
Total job growth:57,200
Trade, transportation,and utilities
Education andhealth services
Professional andbusiness services
Manufacturing
Leisure andhospitality
Government
Other services
Mining, and logging
Information
Financial activities
Construction –4.6
Source: U.S. Bureau of Labor Statistics.
f i g u r e 12 Tax revenues FY 2006–17 ($ millions)
2006 2007 2008 2009 2010 2011 2012 2013 2014 2015 2016 2017
6
4
8
10
12
14
16
Personal income tax Sales tax
Source: State of New Jersey, Comprehensive Annual Financial Report, Fiscal Year End June 30, 2017.
1 U.S. Department of Commerce, Bureau of Economic Analysis.
©2018 Wilmington Trust Corporation and its affiliates. All rights reserved.
Two differentiators in particular that bode well for a continuing enviable economy are:
• Corporate diversity—Few other states can boast of the diversity of its major industries and employers. Important New Jersey economic sectors include pharmaceuticals, financial services, education and health services, manufacturing, construction, transportation, and warehousing. New Jersey’s 10 largest employers showcase its economic diversity. They include UPS, Verizon Communications, Johnson & Johnson, United Airlines, PSE&G, and Bank of America.
• Strategic location—New Jersey benefits from its excellent strategic location along the Northeastern U.S. corridor and the presence of vital transportation infrastructure, including major highways, port facilities, and Newark Liberty International Airport, all of which supports its burgeoning transportation and warehousing sector. Although Benjamin Franklin is said to have called New Jersey “a barrel open at both ends” because of its proximity to New York and Philadelphia, this has also been a source of strength to the state. South Jersey benefits from excellent access to Philadelphia and its surrounding metropolitan area as well as an improving local economy. Its key credit challenges include exposure to Philadelphia’s economic cycles, a long-term industrial manufacturing decline, and a flat local housing market. These are outweighed by its key credit strengths, including a strong Philadelphia economic anchor, a slow but accelerating recovery, a growing transportation and warehousing sector, and strong higher education, health services, and food manufacturing sectors.
Meanwhile, North Jersey benefits from good access to New York City as well as a wealthy and sophisticated economy of its own. Its key credit challenges include a high cost of living, exposure to New York City’s
economic cycles, and heavy dependence on the volatile financial services industry. Mitigating credit strengths include North Jersey’s participation in the large and diverse New York City metropolitan area economy, diverse and sophisticated local economy, very strong wealth levels, well-established suburban communities, and good public schools that are attracting young families from New York City.
A political look-back: the Christie years. Although New Jersey Governor Chris Christie was deeply unpopular when he left office in January 2018, reaching a record low approval rating of 15% according to one Quinnipiac University Poll,2 his legacy may be underrated. A Republican, Governor Christie served from 2010 to 2018. During his two terms, significant economic and fiscal progress in New Jersey was overshadowed by repeated ratings downgrades (11, by one count), his strong and controversial personality, the George Washington Bridge lane closing scandal (“Bridgegate”), and his quixotic run for the presidency. Governor Christie’s approach to stimulating economic growth was to hold the line on most tax increases while providing corporate tax breaks for firms, such as Prudential Financial, to remain and expand in the state. By one count, his administration approved $8 billion of incentives for 355 economic development projects.3
New Jersey’s budget remained structurally imbalanced, meaning that it achieved nominal balance through frequent use of one-time revenues or cuts. However, under Governor Christie, the state narrowed its deficit, grew its revenues, contained its expenses, reduced the number of state government employees, increased its reserves, limited its debt growth, and began to systematically fund its pension plans, albeit at lower-than-actually-required levels. The Christie administration also systematically reduced the state’s exposure to overly risky variable rate debt and swaps. It averted a potential bankruptcy of Atlantic City, which has lately made sound economic and financial progress with state support. Despite a persistent structural
page 10 of 18
Municipal Fixed Income QUARTERLY MARKET COMMENTARY
c o n t i n u e d
2 Politico, “Christie on 15 percent approval rating: 'I don’t care,'” June 20, 2017.3 The Wall Street Journal, “New Jersey’s Corporate Tax Breaks Threaten Budget,”
June 14, 2018.
©2018 Wilmington Trust Corporation and its affiliates. All rights reserved. page 11 of 18
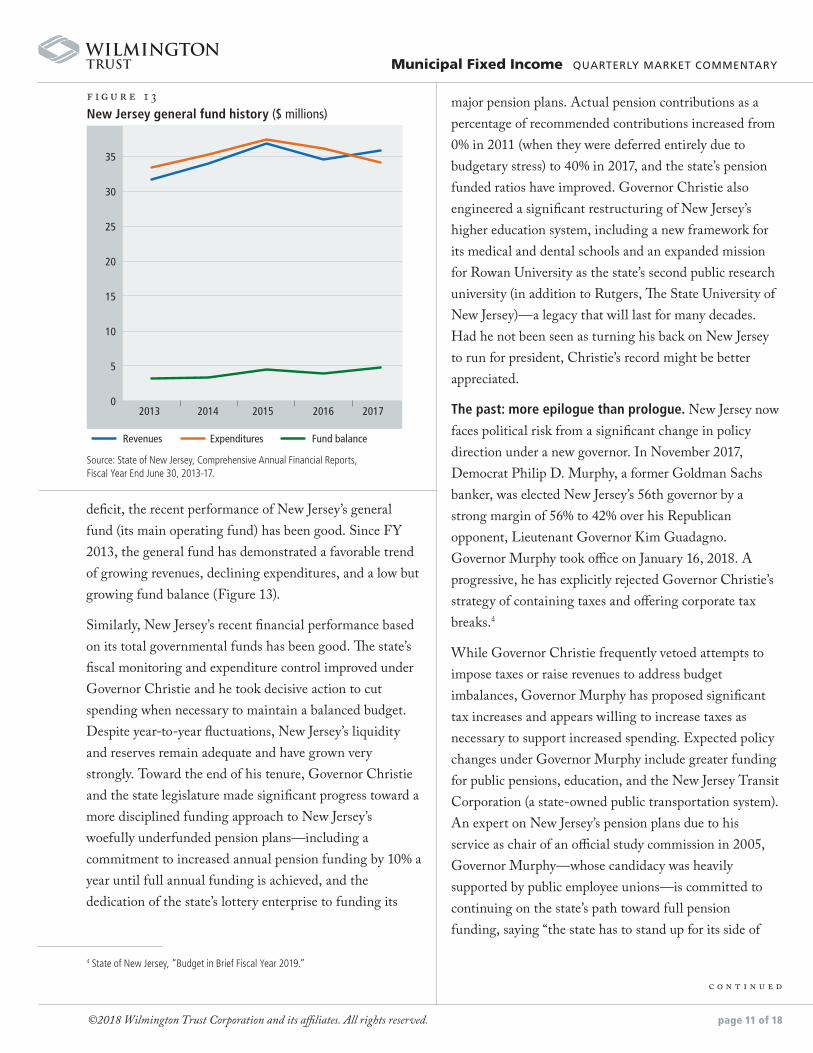
deficit, the recent performance of New Jersey’s general fund (its main operating fund) has been good. Since FY 2013, the general fund has demonstrated a favorable trend of growing revenues, declining expenditures, and a low but growing fund balance (Figure 13).
Similarly, New Jersey’s recent financial performance based on its total governmental funds has been good. The state’s fiscal monitoring and expenditure control improved under Governor Christie and he took decisive action to cut spending when necessary to maintain a balanced budget. Despite year-to-year fluctuations, New Jersey’s liquidity and reserves remain adequate and have grown very strongly. Toward the end of his tenure, Governor Christie and the state legislature made significant progress toward a more disciplined funding approach to New Jersey’s woefully underfunded pension plans—including a commitment to increased annual pension funding by 10% a year until full annual funding is achieved, and the dedication of the state’s lottery enterprise to funding its
major pension plans. Actual pension contributions as a percentage of recommended contributions increased from 0% in 2011 (when they were deferred entirely due to budgetary stress) to 40% in 2017, and the state’s pension funded ratios have improved. Governor Christie also engineered a significant restructuring of New Jersey’s higher education system, including a new framework for its medical and dental schools and an expanded mission for Rowan University as the state’s second public research university (in addition to Rutgers, The State University of New Jersey)—a legacy that will last for many decades. Had he not been seen as turning his back on New Jersey to run for president, Christie’s record might be better appreciated.
The past: more epilogue than prologue. New Jersey now faces political risk from a significant change in policy direction under a new governor. In November 2017, Democrat Philip D. Murphy, a former Goldman Sachs banker, was elected New Jersey’s 56th governor by a strong margin of 56% to 42% over his Republican opponent, Lieutenant Governor Kim Guadagno. Governor Murphy took office on January 16, 2018. A progressive, he has explicitly rejected Governor Christie’s strategy of containing taxes and offering corporate tax breaks.4
While Governor Christie frequently vetoed attempts to impose taxes or raise revenues to address budget imbalances, Governor Murphy has proposed significant tax increases and appears willing to increase taxes as necessary to support increased spending. Expected policy changes under Governor Murphy include greater funding for public pensions, education, and the New Jersey Transit Corporation (a state-owned public transportation system). An expert on New Jersey’s pension plans due to his service as chair of an official study commission in 2005, Governor Murphy—whose candidacy was heavily supported by public employee unions—is committed to continuing on the state’s path toward full pension funding, saying “the state has to stand up for its side of
Municipal Fixed Income QUARTERLY MARKET COMMENTARY
c o n t i n u e d
Source: State of New Jersey, Comprehensive Annual Financial Reports, Fiscal Year End June 30, 2013-17.
f i g u r e 13 New Jersey general fund history ($ millions)
0
5
10
15
20
25
30
35
Revenues Expenditures Fund balance
2013 2014 2015 2016 2017
4 State of New Jersey, “Budget in Brief Fiscal Year 2019.”
©2018 Wilmington Trust Corporation and its affiliates. All rights reserved. page 12 of 18
the bargain. Period.”5 In his proposed budget for FY 2019, Governor Murphy denounced what he called “short-term gimmicks” under the previous administration and proposed significant increases in taxing and spending.6 He called for a spending increase of $2.7 billion, up nearly 8% from the previous year, and a pension funding increase of 28%, to be financed with $2 billion in new revenues. Proposed new funding sources included an increase in the state sales tax rate from 6.625% to 7%, new taxes on ride- and home-sharing, and a new top tax rate of 10.75% on incomes over $1 million (the so-called “millionaire’s tax”), which was approved by the state legislature many times under Governor Christie but vetoed by him each time.
A New Deal. After meeting resistance to his proposed tax increases from leaders in the Democratic-controlled state legislature, Governor Murphy reached a last-minute compromise and averted a government shutdown by
leaving the state sales tax rate unchanged at 6.625%, but imposing the millionaire’s tax rate of 10.75% on New Jerseyans making over $5 million per year. The state’s leaders skipped Governor Murphy’s proposed sales tax increase, saying it was no longer needed because of the U.S. Supreme Court’s June 2018 decision in South Dakota v. Wayfair permitting states to tax online sales, which is expected to result in increased sales tax revenues, as well as a repatriation of moneys from overseas. They also agreed to a four-year surcharge on corporations earning more than $1 million per year, raising the income tax rate from 9% to 11.5% for the next two years, and lowering it to 10.5% in the succeeding two years.7 At 11.5%, New Jersey’s corporate income tax rate is now the second highest in the nation, after Iowa’s 12%.8 Typically, tax increases such as these would be viewed as having at least a temporarily beneficial effect on the state’s credit by reducing its deficit, but in this case they have been matched by equal or greater spending. To the extent that this increased spending expands entitlement programs, it could also reduce New Jersey’s future expenditure flexibility.
Municipal Fixed Income QUARTERLY MARKET COMMENTARY
c o n t i n u e d
f i g u r e 1 4New Jersey debt, OPEB, and pension liabilities ($ billions)
$0
$10
$20
$30
$40
$50
$60
$70
$80
2015
Bonded debt Unfunded OPEB liability Net pension liability (GASB 67)
2016 2017
Source: State of New Jersey, Comprehensive Annual Financial Reports, Fiscal Year End June 30, 2015-17.
5 The Trentonian, October 17, 2016.
6 Gibbons P.C., “Governor Murphy Delivers Fiscal Year 2019 Budget Address”; State of New Jersey, “Budget in Brief Fiscal Year 2019.”
7 ADVFN, “New Jersey Governor, Lawmakers Reach Budget Deal, Avoid Shutdown – Update”, June 30, 2018.
8 Tax Foundation, “State Corporate Income Tax Rates and Brackets for 2018”, February 2018.
©2018 Wilmington Trust Corporation and its affiliates. All rights reserved. page 13 of 18
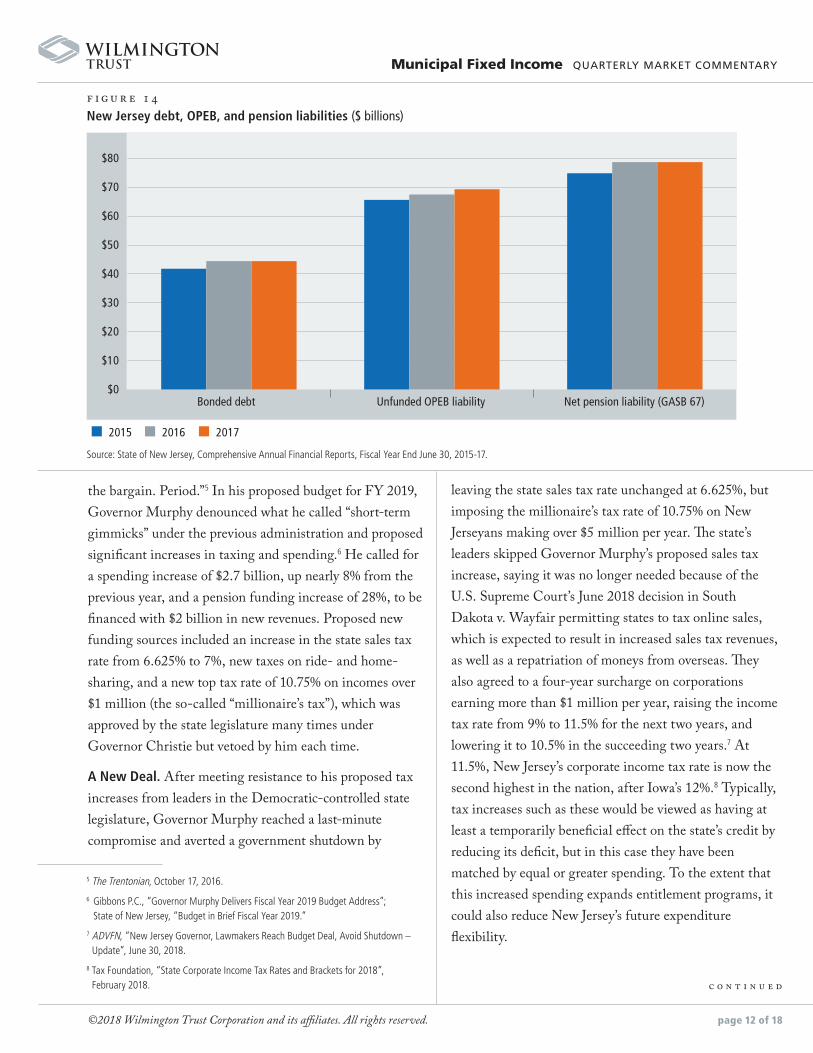
Keeping it real: fiscal challenges Despite recent progress, New Jersey faces severe fiscal challenges, which will weigh on its credit profile and ratings for many years. Most significantly, it continues to be burdened by extraordinarily large unfunded pension and OPEB liabilities, which dwarf the state’s bonded debt
(Figure 14).
According to a recent study by The Pew Charitable Trusts, New Jersey’s combined pension funded ratio in 2016 was exceedingly low at 31%, compared to a 50-state total of 66%.9 Although its pension assets have grown, they remain vulnerable to investment losses in the event of another recession. The state’s huge debt, OPEB, and pension liabilities will need to be paid by future generations of New Jerseyans. On a more positive note, New Jersey has committed to increase its annual pension contributions by one-tenth of the actuarially required amount in each fiscal year through FY 2023, when it expects to achieve full annual pension funding. To date, it has adhered to this schedule, reaching 60% funding in FY 2019. Favorably, the Supreme Court of New Jersey held in 2015 that pension obligations are not enforceable and legally binding long-term financial commitments of the state (unlike in some other states, such as Illinois), which reduces funding discipline but gives New Jersey more flexibility to reduce or defer pension payments in case of future fiscal stress.
In another favorable ruling giving the state more flexibility, the state supreme court held in 2016 that public employees do not have a contractual right to as-yet-unreceived pension cost-of-living increases, meaning the state can reduce or forego these at its discretion. While New Jersey’s state workforce is heavily unionized (nearly 89% of its public employees belonged to unions in 2017), the future influence of its public employee unions could be diminished by the U.S. Supreme Court’s June 2018 holding in Janus v. AFSCME that non-union public
workers are not required to have union fees taken from their paychecks. This could eventually reduce the funding and power of New Jersey’s public employee unions, which over the long run could potentially lead to less generous retirement benefits for public employees and lower the state’s enormous pension and OPEB liabilities.
The tyranny of taxation. High taxes are perhaps the main challenge to New Jersey’s economic growth prospects. Its recently enacted tax increases may also create a practical limit on the state’s future ability to raise taxes in the event of future fiscal hardship. A $10,000 limit on the federal income tax deduction for state and local taxes (SALT) under the federal Tax Cuts and Jobs Act of 2017 creates a de facto tax increase for many New Jersey taxpayers; in 2015, the average SALT deduction for New Jersey taxpayers was $17,850, the third highest of any state.10 New Jersey’s top personal income tax rate (10.75%), sales tax rate (6.625%), and corporate income tax rate (11.5%) are among the highest in all 50 states. In addition, New Jersey imposes a myriad of other taxes on, for example, alcoholic beverages, casinos, cigarettes,
Municipal Fixed Income QUARTERLY MARKET COMMENTARY
c o n t i n u e d
f i g u r e 15New Jersey personal income tax liability (%)
Income of $100,001 or more Income of $100,000 or less
0%
10%
20%
30%
40%
50%
60%
70%
80%
90%
100%
Number of �lers Liability
Source: State of New Jersey, Comprehensive Annual Financial Report, Fiscal Year End June 30, 2017.
9 The Pew Charitable Trusts, “The State Pension Funding Gap: 2016,” April 2018
10 Government Finance Officers Association, “The Impact of Eliminating the State and Local Tax Deduction,” 2015.
©2018 Wilmington Trust Corporation and its affiliates. All rights reserved. page 14 of 18
2017—renders the state vulnerable to expanded deficits in times of economic stress. A potential mismatch between New Jersey’s volatile revenues and its high fixed costs for school aid, municipal aid, and health and welfare services is an ongoing credit risk. Its steeply progressive tax structure also makes New Jersey highly dependent on a handful of very successful individuals who can easily affect its fiscal health by deciding to move away. New Jersey’s newly enacted “millionaire’s tax” gives it the nation’s third-highest marginal income tax rate, exceeding even those in the nearby high-tax states of Connecticut and New York, and far exceeding that of neighboring low-tax Pennsylvania.11 While it currently applies to the fewer than 1,800 New Jerseyans who make over $5 million a year, the state could readily reconsider lowering the minimum required income level to over $1 million, as was originally proposed.
For many affluent New Jerseyans, the next question becomes: Should I move to Florida or Texas? Neither of these states has a personal income tax. Famously, when hedge fund manager David Tepper (who, according to Forbes magazine is worth $11 billion in 2018) moved from New Jersey to Miami Beach in 2016, the loss of his income tax revenues caused a minor budget crisis for the state. Of all state resident taxpayers with incomes over $200,000 in 1997, approximately 40% were no longer filing resident returns in 2015.12 In 2017, roughly two-thirds of New Jersey’s $3.5 billion outflow went to Florida.13 Similarly, owners of corporations making $1 million or more must consider the impact of the state’s new 11.5% corporate tax rate (the second highest in the nation) on their businesses. In recent years, the state has experienced the downsizing or departure of major employers, especially in its important pharmaceuticals industry. This trend could accelerate as New Jersey’s corporate income tax reaches near-record heights.
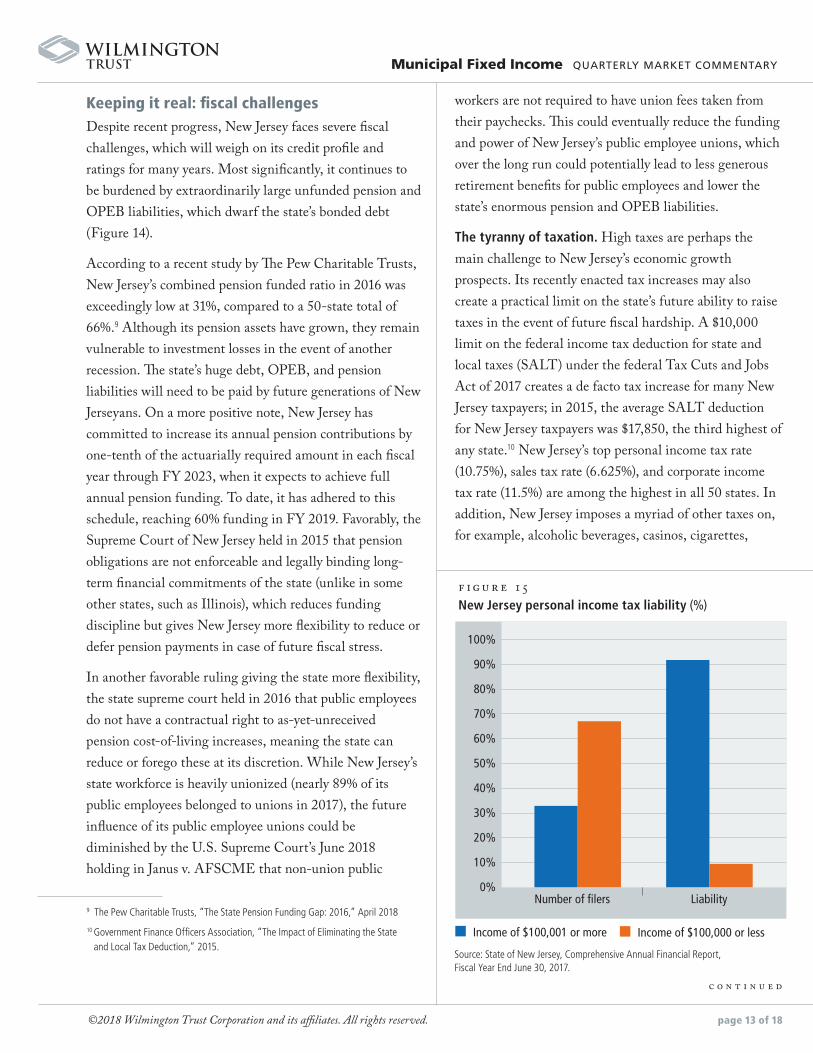
wholesale tobacco products, insurance premiums, motor fuels, petroleum gross receipts, realty transfers—and, possibly, inheritance and estate transfers, which ended as of January 1, 2018, but could be revived. New Jersey’s income tax is steeply progressive, which renders the state vulnerable to an exodus of high-income earners. In 2015, slightly more than 2% of the state’s personal income tax filers paid almost 41% of the state’s total personal income tax liability. The top 33% of filers (those making $100,001 or more) paid 91% of the total liability while the bottom 67% of filers paid less than 10% (Figure 15).
New Jersey’s heavy reliance on economically sensitive personal income, sales, and corporate income tax revenues—which represented 25%, 17%, and 4%, respectively, of its total governmental revenues in FY
Municipal Fixed Income QUARTERLY MARKET COMMENTARY
c o n t i n u e d
f i g u r e 16New Jersey v. Florida population growth ($ millions)
Florida New Jersey
1950 20170
5
10
15
20
25
Source: U.S. Census Bureau.
11 Tax Foundation, “State Individual Income Tax Rates and Brackets for 2018”, March 2018.
12 State of New Jersey, “Appendix I – Financial and Other Information Relating to the State of New Jersey.”
13 The Wall Street Journal, “New Jersey’s Tax Gift to Florida”, July 2, 2018.
©2018 Wilmington Trust Corporation and its affiliates. All rights reserved. page 15 of 18
“If we want to share the cake, the first condition is that
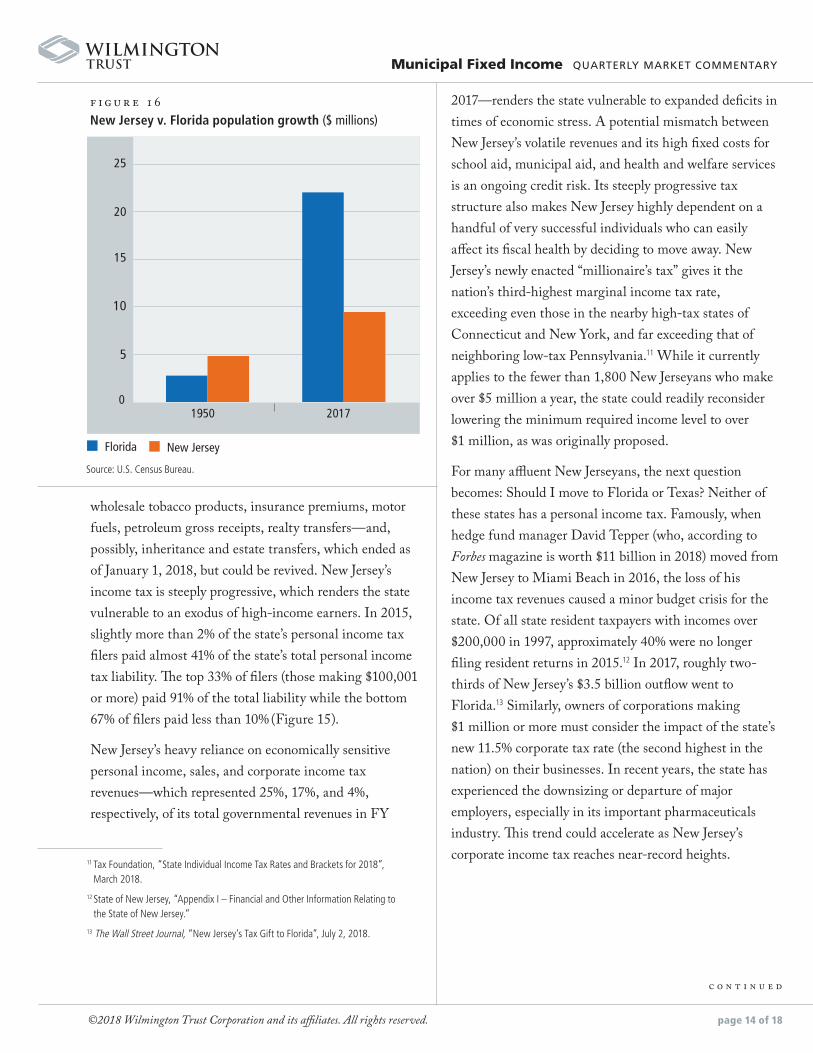
there is a cake.” New Jersey’s leaders may want to note these recent words of French President Emmanuel Macron.14 A comparison of economic and demographic growth in New Jersey, with its high taxes, and Florida, which has no personal income tax and a moderate 5.5% corporate income tax rate, tells a story. In the post-World War II era, New Jersey’s population has almost doubled, which is good, but Florida’s population has grown by nearly 8x (Figure 16).
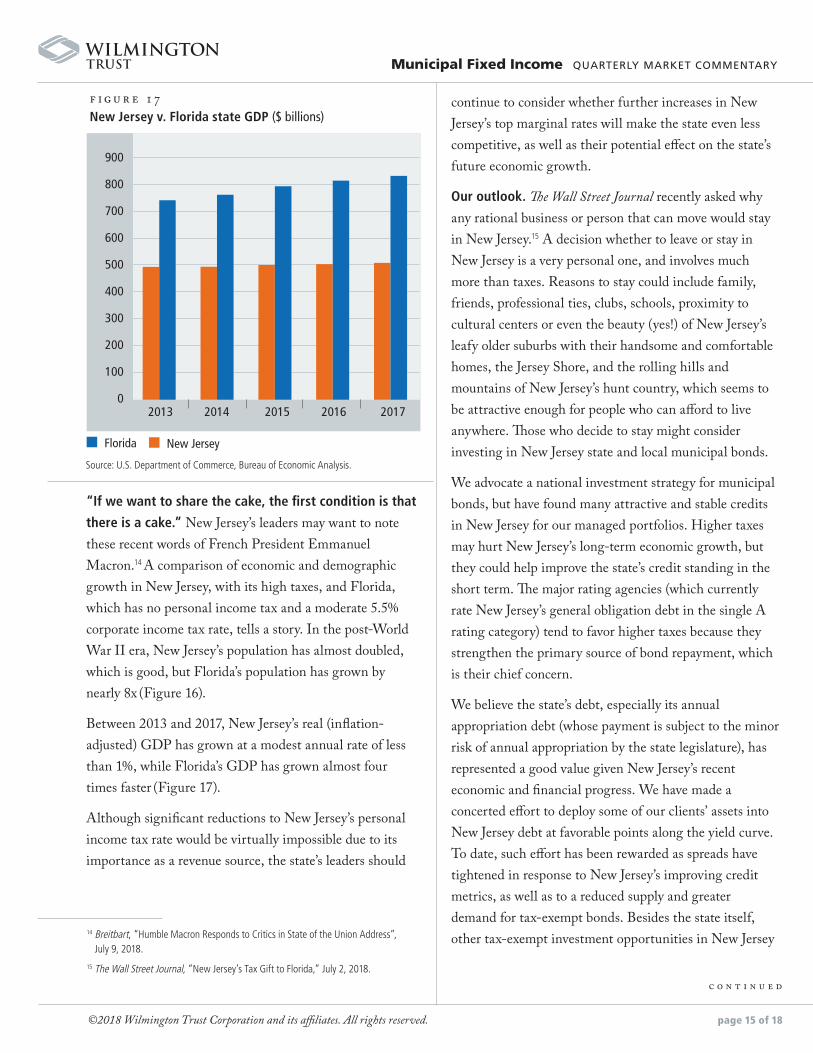
Between 2013 and 2017, New Jersey’s real (inflation-adjusted) GDP has grown at a modest annual rate of less than 1%, while Florida’s GDP has grown almost four times faster (Figure 17).
Although significant reductions to New Jersey’s personal income tax rate would be virtually impossible due to its importance as a revenue source, the state’s leaders should
continue to consider whether further increases in New Jersey’s top marginal rates will make the state even less competitive, as well as their potential effect on the state’s future economic growth.
Our outlook. The Wall Street Journal recently asked why any rational business or person that can move would stay in New Jersey.15 A decision whether to leave or stay in New Jersey is a very personal one, and involves much more than taxes. Reasons to stay could include family, friends, professional ties, clubs, schools, proximity to cultural centers or even the beauty (yes!) of New Jersey’s leafy older suburbs with their handsome and comfortable homes, the Jersey Shore, and the rolling hills and mountains of New Jersey’s hunt country, which seems to be attractive enough for people who can afford to live anywhere. Those who decide to stay might consider investing in New Jersey state and local municipal bonds.
We advocate a national investment strategy for municipal bonds, but have found many attractive and stable credits in New Jersey for our managed portfolios. Higher taxes may hurt New Jersey’s long-term economic growth, but they could help improve the state’s credit standing in the short term. The major rating agencies (which currently rate New Jersey’s general obligation debt in the single A rating category) tend to favor higher taxes because they strengthen the primary source of bond repayment, which is their chief concern.
We believe the state’s debt, especially its annual appropriation debt (whose payment is subject to the minor risk of annual appropriation by the state legislature), has represented a good value given New Jersey’s recent economic and financial progress. We have made a concerted effort to deploy some of our clients’ assets into New Jersey debt at favorable points along the yield curve. To date, such effort has been rewarded as spreads have tightened in response to New Jersey’s improving credit metrics, as well as to a reduced supply and greater demand for tax-exempt bonds. Besides the state itself, other tax-exempt investment opportunities in New Jersey
Municipal Fixed Income QUARTERLY MARKET COMMENTARY
c o n t i n u e d
Source: U.S. Department of Commerce, Bureau of Economic Analysis.
f i g u r e 17New Jersey v. Florida state GDP ($ billions)
100
0
200
300
400
500
600
700
800
900
2013 2014 2015 2016 2017
Florida New Jersey
14 Breitbart, “Humble Macron Responds to Critics in State of the Union Address”, July 9, 2018.
15 The Wall Street Journal, “New Jersey’s Tax Gift to Florida,” July 2, 2018.
©2018 Wilmington Trust Corporation and its affiliates. All rights reserved. page 16 of 18
that we might consider include bonds of mission-critical public and private colleges and universities (Rowan University), well-managed counties (Monmouth), strong school districts (Woodbridge Township), advanced healthcare systems (Hackensack Meridian Health), vital transportation enterprises (New Jersey Turnpike Authority), and revenue bond issuers with exceedingly strong debt service coverage (Garden State Preservation Trust). While we are well aware of New Jersey’s long-term challenges, our current outlook on the state remains stable and we continue to seek good value for our clients in stable or improving New Jersey credits. We believe New Jersey will continue to demonstrate its infamous toughness and resilience—and as to the trials and tribulations ahead, with tongue firmly planted in cheek we say, to a great extent, fuggedaboudit.
DISCLOSURESThe S&P Municipal Bond Index is a broad, market value-weighted index that seeks to measure the performance of the U.S. municipal bond market. It tracks fixed-rate bonds exempt from federal income tax, though they may be subject to the alternative minimum tax (AMT), with par outstanding of at least $2 million. The index includes bonds of all quality ratings–from AAA to non-rated, including defaulted bonds–and from all sectors of the bond market. The S&P Municipal Bond Index constituents undergo a monthly review and rebalancing.
The S&P Municipal Bond Investment Grade Index consists of bonds in the S&P Municipal Bond Index that are rated at least BBB- by Standard & Poor’s, Baa3 by Moody’s, or BBB- by Fitch Ratings. For the avoidance of doubt, the lowest rating is used in determining if a bond is eligible for the Index. S&P Dow Jones Indices looks at the long term rating, either insured or uninsured, and the underlying rating for index inclusion. All bonds must also
Municipal Fixed Income QUARTERLY MARKET COMMENTARY
A N N U A L I Z E D R E T U R N S A N N U A L I Z E D S T A N D A R D D E V I A T I O N
1 year 3 year 5 year 10 year
3-year annualized standard deviation
5-year annualized standard deviation
10-year annualized standard deviation
S&P Municipal Bond +1.615% +2.989% +3.604% +4.448% 2.999% 3.134% 4.329%
S&P Municipal Bond Investment Grade
+1.410% +2.757% +3.449% +4.331% 2.999% 3.088% 4.255%
S&P Municipal Bond Intermediate
+0.892% +2.563% +3.163% +4.372% 3.194% 3.066% 3.860%
S&P Municipal Bond Short Intermediate
+0.409% +1.480% +1.823% +2.987% 1.980% 1.839% 2.229%
S&P Municipal Bond Short
+0.690% +0.991% +1.032% +1.880% 1.019% 0.856% 1.089%
S&P Municipal Bond High Yield
+5.245% +6.356% +5.764% +6.316% 3.748% 4.724% 8.319%
S&P Municipal Bond High Yield Ex-Puerto Rico
+7.166% +7.429% +7.759% N/A 3.832% 4.213% N/A
S&P Municipal Bond California Index
+1.906% +3.196% +4.235% +4.893% 3.353% 3.428% 4.874%
S&P Municipal Bond New York Index
+1.199% +2.810% +3.579% +4.312% 2.977% 2.992% 4.063%
S&P Municipal Bond Puerto Rico Index
+0.739% +3.532% –1.967% +1.143% 9.986% 11.585% 10.020%
Investing involves risks and you may incur a profit or a loss. Past performance cannot guarantee future results. Sources: WTIA Municipal Fixed Income, S&P Dow Jones Indices, LLC.
f i g u r e 18Annualized returns and volatility (period ending June 30, 2018)
c o n t i n u e d

©2018 Wilmington Trust Corporation and its affiliates. All rights reserved. page 17 of 18
have a minimum maturity of three years and a maximum maturity of up to, but not including, fifteen years, as measured from the rebalancing date.
The S&P Municipal Bond Intermediate Index consists of bonds in the S&P Municipal Bond Index with a minimum maturity of three years and a maximum maturity of up to, but not including, 15 years, as measured from the rebalancing date.
The S&P Municipal Bond Short Intermediate Index consists of bonds in the S&P Municipal Bond Index with a minimum maturity of one year and a maximum maturity of up to, but not including, eight years, as measured from the rebalancing date.
The S&P Municipal Bond Short Index consists of bonds in the S&P Municipal Bond Index with a minimum maturity of six months and a maximum maturity of up to, but not including, four years, as measured from the rebalancing date.
The S&P Municipal Bond High-Yield Index consists of bonds in the S&P Municipal Bond Index that are not rated or whose ratings are less than or equal to BB+ by Standard & Poor’s, Ba1 by Moody’s, or BB+ by Fitch Ratings. Bonds that are prerefunded or escrowed to maturity are not included in this index. The lowest long-term underlying rating, either insured or uninsured, is used in determining if a bond is eligible for the Index.
The state level municipal bond sub-indices consists of bonds in the S&P Municipal Bond Index that have been issued by municipalities or municipal authorities within the respective states, the District of Columbia, Puerto Rico, Guam, and the U.S. Virgin Islands. States and municipalities may have issues across the duration and quality spectrums or may be more concentrated to certain sub-indices, such as in the S&P Investment Grade or High Yield bond indices.
The S&P Municipal Bond Puerto Rico Index consists of bonds in the S&P Municipal Bond Index issued by the Commonwealth of Puerto Rico, and municipalities and municipal authorities within the Commonwealth. Individually these entities may have issues across the duration and quality spectra; however, as a general matter they have been increasingly concentrated in the S&P High Yield Bond Index.
The Securities Industry and Financial Markets Association
Municipal (SIFMA) Swap Index is designed to reflect activity in high-grade, weekly-reset Variable Rate Demand Notes (VRDN). It represents the average reset rate of qualifying VRDNs, subject to exclusions to ensure diversity of market participants and exclusion of outlier events that may skew an equal weighted index. In order for an issue to qualify for inclusion in the index a VRDN must have an outstanding amount over $10 million, reset weekly, pay interest monthly, have the highest short-term rating from S&P or Moody’s,
and may not be subject to the Alternative Minimum Tax. Beginning 2014, VRDNs also must be reported to the Municipal Securities Rulemaking Board. The Index excludes reset rates falling outside +/- 1 standard deviation (i.e., ignores the top 16.7% and bottom 16.7%) of reported rates and can include only one quote per issuer through a given remarketing agent, and each agent is limited to no more than 15% of the number of securities in the index. Designed and overseen by SIFMA, the Index is calculated and published by Bloomberg.
Indices are not available for direct investment. Investment in a security or strategy designed to replicate the performance of an index will incur expenses, such as management fees and transaction costs, which would reduce returns.
Slope analysis: The slope of the yield curve measures the rate gap between two points in the yield curve representing shorter- and longer-term yields. A low slope indicates a flat yield curve, where shorter- and longer-term rates are close to each other. The slope increases as the yield curve steepens, due to rising long rates and/or falling short rates, reflecting the higher gap between the yields of shorter and longer maturity bonds. In our slope analysis, we plot the trailing 40-day moving average of the slopes of the short v. long bond (1–30 year) and the intermediate range (2–10 year). We also plot +/– 2 standard deviation of the 40 trailing daily slopes—the trio are commonly referred to as Bollinger bands—to offer context to the moving average in light of the overall volatility of changes in the slope. Together, this is intended to indicate current steepness of the yield curve relative to recent trends.
Horizon & scenario analysis is intended to provide a sense of possible return outcomes, using indices with distinct durations, assuming given changes in yield over a given period. This exercise applies parallel shifts in the yield curve to the interest rate sensitivity of bonds of various maturities, reflected by their average effective duration, to project price impacts and assess the effect of interest rate changes on total return expectations. Effective duration is an estimate of the price change in a security given a change in market yield. For example, a bond with a duration of four years implies that for a of 0.25% (25bps) increase in market yield, the value of the bond would be expected to change –1% —and similarly for the reverse. The effective duration is thus applied in the projection to the various maturity points along the yield curve. While the yield curve can shift in a broad variety of ways (e.g., steepening), we limit our movements to parallel shifts. That is, each maturity on the curve is shifted by the same amount. Expected impacts to total return are provided, as well as three components: price return, yield return,
Municipal Fixed Income QUARTERLY MARKET COMMENTARY
c o n t i n u e d
©2018 Wilmington Trust Corporation and its affiliates. All rights reserved. page 18 of 18
and roll return. Price change is most directly impacted by the yield shift. Meanwhile, yield return gradually reflects the effect of higher or lower market rates as proceeds are reinvested. The roll component reflects bonds’ changing outstanding maturities, and corresponding shift down the yield curve (i.e., toward maturity), and is presumed to remain constant across scenarios—contributing if the yield curve is upward sloping (i.e., “normal”) and detracting if the curve is downward sloping. This material is intended to illustrate potential total return effects across a range of yield environments and investment horizons and, further, to demonstrate the risks of investing in various ranges along the yield curve, commonly represented by the effective duration measure.
Municipal bonds typically provide a lower yield than comparable taxable bonds in consideration of the tax-advantaged status of the interest payments from these bonds, which are exempt from federal taxes and may be exempt from applicable state and/or local taxes in the states and/or municipalities where they were issued. Capital gains do not share this tax advantaged status. Investments in municipal securities may not be appropriate for all investors, particularly those who do not stand to benefit from the tax status of the investment. The Alternative Minimum Tax may negate some or all of the tax benefits available through municipal securities.
Quality ratings are used to evaluate the likelihood of default by a bond issuer. Independent rating agencies, such as Standard & Poor’s and Moody’s Investors Service, analyze the financial strength of each bond’s issuer. Moody’s ratings range from Aaa (highest quality) to C (lowest quality). Bonds rated Baa3 and better are considered “Investment Grade.” Bonds rated Ba1 and below are “Below Investment Grade” (also “High Yield” or “Speculative”). Similarly, Standard & Poor’s ratings range from AAA to D. Bonds rated BBB– and better are considered “Investment Grade” and bonds rated BB+ and below are “Below Investment Grade.”
All investments carry some degree of risk. This report uses return volatility, as measured by standard deviation, as a proxy for risk. Volatility serves as a collective, quantitative estimate of risks present to varying degrees in the respective asset classes (e.g., liquidity, credit and default risks). Certain types of risk may be underrepresented by this measure. Investors should develop a thorough understanding of the risks of any investment prior to committing funds.
Third-party trademarks and brands are the property of their respective owners.
Wilmington Trust is a registered service mark. Wilmington Trust Corporation is a wholly owned subsidiary of M&T Bank Corporation. Wilmington Trust Company, operating in Delaware only, Wilmington Trust, N.A., M&T Bank and certain other affiliates, provide various fiduciary and non-fiduciary services, including trustee, custodial, agency, investment management and
other services. International corporate and institutional services are offered through Wilmington Trust Corporation’s international affiliates. Loans, credit cards, retail and business deposits, and other business and personal banking services and products are offered by M&T Bank, member FDIC. Wilmington Trust Investment Advisors, Inc., a subsidiary of M&T Bank, is a SEC-registered investment adviser providing investment management services to Wilmington Trust and M&T affiliates and clients. Brokerage services, mutual funds services and other securities are offered by M&T Securities, Inc., a registered broker/dealer, wholly owned subsidiary of M&T Bank, and member of the FINRA and SIPC. Wilmington Funds are entities separate and apart from Wilmington Trust, M&T Bank, and M&T Securities.
These materials are based on public information. Facts and views presented in this report have not been reviewed by, and may not reflect information known to, professionals in other business areas of Wilmington Trust or M&T Bank who may provide or seek to provide financial services to entities referred to in this report. As a result, M&T Bank and Wilmington Trust do not disclose certain client relationships with, or compensation received from, such entities in their reports.
Investment products are not insured by the FDIC or any other governmental agency, are not deposits of or other obligations of or guaranteed by Wilmington Trust, M&T, or any other bank or entity, and are subject to risks, including a possible loss of the principal amount invested.
The information in this commentary has been obtained from sources believed to be reliable, but its accuracy and completeness are not guaranteed. The opinions, estimates and projections constitute the judgment of Wilmington Trust and are subject to change without notice. This commentary is for information purposes only and is not intended as an offer, recommendation or solicitation for the sale of any financial product or service or as a determination that any investment strategy is suitable for a specific investor. Investors should seek financial advice regarding the suitability of any investment strategy based on the investor’s objectives, financial situation and particular needs. The investments or investment strategies discussed herein may not be suitable for every investor. There is no assurance that any investment strategy will be successful. Past performance cannot guarantee future results.
Municipal Fixed Income QUARTERLY MARKET COMMENTARY
3177 7-2018