municipal summary of social indicators in cochabamba ... · 19 segunda sección toko 64.7 69.6 39.3...
TRANSCRIPT
CochabambaThe recent years have been a very important period for the improvement of living condi-tions of Bolivians and Cochabamba residents. Sustained reduction in poverty rates, increased coverage of primary and secondary education, lower infant mortality rates, improvement of the nutritional status of children, as well as in-creased coverage of institutional deliveries are clear examples of this development.
These advances, in part, are a result of con-tinuity given to government policies adopted since the late twentieth century, as well as to new initiatives aimed at achieving the univer-sal exercise of rights recognized by the Consti-tution. Policies such as conditional and uncon-ditional transfers, a new health care model, and the new education law follow these lines.
In particular, the department of Cochabam-ba has shown important improvements in so-cial indicators, particularly in the improvement of maternal health. However, the indicators re-lated to infant mortality show less encouraging rates. The same holds true for the indicators on primary and secondary school, which are only similar to those found at the nationwide level. The evolution of several indicators of well-being both at the total nationwide and de-partmental levels has begun to show decelera-tion. This phenomenon is not a problem unique to Cochabamba or Bolivia since it affects or has affected countries that had achieved sig-
nificant improvement in social indicators. This situation reveals a need for new public policy mechanisms, improved participatory process-es, increased attention to public service qual-ity, new institutional coordination frameworks, both sector and territory-based, as well as new social oversight mechanisms.
The gaps in access to education and health care, lack of quality public services, and over-all backwardness of certain groups in terms of achievement of better standards of living, are a central theme in the public agenda, as they are all problems that undermine the implementation of basic statements in the new Constitution: uni-versal exercise of rights such as education, health care, non-discrimination, fair income, and jobs. In short, there is still much work to do to achieve universal exercise of social and economic rights, which, in turn, leads to strengthened democracy and to the exercise of full citizenship rights by all Bolivians. With this goal in mind, the Analy-sis Unit for Social and Economic Policy (UDA-PE, in Spanish) and the United Nations System in Bolivia publish this newsletter to inform on and share knowledge about the status of the so-cial situation in Cochabamba, so as to promote reflection and discussion about ongoing social public policies and supplementation with new necessary interventions to achieve concrete ex-ercise of the citizenship rights enshrined in the new Constitution.
The Road To development in
Four out of ten people were extremely •poor in the department of Cochabamba in 2001.Primary school coverage in the de- •partment shows significant progress towards achievement of universal education as in 2008 net enrollment rate was at 92%, a rate slightly above the country average.Secondary education coverage in Cocha- •bamba has shown a growing trend in time; the net enrollment rate increased to 52.5% in 2008.in Cochabamba, infant mortality rate in •2008 was 63 children per 1,000 live births. This means that in that year 3,106 children died before their first birthday.it is estimated that in 2008 there were •33,552 children under 3 years of age suffering from chronic malnutrition in Cochabamba.in the department, 34,381 institutional •births were attended in 2009, which means that the percentage of deliveries attended by trained health care personnel was 68.4%.
The Road To developmenT in CoChabamba
extreme poverty:The nationwide indicator can be obtained periodical-ly on the basis of household surveys. However, the representativeness of the estimates is insufficient to disaggregate indicators for smaller geographic areas such as department, province, and municipality. The calculation of this indicator for departmental and mu-nicipal levels was performed by UDAPE, INE, and the World Bank, by combining consumer spending estimates in the 2001 Census and three household surveys (1999, 2000, and 2001). This methodology cannot be replicated annually and data are available only for 2001.
Primary and secondary school:Data at nationwide, departmental, and municipal lev-els are obtained from administrative records avail-able from the Ministry of Education Information
RefeRences
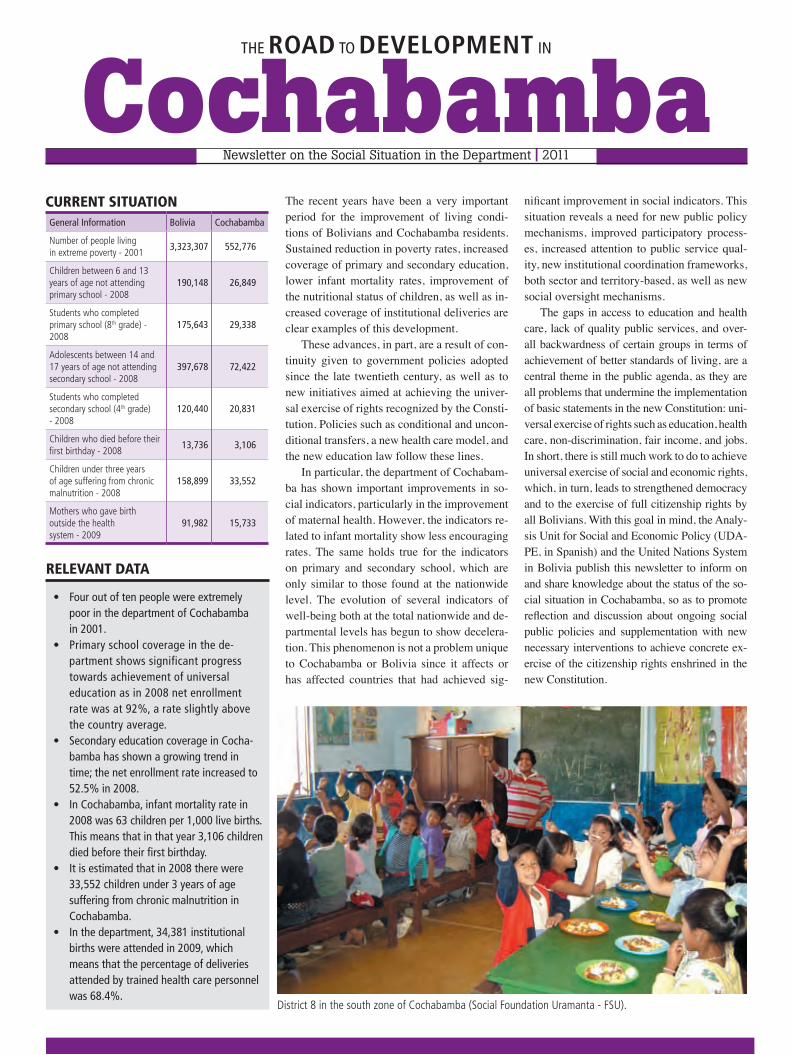
District 8 in the south zone of Cochabamba (Social Foundation Uramanta - FSU).
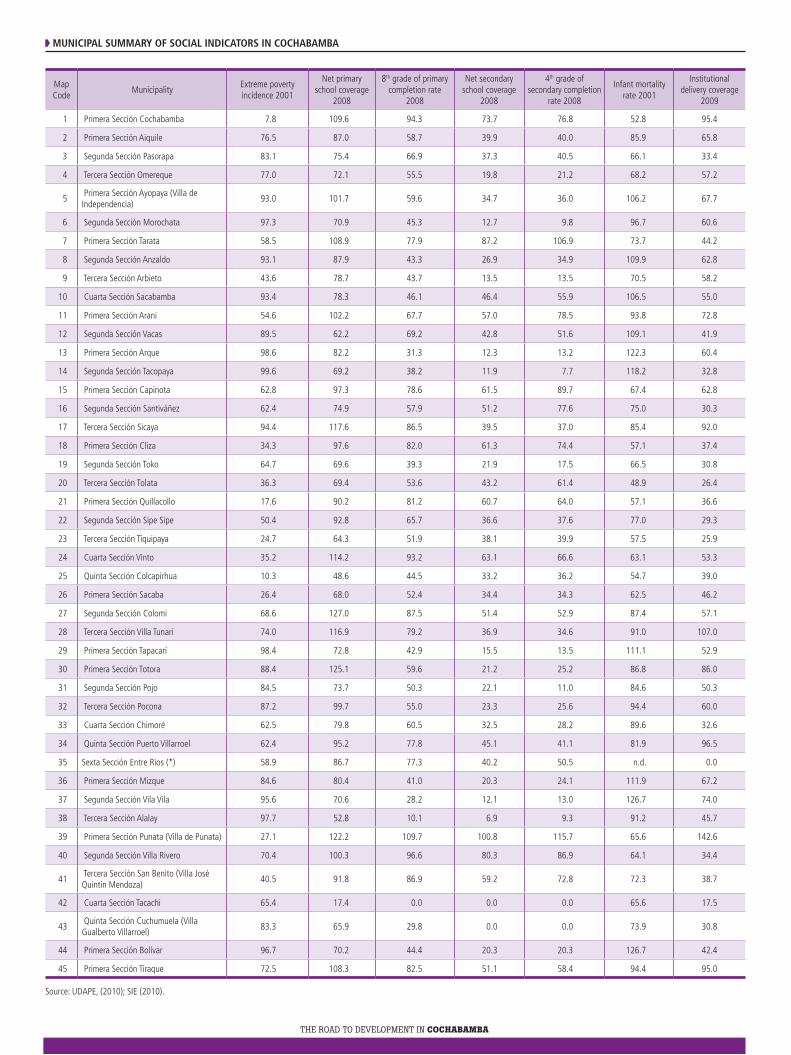
natIonWIde SUmmaRY oF SoCIal IndICatoRS mUnICIpal SUmmaRY oF SoCIal IndICatoRS In CoCHaBamBa
Source: UDAPE, (2010); SIE (2010).
Source: UDAPE, (2010); SIE (2010).
Map Code
MunicipalityExtreme poverty incidence 2001
Net primary school coverage
2008
8th grade of primary completion rate
2008
Net secondary school coverage
2008
4th grade of secondary completion
rate 2008
Infant mortality rate 2001
Institutional delivery coverage
2009
1 Primera Sección Cochabamba 7.8 109.6 94.3 73.7 76.8 52.8 95.4
2 Primera Sección Aiquile 76.5 87.0 58.7 39.9 40.0 85.9 65.8
3 Segunda Sección Pasorapa 83.1 75.4 66.9 37.3 40.5 66.1 33.4
4 Tercera Sección Omereque 77.0 72.1 55.5 19.8 21.2 68.2 57.2
5 Primera Sección Ayopaya (Villa de Independencia)
93.0 101.7 59.6 34.7 36.0 106.2 67.7
6 Segunda Sección Morochata 97.3 70.9 45.3 12.7 9.8 96.7 60.6
7 Primera Sección Tarata 58.5 108.9 77.9 87.2 106.9 73.7 44.2
8 Segunda Sección Anzaldo 93.1 87.9 43.3 26.9 34.9 109.9 62.8
9 Tercera Sección Arbieto 43.6 78.7 43.7 13.5 13.5 70.5 58.2
10 Cuarta Sección Sacabamba 93.4 78.3 46.1 46.4 55.9 106.5 55.0
11 Primera Sección Arani 54.6 102.2 67.7 57.0 78.5 93.8 72.8
12 Segunda Sección Vacas 89.5 62.2 69.2 42.8 51.6 109.1 41.9
13 Primera Sección Arque 98.6 82.2 31.3 12.3 13.2 122.3 60.4
14 Segunda Sección Tacopaya 99.6 69.2 38.2 11.9 7.7 118.2 32.8
15 Primera Sección Capinota 62.8 97.3 78.6 61.5 89.7 67.4 62.8
16 Segunda Sección Santiváñez 62.4 74.9 57.9 51.2 77.6 75.0 30.3
17 Tercera Sección Sicaya 94.4 117.6 86.5 39.5 37.0 85.4 92.0
18 Primera Sección Cliza 34.3 97.6 82.0 61.3 74.4 57.1 37.4
19 Segunda Sección Toko 64.7 69.6 39.3 21.9 17.5 66.5 30.8
20 Tercera Sección Tolata 36.3 69.4 53.6 43.2 61.4 48.9 26.4
21 Primera Sección Quillacollo 17.6 90.2 81.2 60.7 64.0 57.1 36.6
22 Segunda Sección Sipe Sipe 50.4 92.8 65.7 36.6 37.6 77.0 29.3
23 Tercera Sección Tiquipaya 24.7 64.3 51.9 38.1 39.9 57.5 25.9
24 Cuarta Sección Vinto 35.2 114.2 93.2 63.1 66.6 63.1 53.3
25 Quinta Sección Colcapirhua 10.3 48.6 44.5 33.2 36.2 54.7 39.0
26 Primera Sección Sacaba 26.4 68.0 52.4 34.4 34.3 62.5 46.2
27 Segunda Sección Colomi 68.6 127.0 87.5 51.4 52.9 87.4 57.1
28 Tercera Sección Villa Tunari 74.0 116.9 79.2 36.9 34.6 91.0 107.0
29 Primera Sección Tapacarí 98.4 72.8 42.9 15.5 13.5 111.1 52.9
30 Primera Sección Totora 88.4 125.1 59.6 21.2 25.2 86.8 86.0
31 Segunda Sección Pojo 84.5 73.7 50.3 22.1 11.0 84.6 50.3
32 Tercera Sección Pocona 87.2 99.7 55.0 23.3 25.6 94.4 60.0
33 Cuarta Sección Chimoré 62.5 79.8 60.5 32.5 28.2 89.6 32.6
34 Quinta Sección Puerto Villarroel 62.4 95.2 77.8 45.1 41.1 81.9 96.5
35 Sexta Sección Entre Rios (*) 58.9 86.7 77.3 40.2 50.5 n.d. 0.0
36 Primera Sección Mizque 84.6 80.4 41.0 20.3 24.1 111.9 67.2
37 Segunda Sección Vila Vila 95.6 70.6 28.2 12.1 13.0 126.7 74.0
38 Tercera Sección Alalay 97.7 52.8 10.1 6.9 9.3 91.2 45.7
39 Primera Sección Punata (Villa de Punata) 27.1 122.2 109.7 100.8 115.7 65.6 142.6
40 Segunda Sección Villa Rivero 70.4 100.3 96.6 80.3 86.9 64.1 34.4
41 Tercera Sección San Benito (Villa José Quintín Mendoza)
40.5 91.8 86.9 59.2 72.8 72.3 38.7
42 Cuarta Sección Tacachi 65.4 17.4 0.0 0.0 0.0 65.6 17.5
43 Quinta Sección Cuchumuela (Villa Gualberto Villarroel)
83.3 65.9 29.8 0.0 0.0 73.9 30.8
44 Primera Sección Bolívar 96.7 70.2 44.4 20.3 20.3 126.7 42.4
45 Primera Sección Tiraque 72.5 108.3 82.5 51.1 58.4 94.4 95.0
newsletter on the Social Situation in the department | 2011
ReLeVAnT DATA
cURRenT sITUATIOnGeneral information Bolivia Cochabamba
Number of people living in extreme poverty - 2001
3,323,307 552,776
Children between 6 and 13 years of age not attending primary school - 2008
190,148 26,849
Students who completed primary school (8th grade) - 2008
175,643 29,338
Adolescents between 14 and 17 years of age not attending secondary school - 2008
397,678 72,422
Students who completed secondary school (4th grade) - 2008
120,440 20,831
Children who died before their first birthday - 2008
13,736 3,106
Children under three years of age suffering from chronic malnutrition - 2008
158,899 33,552
Mothers who gave birth outside the health system - 2009
91,982 15,733
Indicator Bolivia Chuquisaca La Paz Cochabamba Oruro Potosí Tarija Santa Cruz Beni Pando
Extreme poverty percentage (%) - 2001 40.4 61.5 42.4 39.0 46.3 66.7 32.8 25.1 41.0 34.7
Net primary school coverage (%) - 2008 90.0 84.3 90.1 92.0 93.5 90.3 85.3 88.9 96.3 96.8
Completion rate through 8th grade (%) - 2008
77.3 57.5 87.8 73.6 88.9 66.1 74.8 77.8 74.4 63.1
Net secondary school coverage (%) - 2008
54.7 36.5 63.4 52.5 70.1 45.9 51.1 53.5 52.9 40.2
Completion rate through 4th grade of high school - 2008
56.3 38.0 69.3 56.1 74.9 45.6 51.3 51.5 47.0 37.5
Infant mortality rate per 1,000 live births (%) - 2008
50 42 63 63 56 101 37 31 39 47
Percentage of chronic malnutrition in children under 3 years of age (%) - 2008
20.3 26.3 20.6 24.0 28.5 38.5 11.0 7.1 12.1 10.3
Maternal mortality ratio per 100,000 live births (%) - 2000
235 140 326 142 224 354 124 207 267 n/a
Institutional delivery coverage (%) - 2009 67.0 64.5 62.7 68.4 86.3 57.4 70.9 68.0 77.8 78.3
System, and population projection from the National Institute of Statistics.
infant mortality:The infant mortality rate is estimated by both direct and indirect methods. The 2001 Census is one of the sources to measure the indicator by an indirect method and the National Demographic and Health Survey (ENDSA) provides historical information on births to estimate the indicator by means of a direct method.
Child Malnutrition:This indicator is calculated on the basis of ENDSA. It measures and shows the nutritional status of chil-dren under three years of age and provides a more accurate assessment of their condition.
Maternal mortality rate and coverage of institutional deliveries:The number of maternal deaths is calculated on the basis of ENDSA. For departmental disaggregation, the 2002 Post Census Maternal Mortality Survey was taken into account, but it collects information on maternal deaths which occurred in the year 2000. This information is not comparable to that obtained by means of ENDSA.Institutional delivery is the childbirth that occurs within healthcare facilities or outside of those (i.e. at home), but is attended by skilled health care per-sonnel (doctor, nurse and/or nurse auxiliary). It does not include home childbirth attended by midwives, although they may have been trained by health care personnel.
The Road To developmenT in CoChabamba
United nations System in BoliviaCalle 14 esq. Av. Sánchez Bustamanteedificio Metrobol ii, CalacotoPhone: 591 - 2 - 2795544 www.nu.org.boLa Paz - Bolivia
analysis Unit for Social and economic policy (Udape)Av. Mariscal Santa Cruzedif. Centro de Comunicaciones La Paz, piso 18Phone: 591 - 2 - 2375512www.udape.gob.boLa Paz – Bolivia
This newsletter is a joint effort by the Analysis Unit for Social and Economic Policy (UDAPE, in Spanish) and the United Nations Program for Development (UNDP). Its goal is to disseminate information on social indicators to promote and prioritize development topics in the national agenda. The ultimate goal of this initiative is to contribute toward achieving poverty reduction, access to education and health, gender equality, basic services, and protection of the environment. Information contained in this publication is based on official data from the Government of Bolivia and/or data provided by international organizations in the case of comparative information from the Latin American region.
The Road To developmenT in CoChabamba
Reducing Extreme PovertyIMPROVeD MATeRIAL cOnDITIOns fOR THe PeOPLe1
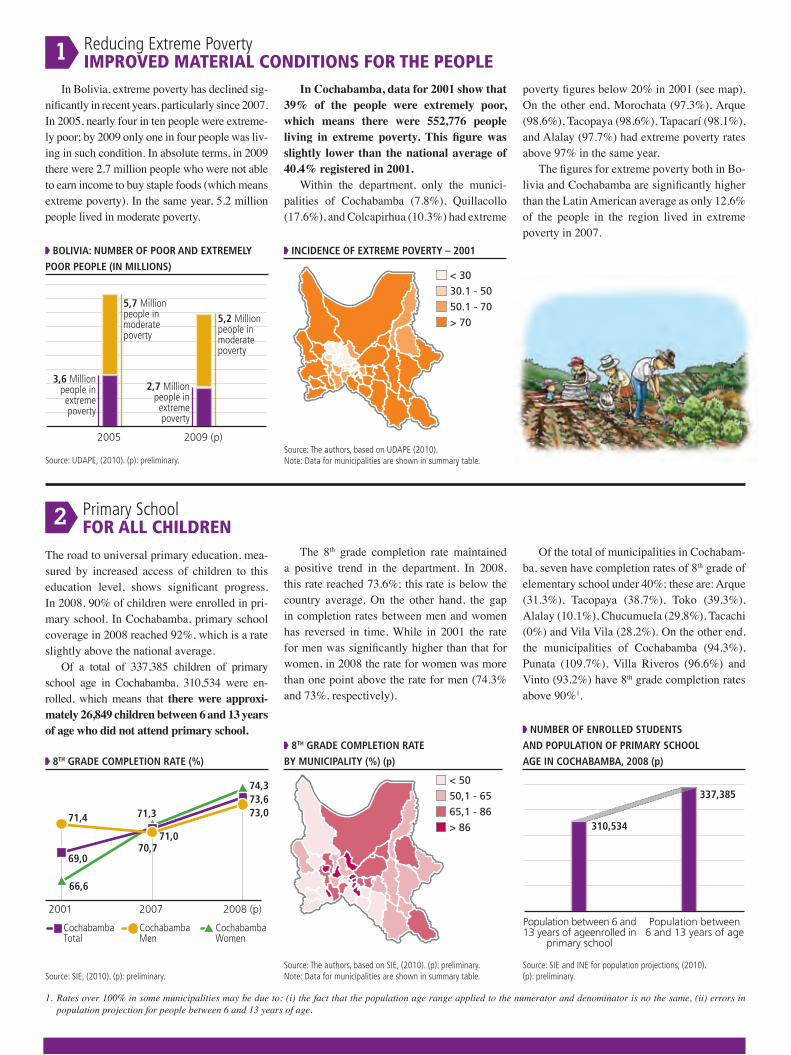
In Cochabamba, data for 2001 show that 39% of the people were extremely poor, which means there were 552,776 people living in extreme poverty. This figure was slightly lower than the national average of 40.4% registered in 2001.
Within the department, only the munici-palities of Cochabamba (7.8%), Quillacollo (17.6%), and Colcapirhua (10.3%) had extreme
BolIvIa: nUmBeR oF pooR and eXtRemelY
pooR people (In mIllIonS)
3,6 Millionpeople inextremepoverty
5,7 Millionpeople inmoderatepoverty
5,2 Millionpeople inmoderatepoverty
2005 2009 (p)
2,7 Millionpeople inextremepoverty
In Bolivia, extreme poverty has declined sig-nificantly in recent years, particularly since 2007. In 2005, nearly four in ten people were extreme-ly poor; by 2009 only one in four people was liv-ing in such condition. In absolute terms, in 2009 there were 2.7 million people who were not able to earn income to buy staple foods (which means extreme poverty). In the same year, 5.2 million people lived in moderate poverty.
Primary SchoolfOR ALL cHILDRen2
8tH GRade CompletIon Rate (%)
Source: SIE, (2010). (p): preliminary.
The road to universal primary education, mea-sured by increased access of children to this education level, shows significant progress. In 2008, 90% of children were enrolled in pri-mary school. In Cochabamba, primary school coverage in 2008 reached 92%, which is a rate slightly above the national average.
Of a total of 337,385 children of primary school age in Cochabamba, 310,534 were en-rolled, which means that there were approxi-mately 26,849 children between 6 and 13 years of age who did not attend primary school.
poverty figures below 20% in 2001 (see map). On the other end, Morochata (97.3%), Arque (98.6%), Tacopaya (98,6%), Tapacarí (98.1%), and Alalay (97.7%) had extreme poverty rates above 97% in the same year.
The figures for extreme poverty both in Bo-livia and Cochabamba are significantly higher than the Latin American average as only 12.6% of the people in the region lived in extreme poverty in 2007.
Universal Secondary EducationTHe neW cHALLenGe3
In Bolivia, the coverage and completion rates of secondary school show a growing trend; however, these indicators are lower than those of primary school. In 2008, the percentage of adolescents between 14 and 17 years enrolled in school was 55% and secondary school comple-tion rate, at 4th grade, was 56%. In the depart-ment of Cochabamba, secondary school cover-age is close to the national average; secondary school coverage reached 53% in 2008.
Preventing Infant MortalityA DUTY fOR ALL4
While infant mortality decreased significantly in the past 20 years in the country, Bolivia continues to be in the second to last position in terms of infant mortality in Latin America, only ahead of Haiti.
In 1989, out of every 1,000 live births, 82 children died before their first birthday at the
InFant moRtalItY Rate
(FoR 1,000 lIve BIRtHS)
pentavalent vaCCIne
In tHIRd doSe CoveRaGe (%)
1989 1994 1998 2003 2008 (p)
Bolivia Cochabamba Latin America (2009)
82
50
63
20
7567
5467
MalnutritionAcHIeVInG ADeQUATe nUTRITIOn fOR cHILDRen5
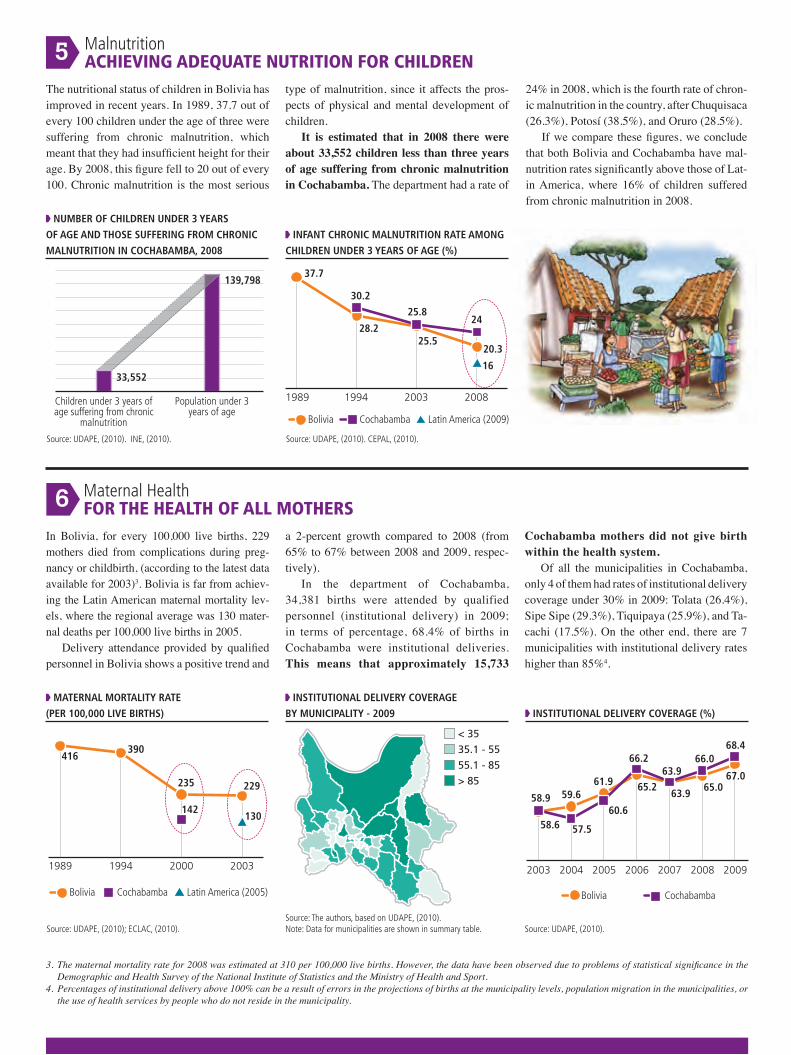
The nutritional status of children in Bolivia has improved in recent years. In 1989, 37.7 out of every 100 children under the age of three were suffering from chronic malnutrition, which meant that they had insufficient height for their age. By 2008, this figure fell to 20 out of every 100. Chronic malnutrition is the most serious
InFant CHRonIC malnUtRItIon Rate amonG
CHIldRen UndeR 3 YeaRS oF aGe (%)
nUmBeR oF CHIldRen UndeR 3 YeaRS
oF aGe and tHoSe SUFFeRInG FRom CHRonIC
malnUtRItIon In CoCHaBamBa, 2008
Maternal HealthfOR THe HeALTH Of ALL MOTHeRs6
In Bolivia, for every 100,000 live births, 229 mothers died from complications during preg-nancy or childbirth, (according to the latest data available for 2003)3. Bolivia is far from achiev-ing the Latin American maternal mortality lev-els, where the regional average was 130 mater-nal deaths per 100,000 live births in 2005.
Delivery attendance provided by qualified personnel in Bolivia shows a positive trend and
InStItUtIonal delIveRY CoveRaGe
BY mUnICIpalItY - 2009
> 85
55.1 - 85
35.1 - 55
< 35
mateRnal moRtalItY Rate
(peR 100,000 lIve BIRtHS)
1989 1994 2000 2003
Bolivia Cochabamba Latin America (2005)
390
130
416
235 229
142
InStItUtIonal delIveRY CoveRaGe (%)
2003 2004 2005 2006 2007 2008 2009
Bolivia Cochabamba
58.6
59.661.9 65.2
63.965.0
67.0
58.9
57.5
60.6
66.263.9
66.068.4
nUmBeR oF enRolled StUdentS
and popUlatIon oF pRImaRY SCHool
aGe In CoCHaBamBa, 2008 (p)
337,385
310,534
Population between 6 and13 years of ageenrolled in
primary school
Population between6 and 13 years of age
Source: SIE and INE for population projections, (2010). (p): preliminary.
8tH GRade CompletIon Rate
BY mUnICIpalItY (%) (p)
> 86
65,1 - 86
50,1 - 65
< 50
4tH GRade oF SeCondaRY SCHool CompletIon
Rate BY mUnICIpalItY (%) - 2008 (p)
4tH GRade oF SeCondaRY SCHool
CompletIon Rate (%)
nUmBeR oF enRolled StUdentS and
popUlatIon oF SeCondaRY SCHool aGe
In CoCHaBamBa, 2008 (p)
2001 2007 2008 (p)
CochabambaTotal
CochabambaMen
CochabambaWomen
54.1
43.5
56.1
42.7
53.4
55.1
44.2
54.957.2
Source: SIE, (2010). (p): preliminary.
152,629
80,206
Population between 14 and17 years of age enrolled in
secondary school
Population between14 and 17 years of age
Source: SIE and INE for population projections, (2010). (p): preliminary.
> 85
55.1 - 85
35.1 - 55
< 35
Source: INE (2010); ECLAC (2010), (p): preliminary.Source: UDAPE, (2010).
Source: UDAPE, (2010). CEPAL, (2010).Source: UDAPE, (2010). INE, (2010).
Source: UDAPE, (2010); ECLAC, (2010). Source: UDAPE, (2010).
2001 2007 2008 (p)
CochabambaTotal
CochabambaMen
CochabambaWomen
69,0
71,0
73,6
71,4 73,0
66,6
74,3
70,7
71,3
type of malnutrition, since it affects the pros-pects of physical and mental development of children.
It is estimated that in 2008 there were about 33,552 children less than three years of age suffering from chronic malnutrition in Cochabamba. The department had a rate of
2004 2005 2006 2007 2008 2009
Bolivia Cochabamba
85.284.5
84.181.7
83.4
84.5
86.3 86.9
84.5
81.382.0
83.4
infant mortality rate is Potosí (101 per 1,000 live births).
In the case of Cochabamba, infant mortality in 2008 was 63 children per 1,000 live births, one of the highest rates in the country. This means that 3,106 children died before reaching one year of age in the department in 2008.
24% in 2008, which is the fourth rate of chron-ic malnutrition in the country, after Chuquisaca (26.3%), Potosí (38.5%), and Oruro (28.5%).
If we compare these figures, we conclude that both Bolivia and Cochabamba have mal-nutrition rates significantly above those of Lat-in America, where 16% of children suffered from chronic malnutrition in 2008.
139,798
33,552
Children under 3 years ofage suffering from chronic
malnutrition
Population under 3years of age
Source: UDAPE, (2010). (p): preliminary.
nationwide level. In 2008, this figure dropped to 50.
The departments with the lowest mortal-ity rates are Santa Cruz (31 per 1,000 live births) and Tarija (37 per 1,000 live births). In addition, the department with the highest
1989 1994 2003 2008
Bolivia Cochabamba Latin America (2009)
16
37.7
28.225.5
20.3
30.2
25.824
InCIdenCe oF eXtReme poveRtY – 2001
Source: The authors, based on UDAPE (2010). Note: Data for municipalities are shown in summary table.
> 70
50.1 - 70
30.1 - 50
< 30
The 8th grade completion rate maintained a positive trend in the department. In 2008, this rate reached 73.6%; this rate is below the country average. On the other hand, the gap in completion rates between men and women has reversed in time. While in 2001 the rate for men was significantly higher than that for women, in 2008 the rate for women was more than one point above the rate for men (74.3% and 73%, respectively).
Of the total of municipalities in Cochabam-ba, seven have completion rates of 8th grade of elementary school under 40%; these are: Arque (31.3%), Tacopaya (38.7%), Toko (39.3%), Alalay (10.1%), Chucumuela (29.8%), Tacachi (0%) and Vila Vila (28.2%). On the other end, the municipalities of Cochabamba (94.3%), Punata (109.7%), Villa Riveros (96.6%) and Vinto (93.2%) have 8th grade completion rates above 90%1.
2. Rates over 100% in some municipalities may be due to: (i) the fact that the population age range applied to the numerator and denominator is no the same, (ii) errors in population projection for people between 14 and 17 years of age.
1. Rates over 100% in some municipalities may be due to: (i) the fact that the population age range applied to the numerator and denominator is no the same, (ii) errors in population projection for people between 6 and 13 years of age.
Of a total of 152,629 adolescents of sec-ondary school age in Cochabamba, 80,206 were enrolled, which means there were 72,422 young people between 14 and 17 years of age (47.5%) who did not attend secondary school in that department.
The completion rate of 4th grade of second-ary school in Cochabamba maintains a positive trend, although it is below the national average. In 2008, it was 56.1%. Also, the gap between men and women has favored the latter. In 2008,
the gender gap was 2.1 points higher for women (57.2% for women and 55.1% for men).
Of the 45 municipalities in the department of Cochabamba, five have completion rates of 4th grade of secondary school below 10%; those are Morochata (9.8%), Tacopaya (7.7%), Alalay (9.3%), Tacachi (0%), and Cuchumuela (0%). The only municipalities with completion rates of 4th grade of secondary school above 85% are Tarata (106.9%), Capinota (89.7%), and Punata (115.7%)2.
a 2-percent growth compared to 2008 (from 65% to 67% between 2008 and 2009, respec-tively).
In the department of Cochabamba, 34,381 births were attended by qualified personnel (institutional delivery) in 2009; in terms of percentage, 68.4% of births in Cochabamba were institutional deliveries. This means that approximately 15,733
Cochabamba mothers did not give birth within the health system.
Of all the municipalities in Cochabamba, only 4 of them had rates of institutional delivery coverage under 30% in 2009: Tolata (26.4%), Sipe Sipe (29.3%), Tiquipaya (25.9%), and Ta-cachi (17.5%). On the other end, there are 7 municipalities with institutional delivery rates higher than 85%4.
3. Thematernalmortalityratefor2008wasestimatedat310per100,000livebirths.However,thedatahavebeenobservedduetoproblemsofstatisticalsignificanceintheDemographic and Health Survey of the National Institute of Statistics and the Ministry of Health and Sport.
4. Percentages of institutional delivery above 100% can be a result of errors in the projections of births at the municipality levels, population migration in the municipalities, or the use of health services by people who do not reside in the municipality.
Source: The authors, based on SIE, (2010). (p): preliminary.Note: Data for municipalities are shown in summary table.
Source: The authors, based on SIE (2010). (p): preliminary.Note: Data for municipalities are shown in summary table.
Source: The authors, based on UDAPE, (2010). Note: Data for municipalities are shown in summary table.

The Road To developmenT in CoChabamba
Reducing Extreme PovertyIMPROVeD MATeRIAL cOnDITIOns fOR THe PeOPLe1
In Cochabamba, data for 2001 show that 39% of the people were extremely poor, which means there were 552,776 people living in extreme poverty. This figure was slightly lower than the national average of 40.4% registered in 2001.
Within the department, only the munici-palities of Cochabamba (7.8%), Quillacollo (17.6%), and Colcapirhua (10.3%) had extreme
BolIvIa: nUmBeR oF pooR and eXtRemelY
pooR people (In mIllIonS)
3,6 Millionpeople inextremepoverty
5,7 Millionpeople inmoderatepoverty
5,2 Millionpeople inmoderatepoverty
2005 2009 (p)
2,7 Millionpeople inextremepoverty
In Bolivia, extreme poverty has declined sig-nificantly in recent years, particularly since 2007. In 2005, nearly four in ten people were extreme-ly poor; by 2009 only one in four people was liv-ing in such condition. In absolute terms, in 2009 there were 2.7 million people who were not able to earn income to buy staple foods (which means extreme poverty). In the same year, 5.2 million people lived in moderate poverty.
Primary SchoolfOR ALL cHILDRen2
8tH GRade CompletIon Rate (%)
Source: SIE, (2010). (p): preliminary.
The road to universal primary education, mea-sured by increased access of children to this education level, shows significant progress. In 2008, 90% of children were enrolled in pri-mary school. In Cochabamba, primary school coverage in 2008 reached 92%, which is a rate slightly above the national average.
Of a total of 337,385 children of primary school age in Cochabamba, 310,534 were en-rolled, which means that there were approxi-mately 26,849 children between 6 and 13 years of age who did not attend primary school.
poverty figures below 20% in 2001 (see map). On the other end, Morochata (97.3%), Arque (98.6%), Tacopaya (98,6%), Tapacarí (98.1%), and Alalay (97.7%) had extreme poverty rates above 97% in the same year.
The figures for extreme poverty both in Bo-livia and Cochabamba are significantly higher than the Latin American average as only 12.6% of the people in the region lived in extreme poverty in 2007.
Universal Secondary EducationTHe neW cHALLenGe3
In Bolivia, the coverage and completion rates of secondary school show a growing trend; however, these indicators are lower than those of primary school. In 2008, the percentage of adolescents between 14 and 17 years enrolled in school was 55% and secondary school comple-tion rate, at 4th grade, was 56%. In the depart-ment of Cochabamba, secondary school cover-age is close to the national average; secondary school coverage reached 53% in 2008.
Preventing Infant MortalityA DUTY fOR ALL4
While infant mortality decreased significantly in the past 20 years in the country, Bolivia continues to be in the second to last position in terms of infant mortality in Latin America, only ahead of Haiti.
In 1989, out of every 1,000 live births, 82 children died before their first birthday at the
InFant moRtalItY Rate
(FoR 1,000 lIve BIRtHS)
pentavalent vaCCIne
In tHIRd doSe CoveRaGe (%)
1989 1994 1998 2003 2008 (p)
Bolivia Cochabamba Latin America (2009)
82
50
63
20
7567
5467
MalnutritionAcHIeVInG ADeQUATe nUTRITIOn fOR cHILDRen5
The nutritional status of children in Bolivia has improved in recent years. In 1989, 37.7 out of every 100 children under the age of three were suffering from chronic malnutrition, which meant that they had insufficient height for their age. By 2008, this figure fell to 20 out of every 100. Chronic malnutrition is the most serious
InFant CHRonIC malnUtRItIon Rate amonG
CHIldRen UndeR 3 YeaRS oF aGe (%)
nUmBeR oF CHIldRen UndeR 3 YeaRS
oF aGe and tHoSe SUFFeRInG FRom CHRonIC
malnUtRItIon In CoCHaBamBa, 2008
Maternal HealthfOR THe HeALTH Of ALL MOTHeRs6
In Bolivia, for every 100,000 live births, 229 mothers died from complications during preg-nancy or childbirth, (according to the latest data available for 2003)3. Bolivia is far from achiev-ing the Latin American maternal mortality lev-els, where the regional average was 130 mater-nal deaths per 100,000 live births in 2005.
Delivery attendance provided by qualified personnel in Bolivia shows a positive trend and
InStItUtIonal delIveRY CoveRaGe
BY mUnICIpalItY - 2009
> 85
55.1 - 85
35.1 - 55
< 35
mateRnal moRtalItY Rate
(peR 100,000 lIve BIRtHS)
1989 1994 2000 2003
Bolivia Cochabamba Latin America (2005)
390
130
416
235 229
142
InStItUtIonal delIveRY CoveRaGe (%)
2003 2004 2005 2006 2007 2008 2009
Bolivia Cochabamba
58.6
59.661.9 65.2
63.965.0
67.0
58.9
57.5
60.6
66.263.9
66.068.4
nUmBeR oF enRolled StUdentS
and popUlatIon oF pRImaRY SCHool
aGe In CoCHaBamBa, 2008 (p)
337,385
310,534
Population between 6 and13 years of ageenrolled in
primary school
Population between6 and 13 years of age
Source: SIE and INE for population projections, (2010). (p): preliminary.
8tH GRade CompletIon Rate
BY mUnICIpalItY (%) (p)
> 86
65,1 - 86
50,1 - 65
< 50
4tH GRade oF SeCondaRY SCHool CompletIon
Rate BY mUnICIpalItY (%) - 2008 (p)
4tH GRade oF SeCondaRY SCHool
CompletIon Rate (%)
nUmBeR oF enRolled StUdentS and
popUlatIon oF SeCondaRY SCHool aGe
In CoCHaBamBa, 2008 (p)
2001 2007 2008 (p)
CochabambaTotal
CochabambaMen
CochabambaWomen
54.1
43.5
56.1
42.7
53.4
55.1
44.2
54.957.2
Source: SIE, (2010). (p): preliminary.
152,629
80,206
Population between 14 and17 years of age enrolled in
secondary school
Population between14 and 17 years of age
Source: SIE and INE for population projections, (2010). (p): preliminary.
> 85
55.1 - 85
35.1 - 55
< 35
Source: INE (2010); ECLAC (2010), (p): preliminary.Source: UDAPE, (2010).
Source: UDAPE, (2010). CEPAL, (2010).Source: UDAPE, (2010). INE, (2010).
Source: UDAPE, (2010); ECLAC, (2010). Source: UDAPE, (2010).
2001 2007 2008 (p)
CochabambaTotal
CochabambaMen
CochabambaWomen
69,0
71,0
73,6
71,4 73,0
66,6
74,3
70,7
71,3
type of malnutrition, since it affects the pros-pects of physical and mental development of children.
It is estimated that in 2008 there were about 33,552 children less than three years of age suffering from chronic malnutrition in Cochabamba. The department had a rate of
2004 2005 2006 2007 2008 2009
Bolivia Cochabamba
85.284.5
84.181.7
83.4
84.5
86.3 86.9
84.5
81.382.0
83.4
infant mortality rate is Potosí (101 per 1,000 live births).
In the case of Cochabamba, infant mortality in 2008 was 63 children per 1,000 live births, one of the highest rates in the country. This means that 3,106 children died before reaching one year of age in the department in 2008.
24% in 2008, which is the fourth rate of chron-ic malnutrition in the country, after Chuquisaca (26.3%), Potosí (38.5%), and Oruro (28.5%).
If we compare these figures, we conclude that both Bolivia and Cochabamba have mal-nutrition rates significantly above those of Lat-in America, where 16% of children suffered from chronic malnutrition in 2008.
139,798
33,552
Children under 3 years ofage suffering from chronic
malnutrition
Population under 3years of age
Source: UDAPE, (2010). (p): preliminary.
nationwide level. In 2008, this figure dropped to 50.
The departments with the lowest mortal-ity rates are Santa Cruz (31 per 1,000 live births) and Tarija (37 per 1,000 live births). In addition, the department with the highest
1989 1994 2003 2008
Bolivia Cochabamba Latin America (2009)
16
37.7
28.225.5
20.3
30.2
25.824
InCIdenCe oF eXtReme poveRtY – 2001
Source: The authors, based on UDAPE (2010). Note: Data for municipalities are shown in summary table.
> 70
50.1 - 70
30.1 - 50
< 30
The 8th grade completion rate maintained a positive trend in the department. In 2008, this rate reached 73.6%; this rate is below the country average. On the other hand, the gap in completion rates between men and women has reversed in time. While in 2001 the rate for men was significantly higher than that for women, in 2008 the rate for women was more than one point above the rate for men (74.3% and 73%, respectively).
Of the total of municipalities in Cochabam-ba, seven have completion rates of 8th grade of elementary school under 40%; these are: Arque (31.3%), Tacopaya (38.7%), Toko (39.3%), Alalay (10.1%), Chucumuela (29.8%), Tacachi (0%) and Vila Vila (28.2%). On the other end, the municipalities of Cochabamba (94.3%), Punata (109.7%), Villa Riveros (96.6%) and Vinto (93.2%) have 8th grade completion rates above 90%1.
2. Rates over 100% in some municipalities may be due to: (i) the fact that the population age range applied to the numerator and denominator is no the same, (ii) errors in population projection for people between 14 and 17 years of age.
1. Rates over 100% in some municipalities may be due to: (i) the fact that the population age range applied to the numerator and denominator is no the same, (ii) errors in population projection for people between 6 and 13 years of age.
Of a total of 152,629 adolescents of sec-ondary school age in Cochabamba, 80,206 were enrolled, which means there were 72,422 young people between 14 and 17 years of age (47.5%) who did not attend secondary school in that department.
The completion rate of 4th grade of second-ary school in Cochabamba maintains a positive trend, although it is below the national average. In 2008, it was 56.1%. Also, the gap between men and women has favored the latter. In 2008,
the gender gap was 2.1 points higher for women (57.2% for women and 55.1% for men).
Of the 45 municipalities in the department of Cochabamba, five have completion rates of 4th grade of secondary school below 10%; those are Morochata (9.8%), Tacopaya (7.7%), Alalay (9.3%), Tacachi (0%), and Cuchumuela (0%). The only municipalities with completion rates of 4th grade of secondary school above 85% are Tarata (106.9%), Capinota (89.7%), and Punata (115.7%)2.
a 2-percent growth compared to 2008 (from 65% to 67% between 2008 and 2009, respec-tively).
In the department of Cochabamba, 34,381 births were attended by qualified personnel (institutional delivery) in 2009; in terms of percentage, 68.4% of births in Cochabamba were institutional deliveries. This means that approximately 15,733
Cochabamba mothers did not give birth within the health system.
Of all the municipalities in Cochabamba, only 4 of them had rates of institutional delivery coverage under 30% in 2009: Tolata (26.4%), Sipe Sipe (29.3%), Tiquipaya (25.9%), and Ta-cachi (17.5%). On the other end, there are 7 municipalities with institutional delivery rates higher than 85%4.
3. Thematernalmortalityratefor2008wasestimatedat310per100,000livebirths.However,thedatahavebeenobservedduetoproblemsofstatisticalsignificanceintheDemographic and Health Survey of the National Institute of Statistics and the Ministry of Health and Sport.
4. Percentages of institutional delivery above 100% can be a result of errors in the projections of births at the municipality levels, population migration in the municipalities, or the use of health services by people who do not reside in the municipality.
Source: The authors, based on SIE, (2010). (p): preliminary.Note: Data for municipalities are shown in summary table.
Source: The authors, based on SIE (2010). (p): preliminary.Note: Data for municipalities are shown in summary table.
Source: The authors, based on UDAPE, (2010). Note: Data for municipalities are shown in summary table.
CochabambaThe recent years have been a very important period for the improvement of living condi-tions of Bolivians and Cochabamba residents. Sustained reduction in poverty rates, increased coverage of primary and secondary education, lower infant mortality rates, improvement of the nutritional status of children, as well as in-creased coverage of institutional deliveries are clear examples of this development.
These advances, in part, are a result of con-tinuity given to government policies adopted since the late twentieth century, as well as to new initiatives aimed at achieving the univer-sal exercise of rights recognized by the Consti-tution. Policies such as conditional and uncon-ditional transfers, a new health care model, and the new education law follow these lines.
In particular, the department of Cochabam-ba has shown important improvements in so-cial indicators, particularly in the improvement of maternal health. However, the indicators re-lated to infant mortality show less encouraging rates. The same holds true for the indicators on primary and secondary school, which are only similar to those found at the nationwide level. The evolution of several indicators of well-being both at the total nationwide and de-partmental levels has begun to show decelera-tion. This phenomenon is not a problem unique to Cochabamba or Bolivia since it affects or has affected countries that had achieved sig-
nificant improvement in social indicators. This situation reveals a need for new public policy mechanisms, improved participatory process-es, increased attention to public service qual-ity, new institutional coordination frameworks, both sector and territory-based, as well as new social oversight mechanisms.
The gaps in access to education and health care, lack of quality public services, and over-all backwardness of certain groups in terms of achievement of better standards of living, are a central theme in the public agenda, as they are all problems that undermine the implementation of basic statements in the new Constitution: uni-versal exercise of rights such as education, health care, non-discrimination, fair income, and jobs. In short, there is still much work to do to achieve universal exercise of social and economic rights, which, in turn, leads to strengthened democracy and to the exercise of full citizenship rights by all Bolivians. With this goal in mind, the Analy-sis Unit for Social and Economic Policy (UDA-PE, in Spanish) and the United Nations System in Bolivia publish this newsletter to inform on and share knowledge about the status of the so-cial situation in Cochabamba, so as to promote reflection and discussion about ongoing social public policies and supplementation with new necessary interventions to achieve concrete ex-ercise of the citizenship rights enshrined in the new Constitution.
The Road To development in
Four out of ten people were extremely •poor in the department of Cochabamba in 2001.Primary school coverage in the de- •partment shows significant progress towards achievement of universal education as in 2008 net enrollment rate was at 92%, a rate slightly above the country average.Secondary education coverage in Cocha- •bamba has shown a growing trend in time; the net enrollment rate increased to 52.5% in 2008.in Cochabamba, infant mortality rate in •2008 was 63 children per 1,000 live births. This means that in that year 3,106 children died before their first birthday.it is estimated that in 2008 there were •33,552 children under 3 years of age suffering from chronic malnutrition in Cochabamba.in the department, 34,381 institutional •births were attended in 2009, which means that the percentage of deliveries attended by trained health care personnel was 68.4%.
The Road To developmenT in CoChabamba
extreme poverty:The nationwide indicator can be obtained periodical-ly on the basis of household surveys. However, the representativeness of the estimates is insufficient to disaggregate indicators for smaller geographic areas such as department, province, and municipality. The calculation of this indicator for departmental and mu-nicipal levels was performed by UDAPE, INE, and the World Bank, by combining consumer spending estimates in the 2001 Census and three household surveys (1999, 2000, and 2001). This methodology cannot be replicated annually and data are available only for 2001.
Primary and secondary school:Data at nationwide, departmental, and municipal lev-els are obtained from administrative records avail-able from the Ministry of Education Information
RefeRences
District 8 in the south zone of Cochabamba (Social Foundation Uramanta - FSU).
natIonWIde SUmmaRY oF SoCIal IndICatoRS mUnICIpal SUmmaRY oF SoCIal IndICatoRS In CoCHaBamBa
Source: UDAPE, (2010); SIE (2010).
Source: UDAPE, (2010); SIE (2010).
Map Code
MunicipalityExtreme poverty incidence 2001
Net primary school coverage
2008
8th grade of primary completion rate
2008
Net secondary school coverage
2008
4th grade of secondary completion
rate 2008
Infant mortality rate 2001
Institutional delivery coverage
2009
1 Primera Sección Cochabamba 7.8 109.6 94.3 73.7 76.8 52.8 95.4
2 Primera Sección Aiquile 76.5 87.0 58.7 39.9 40.0 85.9 65.8
3 Segunda Sección Pasorapa 83.1 75.4 66.9 37.3 40.5 66.1 33.4
4 Tercera Sección Omereque 77.0 72.1 55.5 19.8 21.2 68.2 57.2
5 Primera Sección Ayopaya (Villa de Independencia)
93.0 101.7 59.6 34.7 36.0 106.2 67.7
6 Segunda Sección Morochata 97.3 70.9 45.3 12.7 9.8 96.7 60.6
7 Primera Sección Tarata 58.5 108.9 77.9 87.2 106.9 73.7 44.2
8 Segunda Sección Anzaldo 93.1 87.9 43.3 26.9 34.9 109.9 62.8
9 Tercera Sección Arbieto 43.6 78.7 43.7 13.5 13.5 70.5 58.2
10 Cuarta Sección Sacabamba 93.4 78.3 46.1 46.4 55.9 106.5 55.0
11 Primera Sección Arani 54.6 102.2 67.7 57.0 78.5 93.8 72.8
12 Segunda Sección Vacas 89.5 62.2 69.2 42.8 51.6 109.1 41.9
13 Primera Sección Arque 98.6 82.2 31.3 12.3 13.2 122.3 60.4
14 Segunda Sección Tacopaya 99.6 69.2 38.2 11.9 7.7 118.2 32.8
15 Primera Sección Capinota 62.8 97.3 78.6 61.5 89.7 67.4 62.8
16 Segunda Sección Santiváñez 62.4 74.9 57.9 51.2 77.6 75.0 30.3
17 Tercera Sección Sicaya 94.4 117.6 86.5 39.5 37.0 85.4 92.0
18 Primera Sección Cliza 34.3 97.6 82.0 61.3 74.4 57.1 37.4
19 Segunda Sección Toko 64.7 69.6 39.3 21.9 17.5 66.5 30.8
20 Tercera Sección Tolata 36.3 69.4 53.6 43.2 61.4 48.9 26.4
21 Primera Sección Quillacollo 17.6 90.2 81.2 60.7 64.0 57.1 36.6
22 Segunda Sección Sipe Sipe 50.4 92.8 65.7 36.6 37.6 77.0 29.3
23 Tercera Sección Tiquipaya 24.7 64.3 51.9 38.1 39.9 57.5 25.9
24 Cuarta Sección Vinto 35.2 114.2 93.2 63.1 66.6 63.1 53.3
25 Quinta Sección Colcapirhua 10.3 48.6 44.5 33.2 36.2 54.7 39.0
26 Primera Sección Sacaba 26.4 68.0 52.4 34.4 34.3 62.5 46.2
27 Segunda Sección Colomi 68.6 127.0 87.5 51.4 52.9 87.4 57.1
28 Tercera Sección Villa Tunari 74.0 116.9 79.2 36.9 34.6 91.0 107.0
29 Primera Sección Tapacarí 98.4 72.8 42.9 15.5 13.5 111.1 52.9
30 Primera Sección Totora 88.4 125.1 59.6 21.2 25.2 86.8 86.0
31 Segunda Sección Pojo 84.5 73.7 50.3 22.1 11.0 84.6 50.3
32 Tercera Sección Pocona 87.2 99.7 55.0 23.3 25.6 94.4 60.0
33 Cuarta Sección Chimoré 62.5 79.8 60.5 32.5 28.2 89.6 32.6
34 Quinta Sección Puerto Villarroel 62.4 95.2 77.8 45.1 41.1 81.9 96.5
35 Sexta Sección Entre Rios (*) 58.9 86.7 77.3 40.2 50.5 n.d. 0.0
36 Primera Sección Mizque 84.6 80.4 41.0 20.3 24.1 111.9 67.2
37 Segunda Sección Vila Vila 95.6 70.6 28.2 12.1 13.0 126.7 74.0
38 Tercera Sección Alalay 97.7 52.8 10.1 6.9 9.3 91.2 45.7
39 Primera Sección Punata (Villa de Punata) 27.1 122.2 109.7 100.8 115.7 65.6 142.6
40 Segunda Sección Villa Rivero 70.4 100.3 96.6 80.3 86.9 64.1 34.4
41 Tercera Sección San Benito (Villa José Quintín Mendoza)
40.5 91.8 86.9 59.2 72.8 72.3 38.7
42 Cuarta Sección Tacachi 65.4 17.4 0.0 0.0 0.0 65.6 17.5
43 Quinta Sección Cuchumuela (Villa Gualberto Villarroel)
83.3 65.9 29.8 0.0 0.0 73.9 30.8
44 Primera Sección Bolívar 96.7 70.2 44.4 20.3 20.3 126.7 42.4
45 Primera Sección Tiraque 72.5 108.3 82.5 51.1 58.4 94.4 95.0
newsletter on the Social Situation in the department | 2011
ReLeVAnT DATA
cURRenT sITUATIOnGeneral information Bolivia Cochabamba
Number of people living in extreme poverty - 2001
3,323,307 552,776
Children between 6 and 13 years of age not attending primary school - 2008
190,148 26,849
Students who completed primary school (8th grade) - 2008
175,643 29,338
Adolescents between 14 and 17 years of age not attending secondary school - 2008
397,678 72,422
Students who completed secondary school (4th grade) - 2008
120,440 20,831
Children who died before their first birthday - 2008
13,736 3,106
Children under three years of age suffering from chronic malnutrition - 2008
158,899 33,552
Mothers who gave birth outside the health system - 2009
91,982 15,733
Indicator Bolivia Chuquisaca La Paz Cochabamba Oruro Potosí Tarija Santa Cruz Beni Pando
Extreme poverty percentage (%) - 2001 40.4 61.5 42.4 39.0 46.3 66.7 32.8 25.1 41.0 34.7
Net primary school coverage (%) - 2008 90.0 84.3 90.1 92.0 93.5 90.3 85.3 88.9 96.3 96.8
Completion rate through 8th grade (%) - 2008
77.3 57.5 87.8 73.6 88.9 66.1 74.8 77.8 74.4 63.1
Net secondary school coverage (%) - 2008
54.7 36.5 63.4 52.5 70.1 45.9 51.1 53.5 52.9 40.2
Completion rate through 4th grade of high school - 2008
56.3 38.0 69.3 56.1 74.9 45.6 51.3 51.5 47.0 37.5
Infant mortality rate per 1,000 live births (%) - 2008
50 42 63 63 56 101 37 31 39 47
Percentage of chronic malnutrition in children under 3 years of age (%) - 2008
20.3 26.3 20.6 24.0 28.5 38.5 11.0 7.1 12.1 10.3
Maternal mortality ratio per 100,000 live births (%) - 2000
235 140 326 142 224 354 124 207 267 n/a
Institutional delivery coverage (%) - 2009 67.0 64.5 62.7 68.4 86.3 57.4 70.9 68.0 77.8 78.3
System, and population projection from the National Institute of Statistics.
infant mortality:The infant mortality rate is estimated by both direct and indirect methods. The 2001 Census is one of the sources to measure the indicator by an indirect method and the National Demographic and Health Survey (ENDSA) provides historical information on births to estimate the indicator by means of a direct method.
Child Malnutrition:This indicator is calculated on the basis of ENDSA. It measures and shows the nutritional status of chil-dren under three years of age and provides a more accurate assessment of their condition.
Maternal mortality rate and coverage of institutional deliveries:The number of maternal deaths is calculated on the basis of ENDSA. For departmental disaggregation, the 2002 Post Census Maternal Mortality Survey was taken into account, but it collects information on maternal deaths which occurred in the year 2000. This information is not comparable to that obtained by means of ENDSA.Institutional delivery is the childbirth that occurs within healthcare facilities or outside of those (i.e. at home), but is attended by skilled health care per-sonnel (doctor, nurse and/or nurse auxiliary). It does not include home childbirth attended by midwives, although they may have been trained by health care personnel.
The Road To developmenT in CoChabamba
United nations System in BoliviaCalle 14 esq. Av. Sánchez Bustamanteedificio Metrobol ii, CalacotoPhone: 591 - 2 - 2795544 www.nu.org.boLa Paz - Bolivia
analysis Unit for Social and economic policy (Udape)Av. Mariscal Santa Cruzedif. Centro de Comunicaciones La Paz, piso 18Phone: 591 - 2 - 2375512www.udape.gob.boLa Paz – Bolivia
This newsletter is a joint effort by the Analysis Unit for Social and Economic Policy (UDAPE, in Spanish) and the United Nations Program for Development (UNDP). Its goal is to disseminate information on social indicators to promote and prioritize development topics in the national agenda. The ultimate goal of this initiative is to contribute toward achieving poverty reduction, access to education and health, gender equality, basic services, and protection of the environment. Information contained in this publication is based on official data from the Government of Bolivia and/or data provided by international organizations in the case of comparative information from the Latin American region.
628
2 3
545
33
31
34
30
35
36
29
4
8
32
44
26
7
37
1
21 27
141513
22
38
12
23
16 9 11
24
10
41
17
40
3920
19 43
18
25
42
REFERENCE MAPCOCHABAMBA