municipal transportation quality review
TRANSCRIPT
OLOGY DIVISION TECHNOLOGY & PERFORMANCE DEPARTMENT
Municipal Transportation Quality Review Fiscal Years 2016-2017 & 2017-2018 FINAL


Municipal Transportation Quality Review | FY 16-17 and FY 17-18 SAN FRANCISCO MUNICIPAL TRANSPORTATION AGENCY
Nelson\Nygaard Consulting Associates Inc. | i
Table of Contents Page
Executive Summary .........................................................................................................ES-1 Analysis of Trends .......................................................................................................ES-1 Review Of Data Collection And Reporting Methods ......................................................ES-4 Recommendations ......................................................................................................ES-5 Implemented from the Last Audit .................................................................................ES-5 Current Recommendations ..........................................................................................ES-5
Chapter 1 Methodology .................................................................................................... 1-1 Review of Data Collection Methods................................................................................ 1-1 Review of Reporting Data Collection Methods ................................................................ 1-3
Chapter 2 Analysis of SFMTA Transit Performance Metrics ........................................... 2-1 Goal 1: Create a safer transportation experience for everyone ....................................... 2-3
1.1.1 SFPD-Reported Muni-Related Crimes/100,000 Miles .................................... 2-5 1.1.2 Customer Rating: Security of Transit Riding Experience While on a
Muni Vehicle; While Waiting at a Muni Stop or Station................................... 2-6 1.1.4 Security Complaints to 311 (Muni) ................................................................ 2-7 1.2.1 Workplace Injuries/200,000 Hours ................................................................ 2-8 1.2.2 Security Incidents Involving SFMTA Personnel (Muni Only)........................... 2-9 1.3.1 Muni Collisions/100,000 Miles..................................................................... 2-10 1.3.3 Muni Falls on Board/100,000 Miles ............................................................. 2-11 1.3.4 “Unsafe Operation” Muni Complaints to 311 ................................................ 2-12 1.3.5 Customer Rating: Safety of Transit Riding Experience................................. 2-13
Goal 2: Make transit, walking, bicycling, taxi, ridesharing & carsharing the preferred means of travel ................................................................................ 2-15
2.1.1 Customer Rating: Overall Customer Satisfaction with Transit Services ........ 2-16 2.1.5 Customer Rating: Communications to Passengers ...................................... 2-17 2.1.7 Percentage of actionable 311 Muni operator conduct complaints addressed
within 28 business days .............................................................................. 2-18 2.1.8 Customer Rating: Cleanliness of Muni Vehicles .......................................... 2-19 2.1.9 Customer Rating: Cleanliness of Muni Facilities
(Stations, Elevators, Escalators) ................................................................. 2-19 2.2.1 Percentage of Transit Trips with Bunching and Gaps on Rapid Network ...... 2-20 2.2.2 On-Time Performance for Non-Rapid Network Routes ................................ 2-21 2.2.3 Percentage of Scheduled Service Delivered (Trips)..................................... 2-22 2.2.4 Percentage of On-Time Departures from Terminals..................................... 2-23 2.2.6 Percentage of On-Time Performance (OTP) ............................................... 2-24 2.2.7 Percentage of Trips Over Capacity During AM Peak (8:00a-8:59a, Inbound)
at Max Load Points Percentage of Trips Over Capacity During PM Peak (5:00p-5:59p, Outbound) at Max Load Points ............................................. 2-25
2.2.8 Mean Distance Between Failure (MDBF) .................................................... 2-26 2.2.9 Percentage of Scheduled Service Hours Delivered...................................... 2-28 2.2.11 Ridership (Bus and Metro Faregates, Average Weekday)............................ 2-29 2.2.12 Operational Availability of Elevators at Muni Stations .................................. 2-30

Municipal Transportation Quality Review | FY 16-17 and FY 17-18 SAN FRANCISCO MUNICIPAL TRANSPORTATION AGENCY
Nelson\Nygaard Consulting Associates Inc. | ii
2.2.13 Operational Availability of Escalators at Muni Stations ................................ 2-30 Goal 3: Improve the environment and quality of life in San Francisco ............................ 2-31
3.2.1 Muni Ridership ........................................................................................... 2-32 3.4.1 Transit Passengers per Revenue Hour ....................................................... 2-33 3.4.2 Average Annual Transit Cost per Revenue Hour ......................................... 2-34 3.4.3 Cost per Unlinked Trip ................................................................................ 2-35 3.4.5 Farebox Recovery Ratio ............................................................................. 2-36
Goal 4: Create a workplace that delivers outstanding service ....................................... 2-37 4.2.1 Employee Satisfaction ................................................................................ 2-38 4.3.3 Unscheduled Absence Rate by Transit Operators ....................................... 2-39
Chapter 3 Operations Analysis......................................................................................... 3-1 Findings And Recommendations ................................................................................... 3-1
Appendix A: Glossary of Terms

Municipal Transportation Quality Review | FY 16-17 and FY 17-18 SAN FRANCISCO MUNICIPAL TRANSPORTATION AGENCY
Nelson\Nygaard Consulting Associates Inc. | iii
Table of Figures Figure ES-1 Goal 1: Create a safer transportation experience for everyone .......................................... ES-1 Figure ES-2 Goal 2: Make transit, walking, bicycling, taxi, ridesharing & carsharing the preferred
means of travel....................................................................................................................... ES-2 Figure ES-3 Goal 3: Improve the environment and quality of life in San Francisco ............................... ES-2 Figure ES-4 Goal 4: Create a workplace that delivers outstanding service ............................................ ES-2 Figure ES-5 Trends of Goal 1 Metrics: Create a safer transportation experience for everyone ............ ES-3 Figure ES-6 Trends of Goal 2 Metrics: Make transit, walking, bicycling, taxi, ridesharing &
carsharing the preferred means of travel ............................................................................. ES-3 Figure ES-7 Trends of Goal 3 Metrics: Improve the environment and quality of life in San Francisco . ES-4 Figure ES-8 Trends of Goal 4 Metrics: Create a workplace that delivers outstanding service .............. ES-4
Figure 4-1 Operator Training Positions and Classifications ..................................................................... 3-3

Nelson\Nygaard Consulting Associates, Inc. | ES-1
Executive Summary The San Francisco City Charter mandates a biennial, independent quality review of transit operations performance. The quality review consists of three elements: analysis of trends in reported data, review of data collection and reporting methods, and auditor recommendations. This report is the ninth independent review of Muni’s performance. It covers fiscal years (FY) 2017 and 2018 (July 1, 2016 through June 30, 2018).
The biennial quality review has been conducted with the following goals in mind:
Help the SFMTA assess Muni’s progress toward its goals and objectives
Evaluate Muni’s established goals and performance against the letter and intent of the San Francisco City Charter and FY 2013-2018 Strategic Plan
Assess whether specific implementation goals, methods, and definitions of measurement are appropriate or could be improved
Provide independent verification to the public that Muni is on track by auditing Muni’s data collection and analysis procedures
ANALYSIS OF TRENDS Metrics This is the third audit cycle in which the metrics and targets come from the FY 2013-2018 Strategic Plan.
This report reviews metrics related to transit-based objectives in the San Francisco City Charter or FY 2013 – 2018 Strategic Plan. The metrics audited for this report are listed in Figures ES-1 – ES-4 below, grouped by Strategic Plan goal. Metrics serving as Key Performance Indicators are noted in the following tables. Goals are set for each fiscal cycle and are posted on the SFMTA website in interactive reports that allow the public to drill down on details they may care about.
Figure ES-1 Goal 1: Create a safer transportation experience for everyone
Metric Strategic
Plan Metric
Key Performance
Indicator SFPD-Reported Muni-related crimes/100,000 miles 1.1.1 Customer Rating: Security of Transit Riding Experience (while on Muni vehicle or waiting at stop or station) 1.1.2
Security Complaints to 311 (Muni) 1.1.4 Workplace Injuries/200,000 Hours 1.2.1 Security Incidents Involving SFMTA Personnel (Muni Only) 1.2.2 Muni Collisions/100,000 Miles 1.3.1 Muni Falls on Board/100,000 Miles 1.3.3 “Unsafe Operation” Muni Complaints to 311 1.3.4 Customer Rating: Safety of Transit Riding Experience 1.3.5
FY 16-17 & FY 17-18 Quality Review and the Transit Training Program Each cycle, an independent review is conducted on a specialized topic. This year, the team reviewed the SFMTA’s transit training program.
In this report Subsequent chapters cover: Chapter 1 Methodology Chapter 2 Analysis of Performance Metrics Chapter 3 Operational Analysis Appendix A Glossary of Terms

Municipal Transportation Quality Review | FY 16-17 and FY 17-18 SAN FRANCISCO MUNICIPAL TRANSPORTATION AGENCY
Nelson\Nygaard Consulting Associates, Inc. | ES-2
Figure ES-2 Goal 2: Make transit, walking, bicycling, taxi, ridesharing & carsharing the preferred means of travel
Metric Strategic
Plan Metric
Key Performance
Indicator Customer Rating: Overall Customer Satisfaction with Transit Services 2.1.1 Customer Rating: Communications to Passengers 2.1.5
Percentage of Actionable 311 Muni-related Complaints Addressed within 28 Days 2.1.7
Customer Rating: Cleanliness of Muni Vehicles 2.1.8 Customer Rating: Cleanliness of Muni Facilities (Stations, Elevators, Escalators) 2.1.9
Percentage of Transit Trips with <2 Minute Bunching on Rapid Network 2.2.1 Percentage of Transit Trips with >5 Minute Gaps on Rapid Network 2.2.1
Percentage of On-Time Performance for Non-Rapid Network Routes 2.2.2 Percentage of Scheduled Service Delivered (Trips) 2.2.3
Percentage of On-Time Departures from Terminals 2.2.4
On-Time Performance 2.2.6 Percentage of Trips Over Capacity During AM and PM Peaks (8:00a-8:59a, Inbound, 5:00p-5:59p, outbound) at Max Load Points 2.2.7
Mean Distance Between Failure 2.2.8 Percentage of Scheduled Service Hours Delivered 2.2.9
Ridership (Bus, Average Weekday) 2.2.11 Ridership (Metro Faregates, Average Weekday) 2.2.11
Operational Availability of Elevators at Muni Stations 2.2.12
Operational Availability of Escalators at Muni Stations 2.2.13
Figure ES-3 Goal 3: Improve the environment and quality of life in San Francisco
Metric Strategic
Plan Metric
Key Performance
Indicator Muni Ridership 3.2.1
Transit Passengers Per Revenue Hour 3.4.1 Average Annual Transit Cost Per Revenue Hour 3.4.2
Cost Per Unlinked Trip 3.4.3
Farebox Recovery Ratio 3.4.5
Figure ES-4 Goal 4: Create a workplace that delivers outstanding service
Metric Strategic
Plan Metric
Key Performance
Indicator Employee Satisfaction 4.2.1 Unscheduled Absence Rate for Transit Operators 4.3.3

Municipal Transportation Quality Review | FY 16-17 and FY 17-18 SAN FRANCISCO MUNICIPAL TRANSPORTATION AGENCY
Nelson\Nygaard Consulting Associates, Inc. | ES-3
Trends Trends of each metric are presented in Figures ES-5 – ES-8 below, categorized by Strategic Plan goal and audit period change. If a metric reports all modes, when one mode improved while another fell during the audit cycle, they are shown as separate items. Trends were not determined for metrics with only one year of data available.
Trend Ratings: Positive Trend X Negative Trend ○ Neutral Trend Figure ES-5 Trends of Goal 1 Metrics: Create a safer transportation experience for everyone
Strategic Plan Metric Metric Description
Audit Period Trend FY 16-17 FY 17-18
1.1.1 SFPD-Reported Muni-related crimes/100,000 miles 4.6 4.2
1.1.2 Customer Rating: Security of Transit Riding Experience (while on Muni vehicle) n/a 3.5 n/a
1.1.2 Customer Rating: Security of Transit Riding Experience (while waiting at stop or station) n/a 3.2 n/a
1.1.4 Security Complaints to 311 (Muni) ○ 3.6 3.6 1.2.1 Workplace Injuries/200,000 Hours X 12.4 12.9 1.2.2 Security Incidents Involving SFMTA Personnel (Muni Only) ○ 10.9 11.4 1.3.1 Muni Collisions/100,000 Miles 6.8 6.0 1.3.3 Muni Falls On Board/100,000 Miles 4.2 3.3 1.3.4 "Unsafe Operation" Muni Complaints to 311 178.6 169.4
1.3.5 Customer Rating: Safety of Transit Riding Experience n/a 3.9 n/a
Figure ES-6 Trends of Goal 2 Metrics: Make transit, walking, bicycling, taxi, ridesharing & carsharing the preferred means of travel
Strategic Plan Metric Metric Description
Audit Period Trend FY 16-17 FY 17-18
2.1.1 Customer Rating: Overall Customer Satisfaction with Transit Services n/a 3.2 n/a
2.1.5 Customer Rating: Communications to Passengers n/a 2.9 n/a
2.1.7 Percentage of Actionable 311 Muni-Related Complaints Addressed within 28 Days 74% 86%
2.1.8 Customer Rating: Cleanliness of Muni Vehicles n/a 3.0 n/a
2.1.9 Customer Rating: Cleanliness of Muni Facilities (Stations, Elevators, Escalators) n/a 2.5 n/a
2.2.1 Percentage of Transit Trips with <2 Minute Bunching on Rapid Network ○ 5.9% 5.9%
2.2.1 Percentage of Transit Trips with >5 Minute Gaps on Rapid Network 18.1% 16.9%
2.2.2 Percentage of On-Time Performance for Non-Rapid Network Routes X 59.5% 57.3%
2.2.3 Percentage of Scheduled Service Delivered (Trips) X 99.0% 97.4% 2.2.4 Percentage of On-Time Departures from Terminals ○ 75.0% 75.3% 2.2.6 On-Time Performance ○ 57.3% 57.3%

Municipal Transportation Quality Review | FY 16-17 and FY 17-18 SAN FRANCISCO MUNICIPAL TRANSPORTATION AGENCY
Nelson\Nygaard Consulting Associates, Inc. | ES-4
Strategic Plan Metric Metric Description
Audit Period Trend FY 16-17 FY 17-18
2.2.7 Percentage of Trips Over Capacity During AM and PM Peaks (8:00a-8:59a, Inbound, 5:00p-5:59p, Outbound) at Max Load Point
n/a
AM n/a 12.2%
PM n/a 10.4%
2.2.8 Mean Distance Between Failure: Bus 5,155 7,407
2.2.8 Mean Distance Between Failure: Historic Streetcar ○ 2,865 2,512
2.2.8 Mean Distance Between Failure: LRV ○ 5,218 5,204 2.2.9 Percentage of Scheduled Service Hours Delivered X 98.1% 97.5%
2.2.11 Ridership (Bus, Average Weekday) ○ 507,333 508,850 2.2.11 Ridership (Metro Faregate Entries, Average Weekday) X 70,236 64,865 2.2.12 Operational Availability of Elevators at Muni Stations 97.0% 98.0% 2.2.13 Operational Availability of Escalators at Muni Stations 91.4% 92.6%
Figure ES-7 Trends of Goal 3 Metrics: Improve the environment and quality of life in San Francisco
Strategic Plan Metric Metric Description
Audit Period Trend
FY 16-17
FY 17-18
3.2.1 Muni Ridership X 714,910 711,015 3.4.1 Transit Passengers per Hour 62.6 63.6 3.4.2 Average Annual Transit Cost per Revenue Hour $236.83 $220.39 3.4.3 Cost per Unlinked Trip X $3.49 $3.54 3.4.5 Farebox Recovery Ratio X 26% 25%
Figure ES-8 Trends of Goal 4 Metrics: Create a workplace that delivers outstanding service
Strategic Plan Metric Metric Description
Audit Period Trend
FY 16-17 FY 17-18
4.2.1 Employee Satisfaction X 3.4 3.3 4.3.3 Unscheduled Absence Rate by Transit Operators X 8.1% 9.1%
REVIEW OF DATA COLLECTION AND REPORTING METHODS Gaps in Reporting Several metrics did not report monthly statistics for the entirety of the audit period. The gaps in data were caused by changing data collection techniques and changes to data collection processes during technology upgrades. Gaps in reporting affected the following metrics:
1.1.2 – Customer Rating: Security of Transit Riding Experience 1.3.5 – Customer Rating: Safety of Transit Riding Experience 2.1.1 – Customer Rating: Overall Customer Satisfaction with Transit Services 2.1.5 – Customer Rating: Communications to Passengers 2.1.8 – Customer Rating: Cleanliness of Muni Vehicles

Municipal Transportation Quality Review | FY 16-17 and FY 17-18 SAN FRANCISCO MUNICIPAL TRANSPORTATION AGENCY
Nelson\Nygaard Consulting Associates, Inc. | ES-5
2.1.9 – Customer Rating: Cleanliness of Muni Facilities (Stations, Elevators, Escalators) 2.2.1 – Percentage of Transit Trips with Bunching and Gaps on Rapid Network 2.2.2 – On-Time Performance for Non-Rapid Network Routes 2.2.4 – Percentage of On-Time Departures from Terminals 2.2.6 – Percentage of On-Time Performance (OTP) 2.2.7 – Percentage of Trips Over Capacity During AM Peak (8:00a-8:59a, Inbound) at Max Load Points and
Percentage of Trips Over Capacity During PM Peak (5:00p-5:59p, Outbound) at Max Load Points
RECOMMENDATIONS Auditor recommendations focus on ways to further refine or improve performance reporting to make it more relevant to the SFMTA and the public, or on ways to improve performance in areas where Muni has not yet met its goals. Although the recommendations focus on the two-year audit period ending on June 30, 2018, they may reflect any developments that have been made since that time. The recommendations are reviewed with SFMTA staff to ensure that they are in line with current budget and resource constraints. The following section summarizes general and measure-specific recommendations, which are discussed in detail in Chapter 3.
Between FY 16-17 and FY 17-18, Muni made improvements in important areas of customer rating surveys and using more industry standard language for particular metrics. After this audit period, additional changes have been implemented, including recommendations from the last cycle. In order to assess recent implementations, new recommendations have not been developed for recently changed metrics. This will provide time to analyze the performance of the past recommendations.
This audit cycle FY 16-17 and FY 17-18 coincides with the last year of the 2013-2018 SFMTA Strategic Plan. Since the agency adopted the last strategic plan in 2012, San Francisco and the Bay Area region has seen significant changes that have affected the city’s transportation system and the overall mobility of its residents, workers and visitors. In response to these changes and in accordance with San Francisco Charter Section 8A.103 “Service Standards and Accountability,” the agency developed a new strategic plan, adopted in FY 18-19. This plan will guide the entirety of the agency’s work across the city and track its performance for the next two-year budget cycle ending in FY 19-20. In a change from past years, SFMTA will revisit and adjust performance targets on a biannual basis based on input from subject matter experts. Additionally, several new performance metrics have been adopted for FY 19-20.
IMPLEMENTED FROM THE LAST AUDIT Recommendations SFMTA has implemented since the FY 15-16 quality review audit include:
Replaced the quarterly panel survey with the annual rider survey. Applies to all customer survey related metrics. Normalized the security complaints to 311 by mileage for 1.1.4. Replaced 2.2.3 with Scheduled Service Hours Delivered. The metric was previously Percentage of Schedule
Serviced Trips Delivered. Renamed 2.2.6 Muni On-Time Performance. Implemented the recommendation for 3.4.2 to report average passengers per revenue hour for all transit modes
starting in FY 17-18. Renamed 2.2.12 and 2.2.13 to more user-friendly and industry standard terms: Operational Availability of
Elevators at Muni Stations and Operational Availability of Escalators at Muni Stations.
CURRENT RECOMMENDATIONS General Denote methodological changes that happen mid-cycle and leave out historical trend data when appropriate if
definitions have changed in ways that impact comparability of data over time. Formalize standard operating procedures as new technologies come online. Adopt data governance policies to
ensure smooth transitions from older legacy data systems to newer technologies and ensure consistent and acceptable uses of data.

Municipal Transportation Quality Review | FY 16-17 and FY 17-18 SAN FRANCISCO MUNICIPAL TRANSPORTATION AGENCY
Nelson\Nygaard Consulting Associates, Inc. | ES-6
Measure-Specific 1.1.1 SFPD-reported Muni-related crimes/100,000 miles
• Continue efforts with SFPD to automate the regular reporting of crime data. 1.1.4 Security Complaints to 311 (Muni)
• Show this metric quarterly on a historic chart to track seasonal crime. 1.2.1 Workplace Injuries/200,000 Hours
• Investigate the type of injuries occurring in the workplace. 1.2.2 Security incidents involving SFMTA personnel (Muni only)
• Finalize development of a standard operating procedure to ensure all security incidents are entered into Intelex.
1.3.3 Muni falls on board/100,000 miles • This metric was discontinued in FY 18-19.
1.3.4 “Unsafe operation” Muni complaints to 311 • This metric was discontinued in FY 18-19.
2.2.1 Percentage of transit trips with bunching and gaps on Rapid Network • Expand reporting to show bunching and gaps by service category.
2.2.2 On-time performance for non-Rapid Network routes • Expand reporting to show on-time performance by service category.
2.2.4 Percentage on-time departure from terminals • Expand reporting to show on-time departures from terminals by service category.
2.2.7 Percentage of Trips Over Capacity During AM/PM Peak • Consider using the current internal target for this metric externally.
2.2.8 Mean distance between failure (MDBF) • Consider implementing a new metric “Preventative Maintenance: Percentage On-Time Completion.”
2.2.9 Percentage of scheduled service hours delivered • Transition data collection to OrbStar CAD/AVL radio system.
3.4.2 Average passengers per revenue hour (bus) • Change the metric name to be “Average Annual Operating Cost per Revenue Hour.”
4.2.1 Employee satisfaction • Improve response rates to the survey.
Chapter 1 Methodology
Article VIIIA of the San Francisco City Charter mandates an audit of data collection and reporting methods for transit-related service standards every two years. Defining performance metrics (also known as service standards) in the City Charter and Strategic Plan(s) ensures that SFMTA has the tools needed to create a world-class transit service. While the City Charter provides the basic framework for transit service standards, the FY 2013–2018 Strategic Plan fills in the gaps to help tell the story of how well SFMTA is meeting its goals and objectives.
When not specified by the San Francisco City Charter, the SFMTA Board adopts methods and definitions of measurement as well as specific goals and milestones for each of the performance metrics. The Muni Citizens’ Advisory Council (CAC) and the SFMTA Board review the definitions and methods of measurement, and the goals for each of the performance metrics annually. Performance metrics are displayed publicly on dashboards at sfmta.com/performance-metrics, and metrics reports are produced and distributed to the SFMTA Board on a monthly basis.
The Performance & Process Improvement Team, housed within the Performance section of the Finance and Information Technology Division, is responsible for reporting the service standards stated in the San Francisco City Charter as well as the performance metrics associated with the Strategic Plan. The Performance Team continuously evaluates whether additional metrics are warranted and makes annual recommendations for metric updates to the SFMTA board.
For this report, independent auditors reviewed the source data that goes into producing the SFMTA’s monthly Strategic Plan Metrics Reports. SFMTA staff were a key resource in explaining changes in data collection or methodology. Auditors spoke with relevant staff at meetings, by phone, and via email to review procedures and dig deeper into trends or anomalies in the actual reported data. Staff also provided auditors with relevant presentations or documentation to provide context.
REVIEW OF DATA COLLECTION METHODS The SFMTA aims to automate as many data collection processes as possible. Technology and software upgrades provide the SFMTA the opportunity to improve the reliability and accuracy of data and reporting. They offer the SFMTA the ability to drill down to levels of granularity that were not previously possible. With a better understanding of data and trends, there is an opportunity to enhance the focus of analysis. During this audit period, the collection of data remained reliable and transparent for most systems with the exception of metrics using customer surveying, which is detailed below.
Automated Systems Major technology upgrades relevant to data collection for this report include the deployment of:
OrbStar CAD/AVL radio and Automatic Passenger Counters Odyssey Electric Validating Fareboxes Arrival prediction software (NextBus) Infor Enterprise Asset Management System (EAMS)
NextBus arrival prediction uses GPS technology and a proprietary algorithm that incorporates historical travel data to track transit vehicles and predict their arrival time. The metrics that used the NextBus arrival prediction include:
2.2.1 Percentage of Transit Trips with Bunching and Gaps on Rapid Network
2.2.2 On-Time Performance for Non-Rapid Network Routes
2.2.4 Percentage of On-Time Departures from Terminals
2.2.6 Systemwide On-Time Performance
Automatic Passenger Counters (APCs) are mounted on the doors of about 60% of buses in the system in order to track ridership. APC-equipped buses are deployed on routes all over the system, collecting average daily ridership by

Municipal Transportation Quality Review | Fiscal Years 2017-2018 SAN FRANCISCO MUNICIPAL TRANSPORTATION AGENCY
Nelson\Nygaard Consulting Associates, Inc. | 1-2
route over the course of each month. During this audit period, many buses with older-generation APCs were retired as new buses with newer-generation APCs began service. During the transition to the new APC technology deployed on the newer Muni bus fleet, there was insufficient coverage of operational APC data collection and processing to produce reportable estimates of crowding. In future audits, the OrbStar CAD/AVL radio system will incorporate APC data with all other onboard systems to provide more reliable and fully integrated service data. Additional integration between the existing legacy and newer-generation APC data collection systems was in operation for FY 17-18. The lack of broad APC data collection across all bus lines affects the following metrics:
2.2.7 Percentage of Trips Over Capacity During Peak at Max Load Points
2.2.11 Ridership (Bus and Metro Faregates, Average Weekday)
The Passenger Service Reports (PSR) process includes an automated tabulation that reads Trapeze customer service system records directly. Metrics include:
1.1.4 Security Complaints to 311
1.3.4 "Unsafe Operation" Muni Complaints to 311
2.1.7 Percent of Actionable 311 Muni-related Complaints Addressed within 28 days
Manual Data Collection Methods The Performance Team is still working with the SFPD to establish a process for collecting incident data that limits the risks of infrequently reported data. There were no major issues with data collection during this audit period; however, the data sharing relies on manual updates that could be automated for more consistent and reliable data reporting. This impacts one metric:
1.1.1 SFPD-reported Muni-related crimes per 100,000 miles
The TransitSafe data repository system requires staff to hand-enter reports into the system. This is the system of record for security incidents and collisions. Intelex will be replacing the TransitSafe data repository as the SFMTA’s central safety management system in 2020.
Metrics that rely on accurate data entry in TransitSafe include:
1.2.2 Security Incidents Involving SFMTA Personnel (Muni)
1.3.1 Muni Collisions/100,000 Miles
1.3.3 Muni Falls on Board/100,000 Miles
The data collection efforts are different between rail, bus, and cable car for mean distance between failures (Metric 2.2.8). For buses, the process entails the reconciliation between actual maintenance road calls and reported incidents within the SHOPS maintenance database. For rail, all delay incident data from the OCC are downloaded by staff and manually searched and matched to work orders in the SHOPS database, and ultimately summarized in spreadsheets. Cable car maintenance staff discontinued reporting mean distance between failure (MDBF) after March 2016. Beginning after this audit cycle, a new cable car metric was developed: service hours delivered without interruption (Metric 2.1.6).
Workers’ Compensation claims are tracked monthly and reported in a monthly Workers’ Claim Status Report. The definition of “injury” did not change over the course of the 2013 – 2018 Strategic Plan. Due to the nature of reporting, there can be a lag between actual and reported incidents.
Methodology Changes Per recommendations from the FY 14-15 and FY 15-16 audit, the quarterly customer satisfaction surveys were discontinued in FY 16-17 and the Annual Muni Rider Survey became the source of customer opinion data starting in FY 18-19. The Annual Muni Rider Survey provides a more scientifically collected sample and results in less survey fatigue. Both surveys have significant question overlap to provide data for the metrics below. The Annual Muni Rider survey for FY 17-18 was not reported on, creating a gap for FY 17-18 that impacted the following metrics:

Municipal Transportation Quality Review | Fiscal Years 2017-2018 SAN FRANCISCO MUNICIPAL TRANSPORTATION AGENCY
Nelson\Nygaard Consulting Associates, Inc. | 1-3
1.1.2 Customer Rating: Security of Transit Riding Experience while on a Muni Vehicle; While Waiting at a Muni Stop or Station
1.3.5 Customer Rating: Safety of Transit Riding Experience
2.1.1 Customer Rating: Overall Customer Satisfaction with Transit Services
2.1.5 Customer Rating: Communications to Passengers
2.1.8 Customer Rating: Cleanliness of Muni Vehicles
2.1.9 Customer Rating: Cleanliness of Muni Facilities
REVIEW OF REPORTING DATA COLLECTION METHODS Reporting Methods Transtat is the SFMTA’s central performance business intelligence tool introduced in FY 12-13 to help fulfill the SFMTA leadership’s commitment to timely and transparent performance reporting. Used to produce the monthly Strategic Plan Metrics Reports analyzed in this audit, it also functions as a crucial data analysis and visualization tool for Agency employees.
Transtat allows all divisions to regularly monitor performance data that is most relevant to them. SFMTA executive staff and the Performance Team hold monthly “Transtat” meetings designed to review key metric trends and discuss possible actions aimed at improving performance. Examples of meeting topics include operations, maintenance, and security which rotate on a set schedule.
Monthly Strategic Plan Metrics Reports are published to track the progress of each metric. These reports include data for the 12 months prior to the month of publication, as well as average annual data as far back as FY 11-12, where applicable. Currently, Strategic Plan Metrics Reports measure progress in two ways:
For Key Performance Indicators (KPIs), specific targets were set forth in the FY 2013–2018 Strategic Plan. Monthly and average yearly performance is compared to the previous year.
Performance trends that look out of the ordinary show up quickly in Transtat, allowing Agency staff to analyze whether problems are related to actual performance, or whether there is a problem with data collection.


Chapter 2 Analysis of SFMTA Transit Performance Metrics
Article VIIIA of the San Francisco City Charter specified measures and targets for on-time performance and service delivery and directed the Agency to set additional measurable standards for system reliability, system performance, staffing performance, and customer service. Additional metrics were created through the FY 2013–FY2018 Strategic Plan, which addressed four overarching goals tied to key performance metrics. This chapter discusses in detail the Strategic Plan metrics related to Muni transit performance.
The metrics are grouped by the four goals listed in the FY 2013–FY 2018 Strategic Plan. In this chapter, the following elements are provided, as applicable:
Purpose: to explain why the metric is being reported.
Description: to provide the meaning of the metric.
Method: to explain how data are collected, reported, and analyzed to produce the metric.
City Charter Target or Strategic Plan Target: Latest annual target for the metric, if the metric serves as a Key Performance Indicator.
FY 16-17 and FY 17-18 Performance: Whether the SFMTA achieved the metric target during the audit period.
Trend: Assessment of the audit period performance, determined to be positive, negative, or neutral in relation to attainment of targets or, in the absence of a target, as pertains to improvement of performance. Trends were not determined for metrics with only one year of data available.
Audit Period Performance: Graphical or tabular representation of FY 16-17 and FY 17-18 data.
Historic Performance: Graphical or tabular representation of historical data, where such data are available.
Discussion: Describes observed trends and/or the results of interviews with applicable SFMTA staff.
Recommendations: Identifies where problems or inefficiencies in data collection, reporting, or analysis may be occurring and recommends: 1) clear solutions to these problems and/or 2) approaches the SFMTA may take in addressing the issues.
As a reminder, the analysis contained in this chapter focuses on Muni performance for each of the metrics that were in effect during the period covered by this review (FY 16-17 and FY 17-18). Up-to-date monthly performance reports can be viewed on the SFMTA website.

.

Goal 1: Create a safer transportation experience for everyone


Municipal Transportation Quality Review | FY 16-17 and FY 17-18 SAN FRANCISCO MUNICIPAL TRANSPORTATION AGENCY
Nelson\Nygaard Consulting Associates, Inc. | 2-5
1.1.1 SFPD-Reported Muni-Related Crimes/100,000 Miles
Purpose To measure passenger and public safety on Muni. Description: This metric tracks security incidents on Muni vehicles and at stops and stations that result in an SFPD police report.
Method: Data from the SFPD Crime Data Warehouse are exported and emailed monthly to the SFMTA Security, Investigations & Enforcement (SIE) staff and uploaded into an SFMTA database. Incidents are reported directly from the database and normalized to mileage counts from the SHOPS asset management data system. Strategic Plan FY 17-18 Target: 5.3. General: 10% reduction in incidents each budget cycle.
Discussion Reported Muni-related crimes per 100,000 miles have been decreasing since FY 13-14, including a decrease over the audit period. The number of crimes during the audit period stayed under the target each month, except for one month in Q1 of FY 16-17.
The transmissions of data from SFPD to the SFMTA is still a heavily human-driven process. Analysts wait for a spreadsheet each month, and although the process has become more reliable, there can still be lags in data delivery.
Recommendations Establish an automated protocol for receiving crime data from SFPD on a regular basis. Muni staff should work with the SFPD to develop procedures to access the relevant crime data regularly, either by creating a data warehouse from which Muni staff can export a designated query, or by designating SFPD personnel to send specific data directly to the Muni staff on a timely and consistent basis.
FY 16-17 & FY 17-18 Performance
Trend
✓ Goal Achieved ✓ Positive
Audit Period Performance
Historic Performance FY 12-13
Avg FY 13-14
Avg FY 14-15
Avg FY 15-16
Avg FY 16-17
Avg FY 17-18
Avg 7.6 9.5 8.2 6.4 4.6 4.2
5.3
0
1
2
3
4
5
6
7
Muni
-Rela
ted C
rimes
/100,0
00 m
iles
Muni-relatedCrimes/100,000 MilesGoal
Municipal Transportation Quality Review | FY 16-17 and FY 17-18 SAN FRANCISCO MUNICIPAL TRANSPORTATION AGENCY
Nelson\Nygaard Consulting Associates, Inc. | 2-6
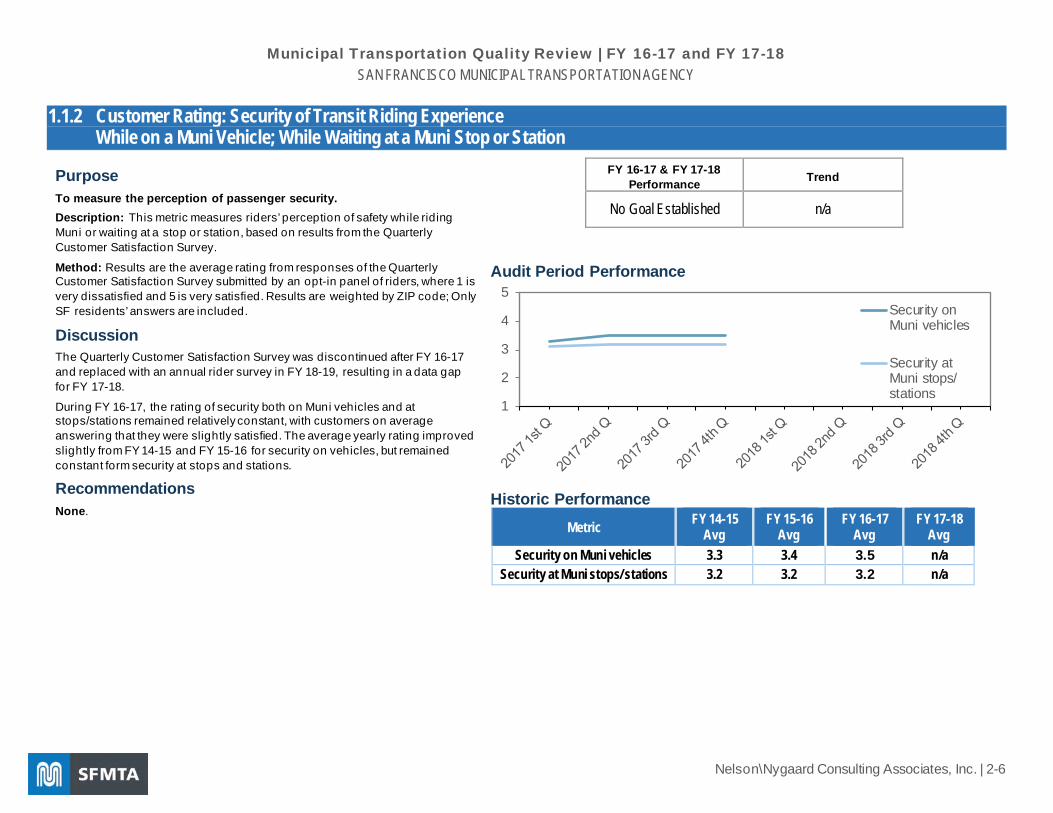
1.1.2 Customer Rating: Security of Transit Riding Experience While on a Muni Vehicle; While Waiting at a Muni Stop or Station
Purpose To measure the perception of passenger security. Description: This metric measures riders’ perception of safety while riding Muni or waiting at a stop or station, based on results from the Quarterly Customer Satisfaction Survey.
Method: Results are the average rating from responses of the Quarterly Customer Satisfaction Survey submitted by an opt-in panel of riders, where 1 is very dissatisfied and 5 is very satisfied. Results are weighted by ZIP code; Only SF residents’ answers are included.
Discussion The Quarterly Customer Satisfaction Survey was discontinued after FY 16-17 and replaced with an annual rider survey in FY 18-19, resulting in a data gap for FY 17-18.
During FY 16-17, the rating of security both on Muni vehicles and at stops/stations remained relatively constant, with customers on average answering that they were slightly satisfied. The average yearly rating improved slightly from FY 14-15 and FY 15-16 for security on vehicles, but remained constant form security at stops and stations.
Recommendations None.
FY 16-17 & FY 17-18 Performance Trend
No Goal Established n/a
Audit Period Performance
Historic Performance
Metric FY 14-15 Avg
FY 15-16 Avg
FY 16-17 Avg
FY 17-18 Avg
Security on Muni vehicles 3.3 3.4 3.5 n/a Security at Muni stops/ stations 3.2 3.2 3.2 n/a
1
2
3
4
5Security onMuni vehicles
Security atMuni stops/stations

Municipal Transportation Quality Review | FY 16-17 and FY 17-18 SAN FRANCISCO MUNICIPAL TRANSPORTATION AGENCY
Nelson\Nygaard Consulting Associates, Inc. | 2-7
1.1.4 Security Complaints to 311 (Muni)
Purpose To measure passenger security. Description: This metric tracks incidents in the “Criminal Activity” category of 311 data, including incidents such as miscellaneous altercations, larceny/theft, fare evasion/transfer abuse, and disorderly conduct/disturbances. sf311.org is the primary customer service center for the City of San Francisco.
Method: Complaints are recorded as a part of the Passenger Service Reports (PSR) process, which includes automatic tabulation by the Trapeze customer service system.
Discussion This metric is based on the number of security incidents reported via the 311 system; the actual number of incidents may be under-reported. The previous audit cycle recommendation to normalize this metric to mileage has been implemented, and a historical analysis was performed. It will be available for publication in the next audit cycle.
The number of 311 security complaints fluctuated over the audit period, with an annual average of 36.6 for both FY 16-17 and FY 17-18. While the trend was positive in the few years after FY 12-13, it has been negative since FY 15-16.
The audit period high of 56 was in Q1 of FY 17-18 and the low of 21 occurred in Q1 of FY 16-17.
Recommendations Show this metric quarterly on a historic chart. Tracking seasonal crime may lead to more insight.
FY 16-17 & FY 17-18 Performance
Trend
No Goal Established ○ Neutral
Audit Period Performance
Historic Performance FY 12-13
Avg FY 13-14
Avg FY 14-15
Avg FY 15-16
Avg FY 16-17
Avg FY 17-18
Avg 36.4 28.6 37.2 28.8 36.6 36.6
0
10
20
30
40
50
60
Muni
-Rela
ted C
rimes
per 1
00,00
0/Mile
s

Municipal Transportation Quality Review | FY 16-17 and FY 17-18 SAN FRANCISCO MUNICIPAL TRANSPORTATION AGENCY
Nelson\Nygaard Consulting Associates, Inc. | 2-8
1.2.1 Workplace Injuries/200,000 Hours
Purpose To measure employee safety at work. Description: This metric tracks the number of workplace injuries per 200,000 hours, which is based on a 40-hour workweek for 100 full-time employees.
Method: Tracks monthly Worker’s Compensation (WC) claims opened as reported in the monthly Worker’s Claim Status Report, in relation to monthly employee pay hours. Report is provided each month through a vendor. In the context of these WC claims, an “injury” is an event that occurs to any SFMTA employee that results in any form of medical treatment or lost time from work. This includes any incident such as a cut, fracture, sprain, amputation, etc. which results from a work accident.
Strategic Plan FY 17-18 Target: 11.3 per 200,000 hours.
Discussion This metric is based on the U.S. Department of Labor’s definition of the injury incidence rate. The rate at the SFMTA declined between FY 12-13 and FY 14-15, but the increase in FY 15-16 and again in FY 17-18 was enough to result in the audit period trending negatively upward. The SFMTA did not meet the goal of 11.3 workplace injuries/200,000 hours in FY 16-17 and 17-18, other than for parts of Q2 and Q3 in FY 16-17 and Q2 in FY 17-18.
Since this metric reflects injury data for the months that WC claims are received rather than the actual month of injury occurrence, there may be a lag between actual and reported incidents.
Recommendations Investigate the type of injuries occurring in the workplace. Through conducting more research into the types of injury, targeted solutions can help fix the trend of workplace injuries in the right direction.
FY 16-17 & FY 17-18 Performance
Trend
✗ Goal Not Achieved ✗ Negative
Audit Period Performance
Historic Performance
FY 12-13 Avg
FY 13-14 Avg
FY 14-15 Avg
FY 15-16 Avg
FY 16-17 Avg
FY 17-18 Avg
13.8 12.1 11.0 12.8 12.4 12.9
11.3
02468
101214161820
Wor
kplac
e Inju
ries p
er 20
0,000
Hou
rs
Workplace injuries/200,000 hoursGoal

Municipal Transportation Quality Review | FY 16-17 and FY 17-18 SAN FRANCISCO MUNICIPAL TRANSPORTATION AGENCY
Nelson\Nygaard Consulting Associates, Inc. | 2-9
1.2.2 Security Incidents Involving SFMTA Personnel (Muni Only)
Purpose To measure employee security. Description: This metric tracks the number of security incidents reported by Muni personnel. Incidents are defined as assaults and threats.
Method: Incidents are reported directly from the system’s database and recorded in the SFMTA’s internal TransitSafe software system.
Discussion After improving for three fiscal years, there was a major increase in security incidents involving the SFMTA personnel between FY 14-15 and FY 15-16 from 8.3 to 12.8. The number of incidents decreased to 10.9 in FY 16-17 and increased again to 11.4 in FY 17-18.
During the next audit cycle, Intelex will replace TransitSafe as the method for logging security incidents. Incident reporting should be consistent so that historical comparisons will still be possible. The new OrbStar CAD/AVL radio system may impact how calls get logged initially, and getting the workflow stabilized will involve a learning curve for the SFMTA staff. Project staff are working to ensure all business units will be logging in.
Recommendations Finalize development of a standard operating procedure to ensure all security incidents are entered into Intelex. As incident reporting is expanded to all staff, not just operator incidents, a standardized procedure should help new users understand how the program works and encourage them to use it. A standardized procedure is currently in development and is planned for transition later this year.
FY 16-17 & FY 17-18 Performance
Trend
No Goal Established ○ Neutral
Audit Period Performance
Historic Performance FY 12-13
Avg FY 13-14
Avg FY 14-15
Avg FY 15-16
Avg FY 16-17
Avg FY 17-18
Avg 12.1 9.9 8.3 12.8 10.9 11.4
02468
101214161820
Secu
rity I
ncide
nts I
nvolv
ing S
FMTA
Pe
rson
nel (M
uni o
nly)

Municipal Transportation Quality Review | FY 16-17 and FY 17-18 SAN FRANCISCO MUNICIPAL TRANSPORTATION AGENCY
Nelson\Nygaard Consulting Associates, Inc. | 2-10
1.3.1 Muni Collisions/100,000 Miles
Purpose To measure the frequency of collisions. Description: This metric tracks collisions involving a Muni vehicle. A “collision” is defined as contact between one of Muni’s vehicles and another vehicle, person, or object. Method: SFMTA staff manually enter individual hand-written incident reports into the TransitSafe system. Incidents are reported directly from the system’s database and normalized to mileage from the SHOPS asset management data system. Strategic Plan FY 17-18 Target: 3.5 per 100,000 miles and reduce the collision rate by 10% every two years.
Discussion The City Charter calls for a measurable standard for the frequency and mitigation of accidents and breakdowns. Muni collisions per 100,000 miles is an industry standard for tracking collision frequency.
The number of Muni collisions has risen over the last decade, hitting a ten-year high of 6.8 collisions per 100,000 miles in FY 16-17. The number has dropped to 6.03 collisions in FY 17-18.
The TransitSafe data system is being replaced by Intelex in FY 18-19. The new system should reduce the amount of manual data entry, with further efficiencies likely to take place in the coming years as the workflow develops.
Recommendations None.
FY 16-17 & FY 17-18 Performance
Trend
✗ Goal Not Achieved ✓ Positive
Audit Period Performance
Historic Performance
3.5
0123456789
Muni
Col
lision
s/Fall
s per
10
0,000
Mile
s
Muni Collisions/100,000 Miles Collisions Goal
5.6 5.74.8
4.3
5.6 5.96.4 6.6 6.8
6.0
012345678
Muni
Col
lision
s/Fall
s per
10
0,000
Mile
s

Municipal Transportation Quality Review | FY 16-17 and FY 17-18 SAN FRANCISCO MUNICIPAL TRANSPORTATION AGENCY
Nelson\Nygaard Consulting Associates, Inc. | 2-11
1.3.3 Muni Falls on Board/100,000 Miles
Purpose To measure passenger safety. Description: A fall on board is defined as when a rider falls while on board a Muni vehicle.
Method: The SFMTA staff manually enter individual hand-written incident reports into the TransitSafe system. Incidents are reported directly from the system’s database and normalized to mileage from the SHOPS asset management data system.
Discussion The rate of falls on board decreased during this audit period, with a low of 2.7 falls on board per 100,000 miles in Q3 in FY 17-18, down from a high of 5.2 in Q4 of FY 16-17. The number of falls per 100,000 miles dropped to 3.3 falls in FY 17-18, down from a high of 4.8 in FY 09-10.
Recommendations This metric will be discontinued in FY 18-19.
FY 16-17 & FY 17-18 Performance
Trend
No Goal Established ✓ Positive
Audit Period Performance
Historic Performance
0123456
Mun
i Fal
ls O
n Bo
ard
per
100,
000
Mile
s
3.9
4.8 4.7 4.74.20 4.40 4.40 4.50 4.20
3.30
0123456
Mun
i Fal
ls O
n Bo
ard
per 1
00,0
00 M
iles

Municipal Transportation Quality Review | FY 16-17 and FY 17-18 SAN FRANCISCO MUNICIPAL TRANSPORTATION AGENCY
Nelson\Nygaard Consulting Associates, Inc. | 2-12
1.3.4 “Unsafe Operation” Muni Complaints to 311
Purpose To measure the perception of passenger safety. Description: This metric tracks the perception of passenger safety based on the number of Muni complaints via 311 that are categorized as an unsafe operation. Types of activities deemed to be “Unsafe Operations” include running a red light or stop sign, speeding, being allegedly under the influence of drugs or alcohol, using a mobile phone or radio, eating, drinking or smoking, and general careless operation. It also includes other incidents captured in other tracked metrics, such as a collision, a fall boarding/on board/alighting that causes an injury.
Method: Complaints are recorded as a part of the Passenger Service Reports (PSR) process, which includes automatic tabulation by the Trapeze customer service system.
Discussion The average number of reported “unsafe operation” complaints increased from FY 12-13 to FY 15-16, and has decreased between FY 15-16 and FY 17-18, trending positively. Over the audit period of FY 16-17 and FY 17-18, the number of complaints fluctuated for both years, with a low of 110 in Q3 of FY 16-17 and high of 215 in Q2 of FY 17-18.
Recommendations This metric is being discontinued in FY 18-19.
FY 16-17 & FY 17-18 Performance
Trend
No Goal Established ✓ Positive
Audit Period Performance
Historic Performance FY 12-13
Avg FY 13-14
Avg FY 14-15
Avg FY 15-16
Avg FY 16-17
Avg FY 17-18
Avg 157.3 174.3 179.6 183.5 178.6 169.4
0
50
100
150
200
250
"Uns
afe O
pera
tion"
Mu
ni C
ompl
aints
to 31
1

Municipal Transportation Quality Review | FY 16-17 and FY 17-18 SAN FRANCISCO MUNICIPAL TRANSPORTATION AGENCY
Nelson\Nygaard Consulting Associates, Inc. | 2-13
1.3.5 Customer Rating: Safety of Transit Riding Experience
Purpose To measure the perception of passenger safety. Description: Measures riders’ perception of safety of the transit riding experience based on the average rating from the Quarterly Customer Satisfaction Survey.
Method: Results are the average rating from responses of the Quarterly Customer Satisfaction Survey submitted by an opt-in panel of the SFMTA customers, where 1 is very dissatisfied and 5 is very satisfied. Results are weighted by ZIP code; only SF residents’ answers are included.
Discussion The Quarterly Customer Satisfaction Survey was discontinued after FY 16-17 and will be replaced with an annual rider survey in FY 18-19, resulting in a data gap for FY 17-18. In FY 16-17, surveyed Muni customers were satisfied with the perception of safety for the overall transit experience. Respondents were slightly more satisfied in FY 16-17 than FY 14-15 and FY 15-16.
Recommendations None.
FY 16-17 & FY 17-18 Performance
Trend
No Goal Established n/a
Audit Period Performance
FY 16-17 FY 17-18 Q1 Q2 Q3 Q4 Q1 Q2 Q3 Q4 3.9 3.9 3.9 3.9 n/a n/a n/a n/a
Historic Performance FY 14-15
Avg FY 15-16
Avg FY 16-17
Avg FY 17-18
Avg 3.7 3.8 3.9 n/a


Goal 2: Make transit, walking, bicycling, taxi, ridesharing & carsharing the preferred means of travel
Municipal Transportation Quality Review | FY 16-17 and FY 17-18 SAN FRANCISCO MUNICIPAL TRANSPORTATION AGENCY
Nelson\Nygaard Consulting Associates, Inc. | 2-16
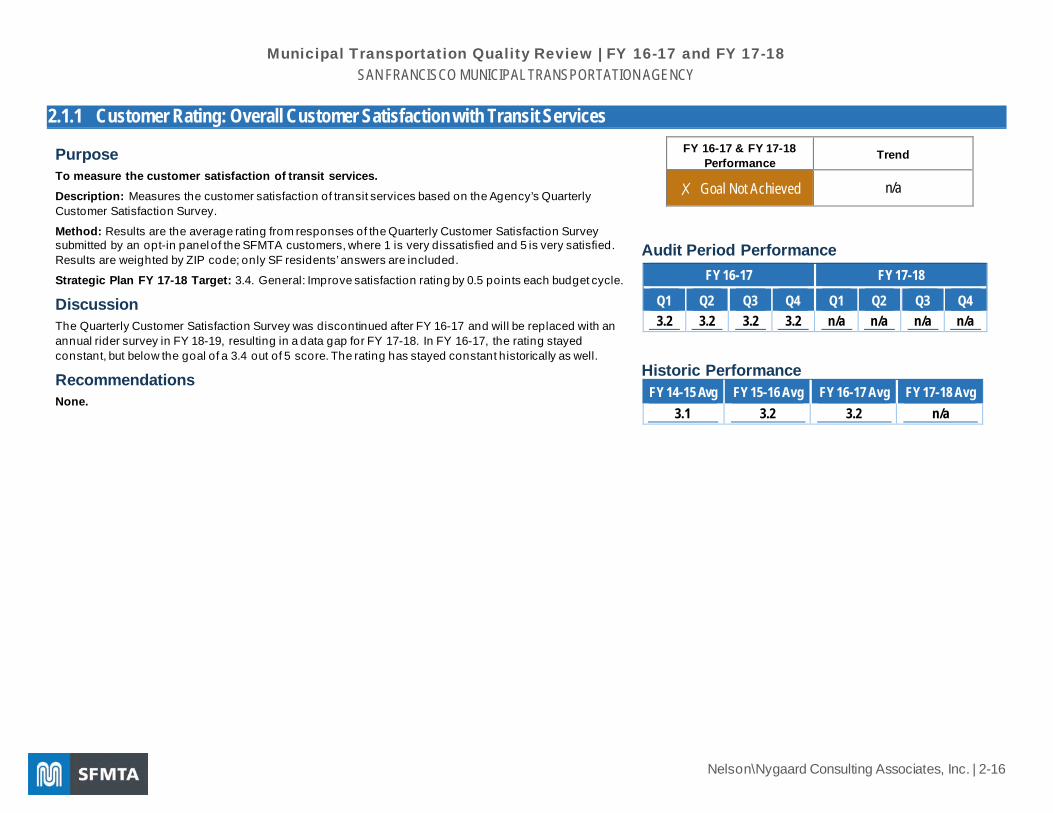
2.1.1 Customer Rating: Overall Customer Satisfaction with Transit Services
Purpose To measure the customer satisfaction of transit services. Description: Measures the customer satisfaction of transit services based on the Agency’s Quarterly Customer Satisfaction Survey.
Method: Results are the average rating from responses of the Quarterly Customer Satisfaction Survey submitted by an opt-in panel of the SFMTA customers, where 1 is very dissatisfied and 5 is very satisfied. Results are weighted by ZIP code; only SF residents’ answers are included.
Strategic Plan FY 17-18 Target: 3.4. General: Improve satisfaction rating by 0.5 points each budget cycle.
Discussion The Quarterly Customer Satisfaction Survey was discontinued after FY 16-17 and will be replaced with an annual rider survey in FY 18-19, resulting in a data gap for FY 17-18. In FY 16-17, the rating stayed constant, but below the goal of a 3.4 out of 5 score. The rating has stayed constant historically as well.
Recommendations None.
FY 16-17 & FY 17-18 Performance
Trend
✗ Goal Not Achieved n/a
Audit Period Performance
FY 16-17 FY 17-18
Q1 Q2 Q3 Q4 Q1 Q2 Q3 Q4 3.2 3.2 3.2 3.2 n/a n/a n/a n/a
Historic Performance FY 14-15 Avg FY 15-16 Avg FY 16-17 Avg FY 17-18 Avg
3.1 3.2 3.2 n/a

Municipal Transportation Quality Review | FY 16-17 and FY 17-18 SAN FRANCISCO MUNICIPAL TRANSPORTATION AGENCY
Nelson\Nygaard Consulting Associates, Inc. | 2-17
2.1.5 Customer Rating: Communications to Passengers
Purpose To measure the quality and responsiveness of customer service. Description: Measures the effectiveness of Muni communications to passengers based on the Quarterly Customer Satisfaction Survey.
Method: Results are the average rating from responses of the Quarterly Customer Satisfaction Survey submitted by an opt-in panel of the SFMTA customers, where 1 is very dissatisfied and 5 is very satisfied. Results are weighted by ZIP code; only SF residents’ answers are included.
Discussion The Quarterly Customer Satisfaction Survey was discontinued after FY 16-17 and will be replaced with an annual rider survey in FY 18-19, resulting in a data gap for FY 17-18. The FY 16-17 rating stayed constant, with customers scoring Communications to Passengers as a 2.9 out of 5. Historically, the rating has been at around the same level as well.
Recommendations None.
FY 16-17 & FY 17-18 Performance
Trend
No Goal Established n/a
Audit Period Performance
FY 16-17 FY 17-18 Q1 Q2 Q3 Q4 Q1 Q2 Q3 Q4 2.9 3.0 2.9 2.9 n/a n/a n/a n/a
Historic Performance FY 14-15 Avg FY 15-16 Avg FY 16-17 Avg FY 17-18 Avg
2.8 2.9 2.9 n/a

Municipal Transportation Quality Review | FY 16-17 and FY 17-18 SAN FRANCISCO MUNICIPAL TRANSPORTATION AGENCY
Nelson\Nygaard Consulting Associates, Inc. | 2-18
2.1.7 Percentage of actionable 311 Muni operator conduct complaints addressed within 28 business days
Purpose To measure the quality and responsiveness of customer service. Description: The SFMTA’s Muni Customer Service unit converts passengers’ complaints, comments, questions, and compliments into Passenger Service Reports (PSRs). “Actionable” PSRs are those that are determined to warrant a follow up action with a transit operator. This metric only includes operator conduct complaints within a Muni operations division. “Addressed” signifies that an event has been closed in the system within 28 business days, the window in which discipline may be brought to a transit operator following a conduct complaint according to the Agency’s MOU with the Operator’s union. Method: Prior to FY 15-16, the SFMTA customer service staff compiled a list exported from Trapeze of actionable PSRs closed within 28-days. Beginning in FY 15-16, the methodology for compiling PSRs was automated to read and report directly from the Trapeze data system.
Discussion The percentage of actionable 311 Muni-related complaints addressed within 28 business days generally improved over the audit period, with a low of 49% in Q1 of FY 16-17 and a high of 97% in Q3 of FY 17-18. Historically, the percentage of complaints addressed was high in FY 12-13 to 2015, but dropped to 58% in FY 15-16. The percentage has increased after that to an average of 86% in FY 17-18.
Beginning in FY 15-16, a major staffing change in the Muni Customer Service unit resulted in a new methodology for computing and reporting this metric. After automation of the PSR system, it was discovered that many resolved PSRs were simply not closed in the system, which may have negatively skewing the reported results. The data entry for this metric is now more consistent since it is pulled from the Trapeze database automatically.
Following the recommendations of the FY 15-16–17 Municipal Transportation Quality Review, starting from FY 18-19, all Muni complaints addressed within 28 working days are to be reported. Additional metrics were added to track the complaints per 100,000 miles and track Muni employee commendations to 311.
FY 16-17 & FY 17-18 Performance
Trend
No Goal Established ✓ Positive
Audit Period Performance
Historic Performance FY 12-13
Avg FY 13-14
Avg FY 14-15
Avg FY 15-16
Avg FY 16-17
Avg FY 17-18
Avg 94% 90% 90% 58% 74% 86%
Recommendations None.
0%
20%
40%
60%
80%
100%
% of
Actio
nable
Com
plain
ts
Addr
esse
d With
in 28
Day
s

Municipal Transportation Quality Review | FY 16-17 and FY 17-18 SAN FRANCISCO MUNICIPAL TRANSPORTATION AGENCY
Nelson\Nygaard Consulting Associates, Inc. | 2-19
2.1.8 Customer Rating: Cleanliness of Muni Vehicles 2.1.9 Customer Rating: Cleanliness of Muni Facilities (Stations, Elevators, Escalators)
Purpose To measure the cleanliness of Muni vehicles, stations, elevators, and escalators. Description: This metric tracks customer perception of cleanliness of Muni vehicles and facilities based on the Quarterly Customer Satisfaction Survey. Method: Results are the average rating from responses of the Quarterly Customer Satisfaction Survey submitted by an opt-in panel of the SFMTA customers, where 1 is very dissatisfied and 5 is very satisfied. Results are weighted by ZIP code; only SF residents’ answers are included.
Discussion The City Charter calls for a measure to track vehicle cleanliness, and the SFMTA has expanded the reporting to include the cleanliness of other facilities that are a part of the Muni experience for riders.
The Quarterly Customer Satisfaction Survey was discontinued after FY 16-17 and will be replaced with an annual rider survey in FY 18-19, resulting in a data gap for FY 17-18. Over FY 16-17, the rating for the cleanliness of Muni vehicles stayed constant at 3.0 out of 5, while the rating for the cleanliness of Muni facilities improved over the year. Since FY 14-15, survey respondents have been increasingly satisfied with the cleanliness of vehicles, but the trend is stagnant for cleanliness of facilities.
Recommendations None.
FY 16-17 & FY 17-18 Performance Trend
Vehicles No Goal Established n/a
Facilities No Goal Established n/a
Audit Period Performance FY 16-17 FY 17-18
Metric Q1 Q2 Q3 Q4 Q1 Q2 Q3 Q4 Cleanliness of Muni vehicles 3.0 3.0 3.0 3.0 n/a n/a n/a n/a
Cleanliness of Muni facilities 2.5 2.6 2.5 2.9 n/a n/a n/a n/a
Historic Performance FY 14-15
Avg FY 15-16
Avg FY 16-17
Avg FY 17-18
Avg Cleanliness of Muni vehicles 2.7 2.9 3.0 n/a
Cleanliness of Muni facilities 2.6 2.5 2.5 n/a
Municipal Transportation Quality Review | FY 16-17 and FY 17-18 SAN FRANCISCO MUNICIPAL TRANSPORTATION AGENCY
Nelson\Nygaard Consulting Associates, Inc. | 2-20
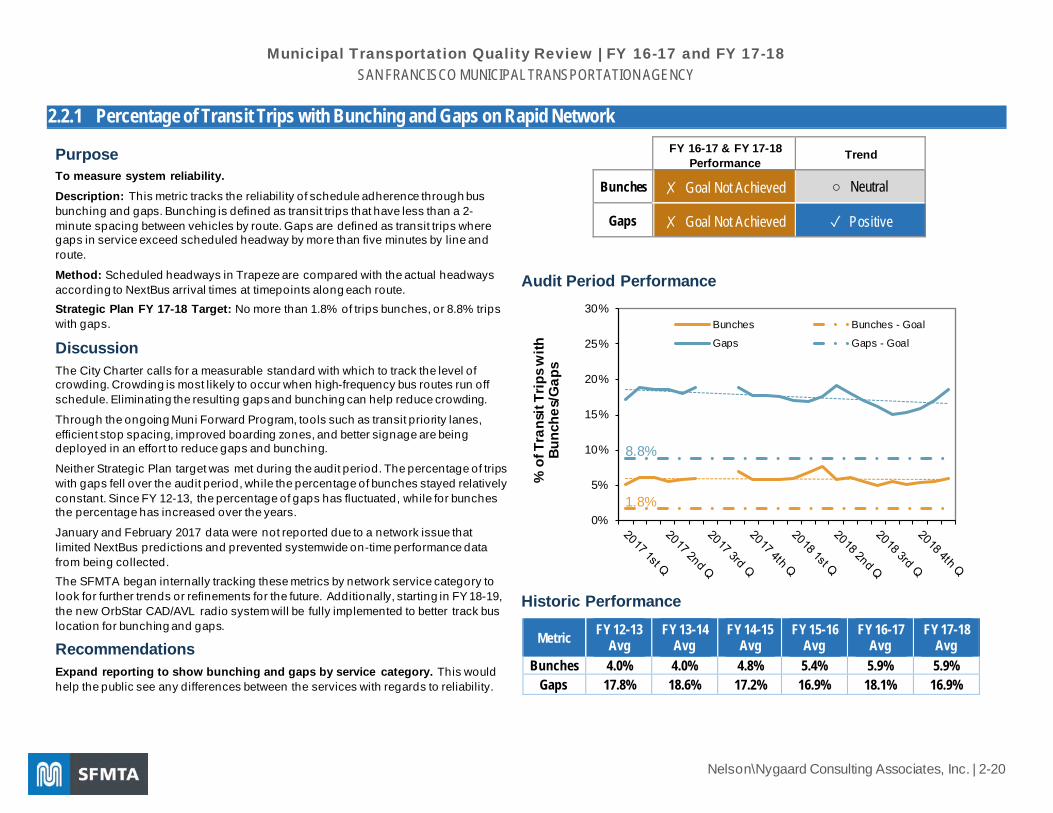
2.2.1 Percentage of Transit Trips with Bunching and Gaps on Rapid Network
Purpose To measure system reliability. Description: This metric tracks the reliability of schedule adherence through bus bunching and gaps. Bunching is defined as transit trips that have less than a 2-minute spacing between vehicles by route. Gaps are defined as transit trips where gaps in service exceed scheduled headway by more than five minutes by line and route.
Method: Scheduled headways in Trapeze are compared with the actual headways according to NextBus arrival times at timepoints along each route. Strategic Plan FY 17-18 Target: No more than 1.8% of trips bunches, or 8.8% trips with gaps.
Discussion The City Charter calls for a measurable standard with which to track the level of crowding. Crowding is most likely to occur when high-frequency bus routes run off schedule. Eliminating the resulting gaps and bunching can help reduce crowding.
Through the ongoing Muni Forward Program, tools such as transit priority lanes, efficient stop spacing, improved boarding zones, and better signage are being deployed in an effort to reduce gaps and bunching.
Neither Strategic Plan target was met during the audit period. The percentage of trips with gaps fell over the audit period, while the percentage of bunches stayed relatively constant. Since FY 12-13, the percentage of gaps has fluctuated, while for bunches the percentage has increased over the years.
January and February 2017 data were not reported due to a network issue that limited NextBus predictions and prevented systemwide on-time performance data from being collected. The SFMTA began internally tracking these metrics by network service category to look for further trends or refinements for the future. Additionally, starting in FY 18-19, the new OrbStar CAD/AVL radio system will be fully implemented to better track bus location for bunching and gaps.
Recommendations Expand reporting to show bunching and gaps by service category. This would help the public see any differences between the services with regards to reliability.
FY 16-17 & FY 17-18 Performance
Trend
Bunches ✗ Goal Not Achieved ○ Neutral
Gaps ✗ Goal Not Achieved ✓ Positive
Audit Period Performance
Historic Performance
Metric FY 12-13 Avg
FY 13-14 Avg
FY 14-15 Avg
FY 15-16 Avg
FY 16-17 Avg
FY 17-18 Avg
Bunches 4.0% 4.0% 4.8% 5.4% 5.9% 5.9% Gaps 17.8% 18.6% 17.2% 16.9% 18.1% 16.9%
1.8%
8.8%
0%
5%
10%
15%
20%
25%
30%
% o
f Tra
nsit
Trip
s with
Bu
nche
s/G
aps
Bunches Bunches - Goal
Gaps Gaps - Goal

Municipal Transportation Quality Review | FY 16-17 and FY 17-18 SAN FRANCISCO MUNICIPAL TRANSPORTATION AGENCY
Nelson\Nygaard Consulting Associates, Inc. | 2-21
2.2.2 On-Time Performance for Non-Rapid Network Routes
Purpose To measure on-time performance (OTP). Description: This metric tracks the on-time performance of routes not considered a part of the Rapid Network service category. Non-rapid routes include routes in the following service categories: Frequent Local, Grid, Circulator, Specialized, and Historic.
Method: The SFMTA compares Trapeze scheduled arrival times of non-Rapid routes with actual NextBus arrival times at timepoints along each route. A vehicle is considered “on time” if it is between one minute early and four minutes late (-1 to 4 minutes) from the published schedules.
City Charter Target: 85% systemwide; 95% by terminal
Discussion On-time performance on non-Rapid routes has never met the Charter-specified goal of 85% for systemwide OTP, and the OTP decreased slightly over the two-year audit period. Historically, performance has remained relatively neutral, but has been decreasing since FY 15-16 from 60.5% to 57.3%. January and February 2017 data were not reported due to a network issue that limited NextBus predictions and prevented systemwide on-time performance data from being collected.
The quality of on-time performance data in FY 18-19 is expected to be more reliable with the new OrbStar CAD/AVL radio system, which will produce its own reporting separate from NextBus. The new system is currently reporting on-time performance systemwide and by terminal.
Recommendations Expand reporting to show on-time performance by service category. This would help the public see any differences between the service categories in headway-based on-time performance.
FY 16-17 & FY 17-18 Performance
Trend
✗ Goal Not Achieved ✗ Negative
Audit Period Performance
Historic Performance FY 12-13
Avg FY 13-14
Avg FY 14-15
Avg FY 15-16
Avg FY 16-17
Avg FY 17-18
Avg 59.9% 59.6% 57.4% 60.5% 59.5% 57.3%
85%
50%55%60%65%70%75%80%85%90%95%
100%
On-T
ime P
erfo
rman
ce(N
on-R
apid
Netw
ork)
On-Time Performance (Non-Rapid Network)Goal

Municipal Transportation Quality Review | FY 16-17 and FY 17-18 SAN FRANCISCO MUNICIPAL TRANSPORTATION AGENCY
Nelson\Nygaard Consulting Associates, Inc. | 2-22
2.2.3 Percentage of Scheduled Service Delivered (Trips)
Purpose To measure the amount of service delivered. Description: This measure reflects the percentage of scheduled trips that were filled by operators.
Method: The percentage of scheduled trips delivered is the percentage of filled runs (trips with an operator assigned to them) over total trips scheduled to be delivered, as reported in the Trapeze system.
Discussion The City Charter specifies that actual service provided be measured against the scheduled service hours. This metric is similar, looking instead at the percentage of trips that actually left the yard compared to those scheduled. This metric will be discontinued in FY 18-19.
The percentage of scheduled service delivered by trips peaked at 99.7% in Q4 of FY 16-17 for this audit period. The rate fell throughout FY 17-18 to 92.8% in the last month of the cycle. In terms of historic performance over the last 6 years, the trend peaked in FY 16-17 before dropping again in FY 17-18.
Since the end of this audit period, this metric has been changed to be tracked by hours rather than trips in order to more effectively capture service delivery.
Recommendations None.
FY 16-17 & FY 17-18 Performance
Trend
No Goal Established ✗ Negative
Audit Period Performance
Historic Performance FY 12-13
Avg FY 13-14
Avg FY 14-15
Avg FY 15-16
Avg FY 16-17
Avg FY 17-18
Avg 97.1% 96.3% 97.7% 98.9% 99.0% 97.4%
88%90%92%94%96%98%
100%
% of
Sch
edule
d Ser
vice
Deliv
ered
(Trip
s)
Municipal Transportation Quality Review | FY 16-17 and FY 17-18 SAN FRANCISCO MUNICIPAL TRANSPORTATION AGENCY
Nelson\Nygaard Consulting Associates, Inc. | 2-23
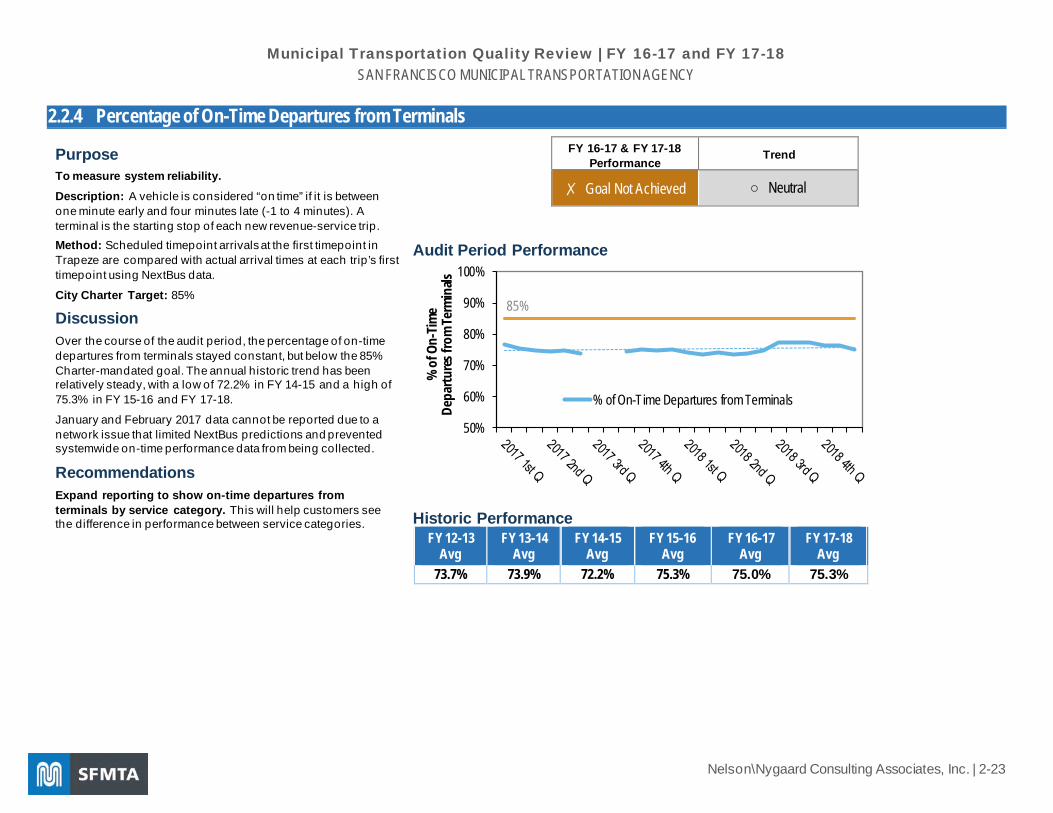
2.2.4 Percentage of On-Time Departures from Terminals
Purpose To measure system reliability. Description: A vehicle is considered “on time” if it is between one minute early and four minutes late (-1 to 4 minutes). A terminal is the starting stop of each new revenue-service trip. Method: Scheduled timepoint arrivals at the first timepoint in Trapeze are compared with actual arrival times at each trip’s first timepoint using NextBus data.
City Charter Target: 85%
Discussion Over the course of the audit period, the percentage of on-time departures from terminals stayed constant, but below the 85% Charter-mandated goal. The annual historic trend has been relatively steady, with a low of 72.2% in FY 14-15 and a high of 75.3% in FY 15-16 and FY 17-18.
January and February 2017 data cannot be reported due to a network issue that limited NextBus predictions and prevented systemwide on-time performance data from being collected.
Recommendations Expand reporting to show on-time departures from terminals by service category. This will help customers see the difference in performance between service categories.
FY 16-17 & FY 17-18 Performance
Trend
✗ Goal Not Achieved ○ Neutral
Audit Period Performance
Historic Performance FY 12-13
Avg FY 13-14
Avg FY 14-15
Avg FY 15-16
Avg FY 16-17
Avg FY 17-18
Avg 73.7% 73.9% 72.2% 75.3% 75.0% 75.3%
85%
50%
60%
70%
80%
90%
100%
% of
On-
Time
Depa
rtures
from
Term
inals
% of On-Time Departures from Terminals

Municipal Transportation Quality Review | FY 16-17 and FY 17-18 SAN FRANCISCO MUNICIPAL TRANSPORTATION AGENCY
Nelson\Nygaard Consulting Associates, Inc. | 2-24
2.2.6 Percentage of On-Time Performance (OTP)
Purpose To measure schedule adherence. Description: The City Charter stipulates that 85% of vehicles must run on time. The definition of “on-time” is bus arrival between one minute early and four minutes late (-1 to 4 minutes), measured against a published timetable.
Method: Scheduled timepoint arrivals in Trapeze are compared with actual arrival times at timepoints along each route using NextBus data. City Charter Target: 85%
Discussion January and February 2017 data was not reported due to a network issue that limited NextBus predictions and prevented systemwide on-time performance data from being collected.
The SFMTA did not meet the Charter-mandated goal of 85% systemwide OTP during the audit period. Average OTP during the audit period stayed constant around 57.3%. Historically, the SFMTA has hovered between 57% and 60%.
The quality of service delivery data is expected to be more reliable with the new OrbStar CAD/AVL radio system, which will produce its own reporting separate from Trapeze. Beginning in FY 18-19, this metric is renamed “Muni On-Time Performance.”
Recommendations None.
FY 16-17 & FY 17-18 Performance
Trend
✗ Goal Not Achieved ○ Neutral
Audit Period Performance
Historic Performance
85%
0%
20%
40%
60%
80%
100%
% of
On-
Time P
erfo
rman
ce
% of On-Time Performance Goal
59.0% 58.9% 57.0% 59.8% 57.3% 57.3%
0%20%40%60%80%
100%
% of
On-
Time
Perfo
rman
ce
Percentage of on-time performanceGoal

Municipal Transportation Quality Review | FY 16-17 and FY 17-18 SAN FRANCISCO MUNICIPAL TRANSPORTATION AGENCY
Nelson\Nygaard Consulting Associates, Inc. | 2-25
2.2.7 Percentage of Trips Over Capacity During AM Peak (8:00a-8:59a, Inbound) at Max Load Points Percentage of Trips Over Capacity During PM Peak (5:00p-5:59p, Outbound) at Max Load Points
Purpose To measure the level of crowding. Description: This metric compares the number of people on board buses to the stated capacity of the vehicle for the assigned trip during the peak period.
Method: The SFMTA compares the highest passenger count of each bus trip from the on-board automatic passenger counters (APC) to the capacity of the vehicle scheduled for the trip. The percentage of trips over capacity equals the number of trips with a maximum load above reported capacity divided by the total number of trips. Data analyzed are from a one-hour period, inbound during the morning peak and outbound during the evening peak. The reported results represent the systemwide average.
Discussion Due to the transition to a new Automatic Passenger Counter (APC) technology deployed on the newer Muni bus fleet, there was insufficient coverage of operational APC data collection and processing during FY 16-17 to produce reportable estimates of crowding.
In FY 17-18, the annual average performance, at 12.2% for AM peak and 10.4% for PM peak, is much higher than historic performance between FY 12-13 and FY 15-16. However, the legacy APC devices on older buses were noted to undercount and were less reliable than the new system. Additionally, performance in FY 17-18 is still better than the internal target of 13% of trips over capacity.
Per the last audit recommendation, the SFMTA has begun internally tracking trips that are over capacity by service category.
Recommendations Consider using the current internal target for this metric externally, which can help the public better understand SFMTA goals.
FY 16-17 & FY 17-18 Performance Trend
No Goal Established n/a
Audit Period Performance
Historic Performance
FY 12-13 Avg
FY 13-14 Avg
FY 14-15 Avg
FY 15-16 Avg
FY 16-17 Avg
FY 17-18 Avg
AM 7.4% 7.4% 4.3% 4.9% n/a 12.2% PM 8.6% 8.3% 3.0% 3.3% n/a 10.4%
0%
10%
20%
30%
40%
% of
Trip
s Ove
r Cap
acity
at
Max
Load
Point
s AM (Inbound, 8 AM) PM (Outbound, 5 PM)

Municipal Transportation Quality Review | FY 16-17 and FY 17-18 SAN FRANCISCO MUNICIPAL TRANSPORTATION AGENCY
Nelson\Nygaard Consulting Associates, Inc. | 2-26
2.2.8 Mean Distance Between Failure (MDBF)
Purpose To measure the frequency of vehicle breakdowns and effectiveness of the preventative maintenance program. Description: MDBF is a measure of reliability that expresses the average distance a vehicle travels before a mechanical failure occurs. It is reported by mode.
The metric stems from the Federal Transit Administration’s definition of a “major mechanical system failure” as an element of a vehicle’s mechanical system that prevents the vehicle from completing a scheduled revenue trip.
Incidents that occur during a deadhead or layover are also included in this measurement. Incidents that are not counted are called “nonchargeable” and include damage from collisions, vandalism, and damage to ad signs for rail, with damage from collisions, sick passengers, vandalism, body damage, and broken windows excluded for buses.
Method: Generally, data come from the Central Control Log and the SHOPS asset management system. Data are compiled and submitted on a monthly basis in hard-coded, pre-summarized spreadsheets, but are processed differently between modes due to distinct needs and policies at each division. Buses: All verifiable chargeable mechanical defects are included as part of the mean distance between failure figure.
Light rail vehicles and historic streetcars: Chargeable failures are only included in the MDBF figure when the mechanical incident causes a line delay of five minutes or more or causes a vehicle to not complete its run.
FY 16-17 & FY 17-18 Performance Trend
No Goal Established Bus: ✓ Positive LRV: ○ Neutral
Historic: ○ Neutral
Audit Period Performance
02,0004,0006,0008,000
10,00012,000
Mean
Dist
ance
(Mile
s) Be
twee
n Fail
ure Bus LRV Historic

Municipal Transportation Quality Review | FY 16-17 and FY 17-18 SAN FRANCISCO MUNICIPAL TRANSPORTATION AGENCY
Nelson\Nygaard Consulting Associates, Inc. | 2-27
2.2.8 Mean Distance Between Failure (MDBF) (Continued)
Discussion The City Charter calls for measures to report on the frequency and mitigation of vehicle breakdowns, as well as the effectiveness of the preventative maintenance program. These go hand-in-hand—an effective maintenance program is one way to mitigate vehicle breakdowns. MDBF is the metric used to track breakdown frequency. There are several major issues with this particular metric. First, although it is used for all modes, it is not an appropriate measure for cable cars, which have no mechanical components. Second, what constitutes a “failure” is subjective, and whether a vehicle is pulled from revenue service varies between garages and managers.
• Bus. Major strides have been made since FY 07-08, when the MDBF was just 2,645 miles. During this audit period, the annual average MDBF reached its highest point at 7,407 miles. During the current audit period, the MDBF had a positive trend, with low points in the winter months and high points in the summer months.
• Light rail. Light rail performance stayed relatively constant during this audit period. Historically, light rail performance has improved 151% between a low MDBF of 2,258 miles on average in FY 10-11 to a high of 5,547 miles in FY 15-16. The MDBF has declined a bit to an average of 5,204 miles in FY 17-18.
• Historic streetcar. Performance declined slightly during the audit period, with an average MDBF of 2,865 miles in FY 16-17 and 2,512 miles in FY 17-18. Historically, the MDBF has stayed relatively level between FY 11-12 and FY 15-16, but increased greatly between FY 15-16 and FY 16-17, before dropping slightly. Among bus, and rail, the historic streetcars have significantly lower mean distances between failures.
• Cable Car. Because cable car does not fit well into MDBF criteria, definitions and data collection efforts have been inconsistent historically. Data stopped being reported at the end of Q3 of FY 15-16. In FY 18-19, a new cable car metric (2.1.6) will be developed: service hours delivered without interruption.
Recommendations Consider implementing a new metric “Preventative Maintenance: Percentage On-Time Completion”. This metric will address the effectiveness of the preventative maintenance program called for by the City Charter. The metric is an industry standard and the information is likely already being collected for federal state-of-good repair reporting requirements. The Performance Team should work with the appropriate staff to develop a framework with parameters to normalize success and failure (i.e. time, mileage, percentage of fleet).
Historic Performance
0
1,000
2,000
3,000
4,000
5,000
6,000
7,000
8,000
Mean
Dist
ance
(Mile
s) Be
twee
n Fail
ure
Bus LRV Historic

Municipal Transportation Quality Review | FY 16-17 and FY 17-18 SAN FRANCISCO MUNICIPAL TRANSPORTATION AGENCY
Nelson\Nygaard Consulting Associates, Inc. | 2-28
2.2.9 Percentage of Scheduled Service Hours Delivered
Purpose To measure deployment of service and system reliability. Description: The City Charter requires the amount of actual service delivered to be tracked.
Method: Using the Trapeze database, service hours are calculated by subtracting the trip start and end time for each trip. A trip is considered delivered if an operator is assigned to it. A trip with no operator is considered “unfilled.” The cumulative scheduled service hours of filled trips are divided by the scheduled service hours of all trips. City Charter Target: 98.5% of scheduled service hours delivered
Discussion At the time Article VIIIA of the City Charter was published, this metric aimed to help address major driver shortages. Performance has trended upward since FY 05-06 to a peak of 99.0% in FY 15-16, but has decreased during this audit period to 98.1% in FY 16-17 and 97.5% in FY 17-18. During the audit period, the service hours delivered hovered around the goal of 98.5%, except for the last couple of months of FY 17-18, when the SFMTA delivered 93.3% of their scheduled service.
The quality of service delivery data is expected to be more reliable with the new OrbStar CAD/AVL radio system, which will produce its own reporting separate from Trapeze. During this audit period, Trapeze-based reporting was still being used.
Recommendations Transition data collection to OrbStar CAD/AVL radio system. Slated to be operational in FY 18-19, this should enable tracking of actual performance against the scheduled service hours reported in Trapeze. Performance will likely initially drop due to more accurate reporting but will more accurately reflect the passenger experience.
FY 16-17 & FY 17-18 Performance Trend
✗ Goal Not Achieved ✗ Negative
Audit Period Performance
Historic Performance
98.5%
90%
92%
94%
96%
98%
100%
% of
Sch
edule
d Se
rvice
Hou
rs D
elive
red
% of Scheduled Service Hours DeliveredGoal
96.6% 96.6% 97% 96.7% 97.0%96.2%
97.7%
99.0%98.1%
97.5%
90%
92%
94%
96%
98%
100%
% of
Sch
edule
d Se
rvice
Hou
rs D
elive
red
% of Scheduled Service Hours Delivered
Goal

Municipal Transportation Quality Review | FY 16-17 and FY 17-18 SAN FRANCISCO MUNICIPAL TRANSPORTATION AGENCY
Nelson\Nygaard Consulting Associates, Inc. | 2-29
495,341 504,205 510,844 519,462 507,333 508,850
74,054 74,137 75,967 70,307 70,236 64,8650
100,000
200,000
300,000
400,000
500,000
600,000
Aver
age W
eekd
ay R
idersh
ip
Bus, av erage w eekday ridership
Faregate entries, av erage w eekday
2.2.11 Ridership (Bus and Metro Faregates, Average Weekday)
Purpose To measure ridership. Description: The average weekday system ridership on bus and at the Muni Metro fare gates.
Method: Average weekday ridership is separated by mode: For buses, a sample-based analysis is conducted by the Transit Division. Over the course of a month, APC-equipped vehicles are randomly assigned to all routes to cover selected trips during different times of the day. The sample data are then used to extrapolate an estimate of overall bus ridership on a monthly basis, which is then summarized as a daily average.
For light rail vehicles, the monthly fare gate entries at Muni Metro stations are reported as a proxy for ridership, due to a lack of APC technology on board vehicles.
Discussion During this audit period, legacy APC devices on older buses were noted to undercount. These figures attempt to account for those issues. The latest generation of APC devices are installed on all new buses, which should provide more accurate counts in the next audit cycle. Public-facing reports still show average weekday ridership for buses and Muni Metro’s faregate entries as relatively steady during the audit period.
Recommendations None.
FY 16-17 & FY 17-18 Performance Trend
No Goal Established ○ Neutral
Audit Period Performance
Historic Performance
0
100,000
200,000
300,000
400,000
500,000
600,000
Aver
age W
eekd
ay R
idersh
ip
BusFaregate Entries (Metro)

Municipal Transportation Quality Review | FY 16-17 and FY 17-18 SAN FRANCISCO MUNICIPAL TRANSPORTATION AGENCY
Nelson\Nygaard Consulting Associates, Inc. | 2-30
2.2.12 Operational Availability of Elevators at Muni Stations 2.2.13 Operational Availability of Escalators at Muni Stations
Purpose To measure the effectiveness of the preventative maintenance program and reliability of Muni Metro station accessibility. Description: Measures the availability of elevators and escalators when they are scheduled to be in operation, also known as “operational availability” in the industry.
Method: This metric is calculated by dividing the number of “in service” elevator and escalator records (in the SHOPS asset management database) by the number of total records on a monthly basis. SFMTA staff check escalator and elevator operation status on a daily basis through phone calls to station agents.
Discussion Elevator or escalator downtime includes any time when an elevator or escalator is not available for use, regardless of whether it was an actual breakdown, scheduled for routine maintenance, or other testing.
All of the existing equipment was installed in the 1970s when Muni Metro was constructed. During the audit period, elevator availability rose slightly, with one major drop to 91.7% in Q4 of FY 16-17. It hit a high of 100% for two months of the audit period. Historically, annual averages of elevator availability have improved since FY 14-15. Escalator availability fluctuated throughout the audit period but generally improved, with a high of 98.3% in Q2 of FY 17-18 and a low of 83.3% in Q2 of FY 16-17.
The annual trends of escalator operational availability have shown greater swings than elevators. This is partly due to data tracking practices that did not distinguish between service disruptions due to planned maintenance and those due to mechanical failures. Beginning in FY 16-17, this distinction was made in the maintenance reporting.
Recommendations None.
FY 16-17 & FY 17-18 Performance Trend
No Goal Established Elevators: ✓ Positive
Escalators: ✓ Positive
Audit Period Performance
Historic Performance
FY 12-13 Avg
FY 13-14 Avg
FY 14-15 Avg
FY 15-16 Avg
FY 16-17 Avg
FY 17-18 Avg
2.2.12 Elevators 96.3% 94.4% 93.3% 94.5% 97.0% 98.0% 2.2.13 Escalators 88.1% 93.8% 91.9% 86.5% 91.4% 92.6%
50%55%60%65%70%75%80%85%90%95%
100%
% o
f Day
s In
Ope
ratio
nElevators Escalators

Goal 3: Improve the environment and quality of life in San Francisco

Municipal Transportation Quality Review | Fiscal Years 2017-2018 SAN FRANCISCO MUNICIPAL TRANSPORTATION AGENCY
Nelson\Nygaard Consulting Associates, Inc. | 2-32
3.2.1 Muni Ridership
Purpose To measure the average of weekday boardings on Muni. Description: This measure tracks the average weekday boardings across Muni. Systemwide ridership is also reported here. Method: This metric is calculated as the sum of the average ridership of light rail, streetcar, cable car, motor coach, and trolley coach modes.
For Systemwide, the metric uses sampling methodologies from National Transit Database reporting.
Discussion The Muni Average Weekday Boardings fluctuated during the audit period, with a high of 753,320 in the third month of Q1 of FY 17-18 and a low of 663,610 in the first month Q3 of FY 17-18. Between FY 12-13 and FY 15-16, average weekday boardings increased, but between FY 15-16 and FY 17-18, the number has declined.
Systemwide Muni ridership increased historically and peaked in FY 16-17 at 255 million riders. There was a drop in ridership to 224 million in FY 17-18.
Recommendations None.
FY 16-17 & FY 17-18 Performance Trend
No Goal Established ✗ Negative
Audit Period Performance
Historic Performance
FY 12-13 Avg FY 13-14 Avg FY14- 15 Avg FY 15-16 Avg FY 16-17 Avg FY 17-18 Avg 683,211 703,160 708,733 726,303 714,910 711,015
600,000640,000680,000720,000760,000800,000
Muni
Aver
age W
eekd
ay
Boar
dings
215.7
206.5
226.0
213.7
227.1
232.3
255.8
224.6
150170190210230250270
Total
Yea
rly Sy
stemw
ide
Ride
rship
(Millio
ns)

Municipal Transportation Quality Review | Fiscal Years 2017-2018 SAN FRANCISCO MUNICIPAL TRANSPORTATION AGENCY
Nelson\Nygaard Consulting Associates, Inc. | 2-33
3.4.1 Transit Passengers per Revenue Hour
Purpose To measure the productivity of Muni transit services. Description: Measures the average number of boardings per revenue hour on all Muni buses.
Method: Passenger boardings based on both the manual passenger counts as well as APC data are divided by service hours delivered. Data are reported to the National Transit Database (NTD) on an annual basis.
Due to NTD reporting guidelines, the passengers per revenue hour also includes non-revenue time, such as layover/recovery time at each terminal.
Discussion Within the audit period, the average passengers per hour fluctuated, but with an increasing trend. The winter months between Q2 and Q3 of both years in the period had fewer boardings than other quarters. Historically, the average number of boardings per revenue hour has decreased since FY 13-14, with a low of 62.6 in FY 16-17, and a slight increase in FY 17-18.
Recommendations None.
FY 16-17 & FY 17-18 Performance Trend
No Goal Established ✓ Positive
Audit Period Performance
Historic Performance
FY 12-13 Avg
FY 13-14 Avg
FY 14-15 Avg
FY 15-16 Avg
FY 16-17 Avg
FY 17-18 Avg
67.4 67.8 64.0 63.0 62.6 63.6
5456586062646668
Aver
age B
us Bo
ardin
gs pe
r Re
venu
e Hou
r
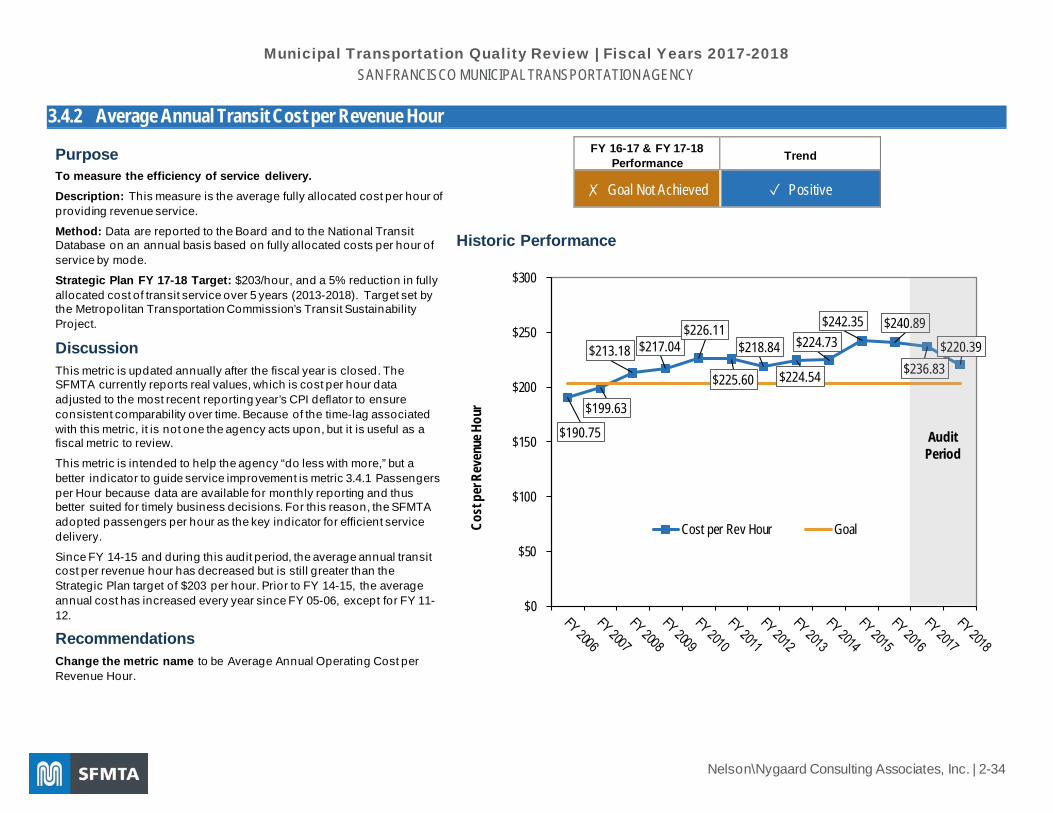
Municipal Transportation Quality Review | Fiscal Years 2017-2018 SAN FRANCISCO MUNICIPAL TRANSPORTATION AGENCY
Nelson\Nygaard Consulting Associates, Inc. | 2-34
3.4.2 Average Annual Transit Cost per Revenue Hour
Purpose To measure the efficiency of service delivery. Description: This measure is the average fully allocated cost per hour of providing revenue service.
Method: Data are reported to the Board and to the National Transit Database on an annual basis based on fully allocated costs per hour of service by mode.
Strategic Plan FY 17-18 Target: $203/hour, and a 5% reduction in fully allocated cost of transit service over 5 years (2013-2018). Target set by the Metropolitan Transportation Commission’s Transit Sustainability Project.
Discussion This metric is updated annually after the fiscal year is closed. The SFMTA currently reports real values, which is cost per hour data adjusted to the most recent reporting year’s CPI deflator to ensure consistent comparability over time. Because of the time-lag associated with this metric, it is not one the agency acts upon, but it is useful as a fiscal metric to review.
This metric is intended to help the agency “do less with more,” but a better indicator to guide service improvement is metric 3.4.1 Passengers per Hour because data are available for monthly reporting and thus better suited for timely business decisions. For this reason, the SFMTA adopted passengers per hour as the key indicator for efficient service delivery.
Since FY 14-15 and during this audit period, the average annual transit cost per revenue hour has decreased but is still greater than the Strategic Plan target of $203 per hour. Prior to FY 14-15, the average annual cost has increased every year since FY 05-06, except for FY 11-12.
Recommendations Change the metric name to be Average Annual Operating Cost per Revenue Hour.
FY 16-17 & FY 17-18 Performance Trend
✗ Goal Not Achieved ✓ Positive
Historic Performance
$190.75
$199.63
$213.18 $217.04 $226.11
$225.60
$218.84
$224.54
$224.73$242.35 $240.89
$236.83$220.39
$0
$50
$100
$150
$200
$250
$300
Cost
per R
even
ue H
our
Cost per Rev Hour Goal
Audit Period

Municipal Transportation Quality Review | Fiscal Years 2017-2018 SAN FRANCISCO MUNICIPAL TRANSPORTATION AGENCY
Nelson\Nygaard Consulting Associates, Inc. | 2-35
3.4.3 Cost per Unlinked Trip
Purpose To measure system performance. Description: An unlinked (passenger) trip is another name for a passenger boarding. Cost per unlinked trip is the financial term used to measure cost effectiveness.
Method: Cost per unlinked trip is calculated by dividing operating expenses by the number of boardings. Data are reported to the National Transit Database on an annual basis.
Discussion Muni began reporting this measure in Service Standards Reports in FY 07-08. The metric is not related to any of the goals in the City Charter, but it is an industry standard reported to the Federal Transit Administration.
Muni’s operating cost per unlinked trip has trended upwards over the past decade and continues to do so, but the rate of growth slowed between FY 14-15 and FY 17-18. In the audit period, the average cost per unlinked trips was $3.49 in FY 16-17 and $3.54 in FY 17-18.
Recommendations None.
FY 16-17 & FY 17-18 Performance Trend
No Goal Established ✗ Negative
Historic Performance
$3.22
$4.00
$3.29 $3.48 $3.49 $3.54
$2.00
$2.50
$3.00
$3.50
$4.00
$4.50
Cost
Per U
nlin
ked T
rip
Audit Period

Municipal Transportation Quality Review | Fiscal Years 2017-2018 SAN FRANCISCO MUNICIPAL TRANSPORTATION AGENCY
Nelson\Nygaard Consulting Associates, Inc. | 2-36
3.4.5 Farebox Recovery Ratio
Purpose To measure system efficiency. Description: Farebox recovery ratio is the percentage of operating expenses covered by revenues from fares.
Method: This metric is measured by dividing Muni’s total fare revenue by its total operating expenses. Data are reported to the National Transit Database on an annual basis.
Discussion The farebox recovery ratio fell during this audit period, from 30% in FY 15-16 to 26% in FY 16-17 and 25% in FY 17-18. The downward trend may be partly attributed to policy decisions, such as the city’s free muni programs for low- and moderate-income youth, seniors, and people with disabilities. By the end of the audit period, nearly 100,000 customers were enrolled in these free Muni programs.
Recommendations None.
FY 16-17 & FY 17-18 Performance Trend
No Goal Established ✗ Negative
Historic Performance
Audit Period FY 12-13
Avg FY 13-14
Avg FY 14-15
Avg FY 15-16
Avg FY 16-17
Avg FY 17-18
Avg 32% 34% 30% 30% 26% 25%

Goal 4: Create a workplace that delivers outstanding service

Municipal Transportation Quality Review | Fiscal Years 2017-2018 SAN FRANCISCO MUNICIPAL TRANSPORTATION AGENCY
Nelson\Nygaard Consulting Associates, Inc. | 2-38
4.2.1 Employee Satisfaction
Purpose To measure employee satisfaction. Description: This metric tracks employee satisfaction for all staff at the SFMTA in the agency’s annual employee engagement survey. Method: Employees are asked to complete 25 survey questions that cover three themes related to personal experience, supervisor relationships, and perception of leadership. Surveys were emailed to employees with email addresses, and beginning with the FY 15-16 survey, were mailed to the home addresses for employees without email addresses. To assess employee satisfaction, respondents are asked, “What is your overall satisfaction as an employee of the Agency?” and offered five response options ranging from very dissatisfied (1) to very satisfied (5). Responses are then weighted by the employee’s division response factor and reported as an average on a 1 to 5 scale. The survey is administered by SFMTA staff and agency-wide response rates have ranged from 33% to 27% over the years.
Discussion The City Charter calls for a measurable standard to track employee satisfaction. Overall, satisfaction increased slightly in FY 16-17, but fell in FY 17-18. Employee satisfaction is likely to fluctuate in the near future due to significant changes at the leadership level. Employee satisfaction varied greatly between job categories. The categories in which the highest rate of employees answered very satisfied or somewhat satisfied were managers/directors (73%), admin support (63%), and skilled crafts (63%). Meanwhile, only 35% of customer-facing employees who answered the survey were satisfied with their jobs. The SFMTA implemented the recommendation of changing the annual survey frequency to a biennial cycle and hiring a professional firm to conduct the survey. This action aims to improve the quality of data collection and give SFMTA management adequate time to develop and implement programming based on the survey’s findings.
Recommendations Improve response rates to the survey. While the overall agency response rate is in line with average employee survey response rates and strides have been made to increase responses among frontline and other field staff, responses from these groups remain relatively low compared with office staff. Efforts should be made to achieve high response rates consistently across employee groups.
FY 16-17 & FY 17-18 Performance Trend
No Goal Established ✗ Negative
Historic Performance Audit Period
FY 12-13
Avg FY 13-14
Avg FY 14-15
Avg FY 15-16
Avg FY 16-17
Avg FY 17-18
Avg 3.4 3.4 3.4 3.3 3.4 3.3

Municipal Transportation Quality Review | Fiscal Years 2017-2018 SAN FRANCISCO MUNICIPAL TRANSPORTATION AGENCY
Nelson\Nygaard Consulting Associates, Inc. | 2-39
4.3.3 Unscheduled Absence Rate by Transit Operators
Purpose To measure service delivery. Description: This metric tracks the unscheduled absences of transit operators.
Method: Unscheduled absences are hard-coded in Trapeze in a number of categories: sick pay/leave; long-term leave; suspensions; leave covered by the Family and Medical Leave Act (FMLA); late arrivals to work, which are called working miss outs; and absent all day (AWOL). Using data sourced from the Trapeze scheduling system, the percentage of scheduled operators who have an unscheduled absence is calculated by dividing the number of operators with unscheduled absences by the total number of daily bid operators.
Discussion Unscheduled absenteeism has always been higher among operators than positions in other departments throughout the agency. Measuring the unscheduled absence rate of transit operators helps to illustrate how labor availability effects service delivery. Unscheduled absences may be double-, or in some cases triple-counted, due to a Transit Operations business practice of assigning multiple codes to unscheduled absences. An example would be an employee with an expired driver’s license and expired medical documentation who is also on FMLA; in Trapeze, their absence would be coded for each of these categories.
Transit operator absenteeism increased over the audit period, with a high of 11.9% in the last month of FY 17-18. Historically, the absence rate has fluctuated between 7.7% and 9.4%. An upgrade to the City’s PeopleSoft payroll system was made to enable the removal of long-term leave timekeeping from absence rate reporting. This should enable the SFMTA to accurately report absence rates for all employee groups. Operator timekeeping data from Trapeze is automatically transmitted to the PeopleSoft payroll system, so the reporting between the two systems should be consistent. The first reports generated with from PeopleSoft began in May 2019.
Recommendations None.
FY 16-17 & FY 17-18 Performance Trend
No Goal Established ✗ Negative
Audit Period Performance
Historic Performance
0%2%4%6%8%
10%12%14%
Unsc
hedu
ed A
bsen
ce R
ate
8.6%9.4%
7.7%8.6% 8.1%
9.1%
0%2%4%6%8%
10%12%
Unsc
hedu
ed Ab
senc
e Rate

Municipal Transportation Quality Review | Fiscal Years 2017-2018 SAN FRANCISCO MUNICIPAL TRANSPORTATION AGENCY
Nelson\Nygaard Consulting Associates, Inc. | 2-40
Chapter 3 Operations Analysis
The SFMTA employs over 2,100 transit operators. The training needed to get operators behind the wheel requires significant instructor staffing, scheduling, and record keeping. It also includes coordination between the Transportation Training and Instruction Unit and the SFMTA’s Human Resources, System Safety, and the Transit Divisions. In June 2019, the Training and Instruction Unit moved under the Transit Division.
In 2013 an audit conducted by the City and County of San Francisco’s Office of the Controller's City Services Auditor Division resulted in a report that included 18 recommendations for SFMTA to improve the hiring and training process of transit operators.1 Many of those recommendations have been implemented. This is an update to the status and health of the operator training program. The analysis found the most pressing challenge for the Training Program is the shortage of training instructors, which contributes to a shortage of drivers.
The audit team conducted interviews with the Transportation Training and Instruction Unit of the SFMTA and reviewed relevant documents to understand the state of the training process for transit operators in FY 17-18. Managers provided descriptions of processes for training, responsibilities, functional units, staffing, training needs, performance metrics, and program targets. This chapter highlights the findings and recommendations that resulted from the analysis.
FINDINGS AND RECOMMENDATIONS Training Program 1.1 Establish runs/blocks for New Operator Training graduates in agreement with Transport Workers Union.
Assign New Operator Training graduates to specific scheduled work (open runs or blocks) that have occurred from an unbalanced division signup. This took place at multiple divisions in the 2019 summer sign-up. The most junior operators are often assigned to the extraboard, which are positions to fill in when a regularly scheduled operator is unavailable for service. This requires the least tenured operators to have the most variation in their schedules.
In preparation for a division signup, Transit balances an operating division’s potential runs, blocks, and extraboard with the available (cleared) operators. This results in all New Operator Training graduates being assigned to extraboard positions at their new division. This is a demanding adaptation due to daily changes in hours and routes. There is a precedent for designating certain work (“stress study runs”) that occurred as a result of previous collaboration with TWU.
1.2 Reduce New Operator Training assignments to just three divisions among the motor coach and trolley coach modes: Woods, Flynn, and Presidio. Flynn and Presidio have a singular sub-fleet (60 foot articulated and 40-foot standard respectively) and Woods has two sub-fleets (35- and 40-foot standards). Filling operator vacancies at Kirkland, Islais Creek (both 5-day only divisions), and Potrero can be accomplished by re-assigning new operators after they have completed New Operator Refresher training within a 90-day period. Furthermore, New Operator Training graduates should be placed based on demonstrated skills and not modes, which new graduates are expected to select too early in the process today. The New Operator Training manager should forgo a “student sign-up” with mode selection to occur during subsequent signups based on the needs of transit operations, demonstrated skills, and student preference.
1.3 Restructure the New Operator Training program. To address the annual attrition rate of 9.5%, a revised 41-day New Operator Training schedule could include seven classes in a four-month period, with consecutive classes starting after completion of the skills course module (Day 9) and after completion of the DMV exam (Day 30). Within this schedule, the current 10-day skills course module would be reduced to 9 days.
1 San Francisco Municipal Transportation Agency: The Agency Must Improve Staffing Planning and Training to Meet Its Needs for Transit Operators. Office of the Controller – City Services Auditor. September 10, 2013.
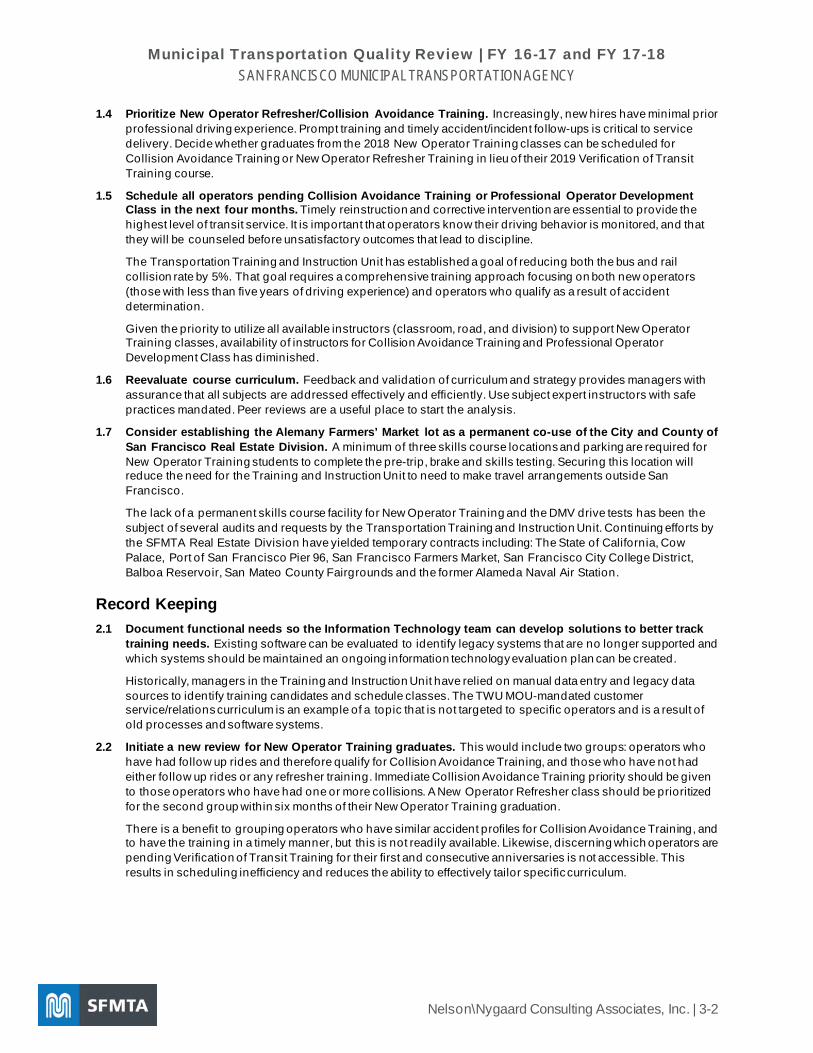
Municipal Transportation Quality Review | FY 16-17 and FY 17-18 SAN FRANCISCO MUNICIPAL TRANSPORTATION AGENCY
Nelson\Nygaard Consulting Associates, Inc. | 3-2
1.4 Prioritize New Operator Refresher/Collision Avoidance Training. Increasingly, new hires have minimal prior professional driving experience. Prompt training and timely accident/incident follow-ups is critical to service delivery. Decide whether graduates from the 2018 New Operator Training classes can be scheduled for Collision Avoidance Training or New Operator Refresher Training in lieu of their 2019 Verification of Transit Training course.
1.5 Schedule all operators pending Collision Avoidance Training or Professional Operator Development Class in the next four months. Timely reinstruction and corrective intervention are essential to provide the highest level of transit service. It is important that operators know their driving behavior is monitored, and that they will be counseled before unsatisfactory outcomes that lead to discipline.
The Transportation Training and Instruction Unit has established a goal of reducing both the bus and rail collision rate by 5%. That goal requires a comprehensive training approach focusing on both new operators (those with less than five years of driving experience) and operators who qualify as a result of accident determination.
Given the priority to utilize all available instructors (classroom, road, and division) to support New Operator Training classes, availability of instructors for Collision Avoidance Training and Professional Operator Development Class has diminished.
1.6 Reevaluate course curriculum. Feedback and validation of curriculum and strategy provides managers with assurance that all subjects are addressed effectively and efficiently. Use subject expert instructors with safe practices mandated. Peer reviews are a useful place to start the analysis.
1.7 Consider establishing the Alemany Farmers’ Market lot as a permanent co-use of the City and County of San Francisco Real Estate Division. A minimum of three skills course locations and parking are required for New Operator Training students to complete the pre-trip, brake and skills testing. Securing this location will reduce the need for the Training and Instruction Unit to need to make travel arrangements outside San Francisco.
The lack of a permanent skills course facility for New Operator Training and the DMV drive tests has been the subject of several audits and requests by the Transportation Training and Instruction Unit. Continuing efforts by the SFMTA Real Estate Division have yielded temporary contracts including: The State of California, Cow Palace, Port of San Francisco Pier 96, San Francisco Farmers Market, San Francisco City College District, Balboa Reservoir, San Mateo County Fairgrounds and the former Alameda Naval Air Station.
Record Keeping 2.1 Document functional needs so the Information Technology team can develop solutions to better track
training needs. Existing software can be evaluated to identify legacy systems that are no longer supported and which systems should be maintained an ongoing information technology evaluation plan can be created.
Historically, managers in the Training and Instruction Unit have relied on manual data entry and legacy data sources to identify training candidates and schedule classes. The TWU MOU-mandated customer service/relations curriculum is an example of a topic that is not targeted to specific operators and is a result of old processes and software systems.
2.2 Initiate a new review for New Operator Training graduates. This would include two groups: operators who have had follow up rides and therefore qualify for Collision Avoidance Training, and those who have not had either follow up rides or any refresher training. Immediate Collision Avoidance Training priority should be given to those operators who have had one or more collisions. A New Operator Refresher class should be prioritized for the second group within six months of their New Operator Training graduation.
There is a benefit to grouping operators who have similar accident profiles for Collision Avoidance Training, and to have the training in a timely manner, but this is not readily available. Likewise, discerning which operators are pending Verification of Transit Training for their first and consecutive anniversaries is not accessible. This results in scheduling inefficiency and reduces the ability to effectively tailor specific curriculum.

Municipal Transportation Quality Review | FY 16-17 and FY 17-18 SAN FRANCISCO MUNICIPAL TRANSPORTATION AGENCY
Nelson\Nygaard Consulting Associates, Inc. | 3-3
Staffing Only 37 of 58, or 64% of permanent operator training staff positions are currently filled and of those 19 are filled by interim assignments.
Figure 4-1 Operator Training Positions and Classifications
Title Job Classification
Code Number of Positions Instructor Staffing Vacancies*
Transit Manager II 9141 1 Known as Superintendent: Role filled by Interim/Acting
Transit Manager I 9140 5 3 of 5 are in Acting/Interim roles
Transit Supervisor 9139 52 36 permanent positions filled 15 temporary positions filled by 9163 Transit Operators
Line Transit Operator 9163 Transit Operators can fill temporary trainer assignments * As of June 2019 3.1 Expedite the approval of a new job classification (9136). Creating a new instructor classification has been
initiated but not completed. This is a high priority. It should include conducting a skills assessment examination to determine the status of existing 9139 instructor incumbents.
3.2 Plan and initiate a new instructor training program. Transportation Training and Instruction Unit management should survey existing transit operator line trainers to determine eligibility and interest in pursuing the new 9136 job classification positions while awaiting reclassification by the Department of Human Resources. This is a high priority.
New Operator Training, General Sign-Up and requalification training programs must be provided by certified trainers. That certification is conferred in compliance with the California Education Code that includes 12 hours of classroom instruction, four hours of road training, and passing an exam.
A negotiated daily premium is available to each line trainer in fulfillment of specific instructional and documentation requirements. Oversight of the Line Trainer Certification and Line Trainer Refresher programs is the responsibility of the In-Service Manager and Rail Training Manager due to the multitude of modal sub-fleets and specific skills demonstration. Supervision of line trainers is the responsibility of the division instructors.
3.3 Use city-wide managerial classifications and conduct a skills assessment to make permanent civil service appointments. The six managerial positions assigned to the Transportation Training and Instruction Unit are generic classifications that support various transit operations functions. Without a current civil service eligibility list, five of six incumbents are in acting temporary exempt appointment status. Further, because only two other transit management functions utilize these classifications currently, there is little rationale for initiating an eligibility list.
3.4 Cap New Operator Training classes at 18 students with a 2:1 student to instructor ratio. Classes are currently between 55 and 60 students, requiring 22 instructors and 20 coaches.
This would require a reduction to nine coaches on a skills course, thereby reducing the overall size of the contracted space needed. The DMV drive test day would conversely require only two or three buses on the same course. However, it would also require significantly more instructors.
3.5 Increase the number of DMV examiners. Permanent instructors who do not have the certification should be scheduled for the program as a goal of their employee evaluation.
The availability of DMV-certified Transit Supervisor examiners is essential to continuation of the New Operator Training program. Currently, 10 Transit Supervisor instructors are certified to give the DMV drive test during New Operator Training precedent to attainment of the DMV Class B commercial license. Each examiner is required to fulfill 10 tests per year to retain their certification.

Municipal Transportation Quality Review | FY 16-17 and FY 17-18 SAN FRANCISCO MUNICIPAL TRANSPORTATION AGENCY
Nelson\Nygaard Consulting Associates, Inc. | 3-4
3.6 Implement oversight and accountability of the Line Trainer Training Program. To reduce variation in the quality of instruction, there should be random rides and coach video monitoring in addition to daily evaluation by students. This will ensure each New Operator Training student receives the appropriate level of attention and instruction. Ideally, the SFMTA would have more 9139 instructors for the current level of service.
3.7 Require all Line Trainers to take refresher training annually. The refresher class curriculum should include a re-examination of each line trainer’s road skills and communication skills to ensure consistency.

APPENDIX A GLOSSARY OF TERMS

Municipal Transportation Quality Review | FY 16-17 and FY 17-18 SAN FRANCISCO MUNICIPAL TRANSPORTATION AGENCY
Nelson\Nygaard Consulting Associates, Inc. | A-1
ACRONYMS APC Automatic passenger counters
AVL Automatic vehicle location system
AWOL Absent without leave
CAD Computer aided dispatch
CAT Collision Avoidance Training
CPI Consumer price index
CPUC California Public Utilities Commission
FMLA Family and Medical Leave Act
FY Fiscal Year
GSU General Signup Mode Training
Infor EAMS Asset management database, which is replacing SHOPS
MDBF Mean distance between failure
MOU Memorandum of Understanding
NOT New operator training
NTD National Transit Database
OTP On-time performance
OCC Operations control center (Muni’s former control center)
POD-C Professional operator development class
PSR Passenger service report
RWP Roadway worker protection
SFPD San Francisco Police Department
SHOPS Asset management data system, being phased out for the new Infor EAMS application
SIE SFMTA Security, Investigations, & Enforcement
TMC The Transportation Management Center, began operation in 2017
VTP Volunteer transfer program
VTT Verification of transit training
WC Worker’s compensation
Municipal Transportation Quality Review | Fiscal Years 2015-2016 SAN FRANCISCO MUNICIPAL TRANSPORTATION AGENCY
Nelson\Nygaard Consulting Associates, Inc. | A-2
DEFINITIONS Bunching: Transit trips that have less than a 2-minute spacing between vehicles by route
City Charter: The San Francisco Municipal Code, first established in July 1996, and last amended by voters during the November 2016 election
Gaps: Transit trips where gaps in service exceed scheduled headway by more than five minutes by line and route
Mean distance between failure: Measure of reliability that expresses the average distance a vehicle travels before a mechanical failure occurs (reported by mode)
NextBus: The SFMTA’s real-time arrival information service provider for all of Muni’s fixed-route transit services
OrbStar CAD/AVL radio system: A new radio system that will integrate all onboard system reporting
Safety versus security: Protection from injuries vs. protection from crime
Trapeze: Software used by the SFMTA to develop and maintain routes and schedules