municipal wastewater treatment plant energy …
TRANSCRIPT

MUNICIPAL WASTEWATER TREATMENT PLANT ENERGY EVALUATION
FOR ITHACA AREA WASTEWATER TREATMENT FACILITY
Agreement No. 7185
Prepared for
THE NEW YORK STATE ENERGY RESEARCH AND DEVELOPMENT AUTHORITY
Albany, NY
Prepared by
MALCOLM PIRNIE, INC. Buffalo, NY
Final October 2005

TABLE OF CONTENTS
Section Page
1 INTRODUCTION...................................................................................................................................1-1 1.1 Overall Project Description.........................................................................................................1-1 1.2 Facility Background.....................................................................................................................1-1 1.3 Scope and Objectives...................................................................................................................1-2
1.3.1 Review of Historical Plant Performance and Energy Usage Data .............................1-2 1.3.2 Electric Submetering.....................................................................................................1-3 1.3.3 Identification of Energy Saving Opportunities through Equipment
Replacement or Modification.......................................................................................1-4 1.3.4 Identification of Energy Saving Opportunities through Operational Changes .........1-4
2 CURRENT AND HISTORICAL OPERATIONS ................................................................................2-1 2.1 Existing Treatment Processes......................................................................................................2-1
2.1.1 Preliminary Treatment ..................................................................................................2-1 2.1.2 Influent Wastewater Pumping......................................................................................2-1 2.1.3 Primary Treatment.........................................................................................................2-1 2.1.4 Secondary Treatment ....................................................................................................2-2 2.1.5 Tertiary Treatment.........................................................................................................2-2 2.1.6 Chlorine Disinfection....................................................................................................2-2 2.1.7 Solids Handling .............................................................................................................2-2
2.2 Historical Energy Usage and Utility Billing...............................................................................2-3 2.3 Natural Gas Usage........................................................................................................................2-4 2.4 Summary of Energy Costs ...........................................................................................................2-4 2.5 Summary of Historical Loadings and Effluent Quality.............................................................2-5
3 ELECTRIC SUBMETERING PROGRAM ..........................................................................................3-1 3.1 Description of Submetering Program and Submeter Locations................................................3-1
3.1.1 Description of Program.................................................................................................3-1 3.1.2 Submeter Locations.......................................................................................................3-1
3.2 Summary of Site Audit ................................................................................................................3-2 3.3 Summary of Continuous Submetering........................................................................................3-2
3.3.1 Digester-Gas Fueled Co-generators.............................................................................3-2 3.3.2 Influent Pumps...............................................................................................................3-3 3.3.3 Aeration System Blowers .............................................................................................3-4 3.3.4 Return Activated Sludge Pumps...................................................................................3-4 3.3.5 Solids Handling Building Belt Filter Press..................................................................3-5
3.4 Summary of Instantaneous Submetering ....................................................................................3-5 3.5 Summary of Entire Submetering Program .................................................................................3-6
4 PROCESS PERFORMANCE DURING SUBMETERING.................................................................4-1 4.1 Summary of Process Performance Parameter Monitoring ........................................................4-1 4.2 Relationship between Plant Process Data and Submetering Data.............................................4-2
4.2.1 Main Influent Wastewater Pumps ................................................................................4-2 4.2.2 Return Activated Sludge Pumps...................................................................................4-3 4.2.3 Aeration Blowers...........................................................................................................4-3 4.2.4 Solids Handling .............................................................................................................4-4 4.2.5 Digester Gas Co-Generator...........................................................................................4-4
2255-063 i Ithaca Area Wastewater Treatment Facility NYSERDA Submetering City of Ithaca

TABLE OF CONTENTS (continued)
Section Page
4.2.6 Other Equipment ...........................................................................................................4-5
5 ENERGY SAVING MEASURES THROUGH CAPITAL IMPROVEMENTS................................5-1 5.1 Capital Improvement Alternatives to Reduce Energy Usage and Costs...................................5-1
5.1.1 Installation of Automatic Controls on the Aeration System Blowers........................5-1 5.1.2 Switching from Ferrous Chloride Use for Phosphorus Removal
in the Aeration Basins...................................................................................................5-1 5.2 Estimate of Energy Usage, Demand, and Cost Savings ............................................................5-1
5.2.1 Installation of Automatic Controls on the Aeration System Blowers........................5-2 5.2.2 Switching from Ferrous Chloride to Ferric Chloride Use for
Phosphorus Removal in the Aeration Basins ..............................................................5-3 5.3 Estimate of Capital Costs and Simple Payback..........................................................................5-4
5.3.1 Installation of Automatic Controls on the Aeration System Blowers........................5-4 5.3.2 Conversion from Ferrous Chloride to Ferric Chloride Use for
Phosphorus Removal in the Aeration Basins ..............................................................5-4 5.4 Additional Discussion: Premium Efficiency Motors ................................................................5-4
6 ENERGY SAVINGS MEASURES THROUGH OPERATION MODIFICATIONS.......................6-1 6.1 Operational Modifications to Reduce Energy Usage.................................................................6-1
6.1.1 Load Shifting .................................................................................................................6-1 6.1.2 Peak Shaving .................................................................................................................6-2 6.1.3 Operational Modifications ............................................................................................6-3
7 ENERGY SAVINGS MEASURES THROUGH LIGHTING/HVAC MODIFICATIONS..............7-1 7.1 Overview.......................................................................................................................................7-1
7.1.1 Heating, Ventilating, and Air Conditioning Overview...............................................7-1 7.1.2 Lighting Overview........................................................................................................7-2
7.2 HVAC and Lighting Alternatives to Reduce Energy Usage and Costs....................................7-2 7.2.1 Heating, Ventilation, and Air Conditioning ................................................................7-2 7.2.2 Lighting..........................................................................................................................7-2
8 ON-SITE GENERATION ......................................................................................................................8-1 8.1 Description of Existing System Operation.................................................................................8-1 8.2 Capital Improvement Alternatives ..............................................................................................8-2
8.2.1 Alternative 1 Evaluation: Installation of Gas Storage Facilities and New Controls with Continued Operation of the Existing Co-Generator Units.........8-2
8.2.2 Alternative 2 Evaluation: Installation of Gas Storage Facilities and New Controls and Replacement of the Co-Generator Units with Microturbines .....8-3
8.2.3 Alternative 3 Evaluation: Installation of Gas Storage Facilities and Upgraded Heat Recovery and Controls; In-Kind Replacement of the Existing Co-Generator Units with Higher-Efficiency Recriprocating Engines ........8-4
8.3 Load Curtailment..........................................................................................................................8-5 8.4 Summary.......................................................................................................................................8-5
2255-063 ii Ithaca Area Wastewater Treatment Facility NYSERDA Submetering City of Ithaca
TABLE OF CONTENTS (continued)
Section Page
9 FINAL RECOMMENDATIONS...........................................................................................................9-1 9.1 Summary of Evaluations..............................................................................................................9-1 9.2 Summary of Recommendations ..................................................................................................9-1
TABLES
Table On/Follows Page
2-1 Summary of Energy Costs ......................................................................................................................2-5 2-2 Summary of North Plant Performance – Wet Stream Process .............................................................2-5 2-3 Summary of North Plant Performance – Solids Handling Processes...................................................2-7
3-1 List of Motors Over 5 hp.........................................................................................................................3-1 3-2 Instantaneous Power Draw Measurements and Estimates of Hours in Operation..............................3-5 3-3 Estimates of Electric Energy Usage and Costs......................................................................................3-5 3-4 Summary of Major Equipment Total Estimated Electric Energy Usage and Costs at the
IAWWTF .................................................................................................................................................3-6
4-1 Summary of IAWWTF Performance during the Submetering Period Compared To Historical Data ...................................................................................................................................4-2
7-1 Summary of Costs and Savings for HVAC Measures ..........................................................................7-2 7-2 Summary of Costs and Savings for All Lighting Measures .................................................................7-3
8-1 Summary of Costs and Savings for Installation of Gas Storage Facilities and New Controls with Existing Co-Generator Units..................................................................................8-3
8-2 Summary of Costs and Savings for Installation of Gas Storage Facilities and New Controls and Replacement of the Co-Generator Units with Microturbines................................8-4
8-3 Summary of Costs and Savings for Installation of Gas Storage Facilities and New Controls and In-Kind Replacement of the Co -Generator Units with Higher Efficiency Reciprocating Engines ............................................................................................................................8-4
9-1 Summary of Energy Savings Alternatives Presented in 5, 6, 7, and 8 .................................................9-1 9-2 Summary of Recommended Alternatives ..............................................................................................9-1
FIGURES
Figure Follows Page
2-1 Process FlowScheme..............................................................................................................................2-1 2-2 Electric Demand and Usage....................................................................................................................2-3 2-3 Change in Electric Demand (2002 – 2003)............................................................................................2-3 2-4 Change in Electric Usage (2002 – 2003) ...............................................................................................2-3 2-5 Natural Gas Usage (2002 – 2003) ..........................................................................................................2-4 2-6 Influent TSS and BOD5 Loading............................................................................................................2-6
2255-063 iii Ithaca Area Wastewater Treatment Facility NYSERDA Submetering City of Ithaca

Section 1
INTRODUCTION
1.1 OVERALL PROJECT DESCRIPTION
The New York State Energy Research and Development Authority (NYSERDA) is currently sponsoring a
research program to evaluate submetering at wastewater treatment plants (WWTPs) throughout New York
State. The purpose of the monitoring is to obtain detailed electric power usage information through
submetering various unit processes and equipment and to determine if that information is a cost-effective
tool for identifying energy conservation measures. In addition to evaluating the usefulness of submetering,
a secondary goal of the program is to identify and evaluate energy cost savings measures at WWTPs and
make the findings available to other facilities in New York State.
Although the City of Ithaca has been proactive in implementing energy-saving measures at its Ithaca Area
Wastewater Treatment Facility (IAWWTF), energy-saving opportunities may still exist. Therefore, the City
of Ithaca agreed to participate in this submetering study as conducted by the Research Team of Malcolm
Pirnie and Siemens Building Technology.
1.2 FACILITY BACKGROUND
The IAWWTF was built in the mid-1980s and serves the City and Town of Ithaca, including Cornell
University and Ithaca College. There is only one significant industrial user: Emerson Power Transmission
Corporation. The remainder of the wastewater is residential; however, wastewater flow does include
discharge from Cornell University. Discharge from Cornell University varies based on the school
schedule, with the number of students on campus increasing significantly in late-August and early-
September. The IAWWTF handled an average wastewater flow of 6.8 million gallons per day (MGD),
peaking up to 16.7 MGD during 2002 and 2003.
The IAWWTF is fed electric power at 13.2 kilovolts (kV), which is immediately stepped down to 480 volts
(V) three phase. The electric energy demand at the plant is approximately 450 kilowatts (kW) on average.
The facility has one 800-kW stand-by generator powered by diesel fuel. The generator is located
immediately next to the substation and has sufficient capacity to power the entire plant, if necessary.
The treatment processes at the IAWWTF include the following:
• Preliminary treatment, including mechanically-cleaned bar screens.
• Primary clarification.
2255-063 1-1 Ithaca Area Waste water Treatment Facility NYSERDA Submetering City of Ithaca

• Secondary biological treatment with activated sludge aeration followed by final clarification.
• Disinfection using sodium hypochlorite.
• Dechlorination using sulfur dioxide gas.
• Solids handling consisting of sludge thickening (gravity thickeners), digestion, and sludge dewatering using a belt filter press, followed by landfilling.
The City is voluntarily installing tertiary treatment facilities, based on the potential that the New York State
Department of Environmental Conservation (NYSDEC) may impose more stringent effluent requirements
for phosphorus removal in five to ten years. The tertiary treatment facility is a high-rate enhanced
clarification system (Actiflo®).
1.3 SCOPE AND OBJECTIVES
This study involved the following activities as part of the overall electric and natural gas energy usage
evaluation and electric submetering program:
1.3.1 Review of Historical Plant Performance and Energy Usage Data
Data were obtained from the IAWWTF to establish a baseline for plant performance and energy usage at
the IAWWTF. The baseline was established to separate improvements related to power savings from those
that result from exogenous effects, such as changes in influent water quality, seasonal, and weekly cycles,
and/or energy market changes.
Data obtained from the IAWWTF included:
• Average, minimum, and maximum daily flow.
• Influent, primary effluent, and final effluent total suspended solids (TSS) and biochemical oxygen
demand (BOD5) concentrations.
• Mixed liquor suspended solids (MLSS).
• Primary sludge quantities.
• Return activated sludge (RAS) flow and solids content.
• Waste activated sludge (WAS) flow.
• Digester feed sludge quantities and total and volatile solids percentage.
• Digested sludge quantities and total and volatile solids percentage.
• Digester gas production.
• Historical electric energy usage, including available time-of-use monitoring data, two years of
utility bills, and any process changes recently undertaken or contemplated.
2255-063 1-2 Ithaca Area Waste water Treatment Facility NYSERDA Submetering City of Ithaca

• Recent energy consumption data for non-electric accounts, including natural gas, diesel and
digester gas, etc.
• Preventive and corrective maintenance records.
1.3.2 Electric Submetering
Continuous submetering and instantaneous power draw measurements were completed to assess the typical
electric energy usage of some of the larger motors (greater than 5 horsepower [hp]) at the IAWWTF.
Continuous submetering locations were selected based on information gathered during the site energy audit
such that the larger and more energy-intensive motors could be metered. Instantaneous power draw
measurements were also obtained on additional motors, particularly those that operated on a set schedule at
a constant speed.
The continuous submetering data were used to capture diurnal variations in electric energy demand for
major pieces of equipment, as well as to provide a representative sample of electric energy usage and
demand as equipment cycles on and off. The following data were recorded at each location:
• Load factor.
• Power factor.
• Demand (kW).
• Usage (kWh).
Instantaneous submetering was conducted during a one-day site visit and the data were used to verify
expected energy demand at the facility, as well as monitor changes in demand as equipment is cycled on
and off.
In addition, process data were collected and evaluated for the duration of the submetering period including:
• Aeration system operations.
• Digester gas fueled co-generator operations.
For the aeration system operations evaluation, data collected included:
• Secondary influent flow, in hourly increments.
• Secondary influent BOD5 and ammonia concentrations, grab samples in bi-hourly increments (for
48 hours).
2255-063 1-3 Ithaca Area Waste water Treatment Facility NYSERDA Submetering City of Ithaca

Section 2
CURRENT AND HISTORICAL OPERATIONS
This section presents a brief description of the existing treatment processes at the Ithaca Area Wastewater
Treatment Facility (IAWWTF), historical implementation of energy saving measures, and the resulting
effect on effluent quality (if any).
2.1 EXISTING TREATMENT PROCESSES
FIGURE 2-1 presents the process flow diagram for the wet stream and solids handling process trains at the
IAWWTF. A brief description of the unit treatment processes that are currently employed at the plant is
presented below.
2.1.1 Preliminary Treatment
Preliminary treatment at the IAWWTF is accomplished through the use of two mechanically-cleaned bar
screens. The bar screen rakes generally operate automatically once per hour. During higher flow rates, the
rakes are manually set to operate more frequently.
2.1.2 Influent Wastewater Pumping
Wastewater enters the facility at the main pump building. There are five influent pumps in the main pump
building, three of which have variable frequency drives (VFDs). The pumps are operated to maintain wet
well level. During average flow conditions, only one pump with VFD is operated. During high flow
conditions, two or three pumps with VFDs are operated (dependent on flow conditions). Flow conditions
rarely occur where more than three pumps are required to be in operation at the same time.
2.1.3 Primary Treatment
Primary treatment consists of two rectangular primary settling tanks, each with approximately 1 million
gallons (MG) of volume. There are three primary sludge pumps, each equipped with a VFD. During
average flow conditions, two of the three pumps are typically operated. The grit removal facilities consist
of a primary sludge degritter.
2255-063 2-1 Ithaca AreaWastewater Treatment Facility NYSERDA Submetering City of Ithaca

F:\Projects\2255063\Draft Documents\Report\Ithaca\Ithaca Flow Scheme 05/15/2005
Primary Sludge
Degritter
Overflow
FIGURE 2-1 PROCESS FLOW SCHEME
NYSERDA MUNICIPAL WASTEWATER TREATMENT PLANT ENERGY EVALUATION ITHACA AREA WASTEWATER TREATMENT FACILITY
Aeration Tanks
Raw Influent
Supernatant from Digesters
Mechanical Bar Screens
Raw Wastewater
Pumps
Primary Settling Tanks
Final Clarifiers
Disinfection
RAS
Gravity Thickener
Belt Filter Press
Stabilized & Dewatered Sludge To Landfill
WAS
Filtrate
Cayuga Creek
Dechlorination
Primary Digester
Secondary Digester
Sludge
Recycled Flow
Wastewater Flow
Final Effluent

2.1.4 Secondary Treatment
Secondary treatment consists of four aeration basins, each having 0.5 MG of volume and a fine bubble
diffuser system. There are four centrifugal blowers, each 125 horsepower (hp). Previously, dissolved
oxygen (DO) probes automatically controlled the blowers. However, the blowers are now controlled
manually by adjusting the blower inlets based on readings from the DO meters. The aeration basins are
operated in plug flow mode.
From the aeration basins, wastewater continues to the final clarifiers. There are four rectangular final
clarifiers, each with 0.5 MG of volume and fiberglass and plastic chain and flights. Settled sludge is either
returned as returned activated sludge (RAS) to the aeration basins or wasted as waste activated sludge
(WAS) to the gravity thickeners.
2.1.5 Tertiary Treatment
There are no tertiary facilities currently at the IAWWTF. However, because the City foresees that the New
York State Department of Environmental Conservation (NYSDEC) may impose more stringent effluent
phosphorus requirements for IAWWTF discharge in five to ten years, the City currently is voluntarily
installing tertiary treatment facilities. The tertiary system under construction is Actiflo®, which is a high-
rate clarification system that uses microsand-enhanced flocculation and settling.
2.1.6 Chlorine Disinfection
Disinfection occurs in the outfall pipe and uses 10% to 15% solution sodium hypochlorite. Dechlorination
uses sulfur dioxide gas and is located in the dechlorination building approximately 2,400 feet north of the
IAWWTF.
2.1.7 Solids Handling
Primary and secondary sludge is blended and pumped to two gravity thickeners. The thickened sludge is
then pumped to the two digesters that operate as two-stage (in series). The primary digester has a volume
of 1.3 MG and the secondary digester has a volume of 1.1 MG. Pearth gas mixing is used in both the
primary and secondary digesters. The secondary digester is mixed once per week, so generally, it is
stratified. Also, there is a floating gas cover on the secondary digester for digester gas storage. Digester
gas is primarily used to run two co-generators, each 110-kilowatt (kW) capacity.
2255-063 2-2 Ithaca AreaWastewater Treatment Facility NYSERDA Submetering City of Ithaca

Digested sludge is pumped to the belt filter press. There is one 2 -meter belt filter press that is operated five
days per week (during the day shift only). Solids percentage into the press ranges between approximately
3% and 4%. Solids percentage leaving the press is 20% at a minimum to meet landfillng requirements, and
typically averages 22%. In the summer, solids percentage peaks at approximately 24%. From the belt
filter press, sludge cake is landfilled.
The IAWWTF is staffed from approximately 7:30 AM to 4:30 PM, five days per week (Monday through
Friday), and from 7:30 AM to 3:00 PM on Saturday and Sunday. As the facility is equipped with panel
alarms, it is not staffed in shifts.
2.2 HISTORICAL ENERGY USAGE AND UTILITY BILLING
A number of capital investment projects are either ongoing or have occurred in the past five years.
• A new belt filter press was installed in 2000.
• A fifth influent pump was installed in 2001.
• VFDs were installed on three influent pumps, three primary sludge pumps, one heat exchanger
pump, two waste sludge pumps, three belt press feed pumps, and one belt press pump.
• One boiler has been rebuilt.
• Primary settling tank chains and flights replaced with plastic and fiberglass.
These projects are being/were implemented with the goals of improving the treatment processes and
improving energy efficiency.
Monthly data on electric energy usage and billing (New York State Electric and Gas Corporation [NYSEG]
and Advantage Energy) were obtained from the IAWWTF for 2002 and 2003, except May 2002 for which
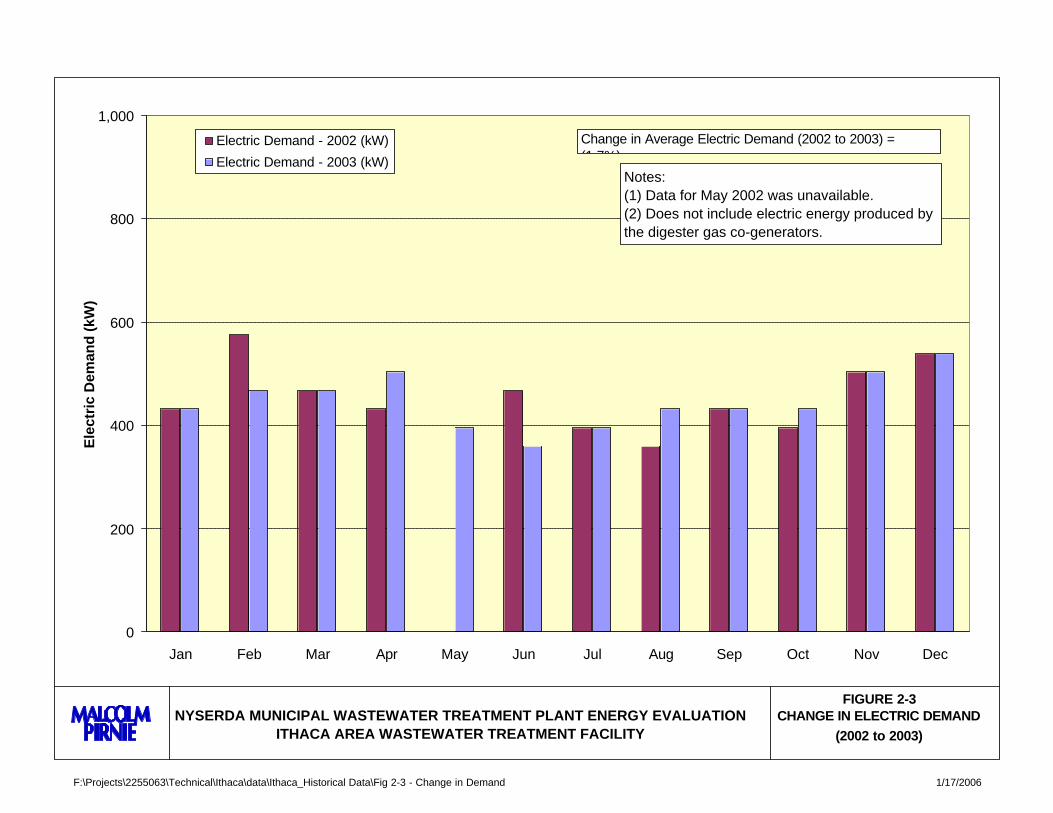
the data were unavailable. FIGURE 2-2 shows the monthly electric energy demand and usage for 2002 and
2003. Billing for the IAWWTF is based on the kW demand and kWh usage. The digester gas co
generators produce electric energy that is fed back into the facility’s power grid for electric energy usage
therefore reducing the billed usage.
The 2003 data set shows a slight decrease in electric energy demand and an increase in electric energy
usage from the 2002 data set, with a decrease of 1.7% in average electric energy demand and a 2.8%
increase in annual electric energy usage. It should be noted that the comparison of the electric energy
demand and usage for the 2002 and 2003 dataset does not include the month of May 2002. FIGURES 2-3
and 2-4 illustrate the change in electric energy demand and usage, respectively, for 2002 through 2003. In
combination with the electric rate increase, this resulted in a 7.9% increase in electric power charges (up
2255-063 2-3 Ithaca AreaWastewater Treatment Facility NYSERDA Submetering City of Ithaca
100,000
150,000
200,000
250,000
300,000
350,000
Jan-
2002
Feb
-200
2
Mar
-200
2
Apr
-200
2
May
-200
2
Jun-
2002
Jul-2
002
Aug
-200
2
Sep
-200
2
Oct
-200
2
Nov
-200
2
Dec
-200
2
Jan-
2003
Feb
-200
3
Mar
-200
3
Apr
-200
3
May
-200
3
Jun-
2003
Jul-2
003
Aug
-200
3
Sep
-200
3
Oct
-200
3
Nov
-200
3
Dec
-200
3
Ele
ctri
c U
sag
e (k
Wh
)
0
100
200
300
400
500
600
700
800
Ele
ctri
c D
eman
d (
kW)
Electric Usage (kWh)
Electric Demand (kW)
FIGURE 2-2 ELECTRIC DEMAND
AND USAGE (2002 to 2003)
NYSERDA MUNICIPAL WASTEWATER TREATMENT PLANT ENERGY EVALUATION ITHACA AREA WASTEWATER TREATMENT FACILITY
Average Electric Demand (2002) = 455 kW Average Electric Demand (2003) = 447 kW Total Electric Usage (2002) = 2,340,000 kWh Total Electric Usage (2003) = 2,404,800 kWh
Notes: (1) Data for May 2002 was unavailable. (2) Does not include electric energy produced by the digester gas co-generators.
F:\Projects\2255063\Technical\Ithaca\data\Ithaca_Historical Data\Fig 2-2 Elec Demand and Usage 1/17/2006
0
200
400
600
800
1,000
Jan Feb Mar Apr May Jun Jul Aug Sep Oct Nov Dec
Ele
ctri
c D
eman
d (
kW)
Electric Demand - 2002 (kW)
Electric Demand - 2003 (kW)
Change in Average Electric Demand (2002 to 2003) = (1.7%)
FIGURE 2-3 CHANGE IN ELECTRIC DEMAND
(2002 to 2003) NYSERDA MUNICIPAL WASTEWATER TREATMENT PLANT ENERGY EVALUATION
ITHACA AREA WASTEWATER TREATMENT FACILITY
Notes: (1) Data for May 2002 was unavailable. (2) Does not include electric energy produced by the digester gas co-generators.
F:\Projects\2255063\Technical\Ithaca\data\Ithaca_Historical Data\Fig 2-3 - Change in Demand 1/17/2006

0
80,000
160,000
240,000
320,000
400,000
Ele
ctri
c U
sag
e (k
Wh
)
Jan Feb Mar Apr May Jun Jul Aug Sep Oct Nov Dec
Electric Usage - 2002 (kWh) Electric Usage - 2003 (kWh)
Notes: (1) Data for May 2002 was unavailable. (2) Does not include electric energy produced by the digester gas co-generators.
Change in Annual Electric Usage (2002 to 2003) = 2.8%
NYSERDA MUNICIPAL WASTEWATER TREATMENT PLANT ENERGY EVALUATION ITHACA AREA WASTEWATER TREATMENT FACILITY
FIGURE 2-4 CHANGE IN
ELECTRIC USAGE (2002 to 2003)
F:\Projects\2255063\Technical\Ithaca\data\Ithaca_Historical Data\Fig 2-4 - Change in Usage 1/17/2006
from $203,324 in 2002 at an average cost of $0.08 per kWh to $220,876 in 2003 at an average cost of $0.09
per kWh). However, it is noted that May 2002 electric energy demand, usage, and costs are missing and
are not accounted for in the comparison. Hourly demand data are not available for the IAWWTF.
2.3 NATURAL GAS SUMMARY
FIGURE 2-5 shows a monthly comparison of natural gas usage and average temperatures for 2002 and
2003. Monthly data on natural gas usage and billing (NYSEG and Advantage Energy) were obtained from
the IAWWTF for 2002 and 2003, except May 2002 which was not available. Average monthly
temperatures were obtained from the National Weather Service-Binghamton, NY website. It can be seen
that during winter months (lower temperature), the quantity of natural gas delivered was higher than in
months with higher temperatures, as expected. The average temperature for 2002 was 47.2 degrees
Fahrenheit (oF) with a total usage of 128,684 therms at an average rate of $0.90 per therm and a total cost
of $117,129. The average temperature for 2003 was 44.8 oF with a total usage of 139,842 therms at an
average rate of $0.87 per therm and a total cost of $115,190. Due to a decrease in the natural gas rate, an
8.7% increase in the amount of natural gas delivered from 2002 to 2003 resulted in a 1.7% reduction in the
total cost. However, it should be noted that the comparison of the monthly natural gas usage for the 2002
and 2003 dataset does not include the month of May 2002 as that data was unavailable. In addition to the
natural gas usage, the generated digester gas is used to produce electric energy and used in boilers to heat
the plant. It is seen on FIGURE 2-5 that even as the outdoor temperature increases during the months of
February through April of both 2002 and 2003, there is also an increase in the natural gas usage. Plant staff
indicated this may be related to annual digester maintenance performed in spring and reduced digester gas
production during this time frame that contribute to increased natural gas usage.
Total plant natural gas usage on a per square foot basis can be calculated as a benchmark performance
parameter by dividing the annual gas usage by the square footage of the buildings. The IAWWTF
estimates that there is approximately 56,514 square feet of area spread over six buildings and six galleys.
The estimated natural gas usage per square foot of the plant averaged approximately 2.3 therms per square
foot in 2002 and 2.5 therms per square foot in 2003.
2.4 SUMMARY OF ENERGY COSTS
TABLE 2-1 summarizes the energy costs for 2002 and 2003 based on data provided by plant personnel.
2255-063 2-4 Ithaca AreaWastewater Treatment Facility NYSERDA Submetering City of Ithaca

0
10,000
20,000
30,000
40,000
50,000 N
atu
ral G
as U
sag
e (t
her
ms)
Jan Feb Mar Apr May Jun Jul Aug Sep Oct Nov Dec
0
20
40
60
80
100
120
140
160
Ave
rag
e T
emp
erat
ure
(D
egre
e F
ahre
nh
eit)
Natural Gas Usage - 2002 Natural Gas Usage - 2003 Average Temperature - 2002 Average Temperature - 2003
Note: Data for May 2002 was unavailable.
NYSERDA MUNICIPAL WASTEWATER TREATMENT PLANT ENERGY EVALUATION ITHACA AREA WASTEWATER TREATMENT FACILITY
FIGURE 2-5 NATURAL GAS USAGE
(2002 to 2003)
F:\Projects\2255063\Technical\Ithaca\data\Ithaca_Historical Data\Fig 2-5 Natural Gas Usage 1/17/2006
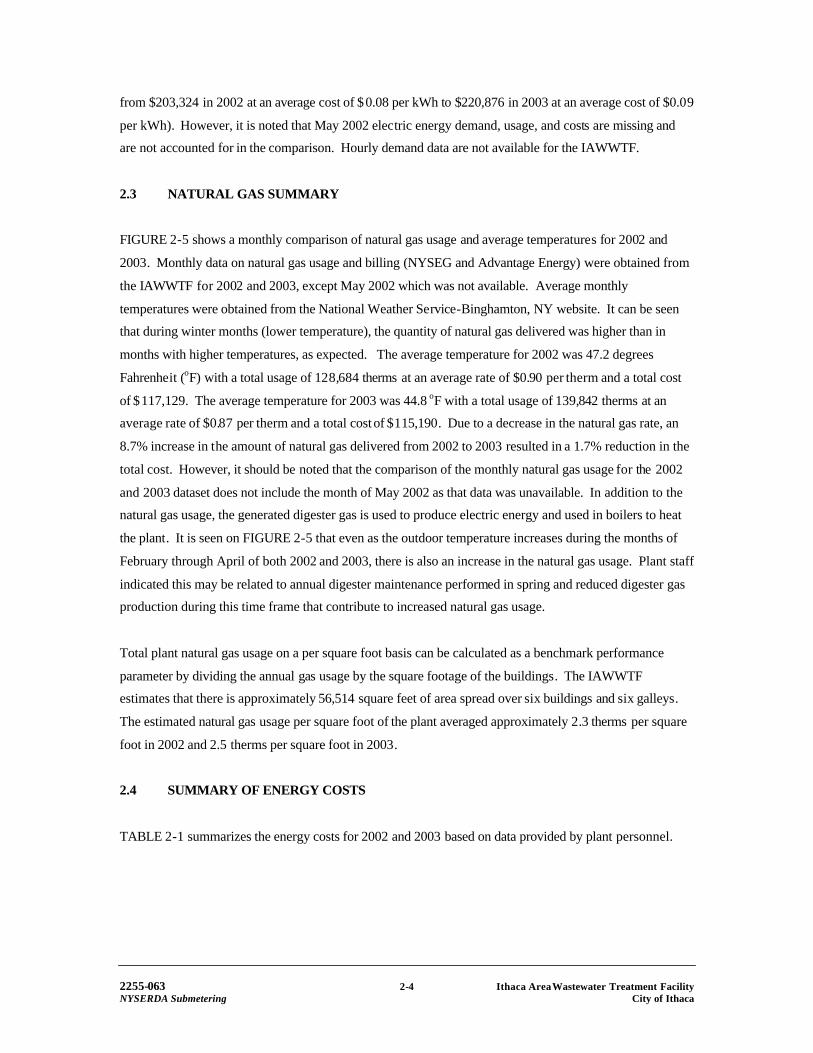
Table 2-1: Summary of Energy Costs
Year 2002 2003 Average
Average Flow (MGD) 6.48 7.03 6.75
Electricity
Annual Usage (kWh) - Billed 2,340,000 2,404,800 2,372,400
Estimated Co-generator Production (kWh) 1,112,156 1,112,156 1,112,156
Total Estimated Annual Usage (kWh) 3,452,156 3,516,956 3,484,556
Rate ($/kWh) (1) $0.08 $0.09 $0.09
Annual Costs (1) $203,324 $220,876 $212,100
Average Usage (kWh per MG) 1,460 1,371 1,416
Average Costs ( $ per MGD) (1) $85.99 $86.11 $86.05
Natural Gas
Annual Usage (Therms) 128,684 139,842 134,263
Rate ($/Therms) $0.90 $0.87 $0.88
Annual Costs $117,129 $115,190 $116,159
Average Usage (Therms per MG) 54 55 55
Average Costs ( $ per MGD) $49.54 $44.91 $47.22
Total Energy Costs of Electricity and Gas $320,452 $336,066 $328,259
Total Energy Costs per MGD $135.53 $131.02 $133.27
Note: (1) Electric rates and costs are only for billed usage.
2.5 SUMMARY OF HISTORICAL LOADINGS AND EFFLUENT QUALITY
Monthly plant flows and process data provided by the IAWWTF for 2002 and 2003 is tabulated in TABLE
2-2.
Table 2-2: Summary of IAWWTF Performance – Wet Stream Process
Wastewater Parameter Average
2002 2003
Influent Plant Flow (MGD) 6.48 7.03
Influent BOD5 Concentration (mg/L) 194 178
Influent BOD5 Loading (lb/d) 10,348 10,383
BOD5 Removal (%) 92.6% 91.3%
Influent TSS Concentration (mg/L) 196 149
Influent TSS Loading (lb/d) 10,473 8,568
TSS Removal (%) 98.7% 98.4%
2255-063 2-5 Ithaca AreaWastewater Treatment Facility NYSERDA Submetering City of Ithaca
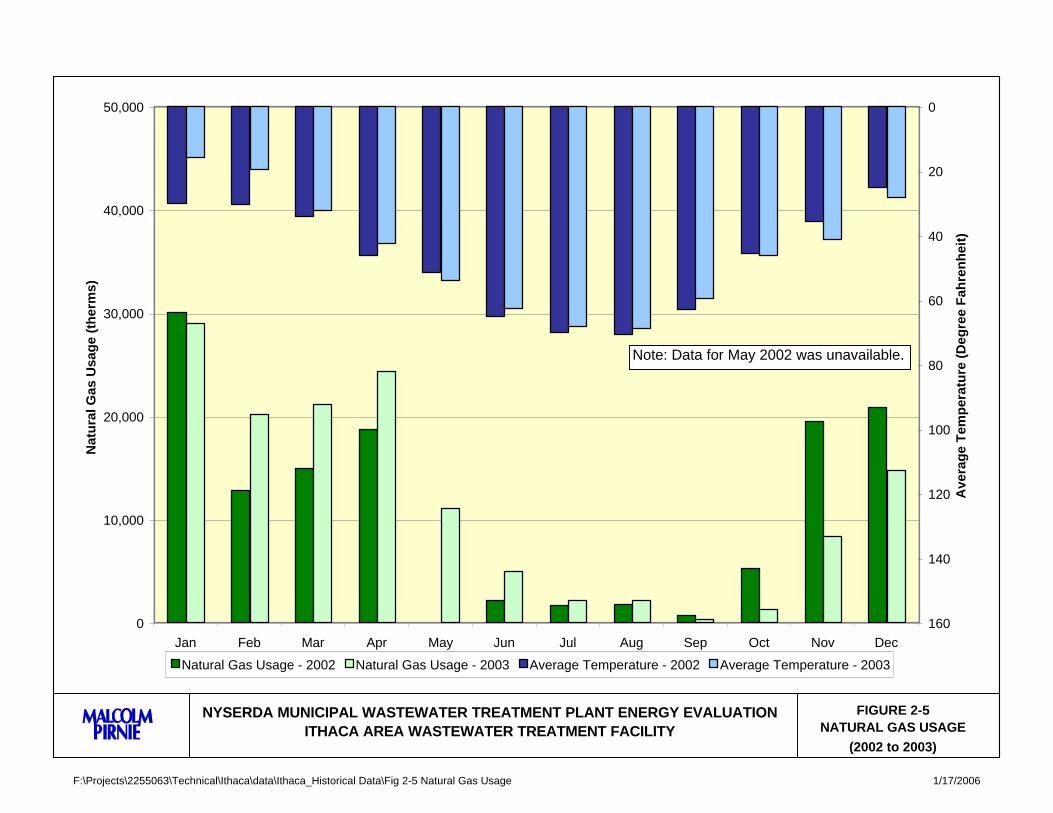
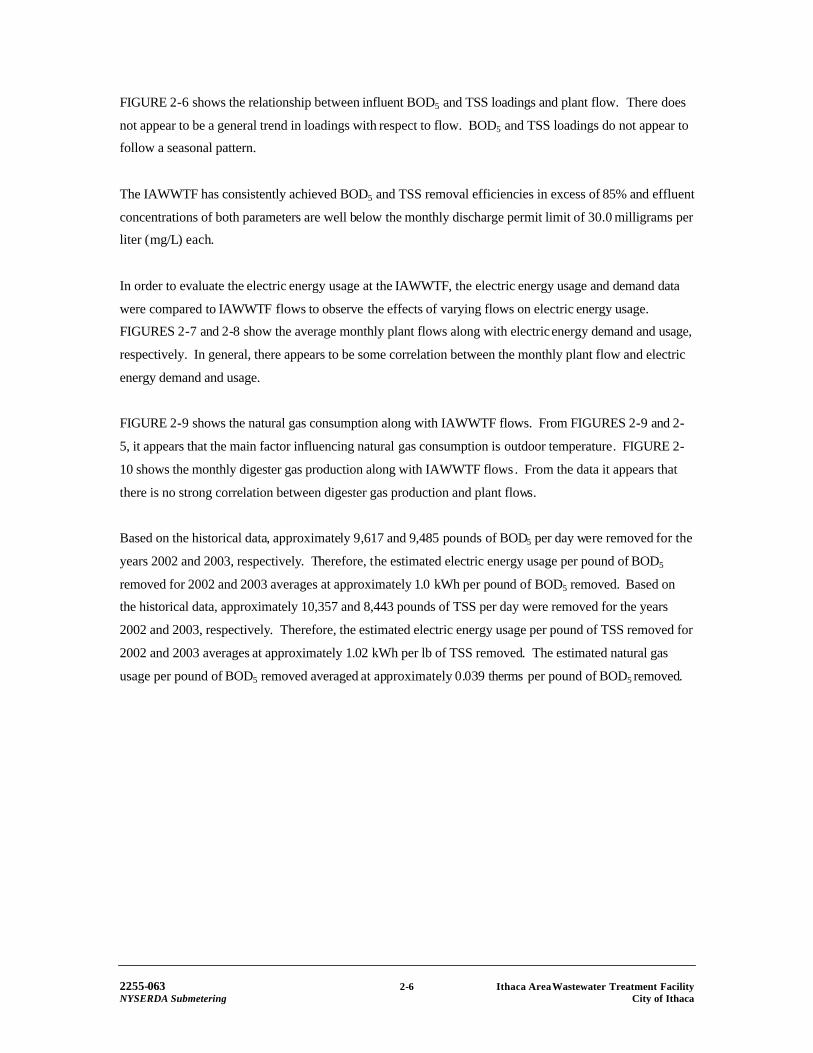
FIGURE 2-6 shows the relationship between influent BOD5 and TSS loadings and plant flow. There does
not appear to be a general trend in loadings with respect to flow. BOD5 and TSS loadings do not appear to
follow a seasonal pattern.
The IAWWTF has consistently achieved BOD5 and TSS removal efficiencies in excess of 85% and effluent
concentrations of both parameters are well below the monthly discharge permit limit of 30.0 milligrams per
liter (mg/L) each.
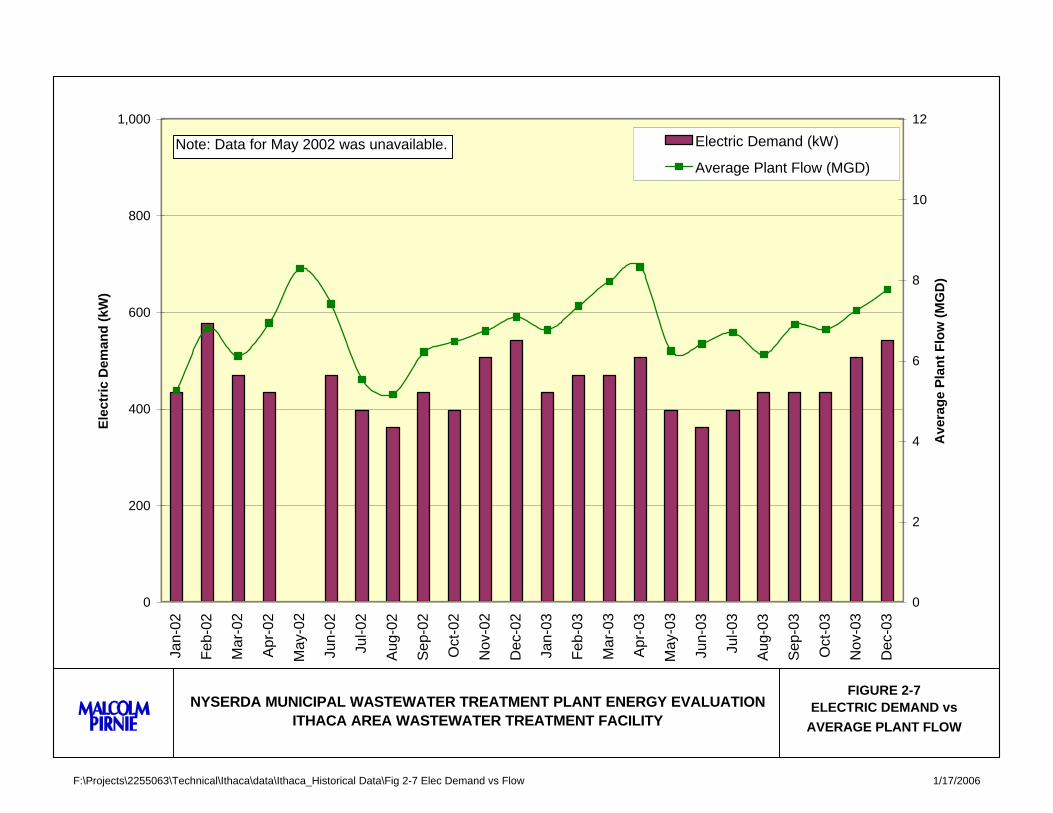
In order to evaluate the electric energy usage at the IAWWTF, the electric energy usage and demand data
were compared to IAWWTF flows to observe the effects of varying flows on electric energy usage.
FIGURES 2-7 and 2-8 show the average monthly plant flows along with electric energy demand and usage,
respectively. In general, there appears to be some correlation between the monthly plant flow and electric
energy demand and usage.
FIGURE 2-9 shows the natural gas consumption along with IAWWTF flows. From FIGURES 2-9 and 2
5, it appears that the main factor influencing natural gas consumption is outdoor temperature. FIGURE 2
10 shows the monthly digester gas production along with IAWWTF flows . From the data it appears that
there is no strong correlation between digester gas production and plant flows.
Based on the historical data, approximately 9,617 and 9,485 pounds of BOD5 per day were removed for the
years 2002 and 2003, respectively. Therefore, the estimated electric energy usage per pound of BOD5
removed for 2002 and 2003 averages at approximately 1.0 kWh per pound of BOD5 removed. Based on
the historical data, approximately 10,357 and 8,443 pounds of TSS per day were removed for the years
2002 and 2003, respectively. Therefore, the estimated electric energy usage per pound of TSS removed for
2002 and 2003 averages at approximately 1.02 kWh per lb of TSS removed. The estimated natural gas
usage per pound of BOD5 removed averaged at approximately 0.039 therms per pound of BOD5 removed.
2255-063 2-6 Ithaca AreaWastewater Treatment Facility NYSERDA Submetering City of Ithaca

12
18,000
16,000
14,000
12,000
10,000
8,000
6,000
4,000
2,000
20,000 Average BOD5 Loading (lb/d)
Average TSS Loading (lb/d)
Average Plant Flow (MGD)
Average BOD5 Loading = 10,366 lb/d Average TSS Loading = 9,494 lb/d
10
8
6
4
2
0
Ave
rag
e L
oad
ing
(lb
/d)
Ave
rag
e P
lan
t F
low
(M
GD
)
Jan-
02
Feb
-02
Mar
-02
Apr
-02
May
-02
Jun-
02
Jul-0
2
Aug
-02
Sep
-02
Oct
-02
Nov
-02
Dec
-02
Jan-
03
Feb
-03
Mar
-03
Apr
-03
May
-03
Jun-
03
Jul-0
3
Aug
-03
Sep
-03
Oct
-03
Nov
-03
Dec
-03
FIGURE 2-6 INFLUENT TSS AND
BOD5 LOADING
NYSERDA MUNICIPAL WASTEWATER TREATMENT PLANT ENERGY EVALUATION ITHACA AREA WASTEWATER TREATMENT FACILITY
0
F:\Projects\2255063\Technical\Ithaca\data\Ithaca_Historical Data\Fig 2-6 BOD TSS Loading 1/17/2006
0
200
400
600
800
1,000 E
lect
ric
Dem
and
(kW
)
Jan-
02
Feb
-02
Mar
-02
Apr
-02
May
-02
Jun-
02
Jul-0
2
Aug
-02
Sep
-02
Oct
-02
Nov
-02
Dec
-02
Jan-
03
Feb
-03
Mar
-03
Apr
-03
May
-03
Jun-
03
Jul-0
3
Aug
-03
Sep
-03
Oct
-03
Nov
-03
Dec
-03
0
2
4
6
8
10
12
Ave
rag
e P
lan
t F
low
(M
GD
)
Electric Demand (kW)
Average Plant Flow (MGD)
Note: Data for May 2002 was unavailable.
NYSERDA MUNICIPAL WASTEWATER TREATMENT PLANT ENERGY EVALUATION ITHACA AREA WASTEWATER TREATMENT FACILITY
FIGURE 2-7 ELECTRIC DEMAND vs
AVERAGE PLANT FLOW
F:\Projects\2255063\Technical\Ithaca\data\Ithaca_Historical Data\Fig 2-7 Elec Demand vs Flow 1/17/2006

0
50,000
100,000
150,000
200,000
250,000
300,000
350,000
400,000
Ele
ctri
c U
sag
e (k
Wh
)
Jan-
02
Feb
-02
Mar
-02
Apr
-02
May
-02
Jun-
02
Jul-0
2
Aug
-02
Sep
-02
Oct
-02
Nov
-02
Dec
-02
Jan-
03
Feb
-03
Mar
-03
Apr
-03
May
-03
Jun-
03
Jul-0
3
Aug
-03
Sep
-03
Oct
-03
Nov
-03
Dec
-03
0
2
4
6
8
10
12
Ave
rag
e P
lan
t F
low
(M
GD
)
Electric Usage (kWh)
Average Plant Flow (MGD)
Note: Data for May 2002 was unavailable.
NYSERDA MUNICIPAL WASTEWATER TREATMENT PLANT ENERGY EVALUATION ITHACA AREA WASTEWATER TREATMENT FACILITY
FIGURE 2-8 ELECTRIC USAGE vs AVERAGE
PLANT FLOW
F:\Projects\2255063\Technical\Ithaca\data\Ithaca_Historical Data\Fig 2-8 Elec Usage vs Flow 1/17/2006
0
8,000
16,000
24,000
32,000
40,000
Jan-
02
Feb
-02
Mar
-02
Apr
-02
May
-02
Jun-
02
Jul-0
2
Aug
-02
Sep
-02
Oct
-02
Nov
-02
Dec
-02
Jan-
03
Feb
-03
Mar
-03
Apr
-03
May
-03
Jun-
03
Jul-0
3
Aug
-03
Sep
-03
Oct
-03
Nov
-03
Dec
-03
Nat
ura
l Gas
Usa
ge
(Th
erm
s)
0
2
4
6
8
10
12
Ave
rag
e P
lan
t F
low
(M
GD
)
Natural Gas Usage (Therms)
Average Plant Flow (MGD)
FIGURE 2-9 NATURAL GAS USAGE vs AVERAGE PLANT FLOW
NYSERDA MUNICIPAL WASTEWATER TREATMENT PLANT ENERGY EVALUATION ITHACA AREA WASTEWATER TREATMENT FACILITY
Note: Data for May 2002 was unavailable.
F:\Projects\2255063\Technical\Ithaca\data\Ithaca_Historical Data\Fig 2-9 Nat. Gas Usage vs Flow 1/17/2006

FIGURE 2-10 MONTHLY DIGESTER GAS
PRODUCTION vs AVERAGE PLANT FLOW
NYSERDA MUNICIPAL WASTEWATER TREATMENT PLANT ENERGY EVALUATION ITHACA AREA WASTEWATER TREATMENT FACILITY
0
500,000
1,000,000
1,500,000
2,000,000
2,500,000
3,000,000
Jan-
02
Feb
-02
Mar
-02
Apr
-02
May
-02
Jun-
02
Jul-0
2
Aug
-02
Sep
-02
Oct
-02
Nov
-02
Dec
-02
Jan-
03
Feb
-03
Mar
-03
Apr
-03
May
-03
Jun-
03
Jul-0
3
Aug
-03
Sep
-03
Oct
-03
Nov
-03
Dec
-03
Dig
este
r G
as P
rod
uct
ion
(cu
.ft.
)
0
2
4
6
8
10
12
Ave
rag
e P
lan
t F
low
(M
GD
)
Digester Gas Production (cu.ft.)
Average Plant Flow (MGD)
F:\Projects\2255063\Technical\Ithaca\data\Ithaca_Historical Data\Fig 2-10 Methane vs Flow 1/17/2006
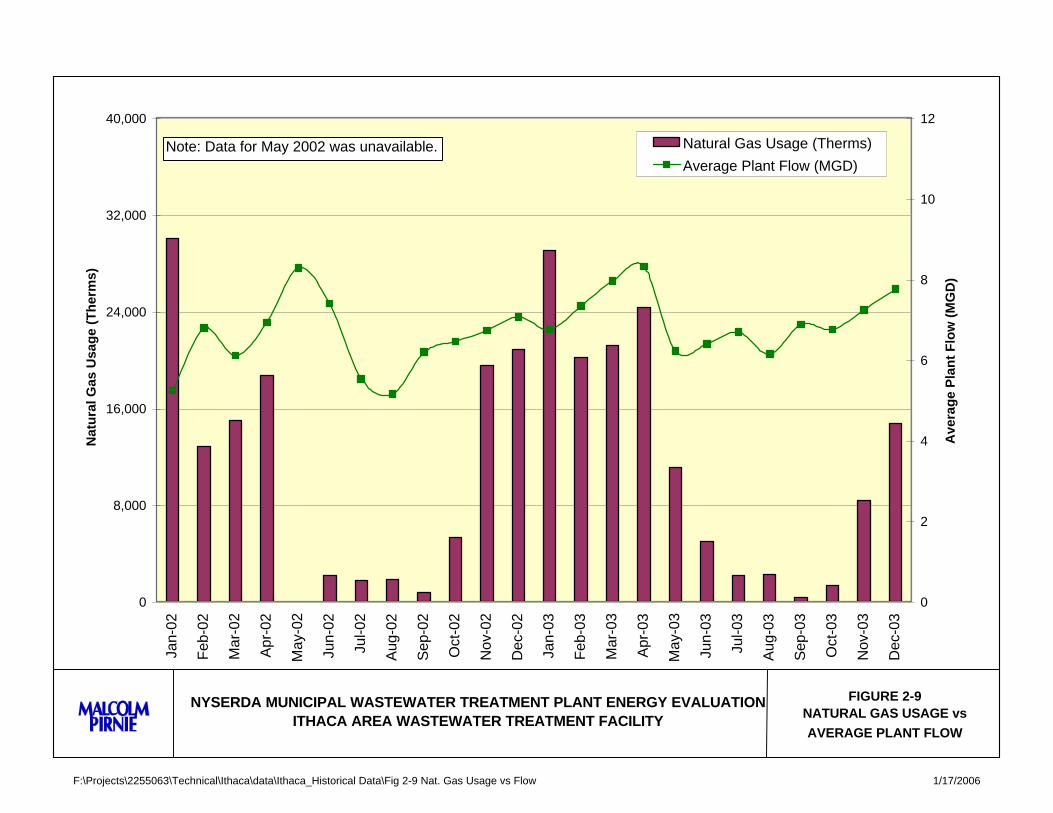
TABLE 2-3 summarizes the performance of the solids handling processes, based on historical data.
Table 2-3: Summary of IAWWTF Solids Handling Processes
Parameter Average 2002 2003
Waste Activated Sludge to Thickeners (MGD) 0.18 0.18
Septage to Primary Digester (gpd) 15,170 14,373
Sludge to Primary Digester (gpd) 35,060 39,458
Pumped Digested Sludge (gpd) 36,886 38,832
Digester Gas Produced (cu. ft. per day) 52,347 71,362
Cake Solids (%) 22.4% 21.6%
Dry cake (tons/day) 6.3 5.7
2255-063 2-7 Ithaca AreaWastewater Treatment Facility NYSERDA Submetering City of Ithaca

Section 3
ELECTRIC SUBMETERING PROGRAM
3.1 DESCRIPTION OF SUBMETERING PROGRAM AND SUBMETER LOCATIONS
3.1.1 Description of Program
TABLE 3-1 summarizes the motors at the Ithaca Area Wastewater Treatment Facility (IAWWTF) that are
5 horsepower (hp) or greater. Submetering was conducted on larger motors to capture data for energy-
intensive processes.
Continuous submetering was conducted through installation of submeters with continuous recording
electronic data loggers (CREDLs). Continuous submetering was used to capture diurnal variations in
electric energy demand for major pieces of equipment, as well as to provide a representative sample of
electric energy usage and demand as equipment cycles on and off.
Instantaneous submetering was also conducted on representative pieces of equipment, usually those that
operated at a constant speed according to a set schedule and driven by motors rated at 5 hp or greater. The
instantaneous readings and estimated operating hours were then used to estimate total electric energy usage
for the particular piece of equipment.
3.1.2 Submeter Locations
Based on a plant walk-through and existing plant information, continuously recording submeters were
installed at a total of nine locations:
• Two meters on the influent pumps, one meter for each of the two influent pumps with variable
frequency drives (VFDs) that are in operation during normal and most high flow conditions.
• Two meters on the aeration blowers, one meter for each blower in operation.
• Two meters on the return activated sludge (RAS) pumps, one meter for each pump with VFD in
operation.
• One meter on the solids handling building motor control center (MCC) for the belt filter press.
• Two meters on the digester gas fueled co-generators, one meter for each co-generator.
The submeters were installed from September 17, 2004 to October 31, 2004.
2255-063 3-1 Ithaca Area Wastewater Treatment Facility NYSERDA Submetering City of Ithaca

New York State Energy Research and Development Authority Municipal Wastewater Treatment Plant Energy Evaluation
Ithaca Area Wastewater Treatment Facility
Table 3-1 List of Motors over 5 hp
Process Component Quantity Rated hp No. of Units Typically in Operation
Influent Pumps 3 100 2 Influent Pump #1 100 1 Influent Pump #2 100 1 Influent Pumps 2 150 0
Controlled Diversion Pumps 2 60 0
Preliminary Treatment Mechanical Bar Screens 2 5 2
Primary Sludge Pumps #1 and #2 2 7.5 1 Primary Sludge Pump #3 1 10 1
Air Blowers 1 - 4 4 125 2 Air Blower #1 125 1 Air Blower #2 125 1
Return Sludge Pumps 1 - 5 5 20 2 RAS Pump #2 20 1 RAS Pump #5 20 1
H.V. #1 1 7.5 1 H.V. #3 1 20 1 H.V. #4 1 7.5 1 H.V. #5 1 15 1 H.V. #8 1 7.5 1
Exhaust Fan #1 1 5 1 Exhaust Fan #3 1 5 1 Exhaust Fan #5 1 5 1
Exhaust Fan #10 1 5 1 Exhaust Fan #11 1 5 1 Exhaust Fan #12 1 5 1 Exhaust Fan #19 1 7.5 1 Exhaust Fan #26 1 15 1
H.R. Circulation Pump #5 1 5 1 H.R. Circulation Pump #9 1 10 1 H.R. Circulation Pump #11 1 5 1 H.R. Circulation Pump #13 1 7.5 1 H.R. Circulation Pump #16 1 7.5 1
Main H.W. Circulation Pump #1and #2 2 15 1 H.W. Circulation Pump #20 1 5 1
Boiler #1 and #2 2 7.5 1 Main H.W. Circulation Pump #3 1 7.5 1
Digester Gas Co-Generators H.W. Circulation Pump #3, #4,and #5 3 5 2
Heat Exchange Pumps #1 and #2 2 20 1 Septage Pumps #1 and #2 2 20 1
Digester Sludge Pumps #1, #2, and #3 3 7.5 1 Thickened Sludge Pumps 3 7.5 2 Thickener Makeup Pumps 2 20 1
Mixing Compresser #1 and #2 2 40 1 Septage Mixers #1 and #2 2 10 1
Belt Filter Press 1 7.5 1 Primary Scum Box Mixer 1 7.5 1
Wash Water Booster Pump 1 7.5 1 Circulation Pump #1 and #2 2 20 1
Plant Water Effluent Water Pumps #1and #2 2 25 1
Miscellaneous Sump Pumps 8 5 8
Monitored with continuous submeters Could not access during site visit Not in Operation Out of Service Could not locate motor during walk-through
Secondary Treatment
Solids Handling
Heating, Ventilation, and Air Conditioning
Wastewater Pumping
Primary Treatment
F:\Projects\2255063\Technical\Ithaca\Ithaca_Instantaneous_Submetering\Table 3-1 1/17/2006

3.2 SUMMARY OF SITE AUDIT
A one-day on-site survey was conducted to:
• Document existing equipment, operations and lighting.
• Finalize the list of opportunities for energy improvements.
• Finalize the submetering approach.
The submetering locations listed in Section 3.1.2 were finalized as a result of the site audit. In addition, the
site survey assessed the existing equipment at the plant with 5-hp or greater motors. As shown by the data
in TABLE 3-1, the motors that may use the most electric energy are those on the influent wastewater
pumps and the aeration system blowers.
3.3 SUMMARY OF CONTINUOUS SUBMETERING
The following sections summarize the results from continuous submetering activities. Continuous readings
for total electric energy demand data for the entire plant were not available.
3.3.1 Digester-Gas Fueled Co -generators
There are two 110-kW co-generators that are primarily run using digester gas. Continuous submeters were
installed on both digester gas fueled co-generators. The patterns of electric energy production during the
submetering period are shown on FIGURE 3-1. The data illustrate that co-generator 1 was continuously
operational for the duration of the submetering period except between October 14, 2004 and October 19,
2004 and co-generator 2 was operational only from the start of the submetering program until October 19,
2004.
When in operation (electric energy production > 0 kW), the average electric energy production values for
co-generators 1 and 2 were 101.2 kW (135.5 hp) and 99.3 kW (133.1 hp), respectively. Typically only one
co-generator is in operation. However, if sufficient methane is available, a second co-generator is brought
online as was the case during the submetering period. IAWWTF staff also noted that typically one co
generator operates continuously, while the second co-generator typically operates for approximately 6
months per year 8 hours per day, although this may vary depending on methane production.
The estimated electric energy produced by the co-generators during the submetering period was 95,335
kWh and 70,015 kWh, respectively. The cost savings was estimated based on the 2003 average cost of
2255-063 3-2 Ithaca Area Wastewater Treatment Facility NYSERDA Submetering City of Ithaca

$0.09 per kWh. If the numbers obtained during submetering are extrapolated to an entire year, it is
estimated that approximately 1,354,310 kWh would be the combined electric energy produced by the two
co-generators per year. However, based on the information provided by the IAWWTF staff, the second co
generator only operates approximately 6 months per year, which is not accounted for in the submetering
period data. Therefore, a revised electric energy production was estimated at 1,022,000 kWh for the two
co-generators (one co-generator operating continuously and one co-generator operating 6 months for 8
hours per day) with an estimated electric energy cost savings of $94,539. This cost is approximately what
the IAWWTF saves each year by using digester gas for on-site generation to supplement the electricity
purchased from NYSEG. The revised estimated electric energy production by the co-generators was added
to the billed electric energy usage to estimate the total electric energy usage at the plant.
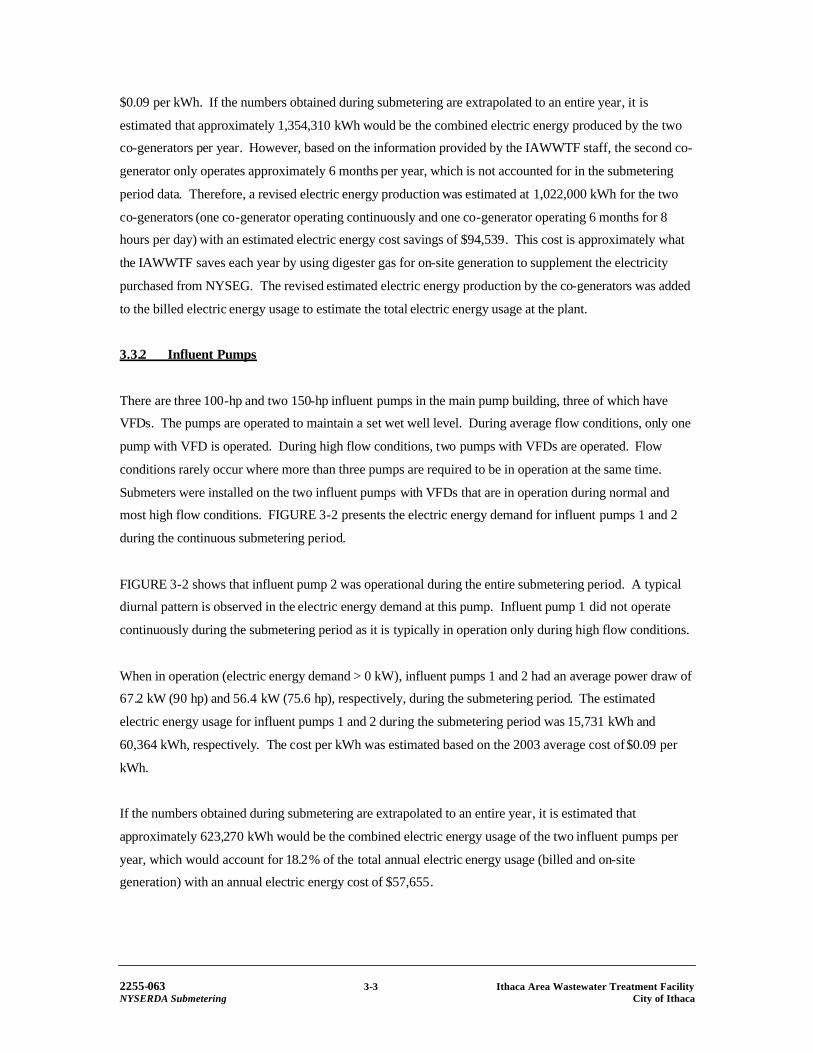
3.3.2 Influent Pumps
There are three 100-hp and two 150-hp influent pumps in the main pump building, three of which have
VFDs. The pumps are operated to maintain a set wet well level. During average flow conditions, only one
pump with VFD is operated. During high flow conditions, two pumps with VFDs are operated. Flow
conditions rarely occur where more than three pumps are required to be in operation at the same time.
Submeters were installed on the two influent pumps with VFDs that are in operation during normal and
most high flow conditions. FIGURE 3-2 presents the electric energy demand for influent pumps 1 and 2
during the continuous submetering period.
FIGURE 3-2 shows that influent pump 2 was operational during the entire submetering period. A typical
diurnal pattern is observed in the electric energy demand at this pump. Influent pump 1 did not operate
continuously during the submetering period as it is typically in operation only during high flow conditions.
When in operation (electric energy demand > 0 kW), influent pumps 1 and 2 had an average power draw of
67.2 kW (90 hp) and 56.4 kW (75.6 hp), respectively, during the submetering period. The estimated
electric energy usage for influent pumps 1 and 2 during the submetering period was 15,731 kWh and
60,364 kWh, respectively. The cost per kWh was estimated based on the 2003 average cost of $0.09 per
kWh.
If the numbers obtained during submetering are extrapolated to an entire year, it is estimated that
approximately 623,270 kWh would be the combined electric energy usage of the two influent pumps per
year, which would account for 18.2% of the total annual electric energy usage (billed and on-site
generation) with an annual electric energy cost of $57,655.
2255-063 3-3 Ithaca Area Wastewater Treatment Facility NYSERDA Submetering City of Ithaca

Ele
ctri
c D
eman
d (
kW)
90
60
30
0
150
Aeration Blower 1 Note:
120
Aeration Blower 2 (1) Both blowers were shut down for approximately 30 minutes on October 1, 2004 due to a power outage. (2) Anomalous data occuring on October 24, 2004 potentially due to manual adjustment of blowers.
Wed
,09/
15/0
4
Fri,
09/1
7/04
Sun
,09/
19/0
4
Tue
,09/
21/0
4
Thu
,09/
23/0
4
Sat
,09/
25/0
4
Mon
,09/
27/0
4
Wed
,09/
29/0
4
Fri,
10/0
1/04
Sun
,10/
03/0
4
Tue
,10/
05/0
4
Thu
,10/
07/0
4
Sat
,10/
09/0
4
Mon
,10/
11/0
4
Wed
,10/
13/0
4
Fri,
10/1
5/04
Sun
,10/
17/0
4
Tue
,10/
19/0
4
Thu
,10/
21/0
4
Sat
,10/
23/0
4
Mon
,10/
25/0
4
Wed
,10/
27/0
4
Fri,
10/2
9/04
Sun
,10/
31/0
4
FIGURE 3-3 NYSERDA MUNICIPAL WASTEWATER TREATMENT PLANT ENERGY EVALUATION SUBMETERING - AERATION
ITHACA AREA WASTEWATER TREATMENT FACILITY SYSTEM BLOWERS 1 AND 2
F:\Projects\2255063\Technical\Ithaca\Ithaca_Continuous_Submetering\Fig 3.3-Aeration Blowers 1/17/2006

6
24
30
18
12
0
Ele
ctri
c D
eman
d (
kW)
RAS Pump 2
RAS Pump 5
Wed
,09/
15/0
4
Fri,
09/1
7/04
Sun
,09/
19/0
4
Tue
,09/
21/0
4
Thu
,09/
23/0
4
Sat
,09/
25/0
4
Mon
,09/
27/0
4
Wed
,09/
29/0
4
Fri,
10/0
1/04
Sun
,10/
03/0
4
Tue
,10/
05/0
4
Thu
,10/
07/0
4
Sat
,10/
09/0
4
Mon
,10/
11/0
4
Wed
,10/
13/0
4
Fri,
10/1
5/04
Sun
,10/
17/0
4
Tue
,10/
19/0
4
Thu
,10/
21/0
4
Sat
,10/
23/0
4
Mon
,10/
25/0
4
Wed
,10/
27/0
4
Fri,
10/2
9/04
Sun
,10/
31/0
4
FIGURE 3-4 NYSERDA MUNICIPAL WASTEWATER TREATMENT PLANT ENERGY EVALUATION SUBMETERING -RAS PUMPS
ITHACA AREA WASTEWATER TREATMENT FACILITY 2 AND 5
F:\Projects\2255063\Technical\Ithaca\Ithaca_Continuous_Submetering\Fig 3.4-RAS Pumps 1/17/2006
which would account for 5.7% of the total annual electric energy usage with an annual electric energy cost
of $18,161.
3.3.5 Solids Handling Building Belt Filter Press
There is one 7.5-hp belt filter press used for dewatering. Digested sludge is pumped to the belt filter press.
A submeter was installed on the solids handling building MCC for the belt filter press. FIGURE 3-5 shows
the operation of the belt filter press during the continuous submetering period. From FIGURE 3-5, it can
be seen that the belt filter press operates during week days (Monday through Friday) for approximately 8
hours a day (7 AM to 3 PM).
When in operation (electric energy demand > 1 kW), the belt filter press had an average electric energy
demand of 7.7 kW (10.3 hp). The estimated electric energy usage for the belt press during the submetering
period was 1,340 kWh.
If the numbers obtained during submetering are extrapolated to an entire year, it is estimated that
approximately 15,999 kWh would be the electric energy usage of the belt filter press per year, which would
account for 0.5% of the total annual electric energy usage with an annual electric energy cost of $1,480.
3.4 SUMMARY OF INSTANTANEOUS SUBMETERING
Instantaneous power draw measurements were obtained from motors greater than 5 hp at the plant for
equipment that is either in continuous use or operated on a set schedule. The data were collected to verify
electric energy demand at the facility, as well as to monitor changes in electric energy demand as the
equipment is cycled on and off.
The instantaneous measurements were obtained using hand-held meters. TABLE 3-2 summarizes the
instantaneous power draw and estimated operating hours for each piece of equipment over 5 hp.
Based on the instantaneous and continuous submetered power draw measurements, and the estimated
equipment operating hours provided by plant staff, TABLE 3-3 shows the estimated annual electric energy
usage and associated costs. The continuous submetering data were used to estimate electric energy usage
for the aeration system blowers, influent wastewater pumps, RAS pumps, and solids handling building
MCC.
2255-063 3-5 Ithaca Area Wastewater Treatment Facility NYSERDA Submetering City of Ithaca

0
4
16
20
12
8
Ele
ctri
c D
eman
d (
kW)
Electric Demand (kW)
Wed
,09/
15/0
4
Fri,
09/1
7/04
Sun
,09/
19/0
4
Tue
,09/
21/0
4
Thu
,09/
23/0
4
Sat
,09/
25/0
4
Mon
,09/
27/0
4
Wed
,09/
29/0
4
Fri,
10/0
1/04
Sun
,10/
03/0
4
Tue
,10/
05/0
4
Thu
,10/
07/0
4
Sat
,10/
09/0
4
Mon
,10/
11/0
4
Wed
,10/
13/0
4
Fri,
10/1
5/04
Sun
,10/
17/0
4
Tue
,10/
19/0
4
Thu
,10/
21/0
4
Sat
,10/
23/0
4
Mon
,10/
25/0
4
Wed
,10/
27/0
4
Fri,
10/2
9/04
Sun
,10/
31/0
4
FIGURE 3-5NYSERDA MUNICIPAL WASTEWATER TREATMENT PLANT ENERGY EVALUATION SUBMETERING -BELT FILTERITHACA AREA WASTEWATER TREATMENT FACILITY
PRESS
F:\Projects\2255063\Technical\Ithaca\Ithaca_Continuous_Submetering\Fig 3.5-Belt Press 1/17/2006

New York State Energy Research and Development Authority Municipal Wastewater Treatment Plant Energy Evaluation
Ithaca Area Wastewater Treatment Facility
Table 3-2 Instantaneous Power Draw Measurements and Estimates of Hours in Operation
No. of Units Days Weeks Measured Hours Estimated Annual
Process Component Quantity Rated hp Typically in per per Power Draw Notes Per Day Operating Hours
Operation Week Year (kw) Influent Pumps 3 100 2
Influent pump #1 operated only during wet weather. Operating hours projected to one year from the
Wastewater Pumping Influent Pump #1 1 1,919 67.15 operating hours during the submetering period. Influent Pump #2 1 24 7 52 8,760 56.44 Influent Pumps 2 150 0
Controlled Diversion Pumps 2 60 0
Preliminary Treatment Mechanical Bar Screens 2 5 2 6 7 52 4,380 2.20
Reading taken from pump #1; pump #2 was not Primary Treatment Primary Sludge Pumps #1 and #2 2 7.5 1 24 7 52 8,760 3.50 operational
Primary Sludge Pump #3 1 10 1 24 7 52 8,760 5.60
Air Blowers 1 - 4 4 125 2 Air Blower #1 1 24 7 52 8,760 82.64 Air Blower #2 1 24 7 52 8,760 84.43 Secondary Treatment
Return Sludge Pumps 1 - 5 5 20 2 RAS Pump #2 1 24 7 52 8,760 12.86 RAS Pump #5 1 24 7 52 8,760 9.55
H.V. #1 1 7.5 1 24 7 52 8,760 H.V. #3 1 20 1 24 7 52 8,760 13.30 H.V. #4 1 7.5 1 24 7 52 8,760 4.10 H.V. #5 1 15 1 24 7 52 8,760 7.10 H.V. #8 1 7.5 1 24 7 52 8,760
Exhaust Fan #1 1 5 1 6 7 52 2,190 On/Off 24 Exhaust Fan #3 1 5 1 6 7 52 2,190 4.50 On/Off 24 Exhaust Fan #5 1 5 1 6 7 52 2,190 4.60 On/Off 24 Exhaust Fan #10 1 5 1 6 7 52 2,190 On/Off 24 Exhaust Fan #11 1 5 1 6 7 52 On/Off 24 Exhaust Fan #12 1 5 1 6 7 52 2,190 3.30 On/Off 24 Exhaust Fan #19 1 7.5 1 6 7 52 On/Off 24
Heating, Ventilation, and Air Exhaust Fan #26 1 15 1 6 7 52 2,190 11.10 On/Off 24
Conditioning H.R. Circulation Pump #5 1 5 1 24 7 26 4,380 Half Year H.R. Circulation Pump #9 1 10 1 24 7 26 4,380 7.40 Half Year H.R. Circulation Pump #11 1 5 1 24 7 26 Half Year H.R. Circulation Pump #13 1 7.5 1 24 7 26 Half Year H.R. Circulation Pump #16 1 7.5 1 24 7 26 Half Year
Reading taken from pump #2 ; pump #1 was not Main H.W. Circulation Pump #1 and # 2 2 15 1 24 7 52 8,760 12.50 operational
H.W. Circulation Pump #20 1 5 1 24 7 52 8,760 3.60
Reading taken from #1 boiler; #2 boiler not Boiler #1 and #2 2 7.5 1 24 7 26 4,380 6.30 operational; #2 out of service. Operated Half Yearly
Main H.W. Circulation Pump #3 1 7.5 1 24 7 16 2,688 6.50 Only operational during summer months
Reading taken from #3 pump; pump #4, and #5 not Digester Gas Co-Generators H.W. Circulation Pump # 3, #4, and #5 3 5 2 24 7 52 17,520 3.00 operational
Reading taken from #2 pump; pump #1 was not Heat Exchange Pumps #1 and #2 2 20 1 24 7 52 8,760 8.00 operational
Septage Pumps #1 and #2 2 20 1 1 5 52 261 16.40 1 hour per day for 5 days per week Reading taken from #1 pump; pump #2 and #3 not
Digester Sludge Pumps #1, #2, and #3 3 7.5 1 8 7 52 2,920 2.20 operational. Thickened Sludge Pumps 3 7.5 2 6 7 52 4,380 4.70 Thickener Makeup Pumps 2 20 1 1 26 26 14.70 1 hour every two weeks
Reading taken from compressor #1; compressor #2 Solids Handling Mixing Compresser #1 and #2 2 40 1 8 7 52 2,920 26.70 was not operational.
Reading taken from mixer #1; mixer #2 was not Septage Mixers #1 and #2 2 10 1 1 5 52 261 6.50 operational. #1- 1 hour per day for 5 days per week.
Belt Filter Press 1 7.5 1 8 5 52 2,086 7.67 Primary Scum Box Mixer 1 7.5 1 1 26 26 6.10 1 hour every two weeks
Wash Water Booster Pump 1 7.5 1 6 7 52 2,190 4.80 Reading taken from pump #1; pump #2 was not
Circulation Pump #1and #2 2 20 1 24 7 52 8,760 12.80 operational
24/7 all year long; one in operation; the other not in Plant Water Effluent Water Pumps #1 and #2 2 25 1 24 7 52 8,760 12.50 operation
Reading taken from sump pump #8; reading also Miscellaneous Sump Pumps 8 5 8 1 7 52 2,920 3.80 taken from #7 = 4.1 kW (On/Off 24)
Estimated Cost per kWh for 2003 $ 0.093
Monitored with continuous submeters Could not access during site visit Not in Operation Out of Service Could not locate motor during walk-through Operational only during summer months - 16 weeks Reading taken from Sump Pump # 8
F:\Projects\2255063\Technical\Ithaca\Ithaca_Instantaneous_Submetering\Table 3-2 1/17/2006

New York State Energy Research and Development Authority Municipal Wastewater Treatment Plant Energy Evaluation
Ithaca Area Wastewater Treatment Facility
Table 3-3 Estimates of Electric Usage and Costs
Process Component Quantity Rated
hp
No. of Units Typically in Operation
Estimated Annual Operating Hours
Measured Power Draw
(kw)
Estimated Annual Usage
(kWh) Cost ($) Notes
Influent Pumps 3 100 2
Influent Pump #1 1 1,919 67.15 128,845 $11,919
Influent pump #1 operated only during wet weather. Operating hours projected to one year from the operating hours during the submetering period.
Influent Pump #2 1 8,760 56.44 494,426 $45,736 Influent Pumps 2 150 0
Controlled Diversion Pumps 2 60 0
Preliminary Treatment Mechanical Bar Screens 2 5 2 4,380 2.20 9,636 $891
Primary Sludge Pumps #1 and #2 2 7.5 1 8,760 3.50 30,660 $2,836 Reading taken from pump #1; pump #2 was not operational
Primary Sludge Pump #3 1 10 1 8,760 5.60 49,056 $4,538
Air Blowers 1 - 4 4 125 2 Air Blower #1 1 8,760 82.64 723,963 $66,969 Air Blower #2 1 8,760 84.43 739,582 $68,414
Return Sludge Pumps 1 - 5 5 20 2 RAS Pump #2 1 8,760 12.86 112,685 $10,424 RAS Pump #5 1 8,760 9.55 83,639 $7,737
H.V. #1 1 7.5 1 8,760 H.V. #3 1 20 1 8,760 13.30 116,508 $10,777 H.V. #4 1 7.5 1 8,760 4.10 35,916 $3,322 H.V. #5 1 15 1 8,760 7.10 62,196 $5,753 H.V. #8 1 7.5 1 8,760
Exhaust Fan #1 1 5 1 2,190 $0 On/Off 24 Exhaust Fan #3 1 5 1 2,190 4.50 9,855 $912 On/Off 24 Exhaust Fan #5 1 5 1 2,190 4.60 10,074 $932 On/Off 24 Exhaust Fan #10 1 5 1 2,190 $0 On/Off 24 Exhaust Fan #11 1 5 1 On/Off 24 Exhaust Fan #12 1 5 1 2,190 3.30 7,227 $669 On/Off 24 Exhaust Fan #19 1 7.5 1 On/Off 24 Exhaust Fan #26 1 15 1 2,190 11.10 24,309 $2,249 On/Off 24
H.R. Circulation Pump #5 1 5 1 4,380 $0 Half Year H.R. Circulation Pump #9 1 10 1 4,380 7.40 32,410 $2,998 Half Year H.R. Circulation Pump #11 1 5 1 Half Year H.R. Circulation Pump #13 1 7.5 1 Half Year H.R. Circulation Pump #16 1 7.5 1 Half Year
Main H.W. Circulation Pump #1and #2 2 15 1 8,760 12.50 109,500 $10,129 Reading taken from pump #2 ; pump #1 was not operational
H.W. Circulation Pump #20 1 5 1 8,760 3.60 31,536 $2,917
Boiler #1and #2 2 7.5 1 4,380 6.30 27,592 $2,552
Reading taken from #1 boiler; #2 boiler not operational; #2 out of service. Operated Half Yearly
Main H.W. Circulation Pump #3 1 7.5 1 2,688 6.50 17,472 $1,616 Only operational during summer months
Digester Gas Co-Generators H.W. Circulation Pump #3, #4, and #5 3 5 2 17,520 3.00 52,560 $4,862
Reading taken from #3 pump; pump #4, and #5 not operational
Heat Exchange Pumps #1and #2 2 20 1 8,760 8.00 70,080 $6,483 Reading taken from #2 pump; pump #1 was not operational
Septage Pumps #1and #2 2 20 1 261 16.40 4,276 $396 1 hour per day for 5 days per week
Digester Sludge Pumps #1, #2, #3 3 7.5 1 2,920 2.20 6,424 $594 Reading taken from #1 pump; pump #2, and #3 not operational.
Thickened Sludge Pump 3 7.5 2 4,380 4.70 20,586 $1,904 Thickener Makeup Pumps 2 20 1 26 14.70 383 $35 1 hour every two weeks
Mixing Compresser #1and #2 2 40 1 2,920 26.70 77,964 $7,212 Reading taken from compressor #1; compressor #2 was not operational.
Septage Mixers #1and #2 2 10 1 261 6.50 1,695 $157
Reading taken from mixer #1; mixer #2 was not operational. #1- 1 hour per day for 5 days per week.
Belt Filter Press 1 7.5 1 2,086 7.67 15,999 $1,480 Primary Scum Box Mixer 1 7.5 1 26 6.10 159 $15 1 hour every two weeks
Wash Water Booster Pump 1 7.5 1 2,190 4.80 10,512 $972
Circulation Pump #1and #2 2 20 1 8,760 12.80 112,128 $10,372 Reading taken from pump #1; pump #2 was not operational
Plant Water Effluent Water Pumps #1and #2 2 25 1 8,760 12.50 109,500 $10,129
24/7 all year long; one in operation; the other not in operation
Miscellaneous Sump Pumps 8 5 8 2,920 3.80 11,096 $1,026
Reading taken from sump pump #8; reading also taken from #7 = 4.1 kW (On/Off 24)
Estimated Cost per kWh for 2003 0.093$ Total 3,350,452 $309,930
Monitored with continuous submeters Could not access during site visit Not in Operation Out of Service Could not locate motor during walk-through Reading taken from Sump Pump #8
Secondary Treatment
Solids Handling
Heating, Ventilation, and Air Conditioning
Wastewater Pumping
Primary Treatment
F:\Projects\2255063\Technical\Ithaca\Ithaca_Instantaneous_Submetering\Table 3-3 1/17/2006

3.5 SUMMARY OF ENTIRE SUBMETERING PROGRAM
TABLE 3-4 shows the electric energy usage and costs and the corresponding percentages of total electric
energy usage for the metered major equipment and processes at the IAWWTF.
Table 3-4: Summary of Major Equipment Total Estimated Electric Energy Usage and Costs at the IAWWTF
Equipment Electric Energy Usage (kWh)1 Cost Percentage of
Total Usage Influent Pumps 623,271 $57,655 18.2% Mechanical Bar Screens 9,636 $891 0.3% Primary Sludge Pumps 79,716 $7,374 2.3% Aeration Blowers 1,463,545 $135,383 42.7% Return Activated Sludge Pumps 196,325 $18,161 5.7% Heat Exchange Pumps 70,080 $6,483 2.1% Septage Pumps 4,276 $396 0.1% Effluent Water Pumps 1, 2 109,500 $10,129 3.2% Digester Sludge Pumps 6,424 $594 0.2% Thickened Sludge Pumps 20,586 $1,904 0.6% Thickener Make-up Pumps 383 $35 0.01% Mixing Compressors 77,964 $7,212 2.3% Septage Mixers 1,695 $157 0.05% Belt Filter Press 15,999 $1,480 0.5% Primary Scum Box Mixer 159 $15 0.01% Wash Water Booster Pump 10,512 $972 0.3% Circulation Pumps 1,2 112,128 $10,372 3.3% Heating/Ventilation 484,597 $44,827 14.1% Misc. – Sump Pumps 11,096 $1,026 0.3% Circulation Pumps 3, 4, 5 52,560 $4,862 1.5% Total Submetered Usage 3,350,452 $309,928 NA2
Estimated Co-Generator Electric Energy Production 1,022,000 $94,539 NA2
2003 Total Billed Usage (kWh) 2,404,800 $220,876 NA2
Total Estimated Annual Usage 3,426,800 $315,415 100% Other3
76,348 $5,485 2.23%
Notes: 1. Power usage based on both instantaneous and continuous (for those pieces of equipment continuously metered) measurements. 2. NA – Not applicable . 3. “Other” electric energy usage represents electric energy usage by equipment with motors le ss than 5 hp. It is estimated as:
Other = Total Estimated Annual Usage – Total Submetered Usage. The Total Estimated Annual Usage is estimated as:
Total Estimated Annual Usage = Estimated Co-Generator Electric Energy Production + 2003 Total Billed Usage
From the table, it is apparent that the largest “identified” users of electric energy at the plant are the
aeration system blowers, influent pumps, heating and ventilation, RAS pumps, and effluent water pumps.
The total energy usage for the submetered equipment was estimated as a sum of energy usages for each
2255-063 3-6 Ithaca Area Wastewater Treatment Facility NYSERDA Submetering City of Ithaca

piece of equipment that was submetered. The co-generators produce a portion of the electric energy used
by the plant equipment, which is not accounted for in the billed electric energy usage and costs. Therefore,
the estimated co-generator electric energy production was added to the 2003 total billed electric energy
usage and then compared to the total submetered electric energy usage. The total submetered annual usage
from TABLE 3-3 was then subtracted from the net annual electric energy usage to estimate the “Other”
usage. Approximately 2.23% of the total usage is accounted for as “Other” which would involve other
plant equipment with electric motors less than 5 hp that were not included as part of this submetering
program.
FIGURE 3-6 shows the distribution of estimated electric energy usage among the major processes at the
plant. Equipment was grouped into processes as follows:
• Wastewater Pumping - Influent pumps only.
• Preliminary Treatment - Mechanical bar screens.
• Secondary Treatment - Aeration blowers and return sludge pumps.
• Digester Gas Co-generator - Hot water circulation pumps.
• Solids Handling - Heat exchange pumps, septage pumps, primary sludge pumps, digester sludge
pumps, thickened sludge pumps, thickener make-up pumps, mixing compressors, septage mixers,
belt press, primary scum box mixer, wash water booster pump, and circulation pumps.
• Heating/Ventilation - Boilers, hot water and cold water circulation pumps, chiller fans, and
exhaust fans.
• Plant Water - Effluent water pumps.
• Sumps
• Other
The secondary treatment process consumes the most electric energy at the IAWWTF. It is estimated that
approximately 0.88 kWh of electric energy is consumed per pound of BOD5 removed in the secondary
process.
The distribution of estimated electric energy usage in the solids handling process is shown on FIGURE 3-7.
The solids handling equipment was categorized as follows:
• Pumping and mixing - Septage pumps and septage mixers, primary sludge pumps, and primary
scum box mixer.
• Thickening - Thickened sludge pumps and thickener make-up pumps.
2255-063 3-7 Ithaca Area Wastewater Treatment Facility NYSERDA Submetering City of Ithaca

12.79% 3.13%
80.13%
3.95%
Pumping & Mixing
Thickening
Digestion
Dewatering
NYSERDA MUNICIPAL WASTEWATER TREATMENT PLANT ENERGY EVALUATION ITHACA AREA WASTEWATER TREATMENT FACILITY
FIGURE 3-7 DISTRIBUTION OF ELECTRIC
ENERGY USAGE AMONG SOLIDS HANDLING PROCESSES
F:\Projects\2255063\Technical\Ithaca\data\Ithaca_Instantaneous_Submetering\Figure 3-7 1/17/2006

• Digestion - Digester sludge pumps, heat exchanger pumps, mixing compressors, and circulation
pump.
• Dewatering - Belt filter press and wash water booster pump.
The digestion portion consumes the majority of the electric energy in the solids handling processes.
2255-063 3-8 Ithaca Area Wastewater Treatment Facility NYSERDA Submetering City of Ithaca
Section 4
PROCESS PERFORMANCE DURING SUBMETERING
In conjunction with the continuous submetering program, daily process data were collected for both the wet
stream and solids handling processes. These data were compared with historical plant data to determine if
plant operation during submetering and corresponding energy usage could be considered typical for the
Ithaca Area Wastewater Treatment Facility (IAWWTF).
4.1 SUMMARY OF PROCESS PERFORMANCE PARAMETER MONITORING
For the duration of the submetering program, the following daily process performance data were collected:
• Average, minimum, and maximum daily flow.
• Influent, primary effluent and plant effluent biochemical oxygen demand (BOD5) (two days per
week).
• Influent, primary effluent and plant effluent total suspended solids (TSS) (two days per week).
• Return activated sludge (RAS) flow rate and suspended solids.
• Waste activated sludge (WAS) flow rate and suspended solids.
• Mixed liquor suspended solids (MLSS).
• Primary sludge quantities.
• Digester feed sludge quantities and total volatile solids percentage.
• Digested sludge quantities and total volatile solids percentage.
• Digester gas production.
FIGURE 4-1 shows the influent, primary effluent, and effluent BOD5 concentrations during the course of
the submetering program. BOD5 is measured two days per week. BOD5 concentrations do not appear to
correlate with plant flow. FIGURE 4-2 shows the relationship between BOD5 loading and plant flow. The
data do not appear to show any correlation between flow and influent BOD5 loading.
FIGURES 4-3 and 4-4 show the TSS concentrations and loadings for the influent, primary effluent, and
plant effluent flows. TSS concentrations and loadings do not appear to have any correlation with flow
during the submetering period.
The RAS flow rate was maintained at an average of 4.1 million gallons per day (MGD). Approximately
5.4% of the total activated sludge was wasted as WAS, at an average flow rate of 0.2 MGD.
2255-063 4-1 Ithaca AreaWastewater Treatment Facility NYSERDA Submetering City of Ithaca

0
4,000
8,000
12,000
16,000
20,000
BO
D5
(lb
/d)
Mon
,09/
13/0
4
Wed
,09/
15/0
4
Fri,
09/1
7/04
Sun
,09/
19/0
4
Tue
,09/
21/0
4
Thu
,09/
23/0
4
Sat
,09/
25/0
4
Mon
,09/
27/0
4
Wed
,09/
29/0
4
Fri,
10/0
1/04
Sun
,10/
03/0
4
Tue
,10/
05/0
4
Thu
,10/
07/0
4
Sat
,10/
09/0
4
Mon
,10/
11/0
4
Wed
,10/
13/0
4
Fri,
10/1
5/04
Sun
,10/
17/0
4
Tue
,10/
19/0
4
Thu
,10/
21/0
4
Sat
,10/
23/0
4
Mon
,10/
25/0
4
Wed
,10/
27/0
4
Fri,
10/2
9/04
Sun
,10/
31/0
4
0
5
10
15
20
25
30
Ave
rag
e P
lan
t F
low
(M
GD
)
Influent BOD5 Loading (lb/d)
Primary Effluent BOD5 Loading (lb/d)
Effluent BOD5 Loading (lb/d)
Plant Flow (MGD)
Average Plant Flow - 7.8 MGD Average Influent BOD5 Loading - 10,651 lb/d Average Primary Effluent BOD5 Loading - 6,665 lb/d Average Effluent BOD5 Loading - 997 lb/d
NYSERDA MUNICIPAL WASTEWATER TREATMENT PLANT ENERGY EVALUATION ITHACA AREA WASTEWATER TREATMENT FACILITY
FIGURE 4-2 SUBMETERING - BOD5 LOADING
vs PLANT FLOW
F:\Projects\2255063\Technical\Ithaca\data\Ithaca_Process Performance\Figure 4-2 1/17/2006

0
50
100
150
200
250
300
TS
S (
mg
/L)
Mon
,09/
13/0
4
Wed
,09/
15/0
4
Fri,
09/1
7/04
Sun
,09/
19/0
4
Tue
,09/
21/0
4
Thu
,09/
23/0
4
Sat
,09/
25/0
4
Mon
,09/
27/0
4
Wed
,09/
29/0
4
Fri,
10/0
1/04
Sun
,10/
03/0
4
Tue
,10/
05/0
4
Thu
,10/
07/0
4
Sat
,10/
09/0
4
Mon
,10/
11/0
4
Wed
,10/
13/0
4
Fri,
10/1
5/04
Sun
,10/
17/0
4
Tue
,10/
19/0
4
Thu
,10/
21/0
4
Sat
,10/
23/0
4
Mon
,10/
25/0
4
Wed
,10/
27/0
4
Fri,
10/2
9/04
Sun
,10/
31/0
4
0
5
10
15
20
25
30
Ave
rag
e P
lan
t F
low
(M
GD
)
Influent TSS (mg/L) Primary Effluent TSS (mg/L) Effluent TSS (mg/L) Plant Flow (MGD)
Average Plant Flow - 7.8 MGD Average Influent TSS - 162 mg/L Average Primary Effluent TSS - 110 mg/L Average Effluent TSS - 2 mg/L
NYSERDA MUNICIPAL WASTEWATER TREATMENT PLANT ENERGY EVALUATION ITHACA AREA WASTEWATER TREATMENT FACILITY
FIGURE 4-3 SUBMETERING - TSS vs PLANT
FLOW
F:\Projects\2255063\Technical\Ithaca\data\Ithaca_Process Performance\Figure 4-3 1/17/2006

30 20,000
Influent TSS Loading (lb/d) Primary Effluent TSS Loading (lb/d) Effluent TSS Loading (lb/d) Plant Flow (MGD)
Average Plant Flow - 7.8 MGD Average Influent TSS Loading - 9,978 lb/d Average Primary Effluent TSS Loading - 6,752 lb/d Average Effluent TSS Loading - 122 lb/d
18,000
16,000
14,000
12,000
10,000
8,000
6,000
4,000
2,000
0
25
20
15
10
5
0
Ave
rag
e P
lan
t F
low
(M
GD
)
TS
S (
lb/d
)
Mon
,09/
13/0
4
Wed
,09/
15/0
4
Fri,
09/1
7/04
Sun
,09/
19/0
4
Tue
,09/
21/0
4
Thu
,09/
23/0
4
Sat
,09/
25/0
4
Mon
,09/
27/0
4
Wed
,09/
29/0
4
Fri,
10/0
1/04
Sun
,10/
03/0
4
Tue
,10/
05/0
4
Thu
,10/
07/0
4
Sat
,10/
09/0
4
Mon
,10/
11/0
4
Wed
,10/
13/0
4
Fri,
10/1
5/04
Sun
,10/
17/0
4
Tue
,10/
19/0
4
Thu
,10/
21/0
4
Sat
,10/
23/0
4
Mon
,10/
25/0
4
Wed
,10/
27/0
4
Fri,
10/2
9/04
Sun
,10/
31/0
4
FIGURE 4-4 SUBMETERING - TSS LOADING
vs PLANT FLOW NYSERDA MUNICIPAL WASTEWATER TREATMENT PLANT ENERGY EVALUATION
ITHACA AREA WASTEWATER TREATMENT FACILITY
F:\Projects\2255063\Technical\Ithaca\data\Ithaca_Process Performance\Figure 4-4 1/17/2006

TABLE 4-1 summarizes the process data collected during the submetering period. These parameters were
compared to historical values. It can be seen in TABLE 4-1 that the averages from the submetering period
are comparable with the historical averages for all parameters. Due to seasonal variations (mostly due to
Cornell University’s schedule), historical peak values are significantly higher than the corresponding peaks
from the submetering period especially for influent BOD5 and TSS loading, RAS suspended solids, and
pumped digested sludge.
Table 4-1: Summary of IAWWTF Performance during the Submetering Period Compared to Historical Data
Parameter Unit Submetering Historical 1
Average Maximum Average Maximum Influent Plant Flow MGD 7.8 17.7 6.8 16.7
Influent BOD5 Concentration mg/L 173 227 186 379 Influent BOD5 Loading lb/d 10,651 12,597 10,366 22,389
Primary Effluent BOD5 Concentration mg/L 109 138 111 175 Primary Effluent BOD5 Loading lb/d 6,665 7,876 6,327 11,595
Effluent BOD5 Concentration mg/L 16.1 22.0 14.4 31 BOD5 Removal % 90.7 93.8 91.8 97.8
Influent TSS Concentration mg/L 162 206 172 688 Influent TSS Loading lb/d 9,978 13,993 9,494 36,359
Primary Effluent Concentration mg/L 110 128 92 229 Primary Effluent Loading lb/d 6,752 8,058 5,192 10,344
Effluent TSS Concentration mg/L 2.0 3.1 2.1 10.2 TSS Removal % 98.8 99.2 98.5 100
WAS Flow MGD 0.22 0.25 0.18 0.33 RAS Flow MGD 4.10 5.45 NA2 NA2
RAS Suspended Solids mg/L 3,621 9,384 3,439 22,440 Septage Percent Solids % 2.5 5.1 2.3 14
Thickened Sludge Percent Solids % 2.8 3.9 3.3 5.9 Pumped Digested Sludge Gpd 34,971 43,880 37,777 111,750
Belt Filter Press Feed Percent Solids % 3.58 3.70 3.39 5.60 Cake Percent Solids % 22.8 24.1 22.0 24.0
Note: 1. Historical data from 2002 and 2003 2. Based on discussions with plant personnel, historical RAS flow was manually controlled such that it was maintained at an average range of 3.5 to 4.0 MGD.
4.2 RELATIONSHIP BETWEEN PLANT PROCESS DATA AND SUBMETERING DATA
4.2.1 Main Influent Wastewater Pumps
Electric energy usage in kilowatt-hours (kWh) for the two pumps with VFDs (one pump operated during
average flow conditions; two pumps operated during high flow conditions) was recorded in 15-minute
intervals during the submetering period (September 15, 2004 to October 31, 2004).
2255-063 4-2 Ithaca AreaWastewater Treatment Facility NYSERDA Submetering City of Ithaca

Total electric energy demand for the influent wastewater pumps is the algebraic sum of the electric energy
demand for the two influent wastewater pumps. FIGURE 4-5 shows a comparison of the average daily
flow and the total electric energy demand by the two influent wastewater pumps during the submetering
period. During this period, flow ranged from approximately 5.6 MGD on October 10, 2004 to a peak of
17.7 MGD on September 17, 2004. FIGURE 4-5 shows a good correlation between total flow and electric
energy demand indicating that the electric energy usage by the influent pumps is dependent upon flow rate,
i.e., the greater the influent flow rate, the greater the pumps’ electric energy usage. Significantly higher
flows were observed due to precipitation on September 17, 2004 (National Weather Service, Binghamton
website) that resulted in greater electric energy demand. As expected, the total amount of electric energy
used by the wastewater pumps is proportional to the influent wastewater flow.
4.2.2 Return Activated Sludge Pumps
The IAWWTF has five RAS pumps, all of which have VFDs. Two pumps are typically in operation; hence
continuous submeters were installed on two pumps with VFDs. The use of VFDs allows pumps to operate
at their most efficient points. Energy usage in kilowatt-hours for two pumps (with VFDs) was recorded
during the submetering period (September 15, 2004 to October 31, 2004).
During the submetering period, the RAS pumps conveyed an average flow of approximately 4.1 MGD to
the secondary process. FIGURE 4-6 shows a comparison of the RAS flow and electric energy demand by
the RAS pumps during the submetering period. As expected, the data on FIGURE 4-6 show a good
correlation between total RAS flow and electric energy usage indicating that the electric energy usage by
the RAS pumps is dependent upon RAS flow rate.
4.2.3 Aeration Blowers
Secondary treatment consists of four aeration basins, each having a volume of 0.5 MG and a fine bubble
diffuser system. There are four 125-hp centrifugal blowers. The blowers are manually controlled by
adjusting the blower inlets based on readings from the dissolved oxygen (DO) meters. The aeration basins
are operated in plug flow mode. FIGURE 4-7 shows a comparison of the total delivered air flow to the four
aeration tanks and the total electric energy demand of the two aeration blowers. The blower electric energy
demand correlates well with the delivered air flow and both show a slight diurnal variation likely due to
manual blower adjustments by plant staff. FIGURE 4-8 shows a comparison of the DO measured at the
head of each of the four aeration tanks and the delivered air flow. From FIGURE 4-8 it can be seen that the
DO concentrations vary significantly in a diurnal pattern, while the air flow only varies slightly. Bi-hourly
BOD5 samples of the aeration system influent were taken over a two-day period during the submetering
period. FIGURE 4-9 shows a comparison of the DO measured at the head of each of the four aeration
2255-063 4-3 Ithaca AreaWastewater Treatment Facility NYSERDA Submetering City of Ithaca

0
2
4
6
8
10 A
erat
ion
Tan
k D
O (
mg
/L)
2,000
4,000
6,000
8,000
10,000
12,000
BO
D5
Lo
adin
g (
lb/d
)
Tank 1 - DO at Head of Tank (mg/L) Tank 2 - DO at Head of Tank (mg/L) Tank 3 - DO at Head of Tank (mg/L) Tank 4 - DO at Head of Tank (mg/L) Primary Effluent BOD5 Loading (lb/d)
10/1
4/20
04 1
0:48
10/1
4/20
04 1
3:12
10/1
4/20
04 1
5:36
10/1
4/20
04 1
8:00
10/1
4/20
04 2
0:24
10/1
4/20
04 2
2:48
10/1
5/20
04 1
:12
10/1
5/20
04 3
:36
10/1
5/20
04 6
:00
10/1
5/20
04 8
:24
10/1
5/20
04 1
0:48
10/1
5/20
04 1
3:12
10/1
5/20
04 1
5:36
10/1
5/20
04 1
8:00
10/1
5/20
04 2
0:24
10/1
5/20
04 2
2:48
10/1
6/20
04 1
:12
10/1
6/20
04 3
:36
10/1
6/20
04 6
:00
10/1
6/20
04 8
:24
FIGURE 4-9 AERATION TANK DISSOLVED
OXYGEN vs PRIMARY EFFLUENT BOD5 LOADING
NYSERDA MUNICIPAL WASTEWATER TREATMENT PLANT ENERGY EVALUATION ITHACA AREA WASTEWATER TREATMENT FACILITY
F:\Projects\2255063\Technical\Ithaca\data\Ithaca_Process Performance\Figure 4-9 1/17/2006

tanks and the primary effluent BOD5 loading for the two-day period during submetering while FIGURE 4
10 compares the DO concentrations and delivered air flow for the same two -day period. From FIGURES
4-9 and 4-10, it is seen that the measured DO increases as the primary effluent BOD5 decreases particularly
during the night, while the air flow rate delivered remains relatively consistent. Because the blower
operation is only adjusted during the day (when the plant is staffed), the increased DO concentration are
likely a result of the lower BOD5 and corresponding lower oxygen demands observed at night when blower
operation is unmodified.
4.2.4 Solids Handling
The following equipment and processes are associated with the solids handling at the IAWWTF:
• Thickening
• Digestion
• Dewatering
• Disposal
Primary and secondary sludge is blended and pumped to two gravity thickeners. Percent solids in the
thickened sludge averaged approximately 2.8% during the submetering period. The thickened sludge is
then pumped to two digesters, and the average pumping rate was 49,140 gallons per day (gpd) during
submetering. An average of 25,400 gpd of septage was pumped into the digester during the submetering
period at an average percent solids of 2.5%. This average is based only on days when septage is received.
The digested sludge is pumped to the belt filter press. The belt filter press was continuously submetered to
identify actual operating times for the equipment. FIGURE 4-11 shows a comparison of the electric energy
demand and the percent solids in and out of the belt filter press. It can be seen from FIGURE 4-11 that the
belt filter press normally operates on weekdays (Monday through Friday) for about 8 hours a day (7AM to
3 PM). Digested sludge going into the belt filter press had an average percent solids of 3.6% during the
submetering period. Percent solids in the sludge cake leaving the belt filter press averaged 22.8% during
the submetering period. The solids percentages are typical numbers at the plant based on historical data.
FIGURE 4-12 compares belt press electric energy demand to belt press influent solids loading. As
expected, the belt filter press operates at relatively constant rate and the belt filter press electric demand is
not influenced by the solids loading.
4.2.5 Digester Gas Co-Generator
Digester gas is typically used to run two 110-kW capacity generators and also to supply a boiler for plant
heat. Both co-generators were continuously submetered; however, typically only one co-generator is
2255-063 4-4 Ithaca AreaWastewater Treatment Facility NYSERDA Submetering City of Ithaca
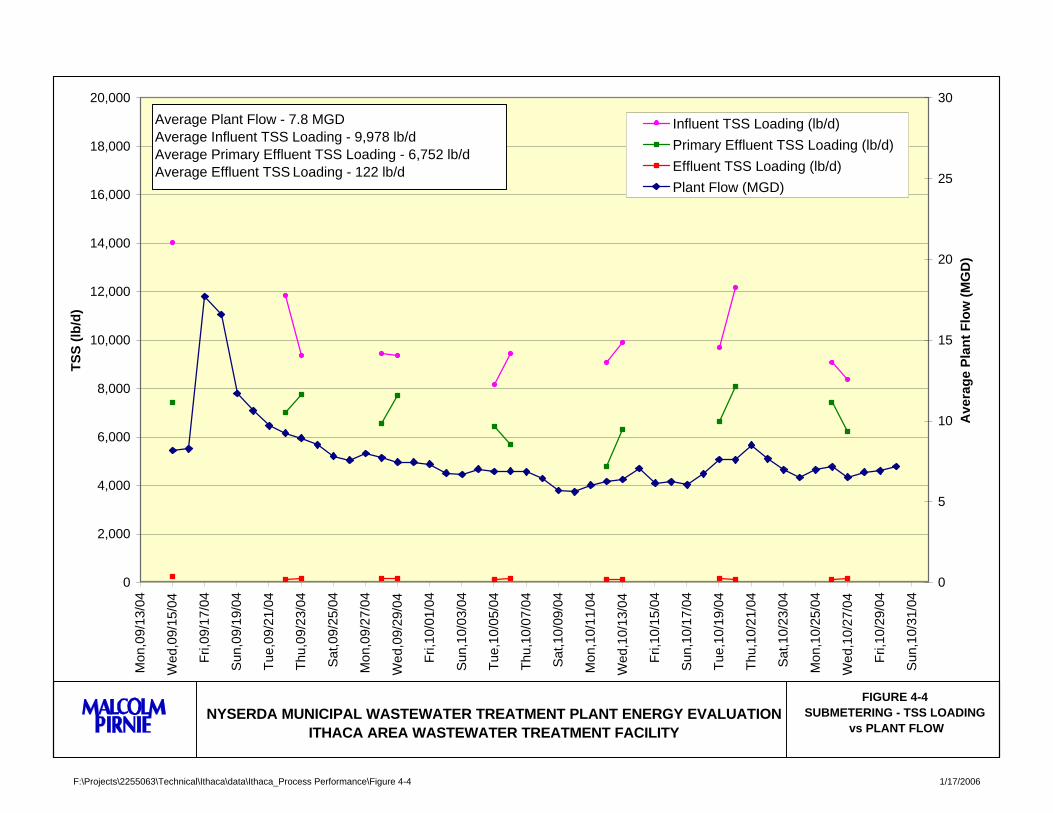
10 4,000
Tank 1 - DO at Head of Tank (mg/L) Tank 2 - DO at Head of Tank (mg/L) Tank 3 - DO at Head of Tank (mg/L) Tank 4 - DO at Head of Tank (mg/L) Delivered Air Flow (SCFM)
8
6
4
2
0
3,950
3,900
3,850
3,800
3,750
3,700
3,650
3,600
3,550
3,500
Aer
atio
n T
ank
DO
(m
g/L
)
Del
iver
ed A
ir F
low
(SC
FM
)
10/1
4/20
04 1
0:48
10/1
4/20
04 1
3:12
10/1
4/20
04 1
5:36
10/1
4/20
04 1
8:00
10/1
4/20
04 2
0:24
10/1
4/20
04 2
2:48
10/1
5/20
04 1
:12
10/1
5/20
04 3
:36
10/1
5/20
04 6
:00
10/1
5/20
04 8
:24
10/1
5/20
04 1
0:48
10/1
5/20
04 1
3:12
10/1
5/20
04 1
5:36
10/1
5/20
04 1
8:00
10/1
5/20
04 2
0:24
10/1
5/20
04 2
2:48
10/1
6/20
04 1
:12
10/1
6/20
04 3
:36
10/1
6/20
04 6
:00
10/1
6/20
04 8
:24
FIGURE 4-10 AERATION TANK DISSOLVED
OXYGEN vs DELIVERED AIR FLOW NYSERDA MUNICIPAL WASTEWATER TREATMENT PLANT ENERGY EVALUATION
ITHACA AREA WASTEWATER TREATMENT FACILITY
F:\Projects\2255063\Technical\Ithaca\data\Ithaca_Process Performance\Figure 4-10 1/17/2006

Ele
ctri
c D
eman
d (
kW
)
Mon
,09/
13/2
004
Wed
,09/
15/2
004
Fri,
09/1
7/20
04
Sun
,09/
19/2
004
Tue
,09/
21/2
004
Thu
,09/
23/2
004
Sat
,09/
25/2
004
Mon
,09/
27/2
004
Wed
,09/
29/2
004
Fri,
10/0
1/20
04
Sun
,10/
03/2
004
Tue
,10/
05/2
004
Thu
,10/
07/2
004
Sat
,10/
09/2
004
Mon
,10/
11/2
004
Wed
,10/
13/2
004
Fri,
10/1
5/20
04
Sun
,10/
17/2
004
Tue
,10/
19/2
004
Thu
,10/
21/2
004
Sat
,10/
23/2
004
Mon
,10/
25/2
004
Wed
,10/
27/2
004
Fri,
10/2
9/20
04
Sun
,10/
31/2
004
Tue
,11/
02/2
004
8
10
12
Note: Loading data for 10/21/2004 and 10/22/2004 were unavailable.
Electric Demand (kW)
Belt Filter Press Influent Loading (lb/d)
12,000
16,000
6 8,000
2
4
4,000
0 0
FIGURE 4-12 BELT FILTER PRESS LOADING vs TOTALNYSERDA MUNICIPAL WASTEWATER TREATMENT PLANT ENERGY EVALUATION ELECTRIC DEMAND BY BELT FILTER
ITHACA AREA WASTEWATER TREATMENT FACILITY PRESS
Infl
uen
t L
oad
ing
(lb
/d)
F:\Projects\2255063\Technical\Ithaca\data\Ithaca_Process Performance\Figure 4-12 1/17/2006
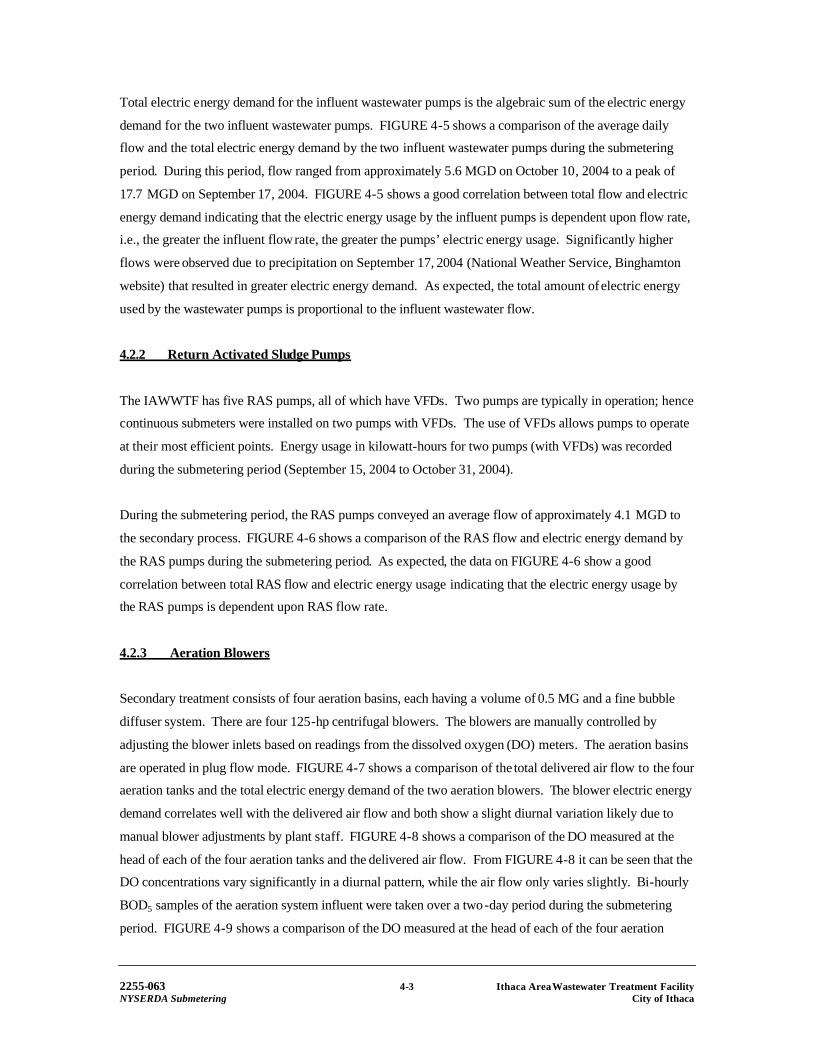
operated. If sufficient methane is available, a second co-generator will be brought online as was the case
during the submetering period. FIGURE 4-13 shows a comparison of the digester gas produced and the
total electric energy produced by the generators during the submetering period. An average of 839 hundred
cubic feet (CCF) per day (equivalent to 503.4 therms assuming a heating value of 600 BTU per cubic foot
of digester gas) of digester gas was produced during the submetering period. FIGURE 4-13 shows that the
second co-generator was taken off-line on October 19, 2004, which is a result of increased digester gas
usage by the boilers (i.e., less digester gas available for use by the co-generators).
4.2.6 Other Equipment
As indicated in Section 3 , other equipment at the plant includes:
• Mechanical Bar Screens
• Lighting
• Exhaust Fans
• Circulation Pumps
• Sumps
For the above mechanical equipment, the small size of the associated motors, the relatively low standard
efficiencies of smaller motors, and/or the low frequency of use have indicated that any further evaluation of
this equipment would most likely not yield significant cost savings.
2255-063 4-5 Ithaca AreaWastewater Treatment Facility NYSERDA Submetering City of Ithaca
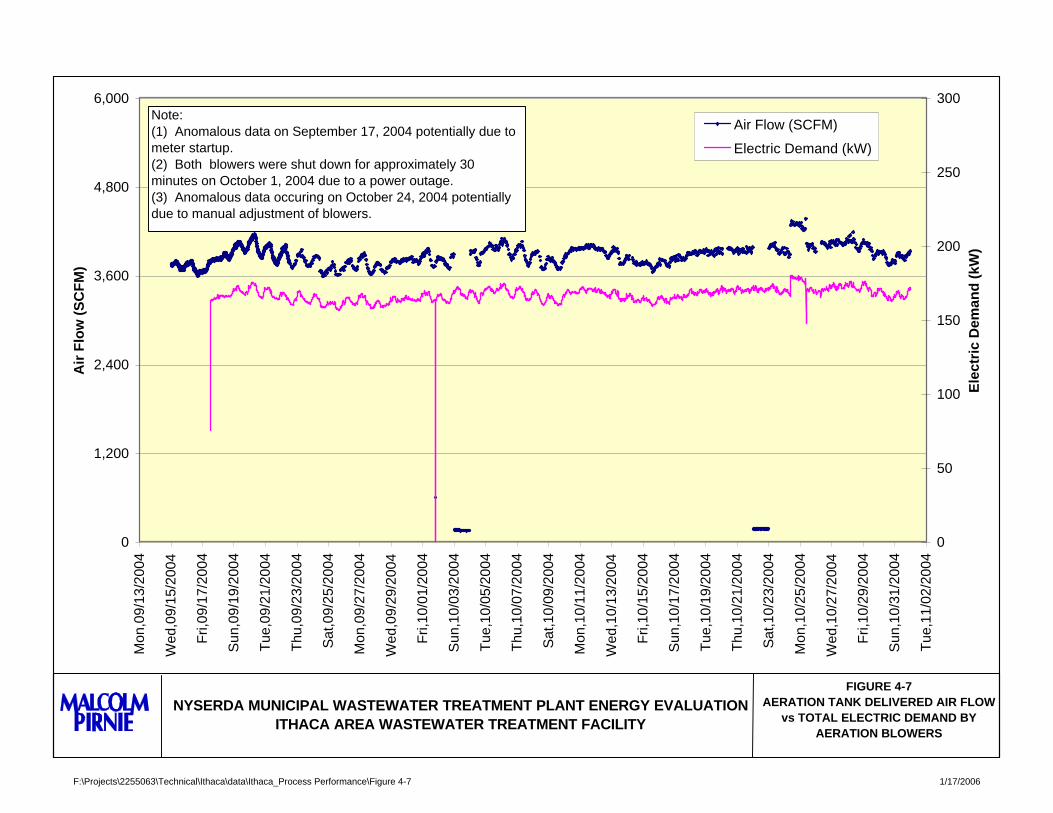
Mon
,09/
13/2
004
Wed
,09/
15/2
004
Fri,
09/1
7/20
04
Sun
,09/
19/2
004
Tue
,09/
21/2
004
Thu
,09/
23/2
004
Sat
,09/
25/2
004
Mon
,09/
27/2
004
Wed
,09/
29/2
004
Fri,
10/0
1/20
04
Sun
,10/
03/2
004
Tue
,10/
05/2
004
Thu
,10/
07/2
004
Sat
,10/
09/2
004
Mon
,10/
11/2
004
Wed
,10/
13/2
004
Fri,
10/1
5/20
04
Sun
,10/
17/2
004
Tue
,10/
19/2
004
Thu
,10/
21/2
004
Sat
,10/
23/2
004
Mon
,10/
25/2
004
Wed
,10/
27/2
004
Fri,
10/2
9/20
04
Sun
,10/
31/2
004
Tue
,11/
02/2
004
Ele
ctri
c E
ner
gy
Pro
du
ctio
n (
kW)
Dig
este
r G
as P
rod
uct
ion
(C
CF
per
day
)
250 Electric Energy Produced (kW)
Total Digester Gas 1,400
1,600
200
1,200
150 1,000
800
100 600
50
Second co-generator taken offline due to increased digester gas usage by the boilers.
200
400
0 0
FIGURE 4-13 TOTAL GAS PRODUCTION vs TOTALNYSERDA MUNICIPAL WASTEWATER TREATMENT PLANT ENERGY EVALUATION ELECTRIC ENERGY PRODUCED BY
ITHACA AREA WASTEWATER TREATMENT FACILITY COGENERATORS
F:\Projects\2255063\Technical\Ithaca\data\Ithaca_Process Performance\Figure 4-13 1/17/2006
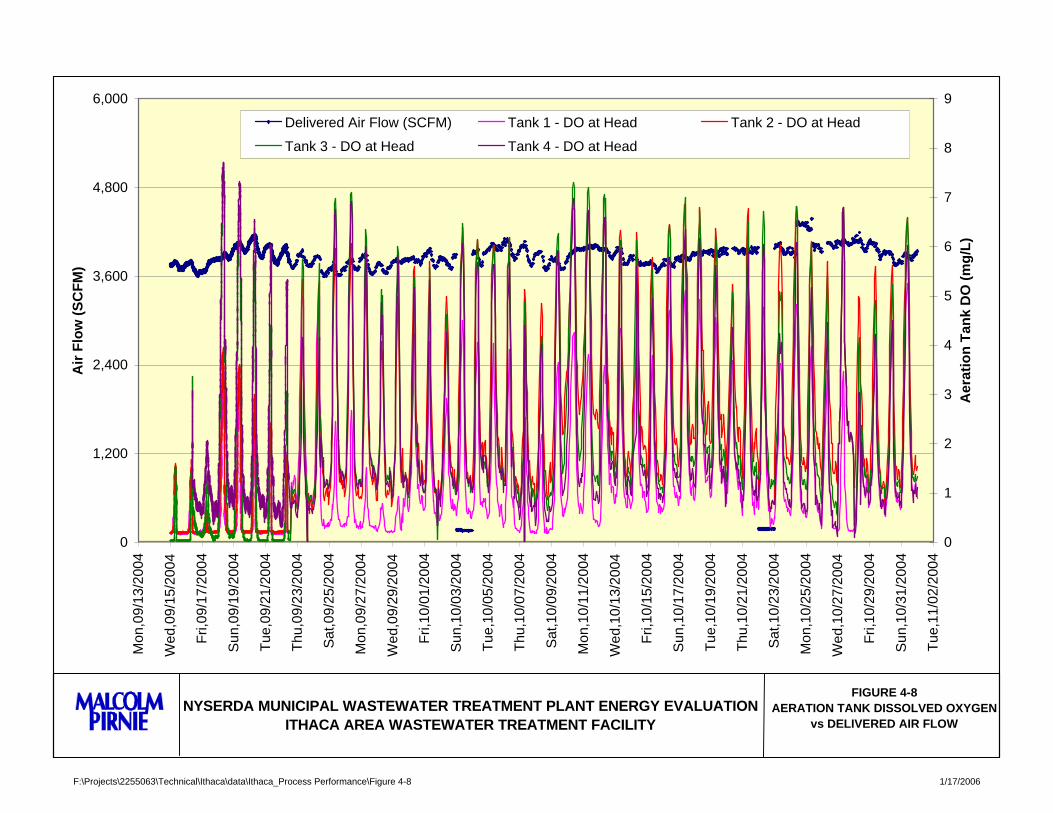
Section 5
ENERGY SAVING MEASURES THROUGH CAPITAL IMPROVEMENTS
5.1 CAPITAL IMPROVEMENT ALTERNATIVES TO REDUCE ENERGY USAGE AND COSTS
Section 4 evaluated the major equipment in use at the Ithaca plant and compared energy usage to process
performance. The detailed process and electric energy usage information collected during the submetering
period was used to identify and evaluate energy conservation opportunities at the Ithaca Area Wastewater
Treatment Facility (IAWWTF). Potential energy saving opportunities are discussed in this section.
5.1.1 Installation of Automatic Controls on the Aeration System Blowers
The IAWWTF currently employs manual control of the centrifugal blowers to adjust the dissolved oxygen
(DO) concentration in the aeration basins. This approach relies on DO readings gathered by DO probes
located within the aeration basins. Based on the results of the initial site visit, replacing the current probes
in the aeration tanks with newer monitoring technologies and providing an automatic control system for
adjusting blower operations based on DO readings could result in potential energy savings. New DO
probes, based on luminescent technology, have already been installed at the head of two of the four aeration
tanks at the plant.
5.1.2 Switching From Ferrous Chloride to Ferric Chloride Use for Phosphorus Removal in the Aeration Basins
Based on discussions with IAWWTF personnel, the plant currently uses ferrous chloride and a target DO
concentration of 6 milligrams per liter (mg/L) to 8 mg/L in their aeration basin to achieve phosphorus
removal. Ferrous is oxidized to ferric in the aeration basin and incurs an oxygen demand for this chemical
reaction. Thus, there may be a potential to reduce the target DO concentration in the basins by switching
to ferric chloride by eliminating this oxygen demand. A cost savings would be associated with this
approach due to reduced electric energy consumption of the aeration system blowers.
5.2 ESTIMATE OF ENERGY USAGE, DEMAND, AND COST SAVINGS
The following section summarizes the estimated energy usage of the described alternatives, as well as
estimates of energy and cost savings associated with the improvements.
2255-063 5-1 Ithaca Area Wastewater Treatme nt Facility NYSERDA Submetering City of Ithaca
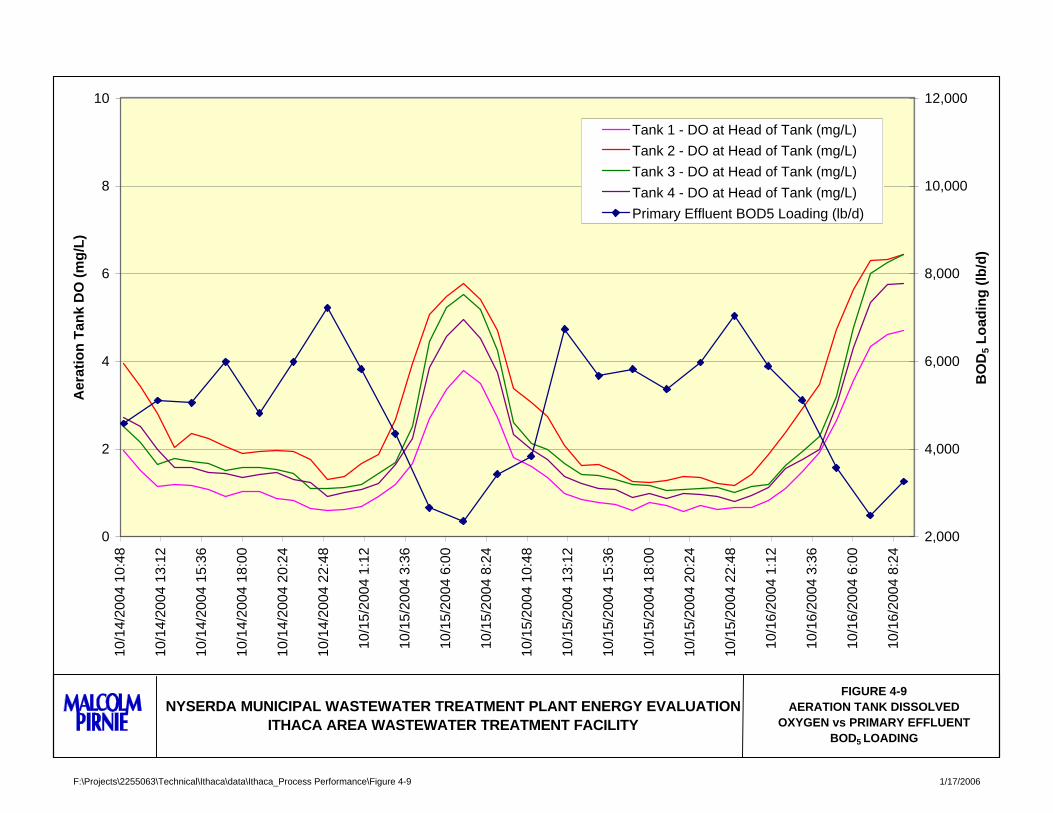
5.2.1 Installation of Automatic Controls on the Aeration System Blowers
In order to estimate the electric energy savings associated with this alternative, a comparison was made
between the electric energy usage for the existing practice of manual adjustment of the aeration blowers
and the projected electric energy usage of the proposed automatic control system. As shown on FIGURE
4-8, the residual DO concentration in the aeration tanks at the plant varies throughout the day. This
variation is most significantly due to the fact that air feed to the tanks is accomplished through manual
control and not adjusted during night time hours when the plant is not staffed and air demand decreases.
Electric energy savings were estimated by assuming that automatic control of air feed to the tanks would
dampen the peaks in residual DO concentrations. Through the use of an automatic control system, a target
residual DO concentration in the aeration tanks could be maintained. The energy savings would be realized
through reduced aeration blower electric energy usage. A residual DO concentration of 1 mg/L at the tail
of the aeration tanks was assumed for the purposes of estimating electric energy savings.
For this evaluation, the existing electric energy usage was estimated by obtaining the aeration blower input
horsepower from the performance curve (FIGURE 5-1) using the average air flow rate recorded during the
submetering period. The average air flow rate during the submetering period was 3,820 standard cubic feet
per minute (scfm), which corresponds to an electric energy demand of 65 kW (87 hp). Assuming a
premium motor efficiency of 94% for the 125-hp centrifugal blowers, this corresponds to an electric energy
demand of 69 kW. In comparison, the average electric energy demand measured during the continuous
submetering data period was 84 kW. The difference between the estimated and submetered electric energy
demand may be attributed to error in air flow measurements and/or the air temperature/density difference
between standard (performance curve) and field (actual measurements) conditions that are not accounted
for in this evaluation. Extrapolating the estimated demand developed from the performance curve (69 kW
– corrected for 94% motor efficiency) to an entire year assuming 24 hours per day/seven days per week
operation, corresponds to an estimated electric energy usage of 1,208,880 kWh per year. By comparison,
the electric energy usage based on submetering data is 1,462,857 kWh per year.
To estimate the electric energy savings associated with using an automatic control system, standard oxygen
transfer efficiency equations were used to predict the air flow rate required to achieve a target residual DO
concentration of 1 mg/L. A ratio was then estimated between the air demand for the target DO
concentration and that of each incremental DO reading recorded during the submetering period. The ratio
would indicate the additional air demand needed for DO concentrations in the data set below the target
point of 1 mg/L, as well as the magnitude of air demand reduction for DO concentrations above the target
point. These ratios were applied to the recorded air flow rate to determine the predicted air flow rate under
an automatic control system, and an average air flow rate was estimated as 3,060 scfm. Through the use of
the aeration blower curve, this air flow rate corresponds to electric energy demand of 56 kW (75 hp).
2255-063 5-2 Ithaca Area Wastewater Treatme nt Facility NYSERDA Submetering City of Ithaca
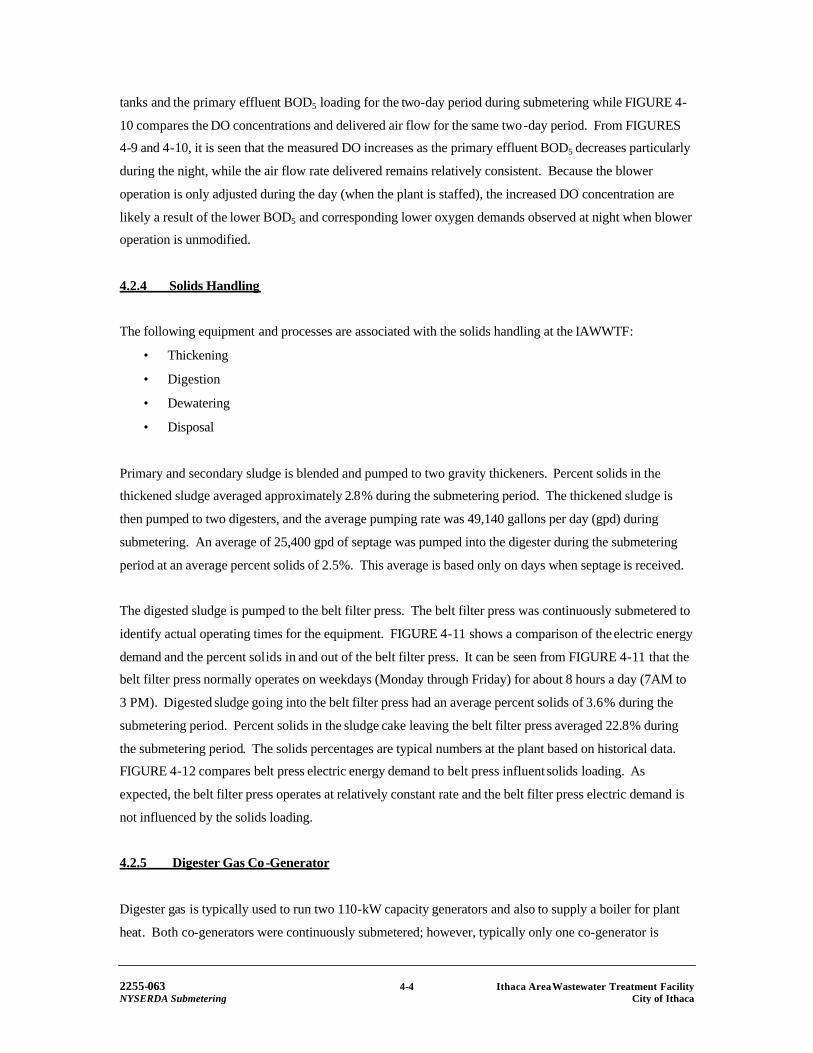
F:\Projects\2255063\Draft Documents\Report\Ithaca\Ithaca Flow Scheme 03/18/2005
FIGURE 5-1 Aeration Blower
Performance Curve
NYSERDA MUNICIPAL WASTEWATER TREATMENT PLANT ENERGY EVALUATION ITHACA AREA WASTEWATER TREATMENT FACILITY

Assuming a premium motor efficiency of 94%, this corresponds to 60 kW. Extrapolating this to an entire
year assuming 24 hours per day/seven days per week operation, this corresponds to an estimated electric
energy usage of 1,051,200 kWh per year with the implementation of an automatic controls system.
The estimated energy savings based on the theoretical blower demand of 69 kW are 157,700 kWh, while
the estimated energy savings based on the submetered blower demand can be as high as 411,700 kWh. For
the purpose of the economic evaluation of the recommended improvements, the theoretical blower energy
demand estimates were used to be consistent with the estimates of the energy demand for the future
proposed conditions (which were also based on the theoretical readings from the blower performance
curve). This approach also results in a more conservative estimate of the projected energy savings. The
blower performance and condition, however, should be further investigated during the implementation of
the proposed improvements. These investigations may assist in improving the blower efficiency and
potentially closing the gap in theoretical and measured energy demand, which may result in additional
energy savings.
Assuming an electric energy billing rate of $0.093 per kWh, this translates to an estimated savings of
$14,700 per year.
5.2.2 Switching From Ferrous Chloride to Ferric Chloride Use for Phosphorus Removal in the Aeration Basins
Determination of cost savings associated with switching to ferric chloride for phosphorus removal involves
estimating the amount of oxygen that is required to oxidize ferrous to ferric under current operations.
Considering the use of ferric chloride would eliminate the need for iron oxidation, the actual cost savings is
represented by the electric energy used by the aeration system air blower to generate this amount of
oxygen.
Approximately 333 pounds per day of ferrous chloride, as iron, are applied to the aeration basins for
phosphorus removal (based on year 2002 and 2003 data). Based on this average chemical usage,
information gathered from the IAWWTF’s chemical supplier (Gulbrandsen Technologies, Clinton, NJ), as
well as known stoichiometric relationships, the estimated amount of oxygen required for oxidation of
ferrous chloride to ferric chloride is 95 pounds per day. This quantity of oxygen is negligible relative to the
overall oxygen demand in the plant’s secondary treatment system, and should not provide any noticeable
electric energy savings for the aeration blowers.
The IAWWTF currently pays approximately $0.28 per pound of ferrous chloride, as iron. A budgetary cost
estimate for ferric chloride, as iron, was obtained for approximately $0.52 per pound. Based on this
budgetary information, switching to ferric chloride would result in increased chemical supply cost.
2255-063 5-3 Ithaca Area Wastewater Treatme nt Facility NYSERDA Submetering City of Ithaca
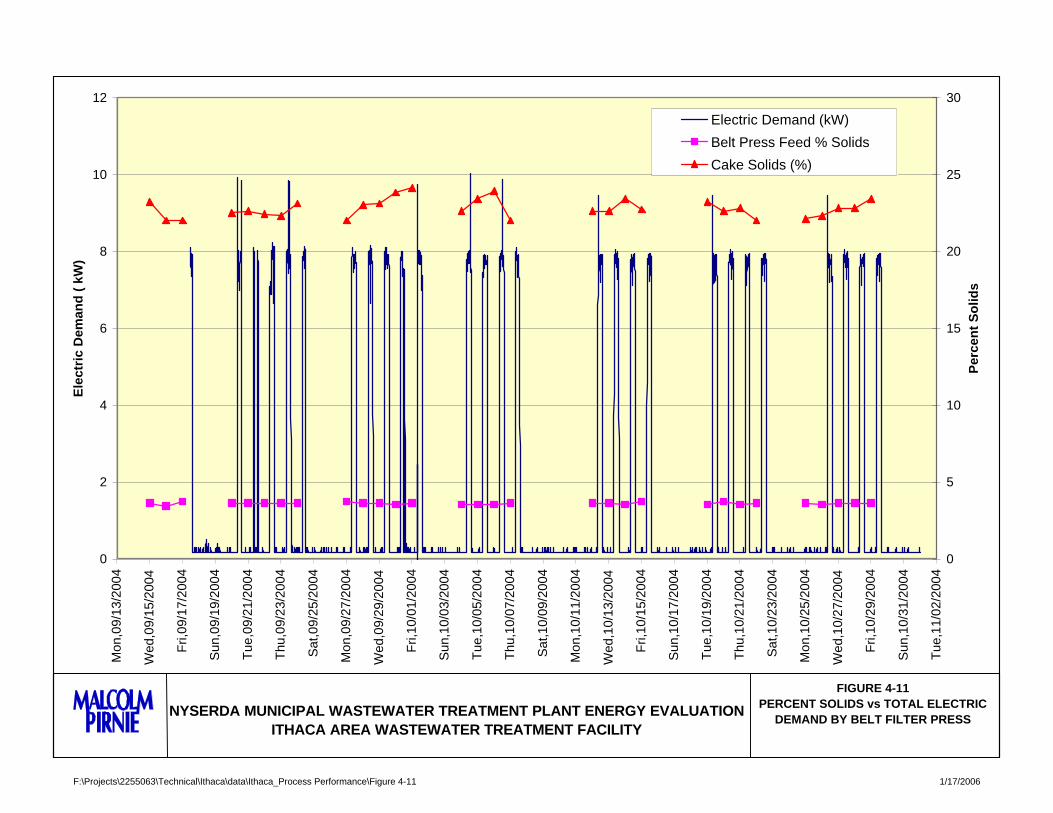
Considering the associated negligible aeration blower electric energy savings cost savings, it is
recommended that the IAWWTF continue use of ferrous chloride for phosphorus removal.
5.3 ESTIMATE OF CAPITAL COSTS AND SIMPLE PAYBACK
5.3.1 Installation of Automatic Controls on the Aeration System Blowers
The estimated capital cost for an automatic control system for the aeration blowers and basins is $14,400
for all four aeration basins (based on manufacturer’s quote with installation, plus 15% contingencies). This
estimate includes installation of two motorized air damper valves, panel controls, and programming costs.
Based on discussions with plant personnel, two of the four aeration tanks have motorized air damper valves
and two do not. Plant personnel also indicated that there is capacity on the existing PLC controller to
accommodate the panel controls associated with the automatic system. Thus, a new controller would not
be necessary. It is assumed that the new DO probes already installed in two of the aeration tanks at the
plant would provide adequate data for automatic control. Additional DO probes would not be necessary.
Based on the estimated savings of $14,700, the payback period would be approximately one year.
Considering the short payback, it is recommended that the IAWWTF implement the automatic control
system measure.
5.3.2 Conversion from Ferrous Chloride to Ferric Chloride Use for Phosphorus Removal in the Aeration Basins
As stated previously, converting to ferric chloride would provide negligible electric energy savings at an
increased chemical costs. Therefore, it is recommended that the IAWWTF continue use of ferrous chloride
for phosphorus removal. Capital costs associated with this measure are not included in this report.
5.4 ADDITIONAL DISCUSSION: PREMIUM EFFICIENCY MOTORS
Based on discussions with plant personnel, all motors for equipment of 5 hp or greater have premium
efficiency motors. These motors were installed when the IAWWTF was constructed in 1986. Therefore,
there is no potential for electric energy savings associated with replacement of standard efficiency motors
with premium efficiency motors.
Evaluation of energy saving measures through capital improvements to the plant’s electric co-generation
facilities are discussed in Section 8 of this report.
2255-063 5-4 Ithaca Area Wastewater Treatme nt Facility NYSERDA Submetering City of Ithaca
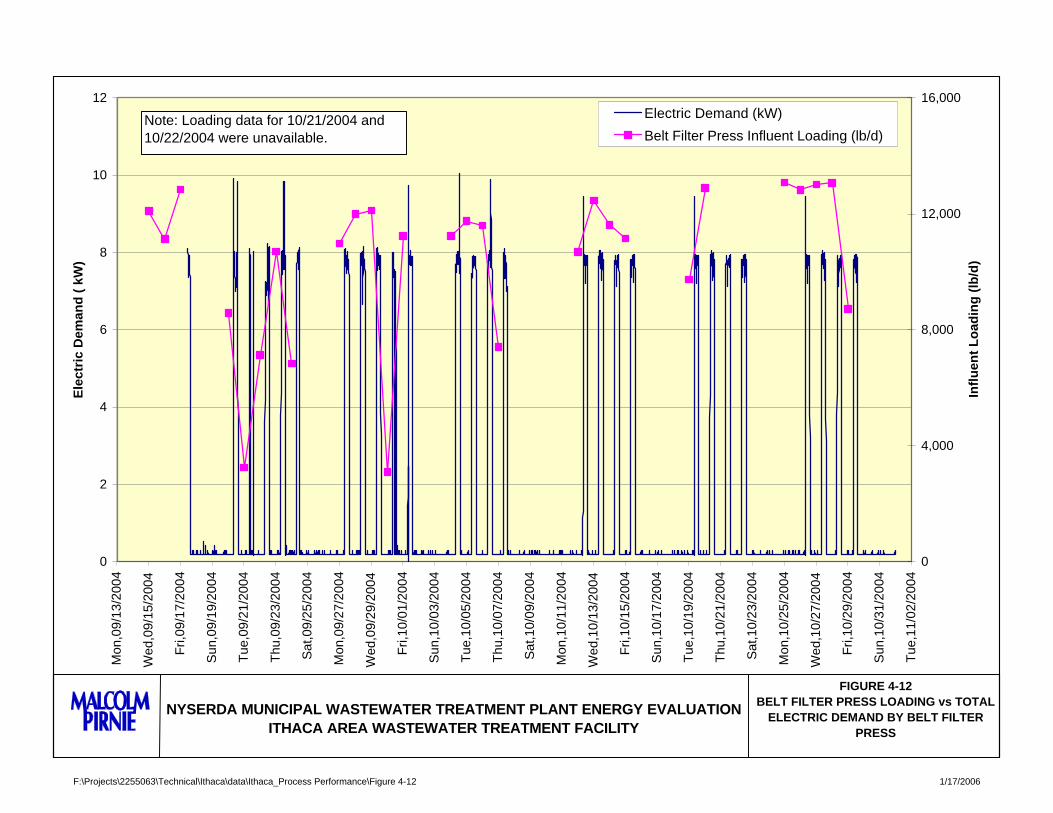
Section 6
ENERGY SAVING MEASURES THROUGH OPERATION MODIFICATIONS
6.1 OPERATIONAL MODIFICATIONS TO REDUCE ENERGY USAGE
Typically, the major operational changes that can be made to reduce electric energy usage are load shifting,
peak shaving, and greater use of real-time data in energy-related decision making. Load shifting is the
practice of changing the time of use of certain loads to reduce the total facility electric energy demand
during peak periods. Peak shaving is the practice of dispatching on-site generating assets to reduce
dependence on the grid during peak demand periods. The increased use of real-time data by the installation
and monitoring of permanent submeters can assist the facility in making informed decisions regarding the
usage of energy and offer alternatives for further reducing energy usage and demand.
6.1.1 Load Shifting
Electric energy demand data collected at the Ithaca Area Wastewater Treatment Facility (IAWWTF) were
used to estimate typical daily power draw. These data were then used to estimate when peak electric
energy demand occurs at the plant. FIGURE 6-1 shows the electric energy demand for the submetered
equipment during the submetering period. Note that the data presented are for continuously submetered
processes only, and do not include other miscellaneous electric loads such as lighting, heating, ventilation
and air conditioning (HVAC), and anaerobic digester equipment. As observed on FIGURE 6-1, regular
peaks in energy demand for the influent pumps are observed. This pattern is attributed to the diurnal
variation of influent flows to the plant. The electric energy demand for the solids handling system, as
measured on the belt filter press motor control center (MCC), also shows a regular pattern of peaks.
However, this is attributed to the sludge dewatering schedule (typically four to five days per week,
approximately eight hours per day). Significant, regular peaks are generally not observed in the electric
demand for the remaining individual submetered equipment, as well as the total demand for the submetered
equipment. However, there are several pieces of equipment which were not submetered continuously
under this project that are being used only during the day shift (which is also true for lighting and HVAC
equipment). Therefore, the energy usage demand peaks during the day may be even more pronounced. At
the same time, shifting any equipment or process operation to the second and third shift is not feasible as
the plant is only staffed during the first shift. Any energy demand savings associated with load shifting will
be greatly offset by substantial increases in labor costs. Considering this information, opportunities for
further load shifting at the IAWWTF are not apparent.
2255-063 6-1 Ithaca Area Wastewater Treatment Facility NYSERDA Submetering City of Ithaca

Ele
ctri
c D
eman
d (k
W)
350
300
250
Aeration Blower 1200 Aeration Blower 2
Influent Pump 1 Influent Pump 2 RAS Pump 1
150 RAS Pump 2 Belt Filter Press MCC Total
100
50
0
Fri,
09/1
7/04
Sun
,09/
19/0
4
Tue
,09/
21/0
4
Thu
,09/
23/0
4
Sat
,09/
25/0
4
Mon
,09/
27/0
4
Wed
,09/
29/0
4
Fri,
10/0
1/04
Sun
,10/
03/0
4
Tue
,10/
05/0
4
Thu
,10/
07/0
4
Sat
,10/
09/0
4
Mon
,10/
11/0
4
Wed
,10/
13/0
4
Fri,
10/1
5/04
Sun
,10/
17/0
4
Tue
,10/
19/0
4
Thu
,10/
21/0
4
Sat
,10/
23/0
4
Mon
,10/
25/0
4
Wed
,10/
27/0
4
Fri,
10/2
9/04
Sun
,10/
31/0
4
FIGURE 6-1 NYSERDA MUNICIPAL WASTEWATER TREATMENT PLANT ENERGY EVALUATION ELECTRIC ENERGY DEMAND
ITHACA AREA WASTEWATER TREATMENT FACILITY SUBMETERED EQUIPMENT
F:\Projects\2255063\Technical\Ithaca\data\Ithaca_Continuous_Submetering\Submetered_Equip_Demand 1/17/2006

6.1.2 Peak Shaving
Peak shaving refers to the practice of reducing demand during peak demand periods by using on-site
generation capabilities.
The IAWWTF operates two 110-kilowatt (kW) Caterpillar combine heat and power (CHP) co-generator
units. These units are primarily operated to utilize the available methane gas from the anaerobic digester.
A more detailed description of the existing operation scheme for the co-generator units, as well as an
evaluation of energy saving measures through capital improvements to the existing co-generation facilities,
is provided in Section 8. These measures would allow for increased utilization of digester gas and
increased electric energy generation, which would further reduce overall plant demand.
The IAWWTF also has an 800-kW stand-by diesel generator. It is possible that the emergency generator
could be put into operation during periods of higher demand (e.g., during wet weather conditions) or peak
shaving purposes. However, this is not an option at the IAWWTF for the following reasons:
• This emergency generator is permitted for emergency use and it is expected that the New York
State Department of Environmental Conservation (NYSDEC) will only allow it to operate 500
hours annually in its current classification.
• The current New York State Electric and Gas Corporation (NYSEG) electric tariff SC-7, approved
by the Public Service Commission, does not economically allow emergency or backup generators
to be used for peak shaving. With the exception of some small systems and/or some renewable
fuel systems, the SC-7 tariff requires the payment of several charges that can be very punitive.
• Air permitting for generating systems is required through the environmental agencies such as the
New York State Department of Environmental Conservation and the Federal Environmental
Protection Agency. A facility using a generator for non-emergencies, such as peak shaving, would
be required to submit a study as to the amount of emissions of not only the generators, but all
systems, such as boilers and heaters currently on site. Total emissions would not be allowed to
exceed certain levels and the facility, as a whole, would need to conform. Diesel or natural gas
powered generators with a maximum mechanical power rating of less than 400 brake horsepower
would be exempt; however, the IAWTF has an 800-kW stand-by diesel generator, and therefore,
would not qualify for the exemption.
• Futhermore, any peak demand charges associated with increased wet weather flows to the plant
may happen during any time of the day. Based on discussions with plant operator personnel, even
2255-063 6-2 Ithaca Area Wastewater Treatment Facility NYSERDA Submetering City of Ithaca

if the plant were allowed to make use of the emergency generator for peak shaving purposes, the
generator could not be operated during the second and third shifts because the plant is not staffed;
two operators would be required to work overtime to operate the generator. The additional labor
costs, as well as the generator fuel costs would significantly offset the energy savings associated
with peak shaving.
After evaluating electric energy demand for submetered processes, there appear to be no peak shaving
opportunities other than the co-generation improvement measures evaluated in Section 8 .
6.1.3 Operational Modifications
Based on current operations and communications with the staff, no modifications to the operation of the
plant are recommended.
2255-063 6-3 Ithaca Area Wastewater Treatment Facility NYSERDA Submetering City of Ithaca

Section 7
ENERGY SAVING MEASURES THROUGH LIGHTING/HVAC MODIFICATIONS
7.1 OVERVIEW
7.1.1 Heating, Ventilating, and Air Conditioning Overview
The Ithaca Area Wastewater Treatment Facility (IAWWTF) is comprised of one large building (Main
Building) and two small buildings (Influent Pump and Stand-by Generator Buildings). Based on
discussions with plant personnel, the total square footage of the three buildings is approximately 56,000
square feet. Each building is occupied by plant operator and maintenance staff from 6:00 AM through 4:00
PM, seven days per week.
The primary heating system for the Main Building is comprised of one H.B. Smith 2,500 MBH (1 MBH =
1,000 British Thermal Units per hour) hot water boiler, and two 7,000 MBH H.B. Smith hot water boilers.
One of the larger boilers is damaged and inoperable. The boilers are supplemented by waste heat recovered
from two 110-kilowatt (kW) Caterpillar co-generator units. The co-generator units primarily operate on
methane gas recovered from the anaerobic sludge digestion process. These systems supply hot water to
cabinet heaters, unit heaters, baseboard fine tube, hot water coils in heating and ventilating units 3 through
9, and air conditioning units 1 and 2. The Barber Coleman direct digital control (DDC) heating, ventilation,
and air conditioning (HVAC) control system is antiquated, and offers few advantages. The system does not
have a central computer to modify schedules or set points. Rather, the system primarily operates off time
clocks. The staff indicated that the air handling equipment operates without set-back 24 hours per day
seven days per week.
The Influent Pump Building has an Electro Duct 330-kW electric boiler and two air handling units
designated as “HV 1” and “HV 2”. The staff has indicated that the boiler has never operated due to the
impact it would have on the plant’s utility budget. The system is also supplemented by the primary heating
system. HV 1, which serves the screening room, has a capacity of 9,075 cubic feet per minute (cfm) and is
equipped with a hot water coil. A manual wall thermostat in the screening room indicated a 70 degree
Fahrenheit (oF) temperature set point during the site walkthrough. HV 2, which serves the HVAC
equipment room, has a capacity of 3,820 cfm and is also equipped with hot water heat. This space also
appeared to be maintained at 70 oF. The equipment room also has two unit heaters and two exhaust fans.
The Stand-by Generator Building was not accessed during this study; the staff indicated that there was no
major HVAC equipment in the building.
2255-063 7-1 Ithaca Area Waste Water Treatment Facility NYSERDA Submetering City of Ithaca

7.1.2 Lighting Overview
The facility has approximately 450 2-foot by 4-foot, T-12, two-lamp magnetic ballast fixtures. These
fixtures are inefficient and could benefit from a retrofit. High bay and incandescent fixtures are also present
in the facility.
7.2 HVAC AND LIGHTING ALTERNATIVES TO REDUCE ENERGY USAGE AND COSTS
7.2.1 Heating, Ventilation, and Air Conditioning
This facility demonstrates one main area for HVAC energy saving opportunities: replacement of existing
HVAC controls. Installation of an Energy Management System with a Windows -based front end is
recommended. The new system would provide a graphic user interface (GUI) capable of scheduling
temperatures, runtimes, alarming, hot water reset on boilers, and point trending. A load management
program would also be recommended in this system. The load management system would cycle the co-gen
units based on site demand, fuel price, and methane availability. The system could also assist in
determining engine maintenance. TABLE 7-1 summarizes the preliminary estimate of costs, savings, and
payback for these measures.
Table 7-1: Summary of Costs and Savings for HVAC Measures
Costs $ 75,000
Savings $ 12,000
Payback 6.3 years
7.2.2 Lighting
It is recommended that the existing lighting fixtures be replaced with 2-foot by 4-foot super T-8 electronic
ballast fixtures. For every two incandescent bulbs, one two-lamp, 2-foot by 4-foot T-8 fixture should be
installed. High bay 400 Watt fixtures should be replaced with 6L 4-foot by 4-foot T-8 fixtures. Occupancy
sensors and controls are also recommended. TABLE 7-2 summarizes the preliminary estimate of costs,
savings, and payback for these measures.
2255-063 7-2 Ithaca Area Waste Water Treatment Facility NYSERDA Submetering City of Ithaca
Table 7-2: Summary of Costs and Savings for All Lighting Measures
Costs $ 81,000
Annual Savings $ 9,300
Payback 8.7 years
2255-063 7-3 Ithaca Area Waste Water Treatment Facility NYSERDA Submetering City of Ithaca
Section 8
ON-SITE GENERATION
8.1 DESCRIPTION OF EXISTING SYSTEM OPERATION
The Ithaca Area Wastewater Treatment Facility (IAWWTF) currently operates two 110-kilowatt (kW)
Caterpillar combine heat and power (CHP) generator units. These units are primarily operated to generate
power from anaerobic digester gas. The power generated by the units is returned to the plant power grid.
Based on discussions with plant personnel, one generator runs 24 hours per day/seven days per week on
digester gas under typical operations. During the winter months when a higher amount of digester gas is
used by the boiler for plant heating and gas production at the plant is lower, there is typically only enough
digester gas remaining to run one generator. During these periods, the other generator is shut down.
However, during the summer months when a lower amount of digester gas is directed to the boiler and gas
production at the plant is higher, the second generator is typically brought online for eight hours per day
(during the first shift when the plant is staffed) to use the excess digester gas.
During periods of low digester gas feed to the generators, feed to the primary generator unit is
automatically switched from digester gas to natural gas in order to keep at least one generator operational at
all times. This switch-over, however, is not automatically reversible. If the switch-over to natural gas
takes place during the evening hours when the plant is not staffed, digester gas is wasted to the waste gas
burner even if digester gas pressure builds back up to a sufficient level overnight. In these instances,
manual switch-over back to digester gas is required and typically performed when the plant staff returns in
the morning.
The existing engines and heat exchangers for the co-generators are 1988 vintage. The engines have been
routinely overhauled, and at the time of the audit they were found to be in good operating condition.
IAWWTF staff performs a majority of the maintenance required for the generator units. Based on
discussions with plant personnel, heat is not recovered from the stack, oil, or intercoolers of the units.
2255-063 8-1 Ithaca Area Wastewater Treatment Facility NYSERDA Submetering City of Ithaca

8.2 CAPITAL IMPROVEMENT ALTERNATIVES
The following three capital improvement alternatives for the co-generation system were evaluated as part
of this report:
• Alternative 1: Installation of gas storage facilities and new controls with continued operation of
the existing co-generator units.
• Alternative 2: Installation of gas storage facilities and new controls and replacement of the co
generator units with microturbines.
• Alternative 3: Installation of gas storage facilities and upgraded heat recovery and controls; in-
kind replacement of the existing co-generator units with higher-efficiency reciprocating engines.
8.2.1 Alternative 1 Evaluation: Installation of Gas Storage Facilities and New Controls with
Continued Operation of the Existing Co-Generator Units
This alternative includes the installation of gas storage facilities and new controls and continued operation
of the existing co-generation units.
The proposed control system would allow for operation of the existing co-generation units, which have an
approximate electrical efficiency of 28%, based on fuel price, facility electrical load, and the availability of
digester gas. Gas storage facilities would allow for capture and subsequent usage of the digester gas that is
currently wasted by the facility due to various operating modes. As described in Section 8.1, the primary
loss is due to the lack of an automatic switch-over from natural gas to digester gas during the second and
third shifts during periods of low digester gas production. The new controls would allow for operation of
the secondary co-generator, as necessary, during the first shift when the plant is staffed to allow for
processing of any digester gas captured in the storage facilities during the second and third shift. The
storage needs were estimated based on data provided by plant operators of the quantity of wasted digester
gas. The costs, savings, and payback for this alternative are summarized in TABLE 8-1.
2255-063 8-2 Ithaca Area Wastewater Treatment Facility NYSERDA Submetering City of Ithaca

Table 8-1: Summary of Costs and Savings for Installation of Gas Storage Facilities and New Controls with Existing Co-generator Units
Costs $173,500
Annual Savings $29,114
Payback 6.0 years
The capital cost for this alternative includes costs for controls, a 1,000-cubic foot digester gas storage tank,
a gas scrubber, a compressor, and a moisture eliminator.
8.2.2 Alternative 2 Evaluation: Installation of Gas Storage Facilities and New Controls and Replacement of the Co-Generator Units with Microturbines
This alternative includes the installation of gas storage facilities and new controls and replacement of the
co-generator units with microturbines. The existing co-generator units would be replaced with two 60-kW
Capstone microturbines rated at 22% electrical efficiency to replace the existing reciprocating engines.
Typically, the microturbines are not as efficient as the existing reciprocating engines, which have an
approximate electrical efficiency of 28%. However, the microturbines do produce significantly higher
values of recoverable waste heat per unit of electrical energy generated relative to the existing co-generator
units. To match the facility heat requirements and optimize the microturbine efficiency, the microturbines
would be sized smaller in terms of capacity. The new units would be equipped with heat recovery
modules. Furthermore, emissions from a microturbine would likely be lower than those from the existing
co-generator units, which may become an important consideration in the future if the New York State
Department of Environmental Conservation (NYSDEC) decides to impose more stringent air emissions
standards for biogas fueled distributed generation systems.
The proposed control system would allow for operation of the two microturbines based on fuel price,
facility electrical load, and the availability of digester gas. Gas storage facilities would allow for capture
and subsequent usage of the digester gas that is currently wasted by the facility due to various operating
modes. As described in Section 8.1, the primary loss is due to the lack of an automatic switch-over from
natural gas to digester gas during the second and third shifts during periods of low digester gas production.
The storage needs were estimated based on data provided by plant operators of the quantity of wasted
digester gas. The costs, savings, and payback for this alternative are summarized in TABLE 8-2.
2255-063 8-3 Ithaca Area Wastewater Treatment Facility NYSERDA Submetering City of Ithaca
Table 8-2: Summary of Costs and Savings for Installation of Gas Storage Facilities and New Controls and Replacement of the Co-generator Units with Microturbines
Costs $663,500
Annual Savings $ 37,656
Payback 17.6 years
The capital cost for this alternative includes costs for the microturbines, controls, a 1,000-cubic foot
digester gas storage tank, a gas scrubber, a compressor, and a moisture eliminator. The facility would also
have to outsource the maintenance on these units. This cost has been included in the payback for this
alternative .
8.2.3 Alternative 3 Evaluation: Installation of Gas Storage Facilities and Upgraded Heat Recovery and Controls; In-Kind Replacement of the Existing Co-Generator Units with Higher-Efficiency Reciprocating Engines.
This alternative includes the installation of gas storage facilities and new controls and in-kind replacement
of the co-generator units with higher efficiency reciprocating engines. The existing co-generator units
would be replaced with two 100-kW, 1,200 revolutions per minute ( rpm) Caterpillar co-generator units
rated at 35% electrical efficiency. The new units would feature heat recovery from the exhaust, jacket
water, oil and intercooler. The new engines have slightly better fuel efficiency and the enhanced heat
recovery combine would yield significant energy savings.
The proposed control system would allow for operation of the two co-generator units based on fuel price,
facility electrical load, and the availability of digester gas. Gas storage facilities would allow for capture
and subsequent usage of the digester gas that is currently wasted by the facility due to various operating
modes. As described in Section 8.1, the primary loss is due to the lack of an automatic switch-over from
natural gas to digester gas during the second and third shifts during periods of low digester gas production.
The storage needs were estimated based on data provided by plant operators of the quantity of wasted
digester gas. The costs, savings, and payback for this alternative are summarized in TABLE 8-3.
Table 8-3: Summary of Costs and Savings for Installation of Gas Storage Facilities and New Controls and In-kind Replacement of the Co-generator Units with Higher Efficiency Reciprocating Engines
Costs $351,000
Annual Savings $78,006
Payback 4.5 Years
2255-063 8-4 Ithaca Area Wastewater Treatment Facility NYSERDA Submetering City of Ithaca
The capital cost for this alternative includes costs for new co-generator units, controls, a 1,000-cubic foot
digester gas storage tank, a gas scrubber, a compressor, and a moisture eliminator.
8.3 LOAD CURTAILMENT
The IAWWTF also has an 800-kW stand-by diesel generator. As discussed in Section 6.1.2, using the
generator for routine peak shaving is not feasible. However, it may be feasible to use the generator for load
curtailment. The facility is currently not enrolled in any curtailment programs and does not receive any
incentives for its operation. If the facility were to enter into contract with a New York Independent System
Operator (NYISO)-approved curtailment provider, they would receive an incentive of approximately
$3,600 per year and an event-based incentive of $0.30 per kilowatt-hour (kWh) of energy generated. The
facility could also receive incentives of $40 per kW from NYSERDA for short term load reduction. There
would be no initial cost associated with entering into a curtailment program and the incentive levels would
change on an annual basis.
8.4 SUMMARY
The co-generator capital improvement alternatives discussed in this section offer advantages when
compared to the operation of the existing co-generator units. However, considering the condition of the
existing co-generator units, this investment is not recommended at this time.
At the end of the useful life cycle of the co-generator units currently used (8 to 10 more years,
approximately), it may be feasible to replace them with newer-generation equipment, such as micro-
turbines or other new technology available at that time, which may be more efficient than the existing co
generators. The alternatives discussed in Sections 8.2.1 and 8.2.3 in particular should be considered before
the alternative discussed in Section 8.2.2 because of the relatively shorter paybacks. However, if in the
future NYSDEC imposes more stringent air emission standards, then microturbines may become a better
alternative for the City.
2255-063 8-5 Ithaca Area Wastewater Treatment Facility NYSERDA Submetering City of Ithaca
Section 9
FINAL RECOMMENDATIONS
9.1 SUMMARY OF EVALUATIONS
This report has identified additional alternatives to reduce energy usage at the Ithaca Area Wastewater
Treatment Facility (IAWWTF). These alternatives include:
• Installation of automatic controls on the aeration system blowers.
• Conversion from ferrous chloride to ferric chloride use for phosphorus removal in the aeration
basins.
• On-site generation facilities modifications.
• Replacement of the existing heating, ventilation, and air conditioning (HVAC) controls with an
Energy Management System and Windows-based front end.
• Lighting improvements.
TABLE 9-1 summarizes the estimated energy savings, implementation costs, and simple payback periods
for these alternatives.
9.2 SUMMARY OF RECOMMENDATIONS
Using the results of the evaluation summarized in TABLE 9-1, the following alternatives are recommended
for implementation:
• Installation of automatic controls on the aeration system blowers.
• Replacement of the existing HVAC controls with an Energy Management System and Windows
based front end.
The remaining alternatives are not recommended due to long payback periods.
TABLE 9-2 contains a summary of the costs to implement the recommended alternatives only, as well as
provides a summary of potential savings. The recommended alternatives offer a payback of 3.3 years, if
implemented together, with a total annual savings of $26,700, which represents 8.1% of the IAWWTF’s
total annual energy costs ($328,259; based on 2002 and 2003 annual energy costs).
2255-063 9-1 Ithaca Area Wastewater Treatment Facility NYSERDA Submetering City of Ithaca

New York State Energy and Research Development Authority Municipal Wastewater Treatment Plant Energy Evaluation
Ithaca Area Wastewater Treatment Facility
Table 9-1 Summary of Energy Savings Alternatives Presented in Sections 5, 6, 7, and 8
ECM# Measure Description Non-Energy Related Benefits Fuel Type
Saved Energy Saved (kWh)
Total Annual Dollars Saved*
Implementation Costs Simple Payback Period (years)
1 Installation of automatic controls on the aeration system blowers. Improved process control electric 157,680 $14,700 $14,400 1.0
2 Conversion from ferrous chloride to ferric chloride use for phosphorus removal in the aeration basins.
n/a electric ** ** ** **
On-site generation facilities modifications:
3
Alternative 1 - installation of gas storage facilities and new controls and continued operation of the existing co-generation units.
Alternative 3 - installation of gas storage facilities and new controls and in-kind replacement of the co-generator units with higher efficiency reciprocating engines.
n/a electric Alternative 1 - 210,240 *** Alternative 3 - 525,600 ***
Alternative 1 - $29,114 Alternative 3 - $78,006
Alternative 1 - $173,500 Alternative 3 - $351,000
Alternative 1 - 6.0 Alternative 3 - 4.5
4 Replacement of the existing HVAC controls with an Energy Management System and Windows-based front end.
n/a electric 168,336 $12,000 $75,000 6.3
5 Lighting improvements. n/a electric 108,000 $9,300 $81,000 8.7
* Dollars saved calculated by multiplying the energy saved by the rate of $0.093/kWh ** Alternative determined to be more costly (negligible electric energy savings and higher chemical costs) than existing operation; costs not developed. *** Energy savings of on-site generation facilities measures expressed relative to savings of existing cogeneration facilities.
F:\Projects\2255063\Draft Documents\Report\Ithaca\Sec 9 Tables\Table 9-1 1/17/2006

New York State Energy and Research Development Authority Municipal Wastewater Treatment Plant Energy Evaluation
Ithaca Area Wastewater Treatment Facility
Table 9-2 Summary of Recommended Alternatives
ECM# Measure Description Non-Energy Related Benefits Fuel Type
Saved Energy Saved
(kWh) Total Annual Dollars
Saved* Implementation
Costs Simple Payback Period (years)
1 Installation of automatic controls on the aeration system blowers.
Improved process control electric 157,680 $14,700 $14,400 1.0
4 Replacement of the existing HVAC controls with an Energy Management System and Windows-based front end.
n/a electric 168,336 $12,000 $75,000 6.3
* Dollars saved calculated by multiplying the energy saved by the rate of $0.093/kWh
F:\Projects\2255063\Draft Documents\Report\Ithaca\Sec 9 Tables\Table 9-2 1/17/2006

As previously stated in Section 8, considering the condition of the existing co-generation units, no
modifications to the on-site generation facilities are recommended at this time. However, when existing
units approach the end of their useful lives, modifications should be considered. Both on-site generation
facility Alternatives 1 (installation of gas storage facilities and new controls and continued operation of the
existing co-generation units) and 3 (installation of gas storage facilities and new controls and in-kind
replacement of the co-generator units with higher efficiency reciprocating engines) should be considered
first because of their relatively short payback period. Alternative 2 (replacement of co-generator units with
microturbines) should be considered in the future if the New York State Department of Environmental
Conservation (NYSDEC) decides to impose more stringent air emission standards. Also as stated in
Section 8 , the IAWWTF should also consider involvement in a load curtailment program.
2255-063 9-2 Ithaca Area Wastewater Treatment Facility NYSERDA Submetering City of Ithaca