muon production height studies with the air shower
TRANSCRIPT
HAL Id: hal-00710473https://hal.archives-ouvertes.fr/hal-00710473
Submitted on 21 Jun 2012
HAL is a multi-disciplinary open accessarchive for the deposit and dissemination of sci-entific research documents, whether they are pub-lished or not. The documents may come fromteaching and research institutions in France orabroad, or from public or private research centers.
L’archive ouverte pluridisciplinaire HAL, estdestinée au dépôt et à la diffusion de documentsscientifiques de niveau recherche, publiés ou non,émanant des établissements d’enseignement et derecherche français ou étrangers, des laboratoirespublics ou privés.
Muon Production Height Studies with the Air ShowerExperiment KASCADE-Grande
W.D. Apel, J.C. Arteaga, K. Bekk, M. Bertaina, J. Blümer, H. Bozdog, I.M.Brancus, P. Buchholz, C. Büttner, E. Cantoni, et al.
To cite this version:W.D. Apel, J.C. Arteaga, K. Bekk, M. Bertaina, J. Blümer, et al.. Muon Production Height Studieswith the Air Shower Experiment KASCADE-Grande. Astroparticle Physics, Elsevier, 2010, 34 (6),pp.476. �10.1016/j.astropartphys.2010.10.016�. �hal-00710473�

Accepted Manuscript
Muon Production Height Studies with the Air Shower Experiment KASCADE-
Grande
W.D. Apel, J.C. Arteaga, K. Bekk, M. Bertaina, J. Blümer, H. Bozdog, I.M.
Brancus, P. Buchholz, C. Büttner, E. Cantoni, A. Chiavassa, F. Cossavella, K.
Daumiller, V. de Souza, F. Di Pierro, P. Doll, R. Engel, J. Engler, M. Finger, D.
Fuhrmann, P.L. Ghia, H.J. Gils, R. Glasstetter, C. Grupen, A. Haungs, D. Heck,
J.R. Hörandel, T. Huege, P.G. Isar, K.-H. Kampert, D. Kang, D. Kickelbick,
H.O. Klages, K. Link, M. Ludwig, P. Łuczak, H.J. Mathes, H.J. Mayer, M.
Melissas, J. Milke, B. Mitrica, C. Morello, G. Navarra, S. Nehls, R. Obenland,
J. Oehlschläger, S. Ostapchenko, S. Over, N. Palmieri, M. Petcu, T. Pierog, H.
Rebel, M. Roth, G. Schatz, H. Schieler, F. Schröder, O. Sima, G. Toma, G.C.
Trinchero, H. Ulrich, A. Weindl, J. Wochele, M. Wommer, J. Zabierowski
PII: S0927-6505(10)00213-6
DOI: 10.1016/j.astropartphys.2010.10.016
Reference: ASTPHY 1541
To appear in: Astroparticle Physics
Received Date: 7 May 2010
Revised Date: 25 October 2010
Accepted Date: 25 October 2010
Please cite this article as: W.D. Apel, J.C. Arteaga, K. Bekk, M. Bertaina, J. Blümer, H. Bozdog, I.M. Brancus, P.
Buchholz, C. Büttner, E. Cantoni, A. Chiavassa, F. Cossavella, K. Daumiller, V. de Souza, F. Di Pierro, P. Doll, R.
Engel, J. Engler, M. Finger, D. Fuhrmann, P.L. Ghia, H.J. Gils, R. Glasstetter, C. Grupen, A. Haungs, D. Heck, J.R.
Hörandel, T. Huege, P.G. Isar, K.-H. Kampert, D. Kang, D. Kickelbick, H.O. Klages, K. Link, M. Ludwig, P.
Łuczak, H.J. Mathes, H.J. Mayer, M. Melissas, J. Milke, B. Mitrica, C. Morello, G. Navarra, S. Nehls, R. Obenland,
J. Oehlschläger, S. Ostapchenko, S. Over, N. Palmieri, M. Petcu, T. Pierog, H. Rebel, M. Roth, G. Schatz, H. Schieler,
F. Schröder, O. Sima, G. Toma, G.C. Trinchero, H. Ulrich, A. Weindl, J. Wochele, M. Wommer, J. Zabierowski,
Muon Production Height Studies with the Air Shower Experiment KASCADE-Grande, Astroparticle Physics
(2010), doi: 10.1016/j.astropartphys.2010.10.016
This is a PDF file of an unedited manuscript that has been accepted for publication. As a service to our customers
we are providing this early version of the manuscript. The manuscript will undergo copyediting, typesetting, and

review of the resulting proof before it is published in its final form. Please note that during the production process
errors may be discovered which could affect the content, and all legal disclaimers that apply to the journal pertain.

Muon Production Height Studies with the Air Shower
Experiment KASCADE-Grande
W.D. Apela, J.C. Arteagab,1, K. Bekka, M. Bertainac, J. Blumera,b,H. Bozdoga, I.M. Brancusd, P. Buchholze, C. Buttnerb, E. Cantonic,f,
A. Chiavassac, F. Cossavellab,2, K. Daumillera, V. de Souzab,3,F. Di Pierroc, P. Doll∗,a, R. Engela, J. Englera, M. Fingera, D. Fuhrmanng,P.L. Ghiaf, H.J. Gilsa, R. Glasstetterg, C. Grupene, A. Haungsa, D. Hecka,
J.R. Horandelb,4, T. Huegea, P.G. Isara,5, K.-H. Kampertg, D. Kangb,D. Kickelbicke, H.O. Klagesa, K. Linkb, M. Ludwigb, P. �Luczakh,H.J. Mathesa, H.J. Mayera, M. Melissasb, J. Milkea, B. Mitricad,
C. Morellof, G. Navarrac,6, S. Nehlsa, R. Obenlanda, J. Oehlschlagera,S. Ostapchenkoa,7, S. Overe, N. Palmierib, M. Petcud, T. Pieroga,
H. Rebela, M. Rotha, G. Schatza, H. Schielera, F. Schrodera, O. Simai,G. Tomad, G.C. Trincherof, H. Ulricha, A. Weindla, J. Wochelea,
M. Wommera, J. Zabierowski∗,h
aInstitut fur Kernphysik, Karlsruher Institut fur Technologie - Campus Nord,76021 Karlsruhe, Germany
bInstitut fur Experimentelle Kernphysik, Karlsruher Institut fur Technologie - CampusSud, 76021 Karlsruhe, Germany
cDipartimento di Fısica Generale dell’Universita, 10125 Torino, ItalydNational Institute of Physics and Nuclear Engineering, 7690 Bucharest, Romania
eFachbereich Physik, Universitat Siegen, 57068 Siegen, GermanyfIstituto di Fisica dello Spazio Interplanetario, INAF, 10133 Torino, ItalygFachbereich Physik, Universitat Wuppertal, 42097 Wuppertal, GermanyhThe Andrzej Soltan Institute for Nuclear Studies, 90950 Lodz, Poland
∗Corresponding authors. Address: Institut fur Kernphysik, Karlsruher Institut furTechnologie (KIT), Post Box 3640, 76021 Karlsruhe, Germany, Tel.: +49 7247 824171;fax:+49 7247 823321
Email addresses: [email protected] (P. Doll), [email protected](J. Zabierowski)
1now at: Instituto de Fısica y Matematicas, Universidad Michoacana, Morelia, Mexico2now at: Max-Planck-Institut fur Physik, Munchen, Germany3now at: Universidade de Sao Paulo, Instituto de Fısica de Sao Carlos, Brasil4now at: Dept. of Astrophys. Radboud University Nijmegen, The Netherlands5now at: Institute for Space Sciences, Bucharest-Magurele, Romania6Deceased7now at: University of Trondheim, Norway
Preprint submitted to Astroparticle Physics November 2, 2010

iDepartment of Physics, University of Bucharest, 76900 Bucharest, Romania
Abstract
A large area (128 m2) muon tracking detector, located within the KASCADEexperiment, has been built with the aim to identify muons (Eµ > 0.8 GeV)and their angular correlation in extensive air showers by track measurementsunder 18 r.l. shielding. Orientation of the muon track with respect to theshower axis is expressed in terms of the radial and tangential angles, whichare the basic tools for all muon investigations with the tracking detector. Bymeans of triangulation the muon production height is determined. Distrib-utions of measured production heights are compared to CORSIKA showersimulations. Analysis of these heights reveals a transition from light to heavycosmic ray primary particles with increasing shower energy in the energy re-gion of the ’Knee’ of the cosmic ray spectrum.
Key words: Cosmic rays, Air shower, Muons, Muon production height
1. Introduction1
Ultra High Energy (UHE) astrophysics includes, as one of its topics, the2
investigation of UHE Cosmic Ray (CR) particles interacting with the nu-3
clei of the atmosphere and creating Extensive Air Showers (EAS) which are4
studied by means of ground based experiments of large detection area. To5
understand the nature of UHE particles it is necessary to measure as many6
components of the EAS cascade as possible. Particularly important is the7
measurement of the muon component, because muons, being a result of de-8
cays of mesons - the most numerous products of hadronic interactions in an9
air shower - carry information about those interactions to the observation10
level. In turn, knowledge of UHE hadronic interactions is a necessary condi-11
tion for answering many questions formulated in CR research. The angular12
correlation information on EAS muons measured with the tracking detec-13
tor is especially closely correlated to the parameters of the interactions in14
question. A recent compilation of muon study results is given in Ref. [1].15
In the past, various tracking detectors for measuring CR particles have16
been put into operation either on the surface of Earth [2]-[8] or deep under-17
2

ground [9]. Currently active installations for muon and neutrino studies are18
IceCube [10], ANTARES [11] and MINOS [12]. Tracking detectors provide19
the possibility to study the muon production height which is the subject of20
this work.21
Muon information has usually been integrated over a large sample of22
showers and over the whole longitudinal profile. However, muons have some23
advantage compared with optical photons [13]-[15]: they reflect the develop-24
ment of the nuclear cascade with no mediation from electromagnetic cascades25
and, similar to the radio emission [16], they can be measured 24 hours a day -26
not only on clear moonless nights. Their evident disadvantage is that muons27
are less numerous than photons and are, therefore, subject to large fluctua-28
tions. In addition, they are charged particles and are subject to deflection29
in the geomagnetic field and also suffer from multiple Coulomb scattering in30
the atmosphere and detector shielding.31
Muon tracking allows to measure the composition sensitive profile of a32
shower in the ’Knee’ region, where it is not possible by the fluorescence tech-33
nique used, e.g. by Fly’s Eye [17] and Auger [18] experiments. It enables as34
well the study of hadron interactions [19, 20]. Muons have never been used35
up to now, with sufficient accuracy and large statistics, for the reconstruction36
of the longitudinal development of the EAS hadron component of individ-37
ual showers due to the difficulty of building large area, ground-based muon38
telescopes. The reconstruction of the longitudinal development of the muon39
component by means of triangulation [21]-[24] provides a powerful tool for40
primary mass estimation and for study of high-energy hadron interactions41
with atmospheric nuclei.42
The KASCADE-Grande air-shower experiment [25], set-up in Karlsruhe,43
Germany provides information on individual EAS up to primary energy44
1018 eV. Complex analyses of KASCADE data [26] resulted in CR flux spec-45
tra for five groups of primary masses over the ’Knee’ region. However, these46
spectra exhibit a strong dependence on the hadronic interaction models used47
in the data analysis. Therefore, an independent investigation of additional48
shower observables like muon angular correlations with respect to the shower49
direction is of a great importance. To address this task a Muon Tracking50
Detector (MTD) [27] was constructed providing additional information on51
muons for the measured EAS.52
In this work we present the experimental investigation of the hadronic53
cascade in EAS using tracks of muons measured at the KASCADE-Grande54
experiment. Precise angular information on those tracks is used to determine55
3

muon production heights. The sensitivity of this quantity to the mass and56
energy of CR primary particles is shown. The validity of hadronic interac-57
tion models used in Monte Carlo simulations is discussed. Due to the energy58
dependence of muon production height a transformation to muon production59
depth is used to investigate, in a model independent way, the CR composi-60
tion. An estimate of the composition covering two decades of primary energy61
around the ’Knee’ is given.62
2. Muon Tracking Detector (MTD) in KASCADE-Grande63
The original KASCADE experiment [28], with its array of scintillation64
counters registering the electron and muon components in EAS has been65
enlarged into KASCADE-Grande in 2001 - 2003 by adding the extended66
’Grande’ array of scintillation counters. The MTD was put into operation and67
started regular data taking in the beginning of 2003. It provides additional68
information on muons for the two parts of the experiment: KASCADE and69
Grande. Both arrays trigger the MTD.70
The MTD utilizes streamer tube (ST) gas detectors grouped in modules.71
Four modules, three positioned on horizontal planes (top, middle, bottom)72
and one arranged vertically (wall), form a muon telescope, called a detector73
tower. The whole MTD comprises 16 towers arranged in two rows of a74
total detection area of 128 m2. A multi-layer filter of six 3 cm thick iron75
plates, separated each by 5 cm of sand, covered with soil and resting on76
30 cm of steel-concrete roof, absorbs a large fraction of accompanying low-77
energy particles, thus enhancing the identification of muons with an energy78
exceeding 0.8 GeV. The details of the design and performance of the MTD79
can be found elsewhere [27, 29].80
The MTD shows a good stability of operation. Hereby, the stability of the81
gas composition on the sub-percent level is of great importance. However,82
the open gas system is influenced by the atmospheric pressure and tempera-83
ture (internal in the detector Tint and atmospheric Tatm), which is observed84
in the measured free monitor muon count rate. After applying corrections,85
the free monitor rate (R) has a remaining variation of about 1%. The re-86
sulting temperature and pressure coefficients of the rate, together with the87
gas composition stability parameters, are given in Table 1. They provide88
the parameters for the MTD track efficiency determination and correction89
for temperature and pressure, i.e. for varying atmospheric conditions at90
KASCADE-Grande.91
4

5757.5
5858.5
5959.5
60100
150 200 250 300 350
100
200
even
odd
ADC [channels]wire pair
Figure 1: Anode wire amplitude spectra for individual odd/even numbered wire cells.
The analysis is based on 3-hit tracks, which are derived from x and y92
(wire and strip) hits in the 3 horizontal modules for each tower. Using 3-hit93
tracks only, together with the track quality parameter discussed in Ref. [27],94
makes the amount of tracks uncorrelated with a shower being below 1 %.95
The modules show, after correction for geometry, pressure and temperature96
variations, a hit efficiency close to 100%, varying on average by less than 1%.97
The track efficiency (ε) stability parameter is given in Table 1. The cluster98
sizes are limited to 10 cm at the wires and to 16 cm at the strips to control99
punch-through effects and to achieve tracks of a good quality. More details on100
track quality and its influence on the direction determination and comparison101
with shower and detector simulations can be found in Refs. [27], [30] and [31].102
Previously, the anode wire readout in the MTD was operated by com-103
bining two neighboring wire cells. To improve the angular resolution a mod-104
ification was introduced [32], enabling to identify even and odd numbered105
wires, using the same common readout electronic channel. The individual106
wire cells are identified by means of the pulse shape, as illustrated in Fig. 1.107
This procedure improves the angular resolution by 30%.108
3. Tangential and Radial Angles109
The KASCADE-Grande data, both from the KASCADE and ’Grande’110
detector arrays, allow us, after detailed analysis steps [33], [34], [35] to111
determine the direction (θ and φ), the shower core position, the total number112
of electrons - electron size lg(Ne), and the total number of muons - muon113
size lg(Nµ), for each shower. In KASCADE the so-called ’truncated’ muon114
5

Table 1: Variation of track efficiency (ε), Monitor Rate (R) and Gas Composition StabilityParameters of the MTDdε/dTint +(0.16±0.02) %/◦Cdε/dpint −(0.12±0.04) %/mbdR/dTatm −(0.31±0.02) %/◦CdR/dpatm −(0.12±0.04) %/mbArgon 13.8±0.1%CO2 54.0±0.1%Isobutane 30.2±0.1%Ethanol 2.0±0.2%
number lg(N trµ ), is evaluated in the distance range 40-200 m from the shower115
core. In ’Grande’ the muon size is determined in a different way [35]. The116
’truncated’ muon number is approximately related to the total muon number117
in the following way: lg(Nµ) ≈ lg(N trµ ) + 0.5 [36]. This relation, obtained by118
simulations, results for the same showers reconstructed with KASCADE and119
Grande separately in similar muon shower size lg(Nµ) values within 10-15 %.120
Determination of primary cosmic ray energy from the parameters of121
registered air showers is of primary interest for all EAS experiments. In122
KASCADE-Grande total energy E0 of the primary CR particle, in GeV, can123
be expressed in an almost mass independent manner through lg(Ne) and124
lg(Nµ). Based on extensive simulation studies [37] with CORSIKA [38],125
using QGSJet01 [39] the following formula is found126
lg(E0) = a· lg(Ne) + b· lg(Nµ) + c , (1)
where the parameters have the following values. For the KASCADE array127
data analysis a = 0.19, b = 0.79 and c = 2.33, and in addition, lg(N trµ ) is used128
instead of lg(Nµ). For the Grande array analysis, following Ref. [40], we have129
a = 0.31, b = 0.67 and c = 1.85. Note, that because of the large coefficient130
for lg(Nµ) this parameter is sometimes used to demonstrate the behavior of131
various shower quantities as a function of primary energy, where an increase132
in lg(Nµ) means increase in E0. Formula (1) gives ≈ 10-20 % (depending133
on the primary energy range) uncertainty in energy determination which is134
sufficient for this study. Investigation of an improved determination of E0 in135
KASCADE-Grande is in progress and first results can be found in [41] and136
6

references therein.137
tangential
plane
shower core position
muon detector
reconstructed
muon track
radia
l
plane
τρ
∆ h µ
pion track
shower
axis
h µtrue
�
∆ h µ
track of
produced muon
ρ
ζ
Figure 2: Illustration of the angular correlations in EAS and the definition of the radial(ρ) and tangential (τ) angles. The differences between the true and the reconstructed hµ
values for the two reconstruction approaches - see text - are also shown.
For the determination of the muon production height hµ in EAS, orien-138
tation of the muon track with respect to the shower axis has to be investi-139
gated. Due to their transverse momentum parent mesons travel away from140
the shower axis. To investigate angular correlation of the muon track with141
respect to the shower axis, the angle in space between both directions is de-142
composed into two components: the radial (ρ) and the tangential (τ) angles143
[27], [42], shown in Fig. 2. The ρ angle is defined in the radial plane, sub-144
tended by the shower axis, the shower core position and the point where the145
muon hits the MTD detector plane. The τ angle is defined in the tangential146
plane which is perpendicular to the radial plane and parallel to the shower147
axis, and goes also through the point where the muon hits the detector plane.148
The value of τ reflects predominantly the amount of muon scattering in149
the atmosphere and in any relevant absorber/detector material, and to some150
extent also the fact that muons can be produced off the shower axis. A151
contribution from the deflection of high-energy muons in the geomagnetic152
field (locally < 0.1◦ [31]) is also included there. The τ angle distribution,153
when averaged over all azimuth angles, is symmetrical around zero and gets154
7

ρ [deg]
3.25-3.503.50-3.75
3.75-4.00
4.00-4.25
4.25-4.50
4.50-4.75
4.75-5.00
lg(Nµtr)
10 2
10 3
10 4
10 5
-1 0 1 2 3 4 5 6 7
dN
/dρ
Figure 3: An example of radial angle distributions from Ref. [31] shows the behavior of thisquantity in a wide range of lg(N tr
µ ), i.e. of primary energy. The selection used comprisesa radial distance range 40-120 m, shower zenith angles θ < 30◦ and |τ | <0.7◦. Relativeyields reflect the CR flux in different lg(N tr
µ ) intervals. Lines connect the data points toguide the eyes.
narrower with increasing muon momentum [43], which is expected from the155
momentum dependence of multiple scattering and from geomagnetic bending.156
The ρ angle value, being defined in the shower coordinate system, is157
dominantly correlated with the transverse momentum of the parent meson.158
It is also substantially larger than the corresponding τ values. The multiple159
scattering of the muon in the atmosphere and muon filter above the MTD160
contributes also to the value of ρ, but has a relatively minor effect on it.161
An example of ρ distributions are shown in Fig. 3 [31]. They exhibit an162
asymmetric shape, being shifted with increasing lg(N trµ ) towards larger ρ163
values. This shift is due to the deeper penetration of higher energy showers,164
8

but it is not so strongly pronounced because of the wide range of shower core165
distances selected for Fig. 3. Negative ρ values are due to a finite resolution166
of the ρ angle (≈ 0.2◦) and due to the possible muon scattering towards the167
shower axis.168
4. Muon Production Height169
In previous theoretical studies [44] the longitudinal development of the170
muon component in EAS was investigated by an integral transformation from171
lateral particle densities to a more shower development related observable like172
the muon production heights. Due to the very different shower development173
for light and heavy primary CR particles, their corresponding mean produc-174
tion heights are expected to be different, and thus to be indicative for the175
primary mass (see Fig. 4).176
Conditions of the experiment and the response of the MTD were ex-177
tensively studied with experimental data and simulations ([27], [30], [31])178
to ensure the best tracking resolution and to clean the sample from non-179
shower-muon tracks. The effects of the non-central location of the MTD180
within KASCADE were also taken into account.181
In order to decrease the effect of multiple muon scattering on their path182
to the detector |τ | angles smaller than 0.7◦ are considered. This cut enriches183
the sample with high energy muons, above a few GeV [30], having smaller184
multiple scattering angles (στ ≈ 0.2◦) and smaller bending in the geomag-185
netic field, which improves considerably the determination of the correct186
production height.187
Elimination of tracks not belonging to shower muons or originating in188
the absorber above the MTD (in addition to the cuts ensuring good track189
quality, mentioned in Section 2) is achieved by limiting the radial angle value190
to ρ < 8◦. For muon production height analysis in this work only positive191
radial angles are considered.192
To ensure a nearly full azimuthal symmetry of the measured muons,193
events with 40 m - 80 m core distance to the MTD are selected (the location194
of the MTD is shifted by 54.65 m to the north from the KASCADE center195
because this detector was not considered from the beginning). In196
addition, this selection lowers the influence of the geomagnetic field on the197
mean muon directions. Below 40 m the punch-through effects forbid a valu-198
able muon tracking and above 80 m the highly asymmetric azimuthal event199
9

distribution (see Fig. 6.3 in Ref. [31]) is difficult to correct. For Grande re-200
constructed high-energy events the distance range 250 m - 360 m was chosen201
to avoid extended punch-through and trigger efficiency problems for large dis-202
tances. For KASCADE (Grande) selections a combined Array-MTD analysis203
is only reliable above shower size lg(Ne) ≥ 4.8 (6.0) and lg(Nµ) ≥ 4.1 (5.5).204
In this work the experimental data on showers with zenith angles θ < 18◦205
were analyzed. The mean height values < hµ > were calculated in the alti-206
tude range up to 12 km along the shower axis, where the majority of muons207
with energy exceeding 0.8 GeV at ground are produced. For example, as208
CORSIKA simulations show, in a 1016 eV proton induced shower about 90%209
of such muons are produced in this altitude range. Despite of the fact that210
the first encounters with nuclei of the atmosphere occur at even higher al-211
titudes, they are not considered in this work, both in data and simulations,212
because of their large uncertainty. The value of 12 km was chosen because213
at this altitude, and for the selected distance range of investigated muons to214
the shower core, the uncertainties in the ρ angle values become comparable215
to the values themselves.216
0
1
2
3
4
5
6
7
<h > [km]
0 100 200 300 400 500 600 700
Fe, 10 eV16
Fe, 10 eV17
H, 10 eV16
H, 10 eV17
[m]
CORSIKA + QGSJetII +
FLUKA2006
µ
E > 0.8 GeVµ
Figure 4: Mean muon production heights observed at different distances from the showercore in CORSIKA simulated vertical showers for proton and iron primaries and two fixedprimary energy values [47].
Employing the ρ and τ angles to define the orientation of muon track with217
respect to the shower axis together with the relative distance Rµ from the218
muon hit to the shower core position, the height hµ can be calculated. This219
can be done along the muon track, which is the appropriate way to consider220
absorption or interaction of muons in showers [45, 46].221
Another approach, used in the present work, is the determination of the222
height hµ along the shower axis. One way is to use the relation hµ = Rµ/ tan ρ223
10
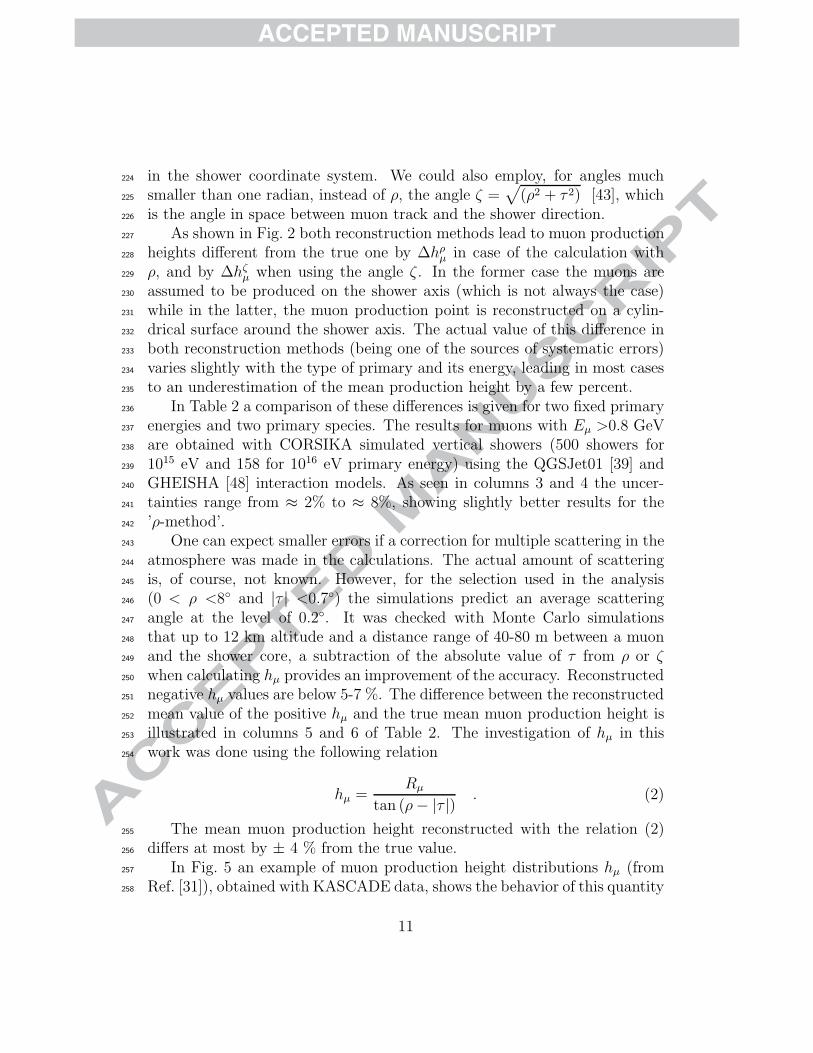
in the shower coordinate system. We could also employ, for angles much224
smaller than one radian, instead of ρ, the angle ζ =√
(ρ2 + τ 2) [43], which225
is the angle in space between muon track and the shower direction.226
As shown in Fig. 2 both reconstruction methods lead to muon production227
heights different from the true one by ∆hρµ in case of the calculation with228
ρ, and by ∆hζµ when using the angle ζ . In the former case the muons are229
assumed to be produced on the shower axis (which is not always the case)230
while in the latter, the muon production point is reconstructed on a cylin-231
drical surface around the shower axis. The actual value of this difference in232
both reconstruction methods (being one of the sources of systematic errors)233
varies slightly with the type of primary and its energy, leading in most cases234
to an underestimation of the mean production height by a few percent.235
In Table 2 a comparison of these differences is given for two fixed primary236
energies and two primary species. The results for muons with Eµ >0.8 GeV237
are obtained with CORSIKA simulated vertical showers (500 showers for238
1015 eV and 158 for 1016 eV primary energy) using the QGSJet01 [39] and239
GHEISHA [48] interaction models. As seen in columns 3 and 4 the uncer-240
tainties range from ≈ 2% to ≈ 8%, showing slightly better results for the241
’ρ-method’.242
One can expect smaller errors if a correction for multiple scattering in the243
atmosphere was made in the calculations. The actual amount of scattering244
is, of course, not known. However, for the selection used in the analysis245
(0 < ρ <8◦ and |τ | <0.7◦) the simulations predict an average scattering246
angle at the level of 0.2◦. It was checked with Monte Carlo simulations247
that up to 12 km altitude and a distance range of 40-80 m between a muon248
and the shower core, a subtraction of the absolute value of τ from ρ or ζ249
when calculating hµ provides an improvement of the accuracy. Reconstructed250
negative hµ values are below 5-7 %. The difference between the reconstructed251
mean value of the positive hµ and the true mean muon production height is252
illustrated in columns 5 and 6 of Table 2. The investigation of hµ in this253
work was done using the following relation254
hµ =Rµ
tan (ρ − |τ |) . (2)
The mean muon production height reconstructed with the relation (2)255
differs at most by ± 4 % from the true value.256
In Fig. 5 an example of muon production height distributions hµ (from257
Ref. [31]), obtained with KASCADE data, shows the behavior of this quantity258
11

Table 2: Dependence of the systematic mean muon production height errors (in % of thetrue value) on the reconstruction method
1 2 3 4 5 6Primary E0 [eV] ∆hρ
µ ∆hζµ ∆hρ
µ(cor) ∆hζµ(cor)
H 1015 −3.1% −4.0% +2.1% +2.4%Fe 1015 −7.3% −8.4% −3.5% −3.1%H 1016 −1.8% −2.7% +4.2% +4.3%Fe 1016 −5.0% −5.7% −0.5% +0.02%
in a wide range of primary energy (expressed by lg(N trµ )). Event selection259
differs from the one used for the analysis in this work in order to show260
some general features of the distributions. These distributions indicate that261
the production heights may extend to very large values. For large lg(N trµ )262
values (large primary energies) the deeper shower development is mostly263
demonstrated by relatively fewer muons from large hµ.264
Further systematic effects are to be considered. In the region of small265
lg(N trµ ) in Fig. 5, the measured hµ values can have a bias. For a successful266
reconstruction of the shower parameters on the KASCADE array level, the267
showers must have a certain electron particle number Ne at ground. At268
small energies only showers which fluctuate to lower production heights have269
enough particles and are fully reconstructed. Those showers are very likely270
proton induced showers, and hence a bias may be present in the analysis for271
small lg(N trµ ) due to the smaller trigger efficiency for iron, being of about272
80% at the lowest lg(N trµ ) bin.273
With increasing shower zenith angle θ, < hµ > is shifting somewhat274
towards larger values, but the change amounts to less than hundred meters275
in the whole range of θ. Similar shifts are observed for an analysis using full276
simulation, only. This effect is small compared to the difference of < hµ >277
for proton and iron induced showers, which amounts to about 1000 m (see278
Fig. 4), when using the cuts employed in our analysis.279
5. Muon Production Heights in Showers Induced by Light and280
Heavy Primary Masses281
The electron size lg(Ne) and muon size lg(N trµ ) provide an opportunity to282
separate light from heavy primary CR initiated showers. The size parameters283
12

3.25-3.50
3.50-3.75
3.75-4.00
4.00-4.25
4.25-4.50
4.50-4.75
4.75-5.00
lg(Nµtr)
1
10
10 2
10 3
10 4
10 5
0 10 20 30 40 50hµ [km]
dN
/dh
µ
Figure 5: An example of muon production height distributions from Ref. [31] shows thebehavior of this quantity in a wide range of lg(N tr
µ ), i.e. primary energy. The selection usedcomprises a radial distance range of 40-120 m and shower zenith angles θ <30◦. Radialand tangential angle cuts are the same as used in this article (ρ=0-8◦ and |τ | <0.7◦).Relative yields reflect the CR flux in different lg(N tr
µ ) intervals. Lines connect the datapoints to guide the eyes.
lg(Ne) and lg(N trµ ), as determined from the KASCADE array, are for the284
following studies corrected for their shower angle dependent attenuation, see285
Ref. [49], employing the formula lg(N0i ) = lg(Ni(θ))+0.43·(1022/Λi)·(sec θ−286
1), where Λe= 175 g · cm−2, Λµ = 823 g · cm−2, and i stands for e or µ,287
respectively. The ratio of the corrected parameters, namely lg(N tr,0µ )/ lg(N0
e ),288
turned out to be sensitive to the mass composition of primary CR [33, 37].289
A ratio lg(N tr,0µ )/ lg(N0
e ) of 0.74, which corresponds roughly to Nitro-290
gen, is used to divide the experimental shower data into samples enriched291
with light and heavy primaries [37, 31]. Grouping the showers in the two-292
parameter space lg(N0e ) vs. lg(N tr,0
µ ), according to lg(N tr,0µ ) > 0.74 lg(N0
e )293
or lg(N tr,0µ ) ≤ 0.74 lg(N0
e ), heavy or light primary CR particles are selected,294
respectively. Using this coarse selection of the showers their muon tracks can295
13

be used to calculate the muon production height hµ along the shower axis.296
0.1
0.2
0.1
0.2
0.1
0.2
light heavy
0.1
0.2
0 1 2 3 4 5 6 7 8 9
tr, 0
hµ
-1 0 1 2 3[deg] [km]
rel.
yiel
d
ρ
3.25<lg(Nµ )<3.50
3.75<lg(Nµ )<4.00
4.25<lg(Nµ )<4.50
4.75<lg(Nµ )<5.00
tr, 0
tr, 0
tr, 0
Figure 6: Radial angle distributions (left panel) and muon production height distributionshµ along the shower axis (right panel) for light and heavy CR primary mass enrichedshowers and for different lg(N tr,0
µ ) intervals. Shower core distances range is 40-80 m, andshower angles θ <18◦. Lines connect the data points to guide the eyes.
Fig. 6 shows the distributions of the radial angle and muon production297
height (left and right panel, respectively) for the selected distance range 40-298
80 m for different primary energies (expressed in terms of the muon number).299
Besides the dynamical shift of the radial angle distributions with increasing300
muon number, the figures show an increasing sensitivity to the mass of the301
CR particle. The drop to zero yield at small hµ relates to the cuts on ρ and302
τ angles and the µ-hit shower core distance range employed in the analysis.303
At high energies large muon production altitudes are predominantly cre-304
ated by heavy primaries. Narrower distributions, differently for light and305
heavy CR primaries, indicate a decrease of fluctuations in the < hµ > para-306
meter with increasing primary energy. Fig. 7 compares the muon production307
height distributions of Fig. 6 to simulation results for proton (triangles) and308
14

0.1
0.2
0.1
0.2
0.1
0.2
rel.
yiel
d
0.1
0.2
0 1 2 3 4 5
light heavy
6 7 8 hµ[km]
H Fe
3.75<lg(Nµ)<4.00
4.25<lg(Nµ)<4.50
4.75<lg(Nµ)<5.00
5.25<lg(Nµ)<5.50
Figure 7: Muon production height distributions along the shower axis hµ for light (opencircles) and heavy (full circles) enriched shower samples and a shower core distancerange 40-80 m, and shower zenith angles θ <18◦ compared to CORSIKA simulationsemploying QGSjetII +FLUKA models for proton (H) and iron (Fe) primaries. Herelg(Nµ) ≈ lg(N tr,0
µ ) + 0.5 (see Section 3). Lines connect the data points to guide theeyes.
iron (squares) primaries. The CORSIKA simulations were performed with309
ver. 6.307 of the code using the QGSJetII and, for interaction energies below310
200 GeV, FLUKA2002.4 models [50].311
Detector simulations were based on GEANT [51]. Identical cuts for data312
and simulations were used and the slope of the simulated energy spectrum313
was weighted to −2.7 below and to −3.1 above the ’Knee’. In Fig. 7 (as314
well as in Fig. 6) the plots of hµ are normalized to integral yield equal one315
in the full range up to 12 km, but they are shown to 9 km only in order to316
expand the low production height region. However, the following discussion317
of the features seen at high values of hµ is also true for the production heights318
15

above 9 km. In this expanded region we see up to ≈ 3.5 km that data are319
embraced by the simulation results. Muons observed there, up to lg(Nµ) ≈320
5.0, stem from hadronic interactions of energies below 200 GeV, modeled in321
simulations with FLUKA2002.4 code. At higher lg(Nµ) - the lowest panel in322
Fig. 7 - contribution from higher interaction energies in this region increases.323
This suggests that low-energy interaction model FLUKA describes the data324
well. Muons produced above ≈ 3.5 km have parent mesons predominantly325
created at interaction energies larger than 200 GeV, which are modeled in326
simulations by the QGSJetII code. We observe here that the high-energy327
model has problems in describing the data.328
The comparison reveals more muons at high production heights in the329
simulations (the distributions are shifted to the right). This excess of muons330
in the simulations at high altitudes with respect to the data may indicate331
that muons produced higher up have too high an energy and do not decay,332
surviving to the observation level, what is not observed in the measurements.333
The same effect will occur when the simulated mesons have too small an334
energy in the region of the first or second interaction, and would decay earlier335
than in reality. Shifting the maximum of shower development in the models336
deeper in the atmosphere will act in the direction of reducing the observed337
discrepancy with the data.338
lg(Nµ )
4
5
6
light
heavy
<hµ>
[km
]
3
3.6 4.0 4.4 4.8 tr,0
Figure 8: Experimental values of the mean muon production height along the shower axis< hµ > vs. lg(N tr,0
µ ) for light and heavy primary mass enriched showers and a showercore distance range 40-80 m, and shower angles θ <18◦. The bands bracketing the datapoints represent variations for the lg(N tr,0
µ )/ lg(N0e ) ratio from 0.73 to 0.75.
Simulation results shown in Fig. 7 are similar to the ones obtained with339
the older QGSJet01 model, which predicted the mean hµ values shifted340
16

slightly up by ≈ 150 m.341
In Fig. 8 experimental values of the mean muon production height < hµ >342
as a function of lg(N tr,0µ ) are shown. A good separation between light and343
heavy enriched primary CR particles is seen. The dependence on lg(N tr,0µ )344
suggests that production heights corrected for an appropriate elongation rate345
will exhibit a clear remaining dependence on the CR particle mass. Mean346
muon production heights for light and heavy mass enriched showers exhibit347
a height difference of about 12%, which is 3-4 times the systematic error348
quoted in Table 2.349
Shaded bands show how < hµ > changes when the boundary between350
’heavy’ and ’light’ is moved by ± 0.01 in the lg(N tr,0µ )/ lg(N0
e ) ratio, which is351
10-20 % of the peak position difference in the distributions of this ratio for352
proton and iron primary induced showers [31]. One observes that the light353
sample is more sensitive to such a change giving a broader band, what can354
be explained by larger fluctuations in the shower development than in case355
of showers initiated by heavy CR primaries.356
6. Mean Muon Production Depth vs. Electron and Muon Shower357
Sizes358
In the previous section (Figs. 6, 7 and 8) the muon production height359
was shown to depend on the mass of the CR primary and its energy. In the360
following we will study this mass dependence of the muon production height361
in more detail. For this purpose we will use production height values refer-362
enced to the top of the atmosphere, called muon production depth, denoted363
as Hµ, and expressed in units of atmospheric depth (g·cm−2) using the US-364
Standard atmosphere [38] in data - corrected for temperature and pressure -365
and simulations. Seasonal differences between local atmospheric conditions366
near the KASCADE site and the US Standard are smaller than ± 2 % (see367
Fig.2.1 in Ref. [38]) having little influence on our final results.368
Usually, shower development is described by the evolution of its electro-369
magnetic component, where Xmax is understood as the atmospheric depth370
at which the number of electrons and photons of the air shower reaches its371
maximum. Xmax is considered to be a primary mass sensitive parameter.372
Concerning muons which stem dominantly from π± decays, the correspond-373
ing production height at which most muons are created may also provide a374
mass sensitive observable.375
17

To reveal the primary mass sensitivity of the Hµ parameter one has to376
subtract the energy dependence expressed in terms of the elongation rate,377
taking into account the shower size observables.378
Subtracting from the production depth Hµ for each track in a shower379
the energy dependent penetration depth we use the following relation for the380
mass dependent HAµ381
HAµ = Hµ − Dµ(lg(N tr,0
µ ) − 3.6) + De(lg(Ne) − 4.8) , (3)
where the parameter offsets originate from the analysis thresholds.382
For the following analysis the elongation rate components (the coeffi-383
cients in equation (3)), similar to the energy dependence of Xmax observed384
in EAS simulations, were assigned the following values: Dµ=70 g·cm−2 and385
De=20 g·cm−2 per decade. These values have been varied iteratively by up386
to ± 20 g·cm−2 to obtain the slope of the middle HAµ ridge in the parame-387
ter lg(N0e ) vs. lg(Nµ) representation reproducing the lg(Nµ)/ lg(N0
e ) ratio of388
heavy-light separation (Section 5). We assume that the elongation rates Dµ389
and De are independent of the primary mass.390
This two-component correction on Hµ is similar to the one for lg(E0) in391
equation (1). There, contributions from lg(Ne) and lg(Nµ), reflecting the392
complementary information on shower development, are also employed. The393
shower development leads also to different fluctuations in those shower para-394
meters. It is known from earlier studies that the lg(Ne) parameter exhibits395
fluctuations to large values, in agreement with the simulations, while the396
lg(N trµ ) parameter shows little fluctuations. On the contrary, the Hµ para-397
meter (independent of shower angle) is fluctuating towards smaller values.398
Therefore, we may argue that in the corrections of Hµ for the elongation rate399
fluctuations will cancel to some extent and thus, the resulting mass depen-400
dent muon production depth HAµ represents a stable observable. In Fig. 9401
muon production depth distributions are compared for three Nµ size bins402
before (Hµ) and after (HAµ ) correction for the elongation rate, according to403
equation (3).404
Using equation (3) the presentation shown in Fig. 10 has been obtained.405
Here < HAµ > represents the average mass dependent production depth HA
µ406
per shower having at least one muon track in the MTD. Above the logarithmic407
muon number 5.5 an analysis from the Grande array data in a separate408
distance range is considered. As a result one can identify regions of different409
mass dependent mean muon production depths in the two-parameter space410
18

5000
10000
15000
0 200 400 600 800 Hµ [g/cm²]
dN
/dH
µ
0-18deg Data
(A)
(A)
Hµ 4.5<lg(Nµ)<4.7 Hµ
Hµ 4.9<lg(Nµ)<5.1 Hµ
Hµ 5.3<lg(Nµ)<5.5 Hµ
A
A
A
Figure 9: Muon production depth distributions are compared for three lg(Nµ)-size binsbefore (open symbols) Hµ and after (full symbols) HA
µ correction for the elongation rate,according to the equation (3). The depth cut corresponds to 12 km.
lg(N0e ) vs. lg(Nµ) which themselves vary over almost 3 orders of magnitude.411
These regions of distinct < HAµ > are ’color’ coded with a 40 g·cm−2 step412
size. Based on the assumption that the < HAµ > parameter is not prone to413
large fluctuations, the spread of the regions of the same ’color’ is a measure414
of the correlations in the two other fluctuating shower parameters lg(N0e ) and415
lg(Nµ).416
The borders between different regions are marked for some cases with417
solid or dashed lines with a certain slope in the lg(N0e ) vs. lg(Nµ) plane. In418
the middle ridge the solid line has the previously employed slope for selecting419
light or heavy primary particles, being now equal to 0.83 instead of 0.74, due420
to the transformation to lg(Nµ). For regions away from the middle different421
slopes of the ridges may be observed, as in the case of the dashed line422
which marks the ridge of one of the heavier groups of primaries.423
Data boundaries are curved because of the limited statistics of showers and424
CR primary types, as shown in Fig. 22 in Ref. [26].425
An integral number of muons for a nucleus A induced shower is426
NAµ ∼ A(E0/A)β , (4)
where β ≈ 0.85 [53]. Taking into account that Xmax ∼ lg(E0/A) + const427
and assuming that XAmax,µ exhibits a similar lg(E0/A) dependence as Xmax,428
using equation (4), we obtain:429
19

4.5 5.5 lg(Nµ)
640
600
560
Rµ=250m-360mlg
(Ne )
Rµ=40m-80m
< Hµ >[g/cm²]0-18degA
0
Figure 10: lg(N0e ) vs. lg(Nµ) matrix with effective mean muon production depth < HA
µ >along the z-axis. Borders between different regions are marked with solid or dashed lines(see text). Here, lg(Nµ) ≈ lg(N tr,0
µ )+0.5 (see Section 3). Above lg(Nµ)=5.5 data from theGrande array in a distance range 250 - 360 m are considered and normalized to KASCADEdata.
XAmax,µ ∼ 1/β[lg(NA
µ ) − (1 − β) lg(A)] . (5)
Fig. 9 shows that in the HAµ range of our analysis (> 200 g·cm−2), XA
max,µ430
peak position) is larger than the < HAµ > value, due to the tails in HA
µ431
distributions towards the small values. However, this XAmax,µ in Fig. 9 is432
close to the largest < HAµ > value in Fig. 10.433
A scale for < HAµ > regions corresponding to ’iron’ and ’proton’ primaries434
can be estimated based on an analogy to the electromagnetic cascade, ignor-435
ing the difference between XAmax,µ and < HA
µ >. For a 1016 eV proton shower436
we obtain the number of hadronic cascade generations to be n ≈ 5.5 from437
Xpmax,µ ≈ 660 g·cm−2 in Fig. 10, having in mind that Xp
max,µ = n·λπ−air ≈ 5.5438
· 120 g·cm−2≈ 660 g·cm−2, and that a fraction of pions decay immediately439
into muons. For heavy CR particles we read from Fig. 10 a corresponding440
value XFemax,µ ≈ 540 g·cm−2 ≈ 4.5 · 120 g·cm−2, leading to 4.5 generations441
and providing the scale of equation (5). For proton primaries the normal-442
ization of equation (5) is achieved by setting 1/β ≈ 138 g·cm−2. The other443
extreme value for equation (5) for iron would lead to XFemax,µ ≈ Xp
max,µ−29.5444
g·cm−2 · ln(56) ≈ 540 g·cm−2.445
The slope of the lines in Fig. 10 can be also interpreted using the muon446
number vs. energy relation in equations (4) and (1). The exponent β can447
20

be connected to the amount of inelasticity involved in the processes of A-air448
collisions [53]. A comparatively steeper slope observed in the dashed line449
may correspond to an increased inelasticity [53] with respect to the light CR450
primaries, which may be a subject of further studies.451
1
1.5
2
corr
ecti
on
fact
or
4.1 5.1 6.1 lg(Nµ)
Hµ [g/cm²]
<540540-580580-620
>620
A
all
Data
Figure 11: Flux correction factors due to the acceptance and the geometry differencesbetween the array and the MTD (see text for details). The curve represents a polynomialfit.
To derive the CR flux spectra from the < HAµ > information in Fig. 10452
one has to introduce correction factors. They are obtained from the ratio453
of all registered showers which trigger KASCADE in the 40-80 m distance454
range to all showers with at least one track inside the MTD which survive the455
analysis cuts. Flux correction factors are shown in Fig 11. Correction values456
take into account the efficiency of the registration and reconstruction of muon457
tracks, as well as the geometry of the MTD. The size of the clusters on wires458
and strips in the MTD becomes large for high particle densities. Therefore,459
due to the software limit on these sizes (see Section 2) large showers are only460
accepted further away within the 40-80 m interval. These corrections are461
almost independent of the selection of < HAµ > bins where the statistics is462
sufficient.463
Sorting the lg(N0e ) vs. lg(N tr
µ ) events by regions of constant < HAµ > in464
the matrix of Fig. 10, then multiplying their number by the flux correction465
factors, and applying the almost mass independent equation (1) for lg(E0)466
the energy spectra of relative production depth abundances are obtained and467
shown in Fig. 12. So far, no explicit mass range assignment is given. The468
spectra are shown together with their systematic and statistical error combi-469
nations. The errors with wide boundary bars are statistical while the short470
21

boundary bars indicate the systematic variation of the HAµ regions between471
± 20 g·cm−2 multiplied by the correction factors from Fig. 11. In Fig. 12 the472
Grande data, analyzed in the separate distance range (see Fig. 10), are nor-473
malized to KASCADE flux in two bins below and above lg(E0/GeV ) =7.7,474
i.e. in the overlapping region. The spectra reveal distinct features. While475
the ’low mass’ (HAµ large) spectra show a rapid drop with increasing shower476
energy, ’medium’ and ’heavy mass’ (HAµ small) spectra seem to overtake477
at large primary energy. This feature is model independent because only478
the experimental data are used for obtaining mean muon production depth479
abundances.480
In the present analysis - due to the detection threshold of the MTD - a481
small fraction of tracks (≈ 15 %) may be missing at small lg(Nµ) (Fig. 11),482
leading to a bias in the light particle ’mass’ interpretation. Unfortunately,483
our result cannot contribute to the discussion on the behavior of the total484
CR flux spectrum at higher energies, because the MTD detection area is too485
small and the amount of collected data limited. The required corrections486
from Fig. 11 would become prohibitively large. However, as indicated by the487
dashed line in Fig. 12, the total flux spectrum is in good agreement with the488
KASCADE spectrum obtained by an unfolding technique [26].489
Table 3 provides a collection of the fluxes for different muon production490
depth HAµ windows showing results for every second bin in Fig. 12. The491
errors of the fluxes are dominated by systematic errors.492
102
103
2.5
-1.5
-1E
dN
/dE
[m²
sr s
GeV
]
Hµ [g/cm²]
<540540-580580-620
>620
A
all
0-18deg Data
lg(Eo)[GeV]
00
6 6.5 7 7.5 8
Figure 12: Energy spectra for primaries which produce muons at different effective muonproduction depth HA
µ ; above lg(E0/GeV ) = 7.7 the Grande array data analysed in aseparate distance range are considered. The dashed line reproduces the CR spectrum asmeasured by KASCADE - Ref. [26].
22
10
20
30
40 Hµ [g/cm²]
<540540-580580-620>620
A
d²<
Mµ>
/dlg
(Nµ)*d
lg(N
e )
4.1 5.1 lg(Nµ)
0-18deg Data
6.1
0
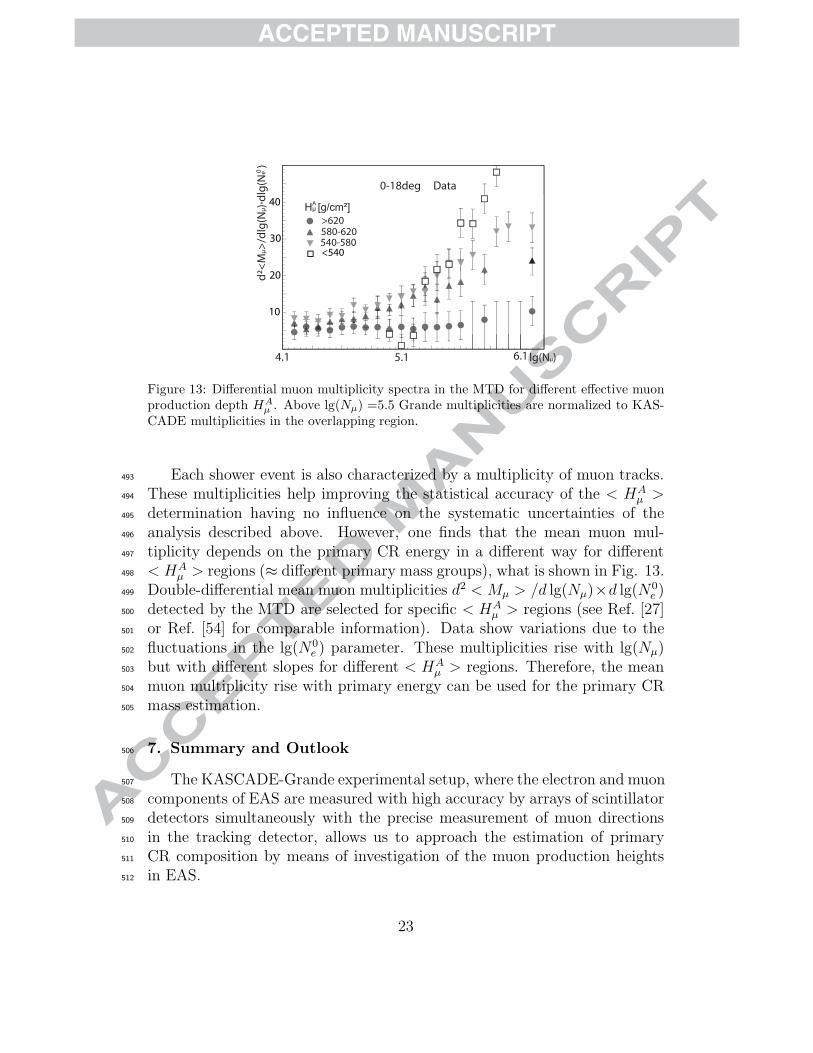
Figure 13: Differential muon multiplicity spectra in the MTD for different effective muonproduction depth HA
µ . Above lg(Nµ) =5.5 Grande multiplicities are normalized to KAS-CADE multiplicities in the overlapping region.
Each shower event is also characterized by a multiplicity of muon tracks.493
These multiplicities help improving the statistical accuracy of the < HAµ >494
determination having no influence on the systematic uncertainties of the495
analysis described above. However, one finds that the mean muon mul-496
tiplicity depends on the primary CR energy in a different way for different497
< HAµ > regions (≈ different primary mass groups), what is shown in Fig. 13.498
Double-differential mean muon multiplicities d2 < Mµ > /d lg(Nµ)×d lg(N0e )499
detected by the MTD are selected for specific < HAµ > regions (see Ref. [27]500
or Ref. [54] for comparable information). Data show variations due to the501
fluctuations in the lg(N0e ) parameter. These multiplicities rise with lg(Nµ)502
but with different slopes for different < HAµ > regions. Therefore, the mean503
muon multiplicity rise with primary energy can be used for the primary CR504
mass estimation.505
7. Summary and Outlook506
The KASCADE-Grande experimental setup, where the electron and muon507
components of EAS are measured with high accuracy by arrays of scintillator508
detectors simultaneously with the precise measurement of muon directions509
in the tracking detector, allows us to approach the estimation of primary510
CR composition by means of investigation of the muon production heights511
in EAS.512
23

Table 3: Fluxes Φ and systematic errors ∆ for different ”mass” groups (in(m2·sr·s·GeV−1.5)−1).
lg(E0)[GeV] Φ620 ∆620 Φ600 ∆600 Φ560 ∆560 Φ540 ∆540
6.1 551.6 194.1 1641.4 130.5 510.4 324.6 0.0 0.06.3 576.9 133.8 1316.4 109.3 447.5 243.1 3.4 0.06.5 573.6 87.8 1124.7 83.3 375.6 164.9 22.2 11.46.7 312.3 67.1 980.4 106.1 465.7 169.7 6.8 3.66.9 211.7 70.8 669.7 34.7 458.4 105.5 63.5 0.07.1 86.8 22.7 457.7 143.9 471.3 86.4 119.9 80.17.3 72.8 78.6 489.4 10.4 308.5 39.4 157.2 107.67.5 47.7 72.3 131.8 34.2 139.6 72.2 502.8 110.37.7 < 8.7 5.0 < 45.8 31.8 < 47.1 19.1 717.6 194.87.9 < 7.3 16.7 < 48.9 2.2 < 30.9 8.4 496.3 246.08.1 < 4.8 14.6 < 13.2 6.9 < 14.0 14.5 424.1 305.0
It has been shown that certain muon production depth HAµ regions create513
bands in the two parameter lg(Ne) vs. lg(Nµ) space, which can be trans-514
formed into CR energy spectra in the range from ≈ 1015 eV to ≈ 1017 eV515
(Fig. 12). These spectra have features similar to the energy spectra of pri-516
mary mass groups from Ref. [26]. One can state that the behavior of larger517
production depths Hµ describes the ’lighter’ masses and the smaller pro-518
duction depths correspond to ’heavier’ ones. A coarse mass scale may be519
provided by XAmax,µ ∼ ln(A).520
Muon multiplicity distributions provide an extra parameter in determin-521
ing the CR primary mass and future tests for high energy interaction models522
employed in EAS simulations.523
Muons are direct messengers of hadronic interactions, and it is a com-524
mon understanding that they are very well suited for testing the interaction525
models used in simulations and interpretations of the EAS data. The re-526
sults obtained in this work are to some extent based on the QGSJet01 model527
(energy conversion formula (1)) and confirm the effect seen in the spectra528
in Ref. [26], namely, that the lightest masses (here the largest atmospheric529
depths) have a break in the spectrum at lower energies compared to the530
24

heavier (smaller depths) ones. However, the obtained relative abundances of531
various production depth ranges (Fig. 12) are model independent.532
In addition to the investigation of EAS development using triangulation533
of muons the mean pseudorapidity of muons in EAS [47, 52, 55] is a very534
promising tool for tests of the interaction models. This parameter is closely535
related to the rapidity of pions - the most abundant products of high energy536
interactions - and it is highly sensitive to the longitudinal development of the537
shower in the atmosphere. Simulations show [47] that muons produced at a538
certain height Hµ carry to the observation level a certain mean pseudorapidity539
< η >, fairly independent from primary mass and energy. Therefore, Hµ540
provides an average measure of < η > and an excess of certain Hµ values can541
be related to the excess of certain pseudorapidity values in the production542
of mesons at given heights. KASCADE-Grande with its MTD offers the543
possibility of such investigation.544
The discrepancy in the muon production height distributions between545
QGSJet simulations and measurements (Fig. 7) points to the necessity of546
further investigation of high energy interaction models.547
Concerning the muon production height, shower zenith angle ranges larger548
than 18◦ will be investigated in the near future. Also very inclined muons549
studied using the wall modules of the MTD are subject of ongoing investiga-550
tions.551
552
Acknowledgements553
554
The authors would like to thank the members of the engineering and tech-555
nical staff of the KASCADE-Grande collaboration, who contributed to the556
success of the experiment. Our special thanks go to all who over past years557
have contributed to the design and build-up of the MTD. The KASCADE-558
Grande experiment is supported by the BMBF of Germany, the MIUR and559
INAF of Italy, the Polish Ministry of Science and Higher Education (this560
work by grant for the years 2009-2011), PPP-DAAD project for 2009-2010,561
and by the Romanian Authority for Scientific Research CNCSIS-UEFISCSU562
(grant PNII-IDEI no.461/2009, code 1442/2008 and project PN 09 37 01 05).563
564
565
References566
25

References567
[1] P.K.F. Grieder , Extensive Air Showers (Chapter 14), Springer Verlag568
GmbH, First edition, 2010.569
[2] J. Gress et al., Nucl. Instr. and Meth. A 302 (1991) 368.570
[3] O. Catalano et al, Nuovo Cim. C 15 (1992) 759.571
[4] M. Feuerstack et al., Nucl. Instr. and Meth. A 315 (1992) 357.572
[5] W. Rhode et al., Nucl. Instr. and Meth. A 378 (1996) 399.573
[6] L. Horton et al., Nucl. Instr. and Meth. A 325 (1993) 326.574
[7] S.K. Gupta et al., (GRAPES Coll.), Nucl. Phys. B (Proc. Suppl.) 196575
(2009) 153.576
[8] A. Petrukin et al., NEVOD-DECOR experiment, Symposium ”Ad-577
vances in Cosmic Ray Studies”,Karlsruhe, March 2009, (http://www-578
ik.fzk.de/kascade-symposium/).579
[9] S. Ahlen et al., MACRO-Coll., Nucl. Instr. and Meth. A 324 (1993) 337.580
[10] T.K. Gaisser et al., IceCube Coll., Proc. 30th ICRC, Merida, Mexico,581
arXiv:0711.0353, p.15-18.582
[11] M. Ageron et al., ANTARES Coll., Astropart. Phys. 31 (2009) 277.583
[12] D.G. Michael et al., MINOS Coll., Nucl. Instr. and Meth. A 596 (2008)584
190.585
[13] O. Gress et al., TUNKA Coll., Nucl. Phys. B (Proc.Suppl.) 75A (1999)586
299.587
[14] F. Arqueros et al., HEGRA Coll., Astron. Astrophys. 359 (2000) 682.588
[15] S.P. Swordy and D.B. Kieda, Astropart. Phys. 13 (2000) 137.589
[16] H. Falcke et al., LOPES Coll., Nature 435 (2005) 313; W.D. Apel et al.,590
LOPES Coll., Astropart. Phys. 32 (2010) 294.591
[17] R.M. Baltrusaitas et al., Nucl. Instr. and Meth. A 240 (1985) 410.592
26

[18] B. Keilhauer et al., AUGER Coll., Astropart. Phys. 25 (2006) 259.593
[19] J. Milke et al., KASCADE Coll., Proc. 29th ICRC 2005, Pune, India,594
Vol. 6, 125.595
[20] T. Antoni et al., KASCADE Coll., J. Phys. G: Nucl. Part. Phys. 34596
(2007) 2581.597
[21] L. Linsley, J .Phys. G: Nucl. Part. Phys. 12 (1986) 51; L. Linsley, Nuovo598
Cim. C 15 (1992) 743.599
[22] M. Ambrosio et al, Nucl. Instr. and Meth. A 344 (1994) 350.600
[23] T.V. Danilova et al., J. Phys. G: Nucl. Part. Phys. 20 (1994) 961.601
[24] I.M. Brancus et al., Astropart. Phys. 7 (1997) 343.602
[25] G. Navarra et al., KASCADE-Grande Coll., Nucl. Instr. and Meth. A603
518 (2004) 207.604
[26] T. Antoni et al., KASCADE Coll., Astropart. Phys. 24 (2005) 1.605
[27] P. Doll et al., Nucl. Instr. and Meth. A 488 (2002) 517;606
[28] T. Antoni et al., KASCADE Coll., Nucl. Instr. Meth. A 513 (2003) 490.607
[29] J. Zabierowski and P. Doll., Nucl. Instr. and Meth. A 484 (2002) 528.608
[30] C. Buttner et al., KASCADE Coll., Proc. 28th ICRC 2003, Tsukuba,609
Japan, Universal Academy Press Inc., HE 1.1, 33; C. Buttner, PhD610
Thesis, Report FZKA 6948, Forschungszentrum Karlsruhe (2004).611
[31] R. Obenland, PhD Thesis, Report FZKA 7116, Forschungszentrum612
Karlsruhe (2005).613
[32] R. Obenland et al., KASCADE Coll., Proc. 27th ICRC 2001, Hamburg,614
Germany, Vol. 2, 814.615
[33] T. Antoni et al., KASCADE Coll., Astropart. Phys. 14 (2001) 245.616
[34] A. Chiavassa et al., KASCADE-Grande Coll., Proc. 21st ECRS, Kosice,617
Slovakia, 2008, Inst. of Exp. Phys. Slovac Academy of Sciences, (2009)618
437.619
27

[35] W.D. Apel, et al. (KASCADE-Grande Coll.), Nucl. Instr. and Meth.620
A 620 (2010), 202.621
[36] P. Doll et al., KASCADE-Grande Coll., Proc. 31st ICRC, 2009. Lodz,622
Poland, Report FZKA 7516, Forschungszentrum Karlsruhe (2009) 45.623
[37] J.H. Weber et al., KASCADE Coll., Proc. 25th ICRC 1997, Durban,624
South Africa, Vol. 6, 153.625
[38] D. Heck et al., FZKA-Report 6019, Forschungszentrum Karlsruhe626
(1998).627
[39] N.N. Kalmykov and S. Ostapchenko and A.I. Pavlov, Nucl. Phys. B628
(Proc.Suppl.) 52B (1997) 17; S. Ostapchenko, Phys. Rev. D 74, (2006)629
014026.630
[40] R. Glasstetter et al.,KASCADE Coll., Proc. 29th ICRC 2005, Pune,631
India, Vol. 6, 101.632
[41] A. Haungs et al., Proc. 31st ICRC, 2009. Lodz, Poland, Report FZKA633
7516, Forschungszentrum Karlsruhe, (2009) 1.634
[42] K. Bernlohr, Astropart.Phys. 5 (1996) 139.635
[43] J. Zabierowski, K. Daumiller and P. Doll, Nucl. Phys. B (Proc. Suppl.)636
122 (2003) 275.637
[44] L. Pentchev, P. Doll and H.O. Klages, J.Phys.G: Nucl. Part. Phys.638
25 (1999) 1235; L. Pentchev and P. Doll, J. Phys. G: Nucl. Part.639
Phys. 27 (2001) 1459.640
[45] C. Buttner et al., KASCADE Coll., Nucl. Phys. B (Proc. Suppl)641
122 (2003) 289.642
[46] M. Ambrosio, C. Aramo, L. Colesanti, A.D. Erlykin, S.K. Machavariani,643
J. Phys. G: Nucl. Part. Phys. 23 (1997) 219.644
[47] J. Zabierowski et al., KASCADE Coll., Proc. 31st ICRC, 2009. Lodz,645
Poland, Report FZKA 7516, Forschungszentrum Karlsruhe, (2009) 37.646
[48] H. Fesefeldt, Report PITHA-85/02, RWTH Aachen, 1985.647
28

[49] T. Antoni et al., KASCADE Coll., Astropart. Phys. 19 (2003) 703.648
[50] A. Fasso et al., CERN-2005-10, INFN/TC-05/11, SLAC-R-773, 2005;649
A. Fasso et al., arXiv:hep-ph/0306267.650
[51] R. Brun and F. Carminati, GEANT Detector Description and Simula-651
tion Tool, CERN Program Library Long Writeup (1993).652
[52] J. Zabierowski et al., KASCADE Coll., Nucl. Phys. B (Proc. Suppl.)653
151 (2006) 291.654
[53] J. Matthews, Astropart. Phys. 22 (2005) 387.655
[54] M. Bertaina et al., EAS-TOP Coll., Proc. 29th ICRC 2005, Pune, India,656
Vol. 6, 41.657
[55] J. Zabierowski et al., KASCADE Coll., Proc. 29th ICRC 2005, Pune,658
India, Vol. 6, 357.659
29

Figure captions for the article660
661
Fig. 1. Anode wire amplitude spectra for individual odd/even numbered662
wire cells.663
664
Fig. 2. Illustration of the angular correlations in EAS and the definition665
of the radial (ρ) and tangential (τ) angles. The differences between the true666
and the reconstructed hµ values with the two reconstruction approaches - see667
text - are also shown.668
669
Fig. 3. An example of radial angle distributions from Ref. [31] shows the670
behavior of this quantity in a wide range of lg(N trµ ), i.e. of primary energy.671
The selection used comprises a radial distance range 40-120 m, shower zenith672
angles θ < 30◦ and |τ | <0.7◦. Relative yields reflect the CR flux in different673
lg(N trµ ) intervals. Lines connect the data points to guide the eyes.674
675
Fig. 4. Mean muon production heights observed at different distances676
from the shower core in CORSIKA simulated vertical showers for proton and677
iron primaries and two fixed primary energy values [47].678
679
Fig. 5. An example of muon production height distributions from Ref. [31]680
shows the behavior of this quantity in a wide range of lg(N trµ ), i.e. primary681
energy. The selection used comprises a radial distance range of 40-120 m and682
shower zenith angles θ <30◦. Radial and tangential angle cuts are the same as683
used in this article (ρ=0-8◦ and |τ | <0.7◦). Relative yields reflect the CR flux684
in different lg(N trµ ) intervals. Lines connect the data points to guide the eyes.685
686
Fig. 6. Radial angle distributions (left panel) and muon production687
height distributions hµ along the shower axis (right panel) for light and688
heavy CR primary mass enriched showers and for different lg(N tr,0µ ) inter-689
vals. Shower core distances range is 40-80 m, and shower angles θ <18◦.690
Lines connect the data points to guide the eyes.691
692
Fig. 7. Muon production height distributions along the shower axis hµ693
for light (open circles) and heavy (full circles) enriched shower samples and694
a shower core distance range 40-80 m, and shower zenith angles θ <18◦ com-695
pared to CORSIKA simulations employing QGSjetII +FLUKA models for696
proton (H) and iron (Fe) primaries. Here lg(Nµ) = lg(N tr,0µ )+0.5 (see Section697
30

3). Lines connect the data points to guide the eyes.698
699
Fig. 8. Experimental values of the mean muon production height along700
the shower axis < hµ > vs. lg(N tr,0µ ) for light and heavy primary mass en-701
riched showers and a shower core distance range 40-80 m, and shower angles702
θ <18◦. The bands bracketing the data points represent variations for the703
lg(N tr,0µ )/lg(N0
e ) ratio from 0.73 to 0.75.704
705
Fig. 9. Muon production depth distributions are compared for three706
lg(Nµ)-size bins before (open symbols) Hµ and after (full symbols) HAµ cor-707
rection for the elongation rate, according to the equation (3). The depth cut708
corresponds to 12 km.709
710
Fig. 10. lg(N0e ) vs. lg(Nµ) matrix with effective mean muon production711
depth < HAµ > along the z-axis. Borders between different regions are712
marked with solid or dashed lines (see text). Here, lg(Nµ) ≈ lg(N tr,0µ ) + 0.5713
(see Section 3). Above lg(Nµ)=5.5 data from the Grande array in a distance714
range 250 - 360 m are considered and normalized to KASCADE data.715
716
Fig. 11. Flux correction factors due to the acceptance and the geometry717
differences between the array and the MTD (see text for details). The curve718
represents a polynomial fit.719
720
Fig. 12. Energy spectra for primaries which produce muons at different721
effective muon production depth HAµ ; above lg(E0) = 7.7 the Grande array722
data analysed in a separate distance range are considered. The dashed line723
reproduces the CR spectrum as measured by KASCADE - Ref. [26].724
725
Fig. 13.Differential muon multiplicity spectra in the MTD for different ef-726
fective muon production depth HAµ . Above lg(Nµ) =5.5 Grande multiplicities727
are normalized to KASCADE multiplicities in the overlapping region.728
31