muscle oxygen supply and use in type 1 diabetes, from
TRANSCRIPT
HAL Id: hal-02378910https://hal.univ-lille.fr/hal-02378910
Submitted on 25 Nov 2019
HAL is a multi-disciplinary open accessarchive for the deposit and dissemination of sci-entific research documents, whether they are pub-lished or not. The documents may come fromteaching and research institutions in France orabroad, or from public or private research centers.
L’archive ouverte pluridisciplinaire HAL, estdestinée au dépôt et à la diffusion de documentsscientifiques de niveau recherche, publiés ou non,émanant des établissements d’enseignement et derecherche français ou étrangers, des laboratoirespublics ou privés.
Muscle Oxygen Supply and Use in Type 1 Diabetes,From Ambient Air to the Mitochondrial Respiratory
Chain: Is There a Limiting Step?Elsa Heyman, Frederic Daussin, Valerie Wieczorek, Robert Caiazzo, RégisMatran, Phanélie Berthon, Julien Aucouturier, Serge Berthoin, Aurélien
Descatoire, Erwan Leclair, et al.
To cite this version:Elsa Heyman, Frederic Daussin, Valerie Wieczorek, Robert Caiazzo, Régis Matran, et al.. MuscleOxygen Supply and Use in Type 1 Diabetes, From Ambient Air to the Mitochondrial RespiratoryChain: Is There a Limiting Step?. Diabetes Care, American Diabetes Association, 2019, pp.dc191125.�10.2337/dc19-1125�. �hal-02378910�

Full title: Muscle oxygen supply and use in type 1 diabetes, from ambient air to mitochondrial respiratory
chain: Is there a limiting step?
Short running title: O2 from lung to mitochondria in type 1 diabetes
Elsa Heyman, PhD1, Frédéric Daussin, PhD1, Valerie Wieczorek, MD2, Robert Caiazzo, MD, PhD3,4, Régis
Matran MD, PhD5, Phanélie Berthon, PhD6, Julien Aucouturier, PhD1, Serge Berthoin, PhD1, Aurélien
Descatoire, PhD7, Erwan Leclair, PhD1,8, Gaëlle Marais PhD1, Adrien Combes, PhD1, Pierre Fontaine MD,
PhD9 *, Sémah Tagougui, PhD1,10 *.
* Both authors share equal authorship.
1 Univ. Lille, Univ. Artois, Univ. Littoral Côte d’Opale, EA 7369 - URePSSS - Unité de Recherche
Pluridisciplinaire Sport Santé Société, F-59000 Lille, France
2 PRM department, University Hospital of Lille, 59000 Lille, France
3 Service de Chirurgie Générale et Endocrinienne, University Hospital of Lille, 59000, Lille, France
4 UMR_1190 Recherche Translationnelle sur le Diabète, Faculté de Médecine de Lille, INSERM, 59045 Lille,
France
5 Department of Physiology, EA 2689 and IFR 22, Lille, France
6 Univ. Savoie Mont Blanc, Inter-university Laboratory of Human Movement Sciences EA7424, Chambéry,
France
7 Regional Hospital Center of Roubaix, Roubaix, France
8 Université de Sherbrooke, Réseau québécois de recherche sur la douleur, Canada
9 Department of Diabetology, Lille University Hospital, EA 4489, Lille, France
10 Metabolic Diseases, Institut de Recherches Cliniques de Montréal, Montréal, Québec, Canada

Corresponding author:
Elsa Heyman
URePSSS - Unité de Recherche Pluridisciplinaire Sport Santé Société, EA7369 ‘Physical activity, Muscle,
Health’
EURASPORT, 413 avenue Eugène Avinée, 59120, Loos, France
Tel: +33-6-78959955
Fax: +33-320887363
E-mail: [email protected]
Abstract: 250 words
Text: 4211 words
2 tables and 2 figures
1 supplemental figure (S1)
NCT02051504, ClinicalTrial.gov

ABSTRACT
OBJECTIVE
Long before developing clinical complications of type 1 diabetes, oxygen supply and use can be altered during
daily-life activities. We examined all steps of the oxygen pathway, from lungs to mitochondria, using an
integrative ex vivo (muscle biopsies) and in vivo (during exercise) approach, in patients with uncomplicated
type 1 diabetes.
RESEARCH DESIGN AND METHODS
Sixteen adults with type 1 diabetes (T1D) were compared with 16 strictly-matched healthy controls (CON). We
assessed lung diffusion capacity for carbon monoxide (DLCO) and nitric oxide (DLNO), as well as exercise-
induced changes in arterial O2 content (SaO2, PaO2, Hb), muscle blood volume and O2 extraction (near-infrared
spectroscopy). Blood samples were analyzed for metabolic and hormonal vasoactive moieties and factors able
to shift the O2Hb dissociation curve. Mitochondrial oxidative capacities were assessed in vastus lateralis
permeabilized muscle fibers.
RESULTS
Lung diffusion capacity and arterial O2 transport were normal in T1D. However, they displayed blunted
exercise-induced increase in muscle blood volume and O2 extraction despite higher serum insulin and higher
erythrocyte 2,3-diphosphoglycerate, respectively. While complexes I- and II-supported mitochondrial
respiration were unaltered, complex IV relative (vs. complex I) capacity was impaired in T1D, and this was
even more apparent in cases of longstanding diabetes and high HbA1c. V̇O$%&' was lower in T1D vs. CON.
CONCLUSIONS
Early defects in microvascular blood delivery to skeletal muscle and in mitochondrial respiratory chain
complex IV capacity may negatively impact aerobic fitness. These findings are clinically relevant considering
the major role of skeletal muscle oxidation in whole body glucose disposal.
MAIN TEXT
Large clinical trials in type 1 diabetes have underlined the important role of tissues' prolonged exposure to
hyperglycemia in the pathogenesis of microvascular complications (1). Endothelial dysfunction can occur very
early in the disease history, i.e., before overt vascular complications (2), hence altering metabolites and oxygen
(O2) supply to major tissues. Hyperglycemia may also contribute to mitochondrial dysfunction leading to
impairment of tissue energy production (3).
Long before developing overt clinical diabetes complications, oxygen supply and use can be challenged in
daily-life situations such as aerobic exercise. Maximal oxygen consumption (V̇O$%&'), determined during
exhaustive incremental exercise, reflects the highest achievable outcome of the integrated pathway. It relies on
the serial steps of oxygen transfer from lungs to blood, delivery of oxygenated blood through the complicated
branching networks of blood vessels, and its final use in skeletal muscle mitochondria. In type 1 diabetes,
several studies have attempted to investigate some of these serial steps, albeit each of them in an isolated
approach.
While a lower pulmonary diffusion capacity has been described in patients suffering from long-term diabetes
complications (4), it does not appear as clearly in studies including uncomplicated patients (5; 6), possibly
because of the wide range of patients' glycemic control (7). The lungs represent a suitable target for
hyperglycemia-induced vessel dysfunction and non-enzymatic glycation of collagen proteins, because of their
wide capillary network and their significant amount of connective tissue. Concerning the second step of the
oxygen supply process, we have previously suggested normal arterial oxygenation in uncomplicated patients
with poorly-controlled type 1 diabetes, but impaired exercise-induced muscle vasodilatation (8).
The ultimate step of O2 utilization in the mitochondria has been only partially investigated in humans with type
1 diabetes. In vivo non-invasive approaches using either near-infrared spectroscopy (NIRS) (i.e., muscle oxygen
extraction) during aerobic exercise (8) or 31P-magnetic resonance spectroscopy (i.e., calculated maximal rate of
ATP oxidative resynthesis) following a local isometric exercise (9-11) indirectly opened up the possibility of an
impaired muscle extraction and/or mitochondrial use of oxygen in comparison with non-diabetic controls, and
more so in cases with a higher HbA1c level. However, the exact causes for lower in vivo muscle oxygen
extraction and/or use cannot be inferred from these indirect non-invasive approaches. Studies using muscle
biopsies reported normal maximal oxidative enzymatic capacities in subjects with type 1 diabetes (10; 12-14).
Nevertheless, enzymatic assays of the individual steps of the Krebs cycle, beta oxidation, and respiratory chain
complexes cannot reveal how well all enzymes interact with each other and may mask some mitochondrial
defects. In contrast, in situ gold-standard experiments in permeabilized muscle fibers, using a specific
substrate/inhibitor titration approach, provide a detailed characterization of functional intact mitochondria in
their normal intracellular position and assembly, preserving essential interactions (15). Monaco et al. thus
implemented this method to clarify mitochondrial (dys)function in type 1 diabetes and found a decreased
complex II-supported respiration (16). However, the putative consequences of this ex vivo defect were not
tested in vivo.
Therefore, by combining multiple in vivo (particularly during exercise) and ex vivo (in muscle biopsies)
approaches in patients and their strictly matched healthy controls, the present study aims to gain a further in-
depth insight into the impact of type 1 diabetes and glycemic control on all steps of the integrated pathway for
oxygen, from the atmosphere to the mitochondrial respiratory chain in skeletal muscle.
RESEARCH DESIGN AND METHODS
This study was approved by the regional ethical committee (N°EudraCT:2009-A00746-51). Written consent
was obtained before inclusion. Sixteen patients (18–40 years of age) with type 1 diabetes for at least 1 year and
free from microvascular and macrovascular complications, were recruited (T1D group, Table 1). They were
compared to 16 healthy subjects (CON group, normal glucose tolerance checked with OGTT, WHO criteria)
selected (by verbal questioning) to strictly match each of the T1D patients according to gender and to pre-
established ranges or values for age (± 7 years), body mass index (± 4 kg.m-2), moderate-to-vigorous leisure
time physical activity level (±1 h.wk-1 when the patients’ physical activity category was 0 h.wk-1, ± 2 h.wk-1 for
category 2–6 h.wk-1, ± 4 h.wk-1 for category > 6 h.wk-1; pairs of patient/control being in the same category), and
tobacco use (grouped according to no smoking, < 10 cigarettes a day, and > 10 cigarettes a day). The matching
of participants in terms of body composition and physical activity was further checked using dual-energy X-ray
absorptiometry (HOLOGIC-Inc., USA),the validated Modified Activity Questionnaire (17) and accelerometry
(GT1M;Actigraph) over 7 consecutive days.
Subjects came twice to the laboratory. They were requested to refrain from vigorous activity for 48 h prior to
the visits and from using tobacco the morning of both visits.

During the first visit, patients received their usual morning insulin bolus and all subjects consumed a breakfast
(mean ± SD: 8.1 ± 4.7% proteins, 43.3 ± 16.1% lipids, 48.6 ± 15.2% carbohydrates) based on their usual
breakfast and previously verified by a dietitian. Afterwards, lung diffusion capacity for carbon monoxide
(DLCO) and nitric oxide (DLNO) was assessed. An incremental maximal cycling exercise was performed 3.4 ±
0.5 h after breakfast, with concomitant measurements of respiratory gas exchanges, arterial O2 transport,
skeletal muscle perfusion, and O2 extraction. After a 2-min resting period (baseline) sitting on the cycle
ergometer (Excalibur-Sport, Lode, The Netherlands), the test started at 30W and was increased by 20W every 2
min until exhaustion (ambient temperature, 18−20°C).
Following an 8 h overnight fast, on the morning of the second visit, a muscle biopsy was taken from the vastus
lateralis to assess ex vivo intrinsic mitochondrial respiratory capacity in permeabilized skinned muscle fibers.
Alveolar-capillary membrane diffusion capacity (DLCO)
DLCO was assessed following the international guidelines with apnea maintained for at least 8 sec (Medisoft,
Dinant, Belgium). To gain access to the determinants of DLCO, i.e., membrane transfer capacity (Dm) and
capillary lung volume (Vc), DLNO was further evaluated.
Cardiopulmonary response
The electrocardiogram and pulmonary gas exchanges were measured continuously throughout exercise (breath-
by-breath system, Ergocard®). V̇O$%&' (the highest 15-s average value at test termination) was obtained for all
the subjects (Table 2). O2 pulse (ratio V̇O$/heart rate) was used as a stroke volume indicator during exercise
(18).
Muscle perfusion and O2 extraction
Subjects were equipped with an NIRS probe (Oxymon MkIII, Artinis, The Netherlands) to monitor, at 10 Hz,
light absorption (two continuous wavelengths, 780 and 850 nm) across vastus lateralis microvessels throughout
exercise (8). Using the Beer-Lambert law and a normalization against the baseline period, we determined the
changes in muscle oxygenation (oxyhemoglobin, ΔO2Hb), deoxygenation due to O2 extraction

(deoxyhemoglobin, ΔHHb), and blood volume (total hemoglobin, ΔTHb, as the arithmetical sum of ΔO2Hb and
ΔHHb) (19).
Blood analyses (details about assays in Table 2 legend)
Forearm venous (catheter) blood samples were taken at rest and at maximal exercise for measurement of
plasma glucose, catecholamines, serum free insulin, free fatty acids, and glycerol. Likewise, at rest and at
maximal exercise, microcapillary arterialized ear-lobe blood was collected for determination of erythrocyte 2,3-
diphosphoglycerate, lactate, pH, K+, PaCO2 and components of arterial O2 content (CaO2) (i.e., arterial O2
saturation (SaO2), PaO2, Hb).
Mitochondrial respiratory capacity in muscle fibers
A sample of vastus lateralis muscle, obtained by the percutaneous Bergstrom technique after local anesthesia
(lidocaine 2%), was immediately placed into an ice-cold solution mimicking the intracellular fluid (20). The
muscle fibers were separated under a binocular microscope and permeabilized with saponin (50µg/mL) for 30
min (dissolving the sarcolemma but not the outer mitochondrial membrane). After being placed for 10 min in a
respiration buffer (20) to wash out adenine nucleotides and creatine phosphate, skinned fibers were transferred
in a 1 mL water-jacketed oxygraphic cell (Hansatech Instruments, UK) equipped with a Clark electrode.
Oxygen consumption (flux) reflects the first time derivative of oxygen concentration in the respiration
chambers, expressed as µmol O2.min-1.g dry weight-1. Relative contributions of the respiratory complexes I, II,
and IV (CI, CII, CIV), and of oxidation/phosphorylation were assessed using the following sequential additions
of substrates/inhibitors: glutamate–malate (10:5 mM), generating NADH,H+ ((̇GM); the phosphate acceptor,
ADP (2mM) ((̇GM-ADP); the CI inhibitor, rotenone (0.2 µM); the electron donor for CII, succinate (25 mM)
((̇Succ); the uncoupler, CCCP (carbonyl cyanide m-chloro phenyl hydrazone, 1µ M) ((̇Succ-CCCP); the CIII
inhibitor, antimycin A (2.5 µM); and the artificial electron donor to cytochrom c, N,N,N’,N’-tetramethyl-p-
phenylenediamine dihydrochloride (TMPD)–ascorbate (0.5:2 mM), assessing CIV capacity as an isolated step
of the respiratory chain ((̇TMPD). The respiratory control ratio (RCR, (̇GM-ADP/(̇GM) was calculated as an index
of coupling efficiency between oxidation (O2 consumption) and phosphorylation (of ADP to ATP) with CI
substrates. (̇Succ/(̇GM-ADP and (̇TMPD/(̇GM-ADP were calculated as internal normalizations to assess specific CII

and CIV relative capacities independently of mitochondrial content. Mitochondrial capacities to oxidize
carbohydrates ((̇Pyr) and fatty acids ((̇PC) were assessed in separate samples in the respiration buffer, in the
presence of ADP (2 mM) and malate (2 mM), using sequential additions of pyruvate (1 mM) and palmitoyl-
carnitine (135 µM). Maximal citrate synthase activity (expressed per milligrams of protein) was assessed on
muscle samples, immediately frozen in liquid nitrogen and preserved at −80°C, using spectrophotometric assay.
Statistical analyses
Statistical analyses were performed with IBM SPSS 19.0 software. Results are reported as means ± SD unless
otherwise indicated. Non-repeated data were compared between groups with the Wilcoxon matched-pairs test.
Repeated data (normally distributed according to Shapiro-Wilk) were compared between groups (fixed effect)
and according to exercise (fixed effect: rest vs. peak exercise or, for NIRS, ventilatory expiratory flow [V̇)], and
O2 pulse outcomes, relative exercise intensities with a value every 10% V̇O$%&' as well as absolute exercise
intensities in Watts) using linear mixed models for repeated measurements. If significant main effects or
interactions were observed, Bonferroni post hoc comparisons were applied. Correlations were tested using
Spearman's rho. P<0.05 was considered statistically significant.
RESULTS
Demographic and anthropometric data did not differ between groups (Table 1). T1D had lower V̇O$%&' (Table
2) than CON despite comparable levels of habitual physical activity (Table 1) as well as comparable heart rates
at exhaustion. Plasma glucose increased during exercise in both groups, with overall higher values in T1D
(Table 2). No hypoglycemia occured in T1D during exercise.
Alveolar-capillary diffusion (Table 2)
DLCO, as well as its determinants Dm and Vc, did not differ between groups. Vc is influenced by the number of
pulmonary capillaries in contact with ventilated alveoli, which increases during exercise because pulmonary
blood flow and lung volumes increase. O2 pulse, indirectly reflecting stroke volume, as well as V̇) and its
components (tidal volume, respiratory rate), increased throughout exercise without intergroup differences (data
not shown, mixed models: Group and Interaction: NS).
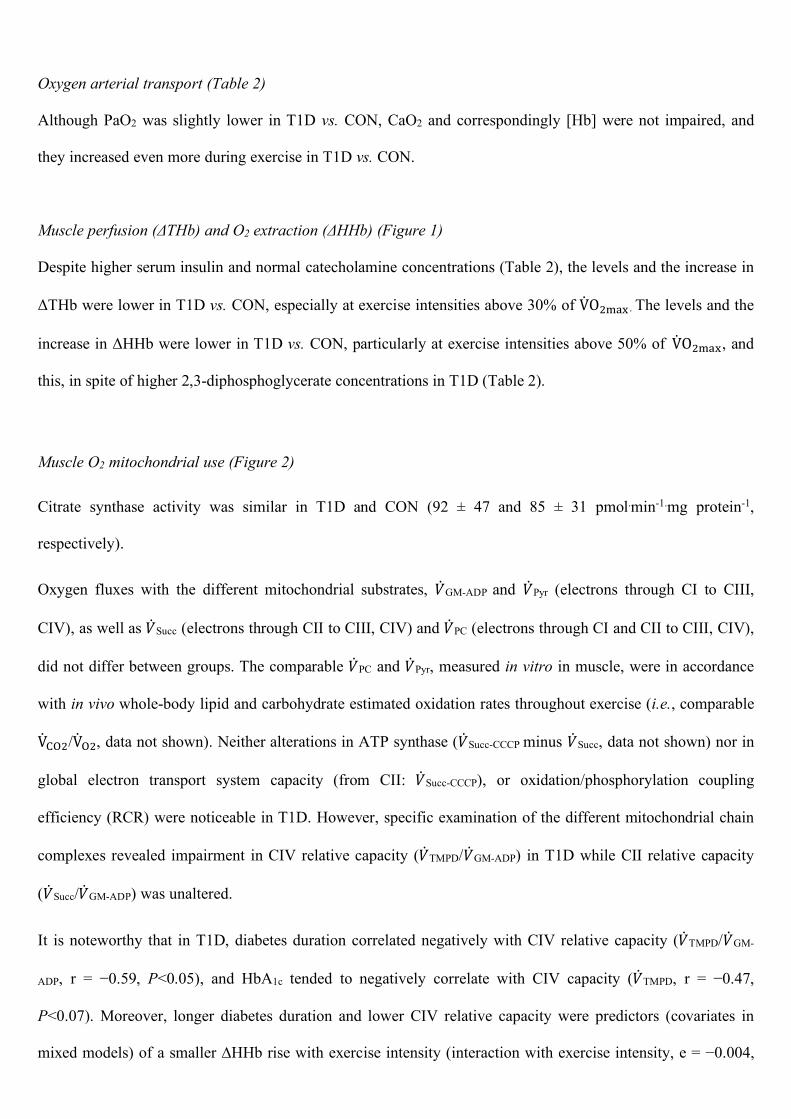
Oxygen arterial transport (Table 2)
Although PaO2 was slightly lower in T1D vs. CON, CaO2 and correspondingly [Hb] were not impaired, and
they increased even more during exercise in T1D vs. CON.
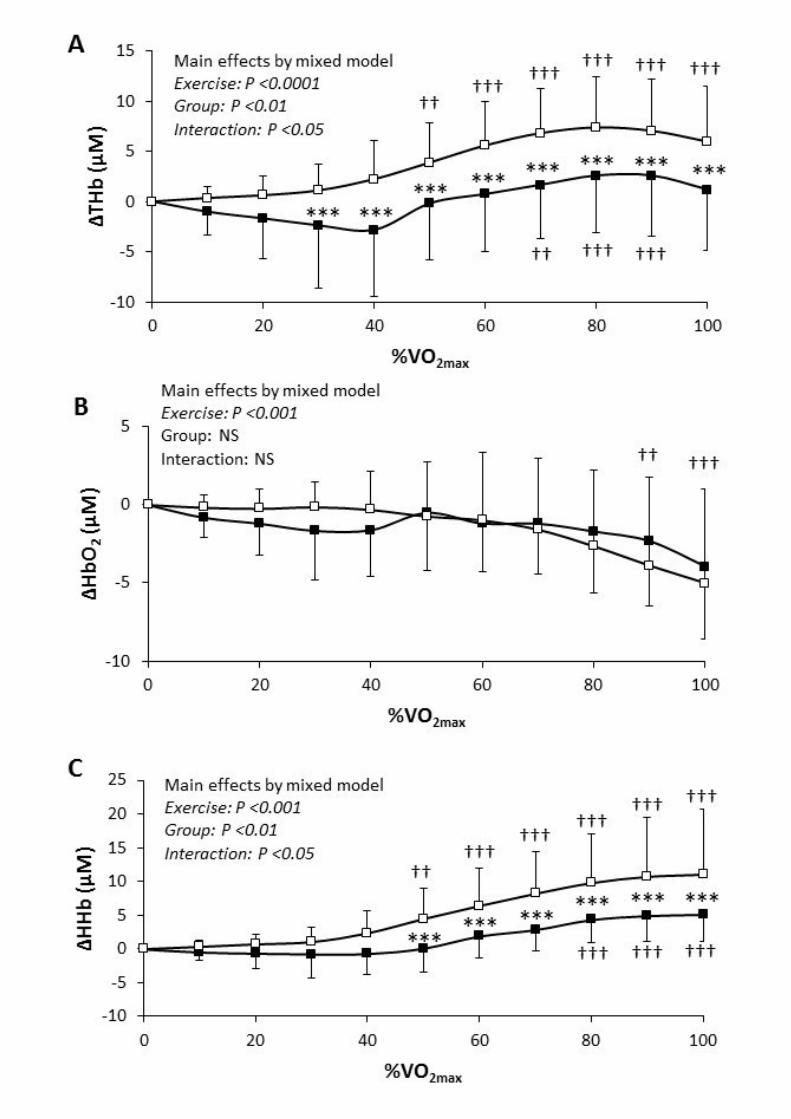
Muscle perfusion (ΔTHb) and O2 extraction (ΔHHb) (Figure 1)
Despite higher serum insulin and normal catecholamine concentrations (Table 2), the levels and the increase in
ΔTHb were lower in T1D vs. CON, especially at exercise intensities above 30% of V̇O$%&' . The levels and the
increase in ΔHHb were lower in T1D vs. CON, particularly at exercise intensities above 50% ofV̇O$%&', and
this, in spite of higher 2,3-diphosphoglycerate concentrations in T1D (Table 2).
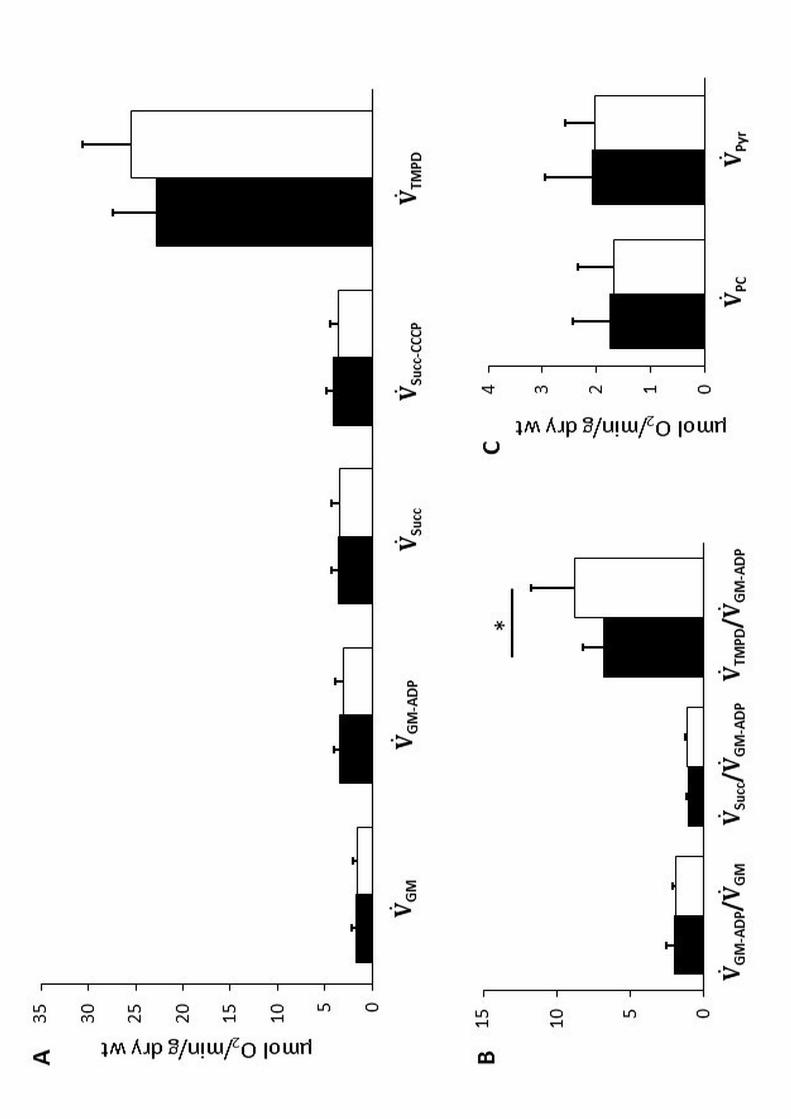
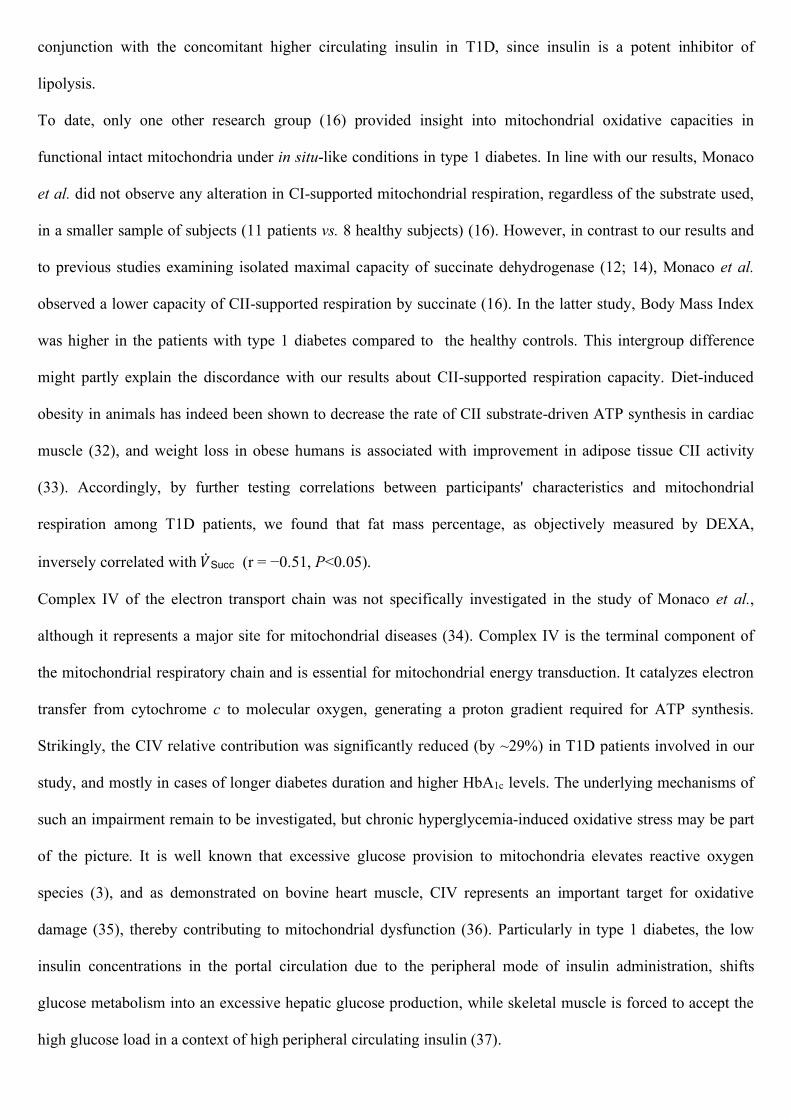
Muscle O2 mitochondrial use (Figure 2)
Citrate synthase activity was similar in T1D and CON (92 ± 47 and 85 ± 31 pmol.min-1.mg protein-1,
respectively).
Oxygen fluxes with the different mitochondrial substrates, (̇GM-ADP and (̇Pyr (electrons through CI to CIII,
CIV), as well as (̇Succ (electrons through CII to CIII, CIV) and (̇PC (electrons through CI and CII to CIII, CIV),
did not differ between groups. The comparable (̇PC and (̇Pyr, measured in vitro in muscle, were in accordance
with in vivo whole-body lipid and carbohydrate estimated oxidation rates throughout exercise (i.e., comparable
V̇+,$/V̇,$, data not shown). Neither alterations in ATP synthase ((̇Succ-CCCP minus (̇Succ, data not shown) nor in
global electron transport system capacity (from CII: (̇Succ-CCCP), or oxidation/phosphorylation coupling
efficiency (RCR) were noticeable in T1D. However, specific examination of the different mitochondrial chain
complexes revealed impairment in CIV relative capacity ((̇TMPD/(̇GM-ADP) in T1D while CII relative capacity
((̇Succ/(̇GM-ADP) was unaltered.
It is noteworthy that in T1D, diabetes duration correlated negatively with CIV relative capacity ((̇TMPD/(̇GM-
ADP, r = −0.59, P<0.05), and HbA1c tended to negatively correlate with CIV capacity ((̇TMPD, r = −0.47,
P<0.07). Moreover, longer diabetes duration and lower CIV relative capacity were predictors (covariates in
mixed models) of a smaller ∆HHb rise with exercise intensity (interaction with exercise intensity, e = −0.004,

P<0.001 and e = +0.02, P<0.001, respectively). The other steps of O2 transport from lung to mitochondria were
not significantly associated with HbA1c or diabetes duration.
In CON, (̇TMPD correlated with V̇O$%&' and maximal aerobic power (r>0.64, P<0.01).
CONCLUSIONS
The novelty of the present study resides in the examination of all steps of the pathway of oxygen from air to
mitochondria by combining both in vivo and ex vivo approaches in patients with uncomplicated type 1 diabetes
and strictly matched healthy controls (Supplemental Figure S1). We showed that alveolar-
capillary membrane diffusion capacity and arterial O2 transport were normal at this stage of the disease.
However, we confirmed that these patients display blunted perfusion and oxygen extraction in active skeletal
muscle microvessels at moderate-to-maximal exercise intensities. The defect in oxygen extraction occurred
despite an overall normal intrinsic mitochondrial maximal respiratory capacity. The only detectable alteration in
the mitochondrial chain appeared at the level of CIV, and all the more among patients with poorly-controlled
longstanding diabetes.
Considering our results and the very few studies having matched their control population on physical activity
levels (6; 21), it seems that DLCO, Dm, and Vc are not impaired and do not correlate with glycemic control in
patients with uncomplicated type 1 diabetes. Thus, the thickening of the pulmonary capillary basal lamina and
pulmonary vasculature dysfunction are probably still absent, or without detectable consequences, when clinical
complications are not overt. It is, however, still possible that some subtle alterations are already present in the
T1D participants, as suggested by the reduced PaO2. Notwithstanding, CaO2 was adequately maintained
throughout exercise in T1D. Subtle alterations in lung function might have been balanced by a higher affinity
for O2 when hemoglobin is glycated (22), leading to normal SaO2. It could have also been the case in previous
study in which patients with longstanding type 1 diabetes displayed alterations of DLCO and Dm in a more
demanding situation (intense exercise in a hypoxic environment) without any repercussion on SaO2 (6).
While the first steps of oxygen supply occurring in the lungs and arteries resulted in a normal arterial O2
transport throughout exercise in T1D, the subsequent steps in muscle microvessels appeared to be impaired.
Very few studies have investigated exercise-induced muscle vasoreactivity in type 1 diabetes. Rissanen et al.
reported reduced muscle blood flow in the active leg of adults with type 1 diabetes, at the peak intensity of an

incremental cycling exercise, using an indirect method based on deoxygenation patterns (%∆HHb) and
theoretical values of peripheral arterial-venous O2 difference (23). In the current work and in our previous study
(8), we as well highlighted an impaired exercise-induced increase in muscle blood volume in response to
maximal incremental exercise.
Admittedly, cardiac output is one determinant of muscle perfusion (24). We used an indirect marker of stroke
volume which appeared normal throughout exercise in T1D. The available literature related to cardiac output in
uncomplicated patients with type 1 diabetes and physical activity-matched controls is conflicting, with one
report highlighting lower cardiac output during submaximal exercise in adolescents (25), while others found no
intergroup differences in adults at submaximal (23) or peak exercise (6; 10). Even if the involvement of central
cardiovascular factors cannot be totally discarded in the understanding of lower muscle blood volume, the latter
is probably also triggered by peripheral microvascular alterations. Supporting this hypothesis, Pichler et al.
found an impaired increase in brachioradialis muscle blood flow in children with type 1 diabetes in the
recovery period of a short rhythmic handgrip test, a local exercise involving a very small muscle mass where
muscle blood flow is unlikely to be limited by cardiac output (26).
Following the few previous studies on exercise-induced muscle microvascular reactivity limits in type 1
diabetes (8; 23), we go here a step further into the understanding of putative underpinning mechanisms.
Although their relative contribution remains controversial, it is well recognized that arterial, capillary, and
venous compartments all participate in the muscle microvascular THb signal (19). Within muscle arterioles,
while norepinephrine represents a vasoconstrictor devoted to blood pressure regulation, epinephrine, as well as
insulin (27), can promote endothelial nitric oxide production and hence vasorelaxation. In our study, while
plasma catecholamines were comparable, serum free insulin was markedly elevated in T1D vs. CON. The high
insulin concentrations, concomitant with higher plasma glucose levels, reflect the well-described state of insulin
resistance in type 1 diabetes, which could presumably also apply at the endothelial cell level, as already proven
in obesity and type 2 diabetes (27). This might explain the impaired muscle vasoreactivity despite higher
insulin concentrations observed in the T1D group. Of note, the higher plasma glucose levels observed in T1D
throughout exercise can certainly not explain the concomitant lower increase in regional blood volume. Dye et
al. (28) indeed found an inverse effect with an increased post-occlusive reactive hyperemia-induced
vasodilatation in hyperglycemic (200 mg.dL-1) compared to euglycemic conditions in patients with type 1

diabetes. The other vasoactive moieties that we considered (PaCO2, K+, pH) did not significantly differ
between the two groups. While muscle microvascular density is presumably normal in uncomplicated type 1
diabetes (10; 16), further studies are needed to fully determine the molecular mechanisms of the reduced
exercise-induced muscle vasoreactivity. Although Fayh et al. (29) hypothesized that nitric oxide production is
not involved in the lower post-exercise blood flow that they observed in young adults with type 1 diabetes, this
result is worth a confirmation since they did not distinguish nitrates from nitrites in their measurements. Only
nitrites are known to sensitively reflect acute changes in nitric oxide synthase activity (30).
Since muscle O2 and high-energy phosphate stores are small, any sustained elevation in muscle ATP turnover
in active skeletal muscle during exercise requires that the rate of O2 delivery to muscle mitochondria precisely
matches its O2 requirements. In the current study, the last step of oxygen delivery to skeletal muscle before its
utilization, i.e., muscle O2 extraction (∆HHb), was significantly blunted in response to increased exercise
intensity in T1D. This was more pronounced in the case of longstanding diabetes, and it occurred despite higher
erythrocyte 2,3-diphosphoglycerate concentrations. As previously suggested (8), this result obtained in a
sample with rather poorly-controlled diabetes could be partly explained by an impairment in oxyhemoglobin
dissociation near active skeletal muscle, induced by the greater affinity of HbA1c for O2 compared to the non-
glycated one (22). It is noteworthy that adjustments in 2,3-diphosphoglycerate concentrations compensatory to
increased HbA1c formation in type 1 diabetes may be insufficient to maintain the normal erythrocyte oxygen
dissociation (31).
Besides the putative reduced oxyhemoglobin dissociation, the influence of impaired mitochondrial O2 use on
the blunted ∆HHb signal cannot be ruled out. To clarify the partition between both mechanisms, we combined,
in an integrated approach, an ex vivo analysis in muscle biopsies with the in vivo exploration of O2 extraction
during exercise. In the T1D group, no major alteration in mitochondrial oxidative capacity appeared.
Mitochondrial content (citrate synthase activity) was comparable in both groups as previously suggested (12;
13). We also found normal overall intrinsic mitochondrial maximal respiratory capacity with the different
mitochondrial substrates. Of note, while ex vivo mitochondrial intrinsic capacity to oxidize palmitate as well as
in vivo free fatty acid oxidation rate were normal in T1D, it remains that lipolysis might be blunted as suggested
by the lower circulating glycerol at rest and at maximal exercise. The latter observation must be considered in
conjunction with the concomitant higher circulating insulin in T1D, since insulin is a potent inhibitor of
lipolysis.
To date, only one other research group (16) provided insight into mitochondrial oxidative capacities in
functional intact mitochondria under in situ-like conditions in type 1 diabetes. In line with our results, Monaco
et al. did not observe any alteration in CI-supported mitochondrial respiration, regardless of the substrate used,
in a smaller sample of subjects (11 patients vs. 8 healthy subjects) (16). However, in contrast to our results and
to previous studies examining isolated maximal capacity of succinate dehydrogenase (12; 14), Monaco et al.
observed a lower capacity of CII-supported respiration by succinate (16). In the latter study, Body Mass Index
was higher in the patients with type 1 diabetes compared to the healthy controls. This intergroup difference
might partly explain the discordance with our results about CII-supported respiration capacity. Diet-induced
obesity in animals has indeed been shown to decrease the rate of CII substrate-driven ATP synthesis in cardiac
muscle (32), and weight loss in obese humans is associated with improvement in adipose tissue CII activity
(33). Accordingly, by further testing correlations between participants' characteristics and mitochondrial
respiration among T1D patients, we found that fat mass percentage, as objectively measured by DEXA,
inversely correlated with (̇Succ (r = −0.51, P<0.05).
Complex IV of the electron transport chain was not specifically investigated in the study of Monaco et al.,
although it represents a major site for mitochondrial diseases (34). Complex IV is the terminal component of
the mitochondrial respiratory chain and is essential for mitochondrial energy transduction. It catalyzes electron
transfer from cytochrome c to molecular oxygen, generating a proton gradient required for ATP synthesis.
Strikingly, the CIV relative contribution was significantly reduced (by ~29%) in T1D patients involved in our
study, and mostly in cases of longer diabetes duration and higher HbA1c levels. The underlying mechanisms of
such an impairment remain to be investigated, but chronic hyperglycemia-induced oxidative stress may be part
of the picture. It is well known that excessive glucose provision to mitochondria elevates reactive oxygen
species (3), and as demonstrated on bovine heart muscle, CIV represents an important target for oxidative
damage (35), thereby contributing to mitochondrial dysfunction (36). Particularly in type 1 diabetes, the low
insulin concentrations in the portal circulation due to the peripheral mode of insulin administration, shifts
glucose metabolism into an excessive hepatic glucose production, while skeletal muscle is forced to accept the
high glucose load in a context of high peripheral circulating insulin (37).

In studies closely mimicking the in vivo conditions by using saponin-permeabilized human muscle fibers, it has
been demonstrated that CIV exerts a tight control on respiration, with only a low excess capacity of cytochrome
oxidase. This is even more pronounced in cases of the lower, physiological oxygen concentrations (38), which
can explain the pathological phenotype of mild cytochrome c oxidase deficiencies in mitochondrial myopathies
(34). Consistently, in our study, the relative CIV capacity defect in T1D may have implications for aerobic
fitness: the lower CIV capacity significantly predicted the blunted exercise-induced increase in muscle O2
extraction in T1D, while higher CIV capacity was associated with higher aerobic fitness in CON.
Last, although changes in skeletal muscle have been intensively studied in rodent models of type 1 diabetes
(39), further investigation in humans is required to supplement our mechanistic understanding of observed
mitochondrial dysfunctions. Rodent models of diabetes are not directly transposable to humans because tight
blood glucose control through multiple insulin injections is virtually impossible to achieve over long periods of
time in animals. In particular, assessing complex IV supramolecular interactions with other complexes might be
of great value. The structural and functional organization of the electron transport chain could indeed change
from freely moving to assembled structures called supercomplexes, which are believed to increase the transport
efficiency and limit the production of reactive oxygen species. In a mouse model of type 1 diabetes mellitus,
overexpression of mitofilin, a protein that affect supercomplex assembly, was even able to restore
mitochondrial function (40).
In summary, maximal aerobic exercise could represent a physiological way to identify possible subclinical
defects in the serial steps responsible for appropriate adjustments of O2 delivery and subsequent mitochondrial
O2 utilization. This investigation revealed that relatively young patients with type 1 diabetes display blunted
muscle microvascular reactivity to exercise along with lower relative capacity of CIV in the mitochondrial
respiratory chain. Early microvascular and muscle oxidative capacity dysregulations, in addition to negatively
impacting aerobic fitness−a strong predictor of cardiovascular risk−could also have deep long-term
consequences on the primary determinants of diabetic complications. Defects in blood and nutrient delivery to
skeletal muscle, as well as altered subsequent mitochondrial oxidation, can indeed have a direct impact on
glycemic and lipid profiles. Skeletal muscle is actually known to be responsible for most of the insulin-
stimulated whole body glucose disposal and for roughly half of the non-insulin mediated glucose uptake in the

presence of hyperglycemia (41). It is also quantitatively the most dominant tissue with respect to lipid
metabolism. In the face of these defects, implementing non-pharmacological interventions like specific exercise
training programs might be of utmost clinical importance, especially since skeletal muscle is a highly malleable
tissue with the capacity of metabolic adaptations in response to contractile activity. The challenge of future
studies will be to ensure that these defects in peripheral tissues perfusion−observed even at light to moderate
exercise intensities−could be improved by training and euglycemia.
ACKNOWLEDGMENTS
The authors would like to thank Dr. C. Fermon, Pr. M. Lepeut (CETRADIMN, Roubaix Regional Hospital),
Dr. F. Baudoux, and Pr. A. Vambergue (Diabetes Department, Lille University Hospital) for helping with the
recruitment of patients; P. Hincker, Dr. P. Rasoamanana, I. Rougeaux, N. Waucquier, and Pr. D. Deplanque
(Clinical Investigation Center, Lille University Hospital), P. Gelé, B. Accart (Biological Resource Center, Lille
University Hospital), E. Lespagnol, L. Vanneste, F. Dehaut, M. Pawlak-Chaouch, F. Prieur, P. Mucci, G.
Baquet (University of Lille), A. Watry, M Nunes-Leclercq (Diabetes Department, Lille University Hospital), E.
Devemy, M. Dominikowski, K. Mimeche, and M. Leclercq (Pulmonary Function Testing Department, Lille
University Hospital) for laboratory assistance; P. Maboudou, A-F Dessein, N. Rouaix, P. Pigny, M.J. Lepoutre,
M.Michiels, and L. Sapyn (Laboratory of Biochemistry and Endocrinology, Lille University Hospital) for blood
analyses; C. Lepretre (Clinical Research Direction, Lille University Hospital); J. Gamain, and S. Cochet
(University of Lille) for administrative management; B. Heyman (University of Rennes), E. Nguyen, and M.
Raffray (University of Montreal) for revising the English.
Funding. This study was supported by grants obtained by E. H. and P. F. from SFD (Société Francophone du
Diabète: grant ALFEDIAM-Roche Diagnostics 2009), from the interregional hospital program of clinical
research (PHRC, 2010), and from the North of France Region (Programme Emergent, 2013).
Duality of interest. There are no potential conflicts of interest relevant to this article to report.
Author contributions. E. H. conceived the experiments and contributed to their performance, analyzed data,
and wrote the manuscript. S. T. performed the experiments and contributed to the conception of the
experiments, data analysis, and writing of the manuscript. F. D contributed to the performance of the

experiments, data analyses, and review of the manuscript. P. F. contributed to the conception of the
experiments, patient recruitment, and review of the manuscript. V. W., R. C., P. B., J. A., E. L., A. C., and G.
M., contributed to the performance of the experiments and review of the manuscript. R. M. and S. B.
contributed to the conception of the experiments and review of the manuscript. A. D. contributed to patient
recruitment and review of the manuscript. E. H. is the guarantor of this work and, as such, had full access to all
data in the study and takes responsibility for the integrity of the data and the accuracy of the data analysis.
Some preliminary data related to this study have been previously presented at the congress of Société
Francophone du Diabète in 2015 (abstract in Diabetes & Metab, 2015, 41(Suppl 1): A5,O18).
REFERENCES
1. Hainsworth DP, Bebu I, Aiello LP, Sivitz W, Gubitosi-Klug R, Malone J, White NH, Danis R, Wallia A, Gao X, Barkmeier AJ, Das A, Patel S, Gardner TW, Lachin JM, Diabetes C, Complications Trial /Epidemiology of Diabetes I, Complications Research G: Risk Factors for Retinopathy in Type 1 Diabetes: The DCCT/EDIC Study. Diabetes Care 2019;42:875-882 2. Ceriello A, Kumar S, Piconi L, Esposito K, Giugliano D: Simultaneous Control of Hyperglycemia and Oxidative Stress Normalizes Endothelial Function in Type 1 Diabetes. Diabetes Care 2007;30:649-654 3. Munusamy S, MacMillan-Crow LA: Mitochondrial superoxide plays a crucial role in the development of mitochondrial dysfunction during high glucose exposure in rat renal proximal tubular cells. Free Radic Biol Med 2009;46:1149-1157 4. Weir DC, Jennings PE, Hendy MS, Barnett AH, Burge PS: Transfer factor for carbon monoxide in patients with diabetes with and without microangiopathy. Thorax 1988;43:725-726 5. Scaramuzza AE, Morelli M, Rizzi M, Borgonovo S, De Palma A, Mameli C, Giani E, Beretta S, Zuccotti GV: Impaired diffusing capacity for carbon monoxide in children with type 1 diabetes: is this the first sign of long-term complications? Acta Diabetol 2012;49:159-164 6. Lee MJ, Coast JR, Hempleman SC, Baldi JC: Type 1 Diabetes Duration Decreases Pulmonary Diffusing Capacity during Exercise. Respiration 2016;91:164-170 7. Niranjan V, McBrayer DG, Ramirez LC, Raskin P, Hsia CC: Glycemic control and cardiopulmonary function in patients with insulin-dependent diabetes mellitus. Am J Med 1997;103:504-513 8. Tagougui S, Leclair E, Fontaine P, Matran R, Marais G, Aucouturier J, Descatoire A, Vambergue A, Oussaidene K, Baquet G, Heyman E: Muscle oxygen supply impairment during exercise in poorly controlled type 1 diabetes. Med Sci Sports Exerc 2015;47:231-239 9. Crowther GJ, Milstein JM, Jubrias SA, Kushmerick MJ, Gronka RK, Conley KE: Altered energetic properties in skeletal muscle of men with well-controlled insulin-dependent (type 1) diabetes. Am J Physiol Endocrinol Metab 2003;284:E655-662 10. Item F, Heinzer-Schweizer S, Wyss M, Fontana P, Lehmann R, Henning A, Weber M, Boesiger P, Boutellier U, Toigo M: Mitochondrial capacity is affected by glycemic status in young untrained women with type 1 diabetes but is not impaired relative to healthy untrained women. Am J Physiol Regul Integr Comp Physiol 2011;301:R60-66 11. Cree-Green M, Newcomer BR, Brown MS, Baumgartner AD, Bergman B, Drew B, Regensteiner JG, Pyle L, Reusch JE, Nadeau KJ: Delayed skeletal muscle mitochondrial ADP recovery in youth with type 1 diabetes relates to muscle insulin resistance. Diabetes 2015;64:383-392
12. Wallberg-Henriksson H, Gunnarsson R, Henriksson J, Ostman J, Wahren J: Influence of physical training on formation of muscle capillaries in type I diabetes. Diabetes 1984;33:851-857 13. Harmer AR, Chisholm DJ, McKenna MJ, Hunter SK, Ruell PA, Naylor JM, Maxwell LJ, Flack JR: Sprint training increases muscle oxidative metabolism during high-intensity exercise in patients with type 1 diabetes. Diabetes Care 2008;31:2097-2102 14. Fritzsche K, Bluher M, Schering S, Buchwalow IB, Kern M, Linke A, Oberbach A, Adams V, Punkt K: Metabolic profile and nitric oxide synthase expression of skeletal muscle fibers are altered in patients with type 1 diabetes. Exp Clin Endocrinol Diabetes 2008;116:606-613 15. Kuznetsov AV, Veksler V, Gellerich FN, Saks V, Margreiter R, Kunz WS: Analysis of mitochondrial function in situ in permeabilized muscle fibers, tissues and cells. Nat Protoc 2008;3:965-976 16. Monaco CMF, Hughes MC, Ramos SV, Varah NE, Lamberz C, Rahman FA, McGlory C, Tarnopolsky MA, Krause MP, Laham R, Hawke TJ, Perry CGR: Altered mitochondrial bioenergetics and ultrastructure in the skeletal muscle of young adults with type 1 diabetes. Diabetologia 2018;61:1411-1423 17. Kriska AM, Knowler WC, LaPorte RE, Drash AL, Wing RR, Blair SN, Bennett PH, Kuller LH: Development of questionnaire to examine relationship of physical activity and diabetes in Pima Indians. Diabetes Care 1990;13:401-411 18. Whipp BJ, Higgenbotham MB, Cobb FC: Estimating exercise stroke volume from asymptotic oxygen pulse in humans. J Appl Physiol (1985) 1996;81:2674-2679 19. Barstow TJ: CORP: Understanding near infrared spectroscopy (NIRS) and its application to skeletal muscle research. J Appl Physiol (1985) 2019; 20. Daussin FN, Zoll J, Ponsot E, Dufour SP, Doutreleau S, Lonsdorfer E, Ventura-Clapier R, Mettauer B, Piquard F, Geny B, Richard R: Training at high exercise intensity promotes qualitative adaptations of mitochondrial function in human skeletal muscle. J Appl Physiol (1985) 2008;104:1436-1441 21. Komatsu WR, Barros Neto TL, Chacra AR, Dib SA: Aerobic exercise capacity and pulmonary function in athletes with and without type 1 diabetes. Diabetes Care 2010;33:2555-2557
22. Ditzel J: Oxygen transport impairment in diabetes. Diabetes 1976;25:832-838 23. Rissanen AP, Tikkanen HO, Koponen AS, Aho JM, Peltonen JE: Central and peripheral cardiovascular impairments limit VO(2peak) in type 1 diabetes. Med Sci Sports Exerc 2015;47:223-230 24. Volianitis S, Secher NH: Cardiovascular control during whole body exercise. J Appl Physiol (1985) 2016;121:376-390 25. Gusso S, Pinto TE, Baldi JC, Robinson E, Cutfield WS, Hofman PL: Diastolic function is reduced in adolescents with type 1 diabetes in response to exercise. Diabetes Care 2012;35:2089-2094 26. Pichler G, Urlesberger B, Jirak P, Zotter H, Reiterer E, Muller W, Borkenstein M: Reduced forearm blood flow in children and adolescents with type 1 diabetes (measured by near-infrared spectroscopy). Diabetes Care 2004;27:1942-1946 27. Steinberg H, Baron A: Vascular function, insulin resistance and fatty acids. Diabetologia 2002;45:623-634 28. Dye AS, Huang H, Bauer JA, Hoffman RP: Hyperglycemia increases muscle blood flow and alters endothelial function in adolescents with type 1 diabetes. Exp Diabetes Res 2012;2012:170380 29. Fayh AP, Krause M, Rodrigues-Krause J, Ribeiro JL, Ribeiro JP, Friedman R, Moreira JC, Reischak-Oliveira A: Effects of L-arginine supplementation on blood flow, oxidative stress status and exercise responses in young adults with uncomplicated type I diabetes. Eur J Nutr 2013;52:975-983 30. Lauer T, Preik M, Rassaf T, Strauer BE, Deussen A, Feelisch M, Kelm M: Plasma nitrite rather than nitrate reflects regional endothelial nitric oxide synthase activity but lacks intrinsic vasodilator action. Proc Natl Acad Sci U S A 2001;98:12814-12819 31. Story CJ, Roberts AP, Ryall RG: Borderline maintenance of erythrocyte 2,3-diphosphoglycerate concentrations in normoxic type 1 (insulin dependent) diabetic subjects. Clin Sci (Lond) 1986;70:127-129 32. Sverdlov AL, Elezaby A, Behring JB, Bachschmid MM, Luptak I, Tu VH, Siwik DA, Miller EJ, Liesa M, Shirihai OS, Pimentel DR, Cohen RA, Colucci WS: High fat, high sucrose diet causes cardiac mitochondrial

dysfunction due in part to oxidative post-translational modification of mitochondrial complex II. J Mol Cell Cardiol 2015;78:165-173 33. Ngo DTM, Sverdlov AL, Karki S, Macartney-Coxson D, Stubbs RS, Farb MG, Carmine B, Hess DT, Colucci WS, Gokce N: Oxidative modifications of mitochondrial complex II are associated with insulin resistance of visceral fat in obesity. Am J Physiol Endocrinol Metab 2019;316:E168-E177 34. Keightley JA, Hoffbuhr KC, Burton MD, Salas VM, Johnston WS, Penn AM, Buist NR, Kennaway NG: A microdeletion in cytochrome c oxidase (COX) subunit III associated with COX deficiency and recurrent myoglobinuria. Nat Genet 1996;12:410-416 35. Choksi KB, Boylston WH, Rabek JP, Widger WR, Papaconstantinou J: Oxidatively damaged proteins of heart mitochondrial electron transport complexes. Biochim Biophys Acta 2004;1688:95-101 36. Chen J, Schenker S, Frosto TA, Henderson GI: Inhibition of cytochrome c oxidase activity by 4-hydroxynonenal (HNE). Role of HNE adduct formation with the enzyme subunits. Biochim Biophys Acta 1998;1380:336-344 37. Gregory JM, Kraft G, Scott MF, Neal DW, Farmer B, Smith MS, Hastings JR, Allen EJ, Donahue EP, Rivera N, Winnick JJ, Edgerton DS, Nishimura E, Fledelius C, Brand CL, Cherrington AD: Insulin Delivery Into the Peripheral Circulation: A Key Contributor to Hypoglycemia in Type 1 Diabetes. Diabetes 2015;64:3439-3451 38. Wiedemann FR, Kunz WS: Oxygen dependence of flux control of cytochrome c oxidase -- implications for mitochondrial diseases. FEBS Lett 1998;422:33-35 39. Krause MP, Riddell MC, Hawke TJ: Effects of type 1 diabetes mellitus on skeletal muscle: clinical observations and physiological mechanisms. Pediatr Diabetes 2011;12:345-364 40. Thapa D, Nichols CE, Lewis SE, Shepherd DL, Jagannathan R, Croston TL, Tveter KJ, Holden AA, Baseler WA, Hollander JM: Transgenic overexpression of mitofilin attenuates diabetes mellitus-associated cardiac and mitochondria dysfunction. J Mol Cell Cardiol 2015;79:212-223 41. Baron AD, Brechtel G, Wallace P, Edelman SV: Rates and tissue sites of non-insulin- and insulin-mediated glucose uptake in humans. Am J Physiol 1988;255:E769-774
TABLES
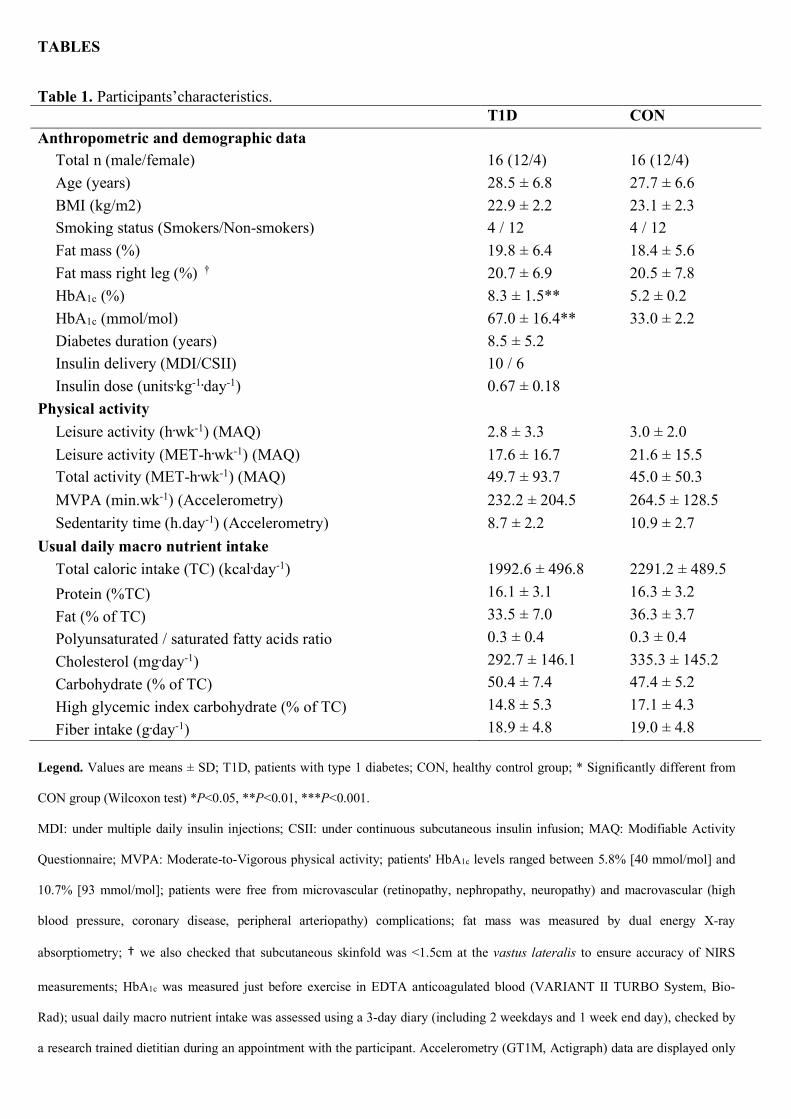
Table 1. Participants’characteristics. T1D CON Anthropometric and demographic data
Total n (male/female) 16 (12/4) 16 (12/4) Age (years) 28.5 ± 6.8 27.7 ± 6.6 BMI (kg/m2) 22.9 ± 2.2 23.1 ± 2.3 Smoking status (Smokers/Non-smokers) 4 / 12 4 / 12 Fat mass (%) 19.8 ± 6.4 18.4 ± 5.6 Fat mass right leg (%) † 20.7 ± 6.9 20.5 ± 7.8 HbA1c (%) 8.3 ± 1.5** 5.2 ± 0.2 HbA1c (mmol/mol) 67.0 ± 16.4** 33.0 ± 2.2 Diabetes duration (years) 8.5 ± 5.2 Insulin delivery (MDI/CSII) 10 / 6 Insulin dose (units.kg-1.day-1) 0.67 ± 0.18
Physical activity Leisure activity (h.wk-1) (MAQ) 2.8 ± 3.3 3.0 ± 2.0 Leisure activity (MET-h.wk-1) (MAQ) 17.6 ± 16.7 21.6 ± 15.5 Total activity (MET-h.wk-1) (MAQ) 49.7 ± 93.7 45.0 ± 50.3 MVPA (min.wk-1) (Accelerometry) 232.2 ± 204.5 264.5 ± 128.5 Sedentarity time (h.day-1) (Accelerometry) 8.7 ± 2.2 10.9 ± 2.7
Usual daily macro nutrient intake Total caloric intake (TC) (kcal.day-1) 1992.6 ± 496.8 2291.2 ± 489.5 Protein (%TC) 16.1 ± 3.1 16.3 ± 3.2 Fat (% of TC) 33.5 ± 7.0 36.3 ± 3.7 Polyunsaturated / saturated fatty acids ratio 0.3 ± 0.4 0.3 ± 0.4 Cholesterol (mg.day-1) 292.7 ± 146.1 335.3 ± 145.2 Carbohydrate (% of TC) 50.4 ± 7.4 47.4 ± 5.2 High glycemic index carbohydrate (% of TC) 14.8 ± 5.3 17.1 ± 4.3 Fiber intake (g.day-1) 18.9 ± 4.8 19.0 ± 4.8
Legend. Values are means ± SD; T1D, patients with type 1 diabetes; CON, healthy control group; * Significantly different from
CON group (Wilcoxon test) *P<0.05, **P<0.01, ***P<0.001.
MDI: under multiple daily insulin injections; CSII: under continuous subcutaneous insulin infusion; MAQ: Modifiable Activity
Questionnaire; MVPA: Moderate-to-Vigorous physical activity; patients' HbA1c levels ranged between 5.8% [40 mmol/mol] and
10.7% [93 mmol/mol]; patients were free from microvascular (retinopathy, nephropathy, neuropathy) and macrovascular (high
blood pressure, coronary disease, peripheral arteriopathy) complications; fat mass was measured by dual energy X-ray
absorptiometry; † we also checked that subcutaneous skinfold was <1.5cm at the vastus lateralis to ensure accuracy of NIRS
measurements; HbA1c was measured just before exercise in EDTA anticoagulated blood (VARIANT II TURBO System, Bio-
Rad); usual daily macro nutrient intake was assessed using a 3-day diary (including 2 weekdays and 1 week end day), checked by
a research trained dietitian during an appointment with the participant. Accelerometry (GT1M, Actigraph) data are displayed only

for 8 subjects per group because 1 healthy control and 4 patients with type 1 diabetes did not strictly follow our recommendations
(mainly, wearing the accelerometer during all waking hours) and the accelerometer devices worn by 2 patients with type 1
diabetes were defective (no signal recorded at the end of the week). The P-values (Wilcoxon test) for leisure activity (h.wk-1 and
MET-h.wk-1), total activity (MET-h.wk-1) and moderate-to-vigorous physical activity (accelerometry, min.wk-1) were 0.53, 0.43,
0.64 and 0.26, respectively.
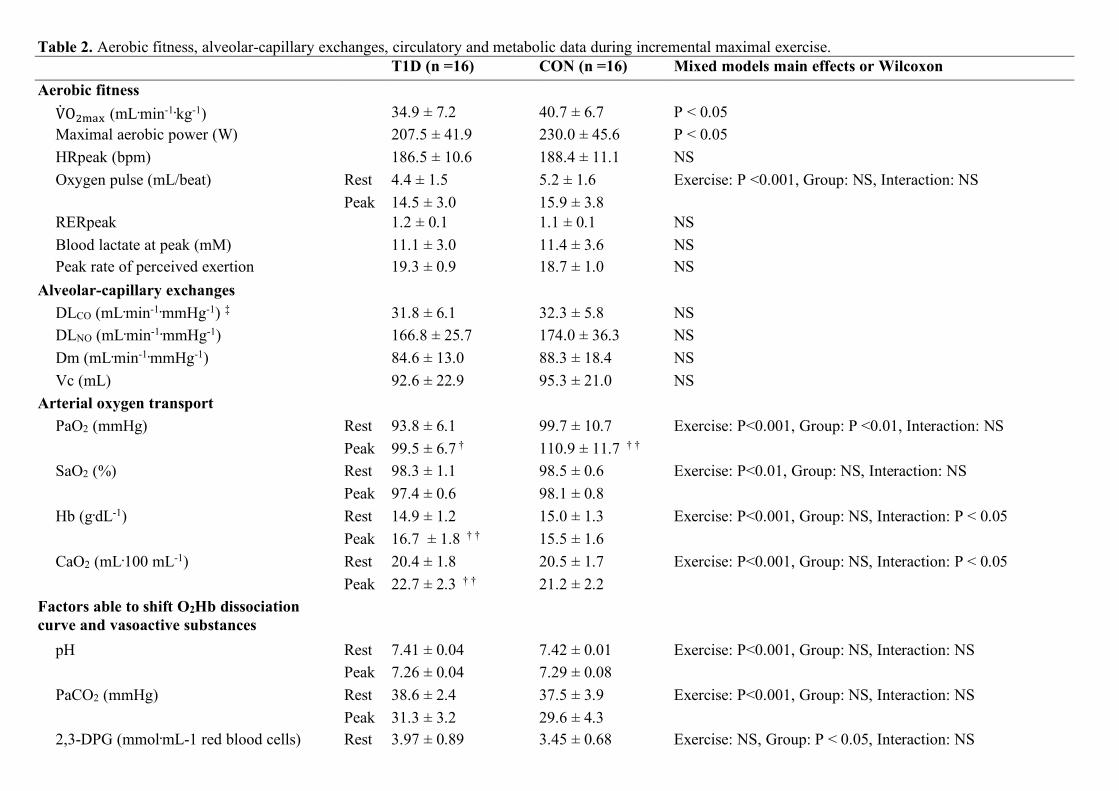
Table 2. Aerobic fitness, alveolar-capillary exchanges, circulatory and metabolic data during incremental maximal exercise. T1D (n =16) CON (n =16) Mixed models main effects or Wilcoxon Aerobic fitness V̇O$%&' (mL.min-1.kg-1) 34.9 ± 7.2 40.7 ± 6.7 P < 0.05 Maximal aerobic power (W) 207.5 ± 41.9 230.0 ± 45.6 P < 0.05 HRpeak (bpm) 186.5 ± 10.6 188.4 ± 11.1 NS Oxygen pulse (mL/beat) Rest 4.4 ± 1.5 5.2 ± 1.6 Exercise: P <0.001, Group: NS, Interaction: NS Peak 14.5 ± 3.0 15.9 ± 3.8 RERpeak 1.2 ± 0.1 1.1 ± 0.1 NS Blood lactate at peak (mM) 11.1 ± 3.0 11.4 ± 3.6 NS Peak rate of perceived exertion 19.3 ± 0.9 18.7 ± 1.0 NS
Alveolar-capillary exchanges DLCO (mL.min-1.mmHg-1) ‡ 31.8 ± 6.1 32.3 ± 5.8 NS DLNO (mL.min-1.mmHg-1) 166.8 ± 25.7 174.0 ± 36.3 NS Dm (mL.min-1.mmHg-1) 84.6 ± 13.0 88.3 ± 18.4 NS Vc (mL) 92.6 ± 22.9 95.3 ± 21.0 NS
Arterial oxygen transport PaO2 (mmHg) Rest 93.8 ± 6.1 99.7 ± 10.7 Exercise: P<0.001, Group: P <0.01, Interaction: NS Peak 99.5 ± 6.7 † 110.9 ± 11.7 † † SaO2 (%) Rest 98.3 ± 1.1 98.5 ± 0.6 Exercise: P<0.01, Group: NS, Interaction: NS Peak 97.4 ± 0.6 98.1 ± 0.8 Hb (g.dL-1) Rest 14.9 ± 1.2 15.0 ± 1.3 Exercise: P<0.001, Group: NS, Interaction: P < 0.05 Peak 16.7 ± 1.8 † † 15.5 ± 1.6 CaO2 (mL.100 mL-1) Rest 20.4 ± 1.8 20.5 ± 1.7 Exercise: P<0.001, Group: NS, Interaction: P < 0.05 Peak 22.7 ± 2.3 † † 21.2 ± 2.2
Factors able to shift O2Hb dissociation curve and vasoactive substances
pH Rest 7.41 ± 0.04 7.42 ± 0.01 Exercise: P<0.001, Group: NS, Interaction: NS Peak 7.26 ± 0.04 7.29 ± 0.08 PaCO2 (mmHg) Rest 38.6 ± 2.4 37.5 ± 3.9 Exercise: P<0.001, Group: NS, Interaction: NS Peak 31.3 ± 3.2 29.6 ± 4.3 2,3-DPG (mmol.mL-1 red blood cells) Rest 3.97 ± 0.89 3.45 ± 0.68 Exercise: NS, Group: P < 0.05, Interaction: NS

Peak 4.11 ± 0.88 3.71 ± 0.70
Serum free insulin (pmol.L-1) Rest 344.4 ± 361.6 76.0 ± 40.2 Exercise: NS, Group: P <0.001, Interaction: NS Peak 367.4 ± 442.0 73.2 ± 38.7
Plasma epinephrine (pmol.L-1) Rest 627.2 ± 425.4 561.8 ± 387.2 Exercise: P < 0.001, Group: NS, Interaction: NS Peak 1499.8 ± 1090.8 1478.0 ± 796.3
Plasma norepinephrine (pmol.L-1) Rest 2211.8 ± 922.6 2726.3 ± 2182.3 Exercise: P < 0.001, Group: NS, Interaction: NS Peak 11260.3 ± 5281.2 12519.9 ± 4743.0
Arterial K+ (mmol.L-1) Rest 4.9 ± 0.4 4.6 ± 0.5 Exercise: P < 0.001, Group: NS, Interaction: NS Peak 5.9 ± 1.0 5.4 ± 0.8
Metabolic data Plasma glucose (mmol.L-1) Rest 7.3 ± 2.9 * 5.1 ± 0.6 Exercise: P <0.05, Group: P < 0.001 Peak 8.3 ± 2.1 * 6.4 ± 0.8 † † Interaction: NS Plasma free fatty acids (mmol.L-1) Rest 0.297 ± 0.182 0.357 ± 0.190 Exercise: NS, Group: P < 0.05, Interaction: NS Peak 0.207 ± 0.104 0.350 ± 0.175 Plasma glycerol (mg.L-1) Rest 2.55 ± 1.37 2.64 ± 1.45 Exercise: P < 0.001, Group: P < 0.05, Interaction: NS
Peak 5.44 ± 2.83 † † 7.86 ± 3.31 † † † Legend. Values are means ± SD. Main effects from mixed models: Exercise, Exercise effect; Group, Group effect; Interaction, Exercise × group interaction. Post hoc analyses for group
effect: significantly different from controls at * P < 0.05; post hoc analyses for time effect: significantly different from rest at † P < 0.05, †† P < 0.01, and ††† P < 0.001; NS: not
significant.
Rest: at rest just before the exercise; peak: at exhaustion from the incremental exercise; T1D, patients with type 1 diabetes; CON: healthy control group; VO2max: maximal oxygen uptake;
HR: heart rate; RER: respiratory exchange ratio; DLCO and DLNO: lung diffusion capacity for carbon monoxide and for nitric oxide; ‡, corrected by individual hemoglobin concentrations;
Dm: membrane transfer capacity; Vc: capillary lung volume; 2,3-DPG: 2,3-diphosphoglycerate; K+: potassium.
Plasma (fluorinated) glucose was measured with hexokinase enzymatic assay on modular automatic analyzer; serum free insulin with noncompetitive radioimmunoassay (Cisbio), plasma
(heparin, metabisulfite) catecholamines with HPLC, serum free fatty acids and glycerol with colorimetric assays (RANDOX reagents), arterialized (vasodilatory pomade applied 5 min
before) erythrocyte 2,3-DPG using spectrophotometry (Sigma-Aldrich), and arterialized pH, K+, PaCO2 by potentiometry, SaO2 and Hb by spectrophotometry, PaO2 and lactate by
amperometry on ABL800 FLEX.
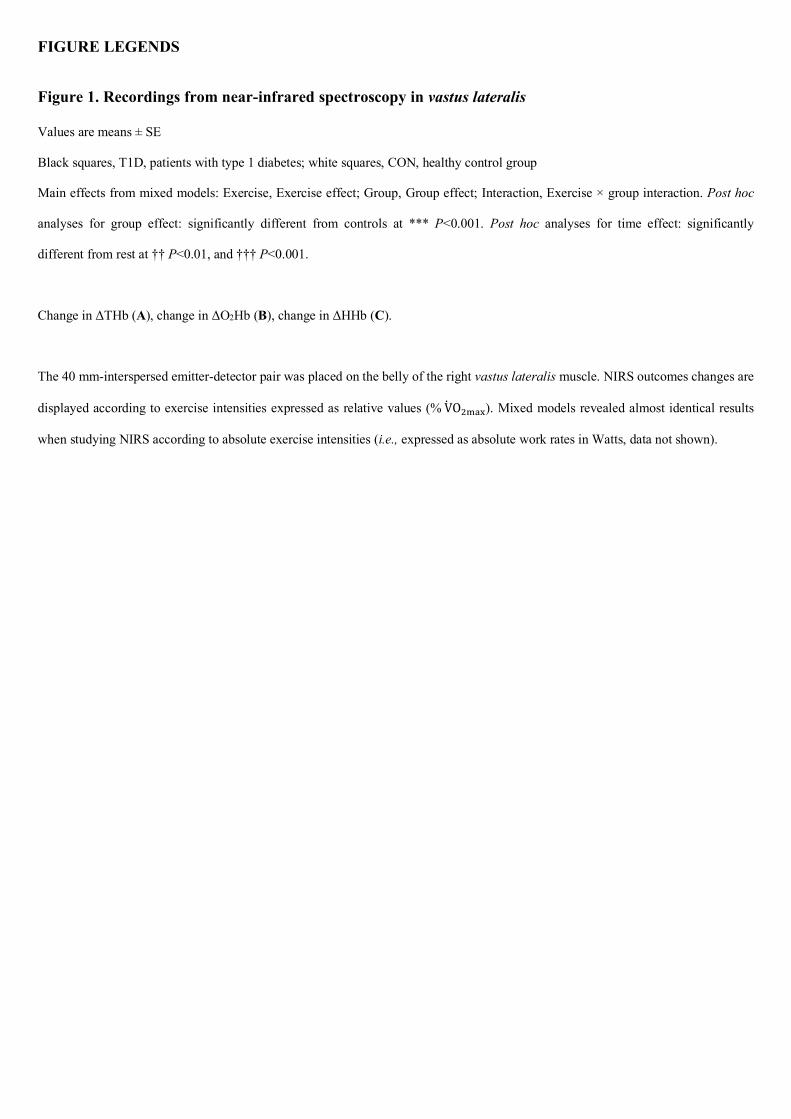
FIGURE LEGENDS
Figure 1. Recordings from near-infrared spectroscopy in vastus lateralis
Values are means ± SE
Black squares, T1D, patients with type 1 diabetes; white squares, CON, healthy control group
Main effects from mixed models: Exercise, Exercise effect; Group, Group effect; Interaction, Exercise × group interaction. Post hoc
analyses for group effect: significantly different from controls at *** P<0.001. Post hoc analyses for time effect: significantly
different from rest at †† P<0.01, and ††† P<0.001.
Change in ΔTHb (A), change in ΔO2Hb (B), change in ΔHHb (C).
The 40 mm-interspersed emitter-detector pair was placed on the belly of the right vastus lateralis muscle. NIRS outcomes changes are
displayed according to exercise intensities expressed as relative values (%V̇O%&'(). Mixed models revealed almost identical results
when studying NIRS according to absolute exercise intensities (i.e., expressed as absolute work rates in Watts, data not shown).
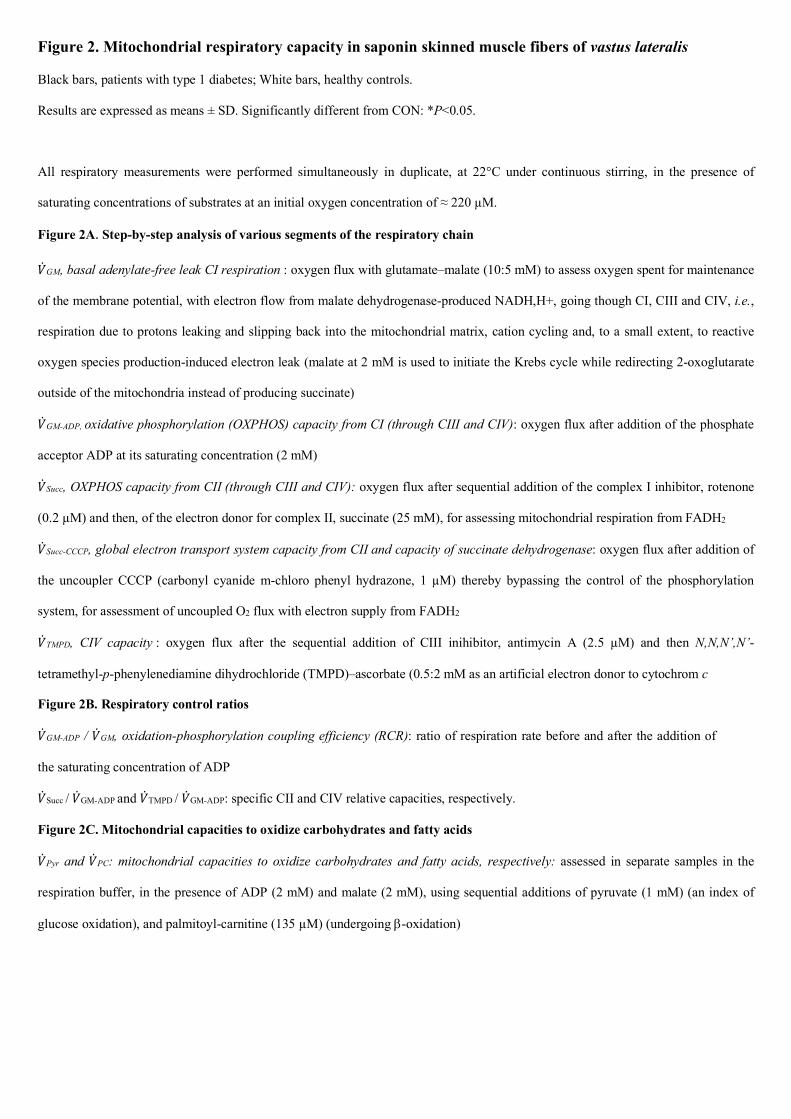
Figure 2. Mitochondrial respiratory capacity in saponin skinned muscle fibers of vastus lateralis
Black bars, patients with type 1 diabetes; White bars, healthy controls.
Results are expressed as means ± SD. Significantly different from CON: *P<0.05.
All respiratory measurements were performed simultaneously in duplicate, at 22°C under continuous stirring, in the presence of
saturating concentrations of substrates at an initial oxygen concentration of ≈ 220 µM.
Figure 2A. Step-by-step analysis of various segments of the respiratory chain
)̇GM, basal adenylate-free leak CI respiration : oxygen flux with glutamate–malate (10:5 mM) to assess oxygen spent for maintenance
of the membrane potential, with electron flow from malate dehydrogenase-produced NADH,H+, going though CI, CIII and CIV, i.e.,
respiration due to protons leaking and slipping back into the mitochondrial matrix, cation cycling and, to a small extent, to reactive
oxygen species production-induced electron leak (malate at 2 mM is used to initiate the Krebs cycle while redirecting 2-oxoglutarate
outside of the mitochondria instead of producing succinate)
)̇GM-ADP, oxidative phosphorylation (OXPHOS) capacity from CI (through CIII and CIV): oxygen flux after addition of the phosphate
acceptor ADP at its saturating concentration (2 mM)
)̇Succ, OXPHOS capacity from CII (through CIII and CIV): oxygen flux after sequential addition of the complex I inhibitor, rotenone
(0.2 µM) and then, of the electron donor for complex II, succinate (25 mM), for assessing mitochondrial respiration from FADH2
)̇Succ-CCCP, global electron transport system capacity from CII and capacity of succinate dehydrogenase: oxygen flux after addition of
the uncoupler CCCP (carbonyl cyanide m-chloro phenyl hydrazone, 1 µM) thereby bypassing the control of the phosphorylation
system, for assessment of uncoupled O2 flux with electron supply from FADH2
)̇TMPD, CIV capacity : oxygen flux after the sequential addition of CIII inihibitor, antimycin A (2.5 µM) and then N,N,N’,N’-
tetramethyl-p-phenylenediamine dihydrochloride (TMPD)–ascorbate (0.5:2 mM as an artificial electron donor to cytochrom c
Figure 2B. Respiratory control ratios
)̇GM-ADP / )̇GM, oxidation-phosphorylation coupling efficiency (RCR): ratio of respiration rate before and after the addition of
the saturating concentration of ADP
)̇Succ / )̇GM-ADP and )̇TMPD / )̇GM-ADP: specific CII and CIV relative capacities, respectively.
Figure 2C. Mitochondrial capacities to oxidize carbohydrates and fatty acids
)̇Pyr and )̇PC: mitochondrial capacities to oxidize carbohydrates and fatty acids, respectively: assessed in separate samples in the
respiration buffer, in the presence of ADP (2 mM) and malate (2 mM), using sequential additions of pyruvate (1 mM) (an index of
glucose oxidation), and palmitoyl-carnitine (135 µM) (undergoing b-oxidation)