musculoskeletal biomechanics of the dual-function axial
TRANSCRIPT

Musculoskeletal Biomechanics of the Dual-Function Axial Musculature of Fishes in
Swimming and Suction Feeding
By
Yordano Eleazar Jimenez
B. S., Northern Arizona University, 2015
B. A., Northern Arizona University, 2015
A dissertation submitted in fulfillment of the requirements for the degree of Doctor of
Philosophy in the Department of Ecology and Evolutionary Biology at Brown University
Providence, RI
May 2021

© Copyright 2021 by Yordano E. Jimenez

iii
This dissertation by Yordano E. Jimenez is accepted in its present form by the
Department of Ecology and Evolutionary Biology as satisfying the dissertation
requirement for the degree of Doctor of Philosophy.
Date__________ _________________________ Elizabeth L. Brainerd, Advisor
Recommended to the Graduate Council
Date__________ _________________________ Richard L. Marsh, Reader Date__________ _________________________ Thomas J. Roberts, Reader Date__________ _________________________ Andrew A. Biewener, Reader
Approved by the Graduate Council
Date__________ _________________________ Andrew G. Campbell, Dean of the Graduate School

iv
YORDANO E. JIMENEZ, Ph.D. Curriculum Vitae
Research Interests
Vertebrate morphology, biomechanics, muscle function, and evolution
Education
Brown University, Providence, Rhode Island
2018 - current Ph.D. in Ecology and Evolutionary Biology*
*Advisor: Elizabeth L. Brainerd
Northern Arizona University, Flagstaff, Arizona
2015 B.S. in Biology cum laude
2015 B.A. in Philosophy
Honors
2017 National Science Foundation, Graduate Research Fellowship
2015 REU Friday Harbor Labs, Blinks Fellowship
2012 - 2014 Initiative for Maximizing Student Diversity Fellowship
2010 - 2014 Northern Arizona University Dean’s List Student
2010 - 2014 Arizona Board of Regent’s High Honors Tuition Scholarship
Grants
2020 Doctoral Dissertation Enhancement Grant, Brown University ($9,948)
Investigating biomechanical solutions to a universal constraint in
vertebrate axial musculature
2017 Society for Integrative and Comparative Biology Travel Award ($500)

v
2016 American Society of Ichthyology and Herpetology Raney Award
($1200)
2015 Northern Arizona University Student Travel Award ($500)
2014 - 2015 Undergraduate Research Mentoring Award ($2000)
2014 Hooper Undergraduate Research Award ($1000)
Publications *undergraduate collaborators
In prep Jimenez, YE, and Brainerd, EL. Motor control of the axial musculature
of bluegill sunfish in swimming and suction feeding.
In revision Jimenez, YE, Marsh, RL, and Brainerd, EL. A biomechanical paradox
in fish: swimming and suction feeding produce orthogonal
strain gradients in the axial musculature. Accepted pending
revisions in Scientific Reports.
2020 Lomax, JJ, *Martinson, TF, Jimenez, YE, and Brainerd, EL.
Bifunctional role of the sternohyoideus muscle during suction
feeding in striped surfperch, Embiotoca lateralis. Integrative
Organismal Biology, 2, 1-12.
2020 Jimenez, YE, and Brainerd, EL. 2020. Dual function of epaxial
musculature for swimming and suction feeding in largemouth
bass. Proceedings of the Royal Society B, 287, p.20192631
2018 Jimenez, YE, Camp, AL, *Grindall, JD, and Brainerd, EL. 2018. Axial
morphology and 3D neurocranial kinematics in suction-feeding
fishes. Biology Open, doi: 10.1242/bio.036335

vi
Work in Progress
Jimenez, YE, *Parsons, J, Brainerd, EL. Motor control of the hypaxial
and epaxial muscle during suction feeding in channel catfish
(Ictalurus punctatus)
Brainerd, EL, Jimenez, YE, Weller, HI. Impact of whole-muscle shear
and fascicle curvature on architectural gear ratio
Jimenez, YE, Coughlin, DJ, Brainerd, EL. Modelling the mechanical
effects of 3D muscle deformation in swimming and suction
feeding
Jimenez, YE, Brainerd, EL. Strain gradients in the skeletal muscle of
vertebrates.
Jimenez, YE, Brainerd, EL, Tytell, ED. Mechanical output of the C-
start in bluegill sunfish
Presentations
2021 Jimenez, YE. Musculoskeletal biomechanics of the dual-function axial
musculature of fishes in swimming and suction feeding. Brown
University. Providence, RI.Oral presentation. Dissertation
defense.
2021 Jimenez, YE, Marsh, RL, and Brainerd, EL. A biomechanical paradox
in the dual-function axial musculature of fish. Society for
Integrative and Comparative Biology. Virtual Meeting.
Oral presentation. Selected for student prize competition.

vii
2020 Jimenez, YE, and Brainerd, EL. Contributions of the epaxial
musculature to swimming and suction feeding in bluegill
sunfish. Society for Integrative and Comparative Biology.
Austin, TX.
Oral presentation.
2019 Jimenez, YE, and Brainerd, EL. Epaxial mechanics of swimming and
suction feeding in bluegill sunfish. Society for Integrative and
Comparative Biology Regional Meeting. Boston College.
Boston, MA.
Oral presentation.
2019 Jimenez, YE, Olsen, AM, and Brainerd, EL. Modelling the mechanical
effects of fiber architecture and muscle bulging on swimming
and suction feeding. International Congress of Vertebrate
Morphology. Prague, Czech Republic.
Poster presentation.
2018 Jimenez, YE, and Brainerd, EL. Comparison of epaxial muscle activity
during swimming and suction feeding. Society for Integrative
and Comparative Biology Regional Meeting. Brown University.
Providence, RI.
Oral presentation.
2017 Jimenez, YE, and Brainerd, EL. Is epaxial muscle activity in
largemouth bass regionalized during swimming and feeding?

viii
Society for Integrative and Comparative Biology Regional
Meeting. University of Massachusetts Lowell. Lowell, MA.
Oral presentation.
2017 Jimenez, YE, Summers, AP, and Brainerd, EL. Comparative
biomechanics of the defensive dorsal fin spines in filefishes and
triggerfishes. Society for Integrative Biology. New Orleans,
Louisiana.
Poster presentation.
2016 Jimenez, YE, Laurence-Chasen, JD, Grindall, JG, Camp, AL, and
Brainerd, EL. Where does the vertebral column bend during
suction feeding in fishes? International Congress of Vertebrate
Morphology. Washington DC.
Poster presentation.
2015 Jimenez, YE, and Gibb, AC. When is a C-start not a C-start? Escape
behavior in the English sole (Parophrys vetulus). Society for
Integrative and Comparative Biology. West Palm Beach,
Florida.
Poster presentation.
2014 Jimenez, YE, MacDonald I, and Gibb, AC. Do California halibut
(Paralichthys californicus) develop different escape responses
throughout their life history? Society for Integrative and
Comparative Biology. Austin, TX.
Poster presentation.

ix
2014 Jimenez, YE, MacDonald, I, and Gibb, AC. The fleeing flatfish: how
flatfish escape. URM & IMSD Symposium at Northern Arizona
University. Flagstaff, AZ.
Oral presentation.
Teaching
2020 Comparative Biology of Vertebrates
Teaching assistant. Designed, coordinated, and instructed the
dissection lab. Wrote and administered quizzes and lab practicals.
Assisted students with lecture portion. Transitioned lab portion of
course into online format during the Covid-19 global pandemic.
2017 - 2019 Human Anatomy I & II
Teaching assistant. Taught in the dissection lab, created practice
practical exams, administered practical exams, and lectured.
2017 Comparative Biology of Vertebrates
Teaching assistant. Assisted in the dissection lab, held review sessions,
and lectured on fish functional morphology.
2016 Evolutionary Biology
Teaching assistant. Facilitated weekly discussion groups, tutored
students individually, graded exams, administered exams, and gave a
lecture on vertebrate evolution.

x
2014 Introduction to Ethics
Teaching assistant. Taught students the fundamentals of analyzing
philosophical texts and ethical scenarios. Guided students in applying
philosophical analysis to their own lives. Administered and graded
coursework, quizzes, and exams.
2012 - 2013 Philosophies of the World
Teaching assistant. Engaged students in weekly discussion groups to
develop analytic skills and apply them to complex philosophical and
religious worldviews. Tutored students individually. Administered and
graded coursework, quizzes, and exams.
Synergistic Activities
2019 - current Translator (Spanish) for Integrative and Organismal Biology
Broadened access to scientific research for non-English speaking
countries by translating technical abstracts from a variety of
disciplines.
2019 - current Peer Reviewer for Zoology
2017 - 2019 Director/Co-director of the Marine Science Club
Designed hands-on projects to inspire and engage high school students
in an underserved community. Coordinated and led activities such as
fish dissections, live animal presentations, and video analysis.

xi
2016 Volunteer for Brown Junior Researchers Program
Taught a broad range of scientific topics to elementary school students
using hands-on experiments to foster interest and appreciation for
scientific discovery.
Professional Associations
American Society of Ichthyologists and Herpetologists
International Society of Vertebrate Morphology
Society for Integrative and Comparative Biology
Sigma Xi

xii
Preface and Acknowledgments
Over 500 million years ago, the first vertebrates used axial muscles for
swimming, but over time these muscles have been co-opted in most fish species for
suction feeding. As fish evolved cranial adaptations for suction feeding, the axial
musculature started to form an integral part of the feeding apparatus. Despite suction
feeding being the most pervasive mode of prey capture in vertebrates, relatively little is
known about how the axial musculature is involved. Suction feeding studies have focused
on cranial structures, and post-cranial structures have been considered almost exclusively
within a locomotor context. Recent studies have demonstrated that the axial musculature
is clearly used for generating power for suction feeding, challenging the long-held
implicit belief that the trunk musculature is exclusively a swimming structure. In my
dissertation work, I investigated form-function relationships between the axial
musculature and these two high-power behaviors and the potential constraints and
tradeoffs of a dual-function system.
Chapter 1 examines how the morphology of the axial skeleton affects
neurocranial elevation, a critical component of suction feeding. Chapter 2 examines
which parts of the epaxial musculature in largemouth bass contribute to swimming and
suction feeding. Chapter 3 quantifies bilateral motor control of the epaxial musculature in
a ‘suction specialist’, bluegill sunfish. Chapter 4 describes patterns of muscle strain in
swimming and suction feeding, and how these may create tradeoffs in performance.
My dissertation contributes to the broader field in laying the groundwork for
evaluating form-function relationships in a dual function context. Chapter 1 establishes
which regions of the axial skeleton bend during suction feeding using 3D in vivo
xiii
measurements of head movement to determine the axis of rotation for cranial elevation.
Prior work has usually inferred vertebral rotation from indirect measurements and
specimen manipulation. Together, Chapters 2 and 3 show that both largemouth bass and
bluegill sunfish can increase suction performance by activating epaxial muscle in a
dorsal-to-ventral and cranial-to-caudal manner. Prior work has assumed that only the
dorsal-most epaxial region near the head contributes to suction feeding. I also show that
the muscle regions activated for swimming and suction feeding overlap throughout most
of the body, and thus muscle function cannot be described as functionally regionalized in
fishes. I also infer from this finding that feeding uses a dorsal-to-ventral pattern of muscle
recruitment with the same neuroanatomy that modulates ventral-to-dorsal activation
during locomotion. Chapter 3 shows that bluegill sunfish can activate a greater
percentage of muscle volume than largemouth bass during suction feeding, which may
explain why bluegill sunfish have been shown in prior studies to produce substantially
higher mass-specific muscle power. This also suggests that recruitment of the axial
muscle may limit suction feeding performance across species. Chapters 4 determines that
swimming and feeding produce different patterns of muscle shortening in bluegill
sunfish, which may limit the ability of the muscle to produce high power in both
behaviors. Future work is needed to determine whether these different strain patterns
affect the ability of suction-feeding fishes to generate high muscle power outputs for both
biological functions.
I would like to thank my advisor Beth Brainerd for her support, guidance, and
encouragement, and whose intellectual rigor and depth of knowledge is something I
aspire to develop. Our stimulating conversations have helped me to grow in curiosity and

xiv
love of science. I am thankful to have had an advisor who showed tremendous confidence
in me and my intellectual interests while always encouraging me to develop as a
researcher. I am also grateful to my committee members, Tom Roberts, Rich Marsh, and
Andy Biewener, who guided the trajectory of my research and deepened my knowledge
and appreciation of muscle. I would also like to extend my gratitude to all who helped
make this dissertation possible, including Ariel Camp whose research inspired my work
and whose insights helped shape my dissertation, Dave Ellerby for sharing his wealth of
knowledge of fish muscle and helping me catch fish, Anabela Maia for stimulating
conversations about fish biomechanics, and Steve Gatesy for valuable discussions. I
would like to thank all the faculty and staff in the department of Ecology and
Evolutionary Biology and members of the Brainerd Lab at Brown University. I am
grateful for the opportunity to have worked with so many incredible people who
contributed to my professional and intellectual development. My work would not have
been possible without the financial support from the National Science Foundation, the
Bushnell Graduate Fund at Brown, and the American Society of Ichthyologists and
Herpetologists.
I would like to thank all my family and friends for their unwavering love, prayers,
and support at every step of this journey. I am deeply grateful to my wife for bringing so
much love and joy into my life, and for always being a willing spirit when it came to
reviewing my work. This dissertation would not have been possible without her.

xv
Table of Contents
Preface and Acknowledgments ....................................................................................... xiiii
List of Tables .................................................................................................................. xvii
List of Illustrations ......................................................................................................... xviii
Chapter 1. Axial morphology and 3D neurocranial kinematics in suction-feeding fishes 1
Abstract ................................................................................................................... 2
Introduction ............................................................................................................. 3
Methods................................................................................................................... 7
Results ................................................................................................................... 15
Discussion ............................................................................................................. 20
References ............................................................................................................. 29
Figures................................................................................................................... 34
Chapter 2. Dual function of epaxial musculature for swimming and suction feeding in
largemouth bass ................................................................................................................ 42
Abstract ................................................................................................................. 43
Introduction ........................................................................................................... 44
Methods................................................................................................................. 47
Results ................................................................................................................... 51
Discussion ............................................................................................................. 54
References ............................................................................................................. 62
Figures................................................................................................................... 67

xvi
Chapter 3. Motor control of the epaxial musculature of bluegill sunfish in swimming and
suction feeding .................................................................................................................. 76
Abstract ................................................................................................................. 77
Introduction ........................................................................................................... 78
Methods................................................................................................................. 82
Results ................................................................................................................... 88
Discussion ............................................................................................................. 93
References ........................................................................................................... 100
Figures................................................................................................................. 107
Chapter 4. A biomechanical paradox in fish: swimming and suction feeding produce
orthogonal strain gradients in the axial musculature ...................................................... 113
Abstract ............................................................................................................... 114
Introduction ......................................................................................................... 115
Methods............................................................................................................... 118
Results ................................................................................................................. 121
Discussion ........................................................................................................... 122
References ........................................................................................................... 130
Figures................................................................................................................. 136

xvii
List of Tables
Chapter 2
Table S1. Summary of linear regression analyses for figures 4 and S3 ................75
Chapter 4
Table 1. Summary of major axis regression analysis ..........................................143

xviii
List of Illustrations
Chapter 1
Figure 1. Axial morphology and neurocranial elevation ......................................34
Figure 2. Determining the AOR and kinematic trajectory of the neurocranium ..35
Figure 3. Quantification of body form and bone area percentage in the region just
caudal to the neurocranium (means±s.e.m.) ..............................................36
Figure 4. Comparative axial morphology for three study species ........................37
Figure 5. Kinematic profiles of the neurocranium, relative to the body plane,
during the expansive phase ........................................................................38
Figure 6. Normalized AOR position for each species ..........................................39
Figure 7. Comparison of 2D and 3D methods for locating the AOR, using
simulated planar and non-planar neurocranial motion ...............................40
Figure 8. Methods for VROMM videography ......................................................41
Chapter 2
Figure 1. Anatomy of the axial musculature and electrode placement ................ 67
Figure 2. Percent of trials with above-threshold muscle activity for different
behaviors across different epaxial regions .................................................68
Figure 3. Normalized muscle activation intensity in three dorsoventral regions at
0.35 BL ......................................................................................................69
Figure 4. Effects of muscle activation at 0.35 BL on (a) sprinting and (b) suction
feeding performance ..................................................................................70

xix
Figure 5. Diagrammatic representation of the intensities and spatial distributions
of muscle activity associated with different behaviors and performance ......
....................................................................................................................71
Figure S1. Effects of prey type on peak pressure .................................................72
Figure S2. Sampling distributions for each individual .........................................73
Figure S3. Effects of muscle activation at 0.50 BL on suction feeding
performance ...............................................................................................74
Chapter 3
Figure 1. Electrode and sonomicrometer placement in the epaxial musculature ......
..................................................................................................................107
Figure 2. Muscle activity and shortening for high-performance suction feeding
and swimming ..........................................................................................108
Figure 3. Percent of trials with above-threshold muscle activity in different
epaxial regions for different behaviors ....................................................109
Figure 4. Normalized muscle activation intensity for each individual, region, and
behavior....................................................................................................110
Figure 5. Active muscle volume used for different behaviors in sunfish and bass ...
..................................................................................................................111
Figure 6. Bilateral symmetry of activation intensity for feeding and locomotion ....
..................................................................................................................112
Chapter 4
Figure 1. Patterns of longitudinal strain in the epaxial musculature for swimming
and suction feeding .......................................................................... 136-137

xx
Figure 2. Sonomicrometer placement and in vivo muscle length dynamics .............
.......................................................................................................... 138-139
Figure 3. Feeding produces a strain gradient anatomically orthogonal to
swimming .................................................................................................140
Figure 4. Muscle length dynamics in burst swimming followed by mixed
swimming and feeding behavior ..............................................................141
Figure S1. Sample EMG traces showing epaxial muscle activity in feeding and
locomotion ...............................................................................................142

1
CHAPTER 1
Axial morphology and 3D neurocranial kinematics in suction-feeding fishes
Yordano E. Jimenez1,2, Ariel L. Camp1, Jonathan D. Grindall2,3, and Elizabeth L.
Brainerd1,2
1Department of Ecology and Evolutionary Biology, Brown University, 80 Waterman
Street, Providence RI, 02912, USA.
2Friday Harbor Laboratories, University of Washington, 620 University Road, Friday
Harbor WA, 98250, USA.
3 School of Aquatic and Fishery Sciences, University of Washington, 1122 Boat Street,
Seattle WA, 98105, USA.

2
Abstract
Many suction-feeding fishes use neurocranial elevation to expand the buccal
cavity for suction feeding, a motion necessarily accompanied by the dorsal flexion of
joints in the axial skeleton. How much dorsal flexion the axial skeleton accommodates
and where that dorsal flexion occurs may vary with axial skeletal morphology, body
shape, and the kinematics of neurocranial elevation. We measured three-dimensional
neurocranial kinematics in three species with distinct body forms: laterally compressed
Embiotoca lateralis, fusiform Micropterus salmoides, and dorsoventrally compressed
Leptocottus armatus. The area just caudal to the neurocranium occupied by bone was
42±1.5%, 36±1.8% and 22±5.5% (mean±s.e.m.; N=3, 6, 4) in the three species,
respectively, and the epaxial depth also decreased from E. lateralis to L. armatus.
Maximum neurocranial elevation for each species was 11, 24, and 37°, respectively,
consistent with a hypothesis that aspects of axial morphology and body shape may
constrain neurocranial elevation. Mean axis of rotation position for neurocranial elevation
in E. lateralis, M. salmoides, and L. armatus was near the first, third, and fifth
intervertebral joints, respectively, leading to the hypothesis of a similar relationship with
the number of intervertebral joints that flex. Although future work must test these
hypotheses, our results suggest the relationships merit further inquiry.

3
Introduction
For many suction-feeding fishes, neurocranial elevation is an important motion
for expanding the buccal cavity and generating suction (e.g., Schaeffer and Rosen, 1961;
Carroll and Wainwright, 2006; Camp and Brainerd, 2014; Van Wassenbergh et al.,
2015). The neurocranium elevates by rotating dorsally about a transverse axis relative to
the body. To produce this elevation, the vertebrae linked to the neurocranium must flex
dorsally across one or more intervertebral joints (IVJs; this study includes the
craniovertebral joint among the IVJs, unless otherwise noted). Therefore, it has been
hypothesized that vertebral morphology is modified for permitting high degrees of
neurocranial elevation in some fishes (Lesiuk and Lindsey, 1978; Lauder and Liem,
1981; Huet et al., 1999). Despite this interest in vertebral specializations, few studies
have explored how the axial skeleton as a whole may affect neurocranial motions—and
conversely, how the requirement of neurocranial elevation may influence body shape and
axial skeletal structures.
Body shape and the morphology of the axial skeleton have typically been studied
in the context of lateral bending of the body for swimming (e.g., Gray, 1933; Hebrank et
al., 1990; Jayne and Lauder, 1995; Westneat and Wainwright, 2001; Long et al., 2002;
Porter et al., 2009; Nowroozi et al., 2012; Nowroozi and Brainerd, 2012, 2014; Moran et
al., 2016). It is reasonable to expect that they are also relevant to dorsal bending of the
body during suction feeding but few studies have examined them in this context. Without
data on both 3D neurocranial kinematics and axial morphology, it is difficult to
generate—let alone test—hypotheses of how axial and body morphology relate to
neurocranial elevation. In this study, we examine some aspects of axial skeletal

4
morphology (Fig. 1) and overall body shape together with 3D motions of the
neurocranium. While ligaments, tendons, and axial musculature also play important roles
in vertebral column flexion, the present study focuses on the axial skeleton and overall
body shape.
Axial morphology may be related to where along the vertebral column dorsal
flexion is likely to occur during neurocranial elevation. This location can be described by
the axis of rotation (AOR) between the neurocranium and the body of the fish. The AOR
is the pivot point between the neurocranium and the body at which neurocranial elevation
can be described as pure rotation without translation (Fig. 2A). As such, the AOR is the
center of rotation, with dorsal flexion of the IVJs likely distributed on either side of it
(except in rare cases of a single IVJ specialized for dorsal flexion, see below). Several
studies have estimated the position of the AOR using morphological observation,
specimen manipulation, and 2D kinematic analysis. Based on the manipulation of
specimens, Gregory (1933) suggested that the AOR is located near the post-temporal-
supracleithral joint, which Carroll et al. (2004) used as the AOR for calculating the
mechanical advantage of epaxial musculature in centrarchid fishes. Others have
suggested that the AOR is located at the craniovertebral joint based on its specialized
morphology (Lauder and Liem, 1981), or in the case of Rhaphiodon vulpinus, Lesiuk and
Lindsey (1978) inferred that the AOR must be located in the IVJ just posterior to the
Weberian apparatus, since the apparatus is relatively immobile. In other instances, the
AOR has been determined in largemouth bass and pipefish based on modified versions of
the Reuleaux method, which estimates the AOR from a 2D kinematic analysis of the

5
position of the neurocranium at rest and at maximum elevation (Reuleaux, 1876; Van
Wassenbergh et al., 2008, 2015).
One aspect of axial morphology proposed to relate to neurocranial elevation is the
position and shape of the supraneurals, neural spines, and pterygiophores (Fig. 1). As part
of a larger study of epaxial muscle activity during suction feeding in largemouth bass,
Thys (1997) studied the supraneurals, neural spines, and pterygiophores located just
caudal to the neurocranium. X-ray images of largemouth bass postmortem showed these
bones moving closer together during moderate cranial elevation of just 8°, and Thys
hypothesized that these bones could become crowded together in a way that would limit
cranial elevation. Lesiuk and Lindsey (1978) also reported that neighboring neural spines
restrict ex vivo dorsal flexion in Rhaphiodon vulpinus. Hence, if the supraneurals, neural
spines, and pterygiophores together occupy a greater area of the region immediately
caudal to the neurocranium in some species relative to others, this "densely-packed"
configuration might be associated with lower magnitudes of neurocranial elevation
during suction feeding.
The morphology of the vertebrae and intervertebral joints may also influence the
magnitude and the location of dorsal body flexion, as suggested by studies of fishes with
extremely high (>45°) magnitudes of neurocranial elevation (Lesiuk and Lindsey, 1978;
Lauder and Liem, 1981; Huet et al., 1999). Studies of R. vulpinus (Lesiuk and Lindsey,
1978), Luciocephalus pulcher (Lauder and Liem, 1981), and Uranoscopus scaber (Huet
et al., 1999) each noted that some vertebrae appear to be specialized for dorsal flexion. In
particular, hypertrophied zygapophyses have been suggested to limit torsional (long-axis
rolling) motions of the neurocranium to protect the spinal cord from injury during

6
extreme dorsal flexion (Lauder and Liem, 1981). This suggests species with larger and
more closely articulated zygapophyses may show less torsion (roll) of the neurocranium
(Holmes, 1989), but neurocranial roll has so far been directly measured in only a single
species, largemouth bass (Camp and Brainerd, 2014).
The potential effects of body shape are less clear. Large neurocranial elevations
are possible across a range of body shapes as demonstrated by the laterally compressed R.
vulpinus, the fusiform L. pulcher, and the dorsoventrally compressed U. scaber. While
body width and length could potentially relate to neurocranial kinematics, body height
seems most likely to be related to neurocranial elevation. A tall body, with a tall
supraoccipital crest and tall epaxial musculature, has been hypothesized to enhance the
subambient pressures generated during suction feeding by increasing the moment arm
and physiological cross-sectional area for epaxial muscles (Carroll et al., 2004). But, for
the same amount of neurocranial rotation, the dorsal tip of a taller supraoccipital crest
will translate further caudally than that of a shorter crest. And more caudal motion of the
supraoccipital crest may be limited or prevented by the supraneurals, neural spines, and
pterygiophores (Fig. 1). Furthermore, the magnitude of cranial elevation in a deep-bodied
fish may be limited by the overall bulk of tissue located just caudal to the head. Thus, the
height of the body—and particularly the height of the epaxial region dorsal to the
vertebral column—could theoretically be related to the magnitude of neurocranial
elevation.
Our study presents a synthesis of 3D kinematics of the neurocranium, 3D
measurement of the AOR, and comparative morphology of three distantly related species.
Our goal is to generate more informed hypotheses about the relationships between axial

7
skeletal morphology, body shape, and neurocranial kinematics rather than to provide
definitive tests of those hypotheses. We began with descriptions of the body shape and
axial morphology of three species of suction feeders with a range of body shapes:
laterally compressed and tall-bodied, Embiotoca lateralis (striped surfperch); fusiform,
Micropterus salmoides (largemouth bass); and dorsoventrally compressed, Leptocottus
armatus (Pacific staghorn sculpin). We then recorded 3D motion of the neurocranium
and a body plane using XROMM (Brainerd et al., 2010) and VROMM (X-ray and Video
Reconstruction of Moving Morphology, respectively). Using a body plane as a frame of
reference, we measured 3D kinematics of the neurocranium and identified the position of
the AOR for neurocranial elevation. Finally, we quantified and compared the accuracy of
our 3D method with that of the 2D Reuleaux method, which has been previously used for
locating the AOR.
Methods
Animals
We collected Leptocottus armatus (Girard, 1854) and Embiotoca lateralis
(Agassiz, 1854) in the San Juan Islands, Washington, USA. Fish were housed at
University of Washington, Friday Harbor Labs in a flow-through seawater system. Fish
were fed shrimp and squid daily, which were also used in feeding trials. We collected
VROMM data for E. lateralis (N=4; 197, 201, 210, and 213 mm SL) and L. armatus
(N=4; 125, 210, 292, and 316 mm SL), and re-analyzed XROMM animations of
Micropterus salmoides (Lacépède, 1802; N=3; 201, 228, and 233 mm SL) originally
published in Camp and Brainerd, 2014. The University of Washington’s Institutional

8
Animal Care and Use Committee (IACUC) approved all collections, husbandry, and
experimental procedures.
Morphology
We CT (computed tomography) scanned 3-6 individuals from each species. In
addition to the three M. salmoides used for XROMM, we scanned three more individuals
(200, 248, and 255 mm SL) for morphological examination only. We scanned M.
salmoides at 0.625 mm slice thickness [Philips Medical System, Best, The Netherlands].
Scans for one E. lateralis and one L. armatus were made at 0.185 mm slice thickness or
lower [Animage FIDEX, Pleasanton, CA, USA]. Scans for the other three E. lateralis and
L. armatus were made at 0.142 mm slice thickness or lower [Microphotonics Skyscan
1173, Allentown, PA, USA]. Using Horos CT-imaging software (version 1.1; 64-bit;
www.horosproject.org), we rendered and examined the morphology of the axial skeleton,
including the shape, orientation, and spacing of bones. We were unable to find a CT
window width and height that showed the thin lamina of bone that fills the supraoccipital
crest of E. lateralis while also providing suitable contrast for the rest of the skeleton.
Therefore, we applied different contrast to the supraoccipital crest in this species to
reflect correctly the presence of bone in this area. To examine vertebral morphology
closely, we dissected out the first five vertebrae of one individual from each species. We
CT scanned the disarticulated vertebrae for higher resolution models of the morphology
on the Animage FIDEX scanner at 0.162 mm slice thickness or lower.
From CT cross-sections we measured the height and width of the body and the height and
width of the epaxial region. Longitudinal body position was standardized by selecting a

9
slice at the anteroposterior position of the second rib. For the epaxial region, we
measured the height of the body dorsal to the vertebral centrum and width across the
body at the dorsoventral level of the centrum.
From the CT scans we also measured the percentage of area occupied by bone in
the epaxial region just caudal to the head (area outlined in Fig. 1). The MIP (maximum
intensity projection) tool in Horos was used to create a sagittal thick slice spanning the
mediolateral width of the vertebrae and view the MIP of the slice from the lateral side.
We excised an image of the area bounded by the caudal aspect of the neurocranium, the
vertebral column, the caudal aspect of the first pterygiophore and the dorsum of the fish.
In ImageJ (1.51, Wayne Rasband, NIH), we thresholded the image to include all bone
within the threshold area and measured the percent of the area of the whole image
occupied by bone (i.e., neural spines, supraneurals and first pterygiophore). To test
reproducibility of this method we repeated the whole process three times on the same CT
scan for each species, starting with a new MIP in Horos through to measurement in
ImageJ, and found a maximum variation of ±1% of area in the measurements (e.g., bone
occupying 25±1% of 2D projected area behind the head).
VROMM
For VROMM, we anesthetized specimens with MS-222 and sutured white plastic
beads (1.8 mm diameter) onto the skin of the neurocranium (three to four beads) and
body (four to six beads). Markers were placed as far as possible from each other in a non-
linear arrangement (Fig. 8A), since 3D motion cannot be captured—i.e., one degree of
freedom is lost—when markers are arranged in a straight line, and wider marker

10
distributions can more accurately capture its motion. After marker attachment, we
returned the fish to its tank and allowed it to recover fully prior to starting feeding trials.
Three 1024 PCI Photron high-speed cameras (Photron USA Inc., San Diego, CA, USA)
recorded feeding events from three different perspectives (Fig. 8B,C). In some trials for
E. lateralis we used video from just two cameras, which is sufficient for 3D
reconstruction as long as the markers are visible in both cameras (Brainerd et al., 2010).
We filmed all strikes at 500 Hz with the exception of three trials for L. armatus, which
were filmed at 250 Hz. Before and after each set of feeding trials, we recorded images of
a calibration object—made from Lego bricks with precise 3D locations—inside the tank.
Using XMALab software (version 1.3.1; available from bitbucket.org/xromm/xmalab),
we calibrated the tank space with images of the 3D calibration object and tracked the
external markers to generate XYZ motion coordinates. The precision of tracking external
markers suffers from non-circular marker projections (Knörlein et al., 2016) and from
distortion produced by refraction when filming through multiple media (i.e., water and an
aquarium; Henrion et al., 2015). Nonetheless, the mean standard deviation of intermarker
distances for beads rigidly attached to the neurocranium for this VROMM study was
0.122 mm (based on the standard deviations for 150 pairwise distances from 31 strikes;
0.104 mm for E. lateralis and 0.182 mm for L. armatus) compared with 0.1 mm or less
for XROMM (Brainerd et al., 2010; Knörlein et al., 2016).
To generate 3D motion data from individual markers, we created rigid bodies in
XMALab, which uses the tracked XYZ coordinates of three or more markers to calculate
their motion as a single rigid body with six degrees of freedom. Two rigid bodies were
made, one for the neurocranium and one for a plane defining the position of the body,

11
based on the four to six beads attached to the body (Fig. 8A). Body beads are attached to
soft tissue and are expected to move slightly relative to each other and do not form a true
rigid body. When we calculate "rigid body" motion from 4-6 bead positions, the result is
a 3D pose that averages across the positions of all of the beads (Camp and Brainerd,
2014). In this study, during any given strike, the pairwise distances between the body
beads typically varied less than 0.2 mm and at most up to 1 mm.
Rigid body transformations (translations and rotations) were imported into
Autodesk Maya 2014 (San Rafael, CA, USA) to animate a polygonal mesh model of the
neurocranium and a polygon plane object for the body plane (Fig. 8C). To generate a
mesh model of the neurocranium for VROMM, we CT scanned the specimens with the
markers still attached (see “Morphology” section above for scan details). We created
mesh models of the neurocrania of all individuals in Horos with additional mesh
refinement in MeshLab (ISTI-CNR, Pisa, Italy). We also made mesh models of the first
five vertebrae for anatomical study, although none of the vertebral structures were
animated.
Given that our study includes data from separate XROMM and VROMM
projects, different prey types, sizes, and exclusion criteria were used. Prey were typically
delivered directly in front of the fish, but the position of the food item relative to the
mouth was highly variable (above, below, to a side), as it was often determined by how
the fish approached the prey. For M. salmoides, individuals were recorded feeding on live
goldfish (Camp and Brainerd, 2014). During most feeding trials for L. armatus and E.
lateralis, individuals were recorded performing a single successful strike on a piece of
shrimp or squid. However, in one trial, L. armatus was fed a small live shrimp, and in

12
another trial, the same individual missed on the first strike and performed two additional
strikes—only the first attempt was analyzed since it was the fastest of the three and
involved substantial cranial expansion. We excluded slow strikes with minimal
movement of the cranial elements (e.g., neurocranium, hyoid, and lower jaw). Both E.
lateralis and M. salmoides used neurocranial elevation for every strike. Conversely, L.
armatus sometimes showed no neurocranial elevation or even neurocranial depression,
particularly when taking food from the bottom of the aquarium. We only included strikes
in which L. armatus showed neurocranial elevation, including some bottom strikes,
resulting in seven useable strikes from one individual and just one acceptable strike per
individual from the other three.
Quantifying the AOR
To find the axis of rotation (AOR) we used joint coordinate systems (JCSs),
implemented in Autodesk Maya with the XROMM Maya Tools (version 2.1.1; available
from xromm.org/software). The XROMM and VROMM animations contained two rigid
bodies: the neurocranium and the body plane (Fig. 8A). The body plane provided a fish-
based frame of reference that moved with the fish but did not move as a part of cranial
expansion. To identify the AOR during neurocranial elevation, we created JCSs and
aligned them with the long axis of the fish as defined by the neurocranium and body
plane. JCSs consist of proximal and distal anatomical coordinate systems (ACS). The
proximal ACS was fixed to the body plane and the distal ACS followed the
neurocranium, allowing the JCS to measure neurocranial motion as rotations and
translations relative to the body plane.

13
JCSs were oriented so that Z-axis rotation represents neurocranial elevation (i.e.,
dorsal rotation), Y-axis rotation corresponds to cranial yaw (i.e., lateral rotation to the left
or right), and X-axis rotation to cranial roll (i.e., long-axis rotation). All rotations and
translations refer to motion of the neurocranium relative to the body plane, with zero
rotation defined as the pose of the fish before the onset of neurocranial elevation in each
strike, and zero time as the frame before the onset of neurocranial elevation.
Each JCS at a different position generates different translation values, so we located the
AOR by placing numerous JCSs at different anteroposterior and dorsoventral positions of
the fish in 1-mm increments. This method is based on the principle that even a purely
rotational motion can be measured as having translation, depending on the position of the
JCS relative to the AOR (Fig. 2B). For example, if a JCS is placed anterior to the AOR,
then the magnitude of Y-axis translation will increase in proportion to its distance from
the AOR. Similarly, if the JCS is placed dorsal to the AOR, then X-axis translation will
increase.
To find the anteroposterior position of the AOR for neurocranial elevation, we
placed multiple JCSs in the animation space for each strike until a clear trend in Y-axis
translation values revealed its position (Fig. 2B). We repeated this procedure for finding
the dorsoventral position, but instead of sampling anteroposterior positions and
minimizing Y-translation, we sampled dorsoventral positions and minimized X-
translation. We quantified the position of the AOR as x- and y- coordinates of the
distance (cm) from the occiput. These distances were then normalized to vertebral
centrum lengths (using V5 of each individual) to compare AOR positions among
individuals and across species.

14
Comparison of 2D and 3D methods
We compared the accuracies of 2D (Reuleaux, 1876) and 3D methods using
simulated rotations about AORs placed three distances posterior to the occiput: 0, 10, and
20 mm (Fig. 7). To simulate neurocranial motion during feeding, we created an animation
in Maya containing a neurocranium (with anatomical landmarks) and a body plane. We
applied known rotations to the neurocranium using Maya’s keyframe tool, which allowed
us to set the neurocranium’s initial and final position. The intervening positions were
interpolated by the software to produce a smooth motion from rest to peak neurocranial
elevation. We performed two trials for each of the three AOR positions: one with planar
motion of the neurocranium and one with non-planar 3D motion. Starting from a resting
position, in the first trial (planar motion), the neurocranium was rotated only about a
mediolateral axis, resulting in a total of 15° of neurocranial elevation. In the second trial
(non-planar motion), the neurocranium again reached 15° of elevation from the same
resting position but was also rotated with 7° of yaw (about a dorsoventral axis) and 3° of
roll (about an anteroposterior axis).
We analyzed the simulated data using both the 2D Reuleaux method (Reuleaux,
1876; Chen and Katona, 1999) and the 3D JCS method used in this paper (Fig. 7). The
Reuleaux method locates the AOR by tracking at least two landmarks with 2D kinematics
(Fig. 7A). We tracked six landmarks that were arbitrarily placed on the neurocranium.
We connected the starting (rest) and final (peak neurocranial elevation) positions of each
landmark with a straight line. Finally, we drew perpendicular lines that bisected each
straight line. The point of intersection between the bisecting lines is the estimated
position of the AOR (Fig. 7A). The JCS method locates the AOR by quantifying relative
15
motion between rigid bodies (Figs 2, 7B). For the Reuleaux method, error was measured
as the mean (±s.e.m.) linear distance between the estimated and known AORs.
Statistical analysis
Means and s.e.m. were calculated by taking the mean for each individual and then
the mean of means, with sample size being the number of individuals. To test for inter-
individual and interspecific differences in neurocranial rotations, we performed nested
ANOVAs, with individuals nested within species. Means were calculated from the peak
magnitudes attained during each strike for each of the three neurocranial rotations (i.e.,
elevation, yaw, and roll). For yaw and roll, we ignored directionality (positive and
negative) and instead calculated their means from their absolute values. Then we
conducted Tukey post-hoc tests of pairwise species comparisons to test for significant
differences between species. Statistical significance was declared at the 0.05 probability
level, and all tests were performed using JMP Pro 12.2.0 (SAS Institute Inc., Cary, NC).
Results
Axial morphology
The overall body shape of E. lateralis is tall and laterally compressed, with a
height to width ratio of 2.5±0.17 (mean±s.e.m., N=3) for the whole body and 1.0±0.11 for
the epaxial region (Fig. 3). The axial skeleton in the region just caudal to the head is
comprised of long neural spines, supraneurals and pterygiophores (Fig. 4A). The first two
supraneurals lie adjacent to the anterior aspects of the neural spines of V1 and V2,
respectively, and the third supraneural is positioned posterior to the neural spine of V2.

16
The neural spines from V2 and V3 form an open wedge, inside which the first
pterygiophore and the ventral process from the third supraneural bone are positioned,
effectively filling the space (Fig. 4A). The second pterygiophore lies adjacent to the
posterior aspect of the V3 neural spine, and the third and all subsequent pterygiophores
nearly touch the anterior aspects of the neural spines. The first three vertebrae also have
pre- and post-zygapophyses, with the exception of V1 which lacks pre-zygapophyses
because it is fused with the occiput (Fig. 4D). Post-zygapophyses are robust and protrude
from the lateral body of the centrum, crossing the joint and articulating inferior to the pre-
zygapophysis of the subsequent vertebra. Posterior to V4, the vertebral centra are spool
shaped and lack zygapophyses, with V4 being transitional between the vertebrae with and
without zygapophyses (Fig. 4D).
The overall body shape of M. salmoides is fusiform, with a height to width ratio
of 1.8±0.10 (mean±s.e.m., N=6) for the whole body and 0.66±0.01 for the epaxial region
(Fig. 3). The fusiform body of M. salmoides has shorter neural spines and less overlap
between the second and third neural spines and the supraneurals than in E. lateralis (Fig.
4B). The neural spines of V1 and V2 and the first two supraneurals lie in close
apposition, but the remaining neural spines are more widely spread apart from each other.
The first supraneural lies adjacent to the anterior aspect of the neural spine of V1, a
pattern that is repeated for the two subsequent supraneurals (Fig. 4B). No supraneurals or
pterygiophores fill the space between the neural spines of V3 and V4. The first and
second pterygiophores fill the space between the neural spines of V4 and V5, just as the
third and fourth pterygiophores fill the space between the neural spines of V5 and V6.
Starting with the fifth pterygiophore, only one pterygiophore inserts between each pair of

17
neural spines. Like E. lateralis, the zygapophysial joints start at V1 and begin to decrease
in size around V4 (Fig. 4E).
The body of L. armatus is dorsoventrally compressed with a height to width ratio
of 0.79±0.07 (mean±s.e.m., N=4) for the whole body and 0.34±0.03 for the epaxial
region (Fig. 3). Unlike the other two species, it lacks supraneural bones entirely, resulting
in a gap between the neurocranium and the first pterygiophore (Fig. 4C). Neural spines
and pterygiophores overlap and contact each other in a similar manner to M. salmoides.
The first and second pterygiophores surround the anterior and posterior aspects of the
neural spine of V3, whereas the remaining pterygiophores are evenly distributed between
neural spines. In L. armatus, zygapophysial joints are present from V1 to V5 (Fig. 4F),
though these vertebrae are not associated with any distinct supraneural arrangement like
E. lateralis and M. salmoides. V5 is transitional for vertebrae with articulating
zygapophyses and vertebrae with non-articulating zygapophyses. Vertebrae with non-
articulating zygapophyses have relatively larger intervertebral spaces (spaces between the
vertebral centra) than the more cranial joints (Fig. 4C).
The bones in the area just caudal to the supraoccipital crest of the three species
occupy different proportions of the available space (Fig. 3C). From the images, the neural
spines, supraneurals and pterygiophores appear to be most “densely packed” in E.
lateralis (Fig. 4A), followed by M. salmoides with substantial spaces between the
supraoccipital crest and the first supraneural and between the third supraneural and first
pterygiophore (Fig. 4B). Supraneurals are absent in L. armatus, making this species
appear to have the most open space behind its head (Fig. 4C). To quantify these
observations, we measured the percent area occupied by bone and found a mean (±s.e.m.)

18
of 42±1.5% in E. lateralis, 36±0.8% in M. salmoides and 22±5.5% in L. armatus (Fig.
3C). One-way ANOVA with species as the effect showed a significant overall effect of
species on percentage of bone (P<0.0001) and Tukey pairwise post-hoc tests showed that
all three species were significantly different from each other (p<0.05). These quantitative
results confirm that the neural spines, supraneurals and pterygiophores are most densely
packed in E. lateralis, followed by M. salmoides and then L. armatus.
3D cranial kinematics and the AOR
All three species used neurocranial elevation as part of their suction strikes (Fig.
5). As mentioned above, L. armatus sometimes showed no neurocranial elevation or even
neurocranial depression; only strikes that used neurocranial elevation were included for
L. armatus. Although 3D neurocranial kinematics of the M. salmoides strikes have been
reported previously (Camp and Brainerd, 2014), in that study they were measured using a
JCS positioned at the craniovertebral joint. In this study, we report the 3D neurocranial
kinematics of these strikes as measured by a JCS placed at the AOR, in order to make
them directly comparable to those of L. armatus and E. lateralis.
Neurocranial kinematics were measured with a JCS placed at the AOR during the
expansive phase of each strike—from the onset to the peak of neurocranial elevation.
Means (±s.e.m.) for maximal neurocranial elevation were 7.9±0.7° for E. lateralis (N=4
individuals), 14.4±2.2° for M. salmoides (N=3 individuals), and 11.2±2.8° for L. armatus
(N=4 individuals). Nested ANOVA, with individual nested within species, yielded a
significant overall model (P<0.0001) with significant effects of both individual
(P=0.015) and species (P=0.00046). Tukey pairwise post-hoc tests showed that maximal

19
neurocranial elevation was statistically significantly higher in M. salmoides than in E.
lateralis (p<0.05), although L. armatus was not significantly different from either of the
other two species (p>0.05). Mean (±s.e.m.) duration of the expansive phase was 37.9±3.3
ms for E. lateralis, 63.0±9.9 ms for M. salmoides, and 125.4±13.3 ms for L. armatus. The
maximum observed neurocranial elevation across all strikes for each species was 11.1°
for E. lateralis, 23.8° for M. salmoides, and 36.5° for L. armatus.
In addition to elevating, the neurocranium in all three species yawed and rolled
relative to the body plane (Fig. 5). Cranial yaw denotes the magnitude and direction that
the fish turned its head to the left or right relative to the body during the strike (positive is
to the fish’s left, negative to the right). Means for the magnitude (absolute value) of
maximal yaw were 1.7±0.2° for E. lateralis, 5.0±1.1° for M. salmoides, and 6.3±1.2° for
L. armatus. Nested ANOVA yielded a significant overall model (P=0.0025) with a
significant effect of species (P=0.0025) but not individual (P=0.44). Tukey post-hoc tests
showed that maximal yaw in M. salmoides and L. armatus was not statistically
significantly different (P>0.05), although both had significantly higher yaw than E.
lateralis (P<0.05).
Cranial roll denotes the magnitude and direction that the fish rotated its head
about its long axis (Fig. 5). Means for the absolute magnitude of maximal roll were
0.9±0.1° for E. lateralis, 2.1±0.3° for M. salmoides, and 3.5±0.9° for L. armatus. Nested
ANOVA yielded a significant overall model (P<0.0001) with significant effects of
species (P<0.0001) and individual (P=0.05). Tukey post-hoc tests showed that maximal
roll was significantly different between all three pairs of species (P<0.05).

20
The mean AOR for neurocranial elevation was located closest to the occiput
(craniovertebral joint) in E. lateralis, more caudally in M. salmoides, and most caudally
in L. armatus (Fig. 6). The AORs in all three species were distributed across a wide range
of positions (Fig. 6). In E. lateralis, most AORs were clustered around the occiput,
though two strikes had AORs in positions far dorsal to the vertebral column. Close
examination and re-estimation of AORs for these two outliers reaffirmed the measured
position and yielded no methodological explanation for the far dorsal position. The AORs
in M. salmoides were clustered between the second and fourth IVJs—posterior to those of
E. lateralis—and were almost always at the dorsoventral level of the vertebral column.
Finally, AORs in L. armatus were widely and sparsely distributed across the
anteroposterior and dorsoventral axes.
Discussion
We found significant differences in the percent area of bone occupying the space
behind the head in our three species (Fig. 3C), but our expectation that less bone area and
shorter epaxial height would correlate with more neurocranial elevation was only
partially borne out. Mean neurocranial elevation was higher in M. salmoides than in E.
lateralis, as expected, but L. armatus produced a highly variable amount of neurocranial
elevation, such that the mean magnitude was not significantly different from either of the
other two species (Fig. 5). However, if we consider the maximum magnitude of cranial
elevation observed for each species across all strikes, the pattern does match our
expectations with bone area decreasing in the order E. lateralis, M. salmoides, L. armatus
(Fig. 3) and maximum observed neurocranial elevation increasing in the order E. lateralis

21
(11.1°), M. salmoides (23.8°) and L. armatus (36.5°). The large magnitude of
neurocranial elevation in L. armatus was accompanied by the absence of supraneurals
and the enlarged intervertebral spacing posterior to V5 (Fig. 4C). Conversely, E. lateralis
had the tallest body and epaxial ratio (Fig. 3A-B) and an axial skeleton with long
interdigitating bones (Fig. 4A), along with the least amount of neurocranial elevation.
These data suggest that axial skeleton morphology may indeed be related to the
magnitude and location of dorsal flexion of the vertebral column. However, the data
presented in this study are correlative, and in vivo measurements of the kinematics of the
axial skeleton are needed to test this hypothesis. Furthermore, claims regarding maximal
performance must be made cautiously, as Astley et al. (2013) have previously pointed
out, these claims are more easily falsified than verified. Despite our attempts to elicit
maximal performance, it is possible that such strikes did not occur in this study and that
our study species can produce greater amounts of neurocranial elevation than we
observed.
The anteroposterior position of the AOR for neurocranial elevation varied among
our study species with the mean AOR located closest to the craniovertebral joint in E.
lateralis, farther back in M. salmoides, and most caudal in L. armatus (Fig. 6). In some
instances, E. lateralis and L. armatus had AORs outside the body. Similarly, Van
Wassenbergh et al. (2008) found that when producing neurocranial elevation, pipefish
typically have AORs located outside the body. The mean AORs in E. lateralis and M.
salmoides were located close to the area occupied by supraneurals; very few strikes had
AORs in the region with interdigitating neural spines and pterygiophores. Conversely,
only some AORs in L. armatus were found in the space where supraneurals are absent,

22
and the majority occurred in the region with neural spines and pterygiophores.
Interestingly, that is the region where the spacing of the intervertebral joints (IVJ)
appears to be relatively larger in L. armatus than in the other species (Fig. 4C). These
patterns suggest there could be a relationship between vertebral flexion and the
distribution of the IVJs, neural spines, supraneurals, and pterygiophores.
Despite producing similar mean amounts of neurocranial elevation, M. salmoides
and L. armatus had very different AOR positions. This shows that kinematic similarities
(i.e., magnitude of neurocranial elevation) do not necessarily indicate similar patterns of
dorsal flexion in the IVJs. Conversely, M. salmoides and E. lateralis may be flexing a
similar number of IVJs, but it is likely that M. salmoides is flexing them to a greater
extent to produce more neurocranial elevation than E. lateralis. The more posterior AORs
in L. armatus suggest that they typically distribute dorsal flexion across more IVJs than
E. lateralis and M. salmoides.
In some fishes, neurocranial elevation has been thought to be primarily the
product of flexion at a single joint, based on the specialized appearance of the
surrounding vertebrae (Lesiuk and Lindsey, 1978; Lauder and Liem, 1981). Others have
suggested that multiple joints flex to produce a smooth curve during dorsal flexion in
stargazers (Huet et al., 1999), and still others surmised that the first four to five vertebrae
are involved (Liem, 1978). While our study does not definitively resolve this issue, there
is good reason to think that the species we studied exhibit the latter condition. With the
exception of E. lateralis, nearly all strikes have AORs posterior to the craniovertebral
joint position, and we suggest that flexion is distributed across multiple joints, especially
in strikes that have more caudal AORs. The alternative is that all flexion occurs at a

23
single joint. However, this scenario is biologically implausible since it would require
neurocranial elevation—which often exceeds 10°—to be the sole product of dorsal
flexion at a single IVJ. The degree of IVJ dorsal flexion during feeding has not been
quantified, although Nowroozi and Brainerd (2013) used marker-based XROMM to
quantify axial skeletal motion during the startle response of Morone saxatilis. They found
that dorsal flexion of the IVJs is usually under 5°, and that lateral flexion rarely exceeds
10° in the cervical region, so it seems unlikely that dorsal flexion can exceed 10°. Finally,
even if a single joint could produce all the dorsiflexion for neurocranial elevation, some
mechanism would still be needed to restrict the motion of the surrounding joints that are
otherwise mobile.
Yaw and roll
Rotation about the Y-axis of our JCS (green axis in Fig. 7B) measures yaw of the
head relative to the body and can result from lateral flexion of the body in the region of
the body plane, as well as yaw at the IVJs near the cranium. All three species sometimes
exhibited substantial amounts of yaw, with maximum values exceeding 50% of those for
neurocranial elevation of the strike (Fig. 5). Neurocranial yaw has a more variable
kinematic profile than neurocranial elevation because it is directional (i.e., fish can use
left and right yaw). This directionality reflects how yaw may be used for repositioning
the mouth during prey capture, although this was not measured in our study. Being able
to yaw may allow predators to adjust their strike and place elusive prey within the suction
flow field or directly inside the mouth (Muller et al., 1982; Ferry-Graham et al., 2003;
Day et al., 2005; Higham et al., 2006). While it is possible that differences in the ability

24
to yaw and aim place constraints on feeding behavior and performance, the contributions
of lateral flexion to suction feeding are likely only of secondary importance—unlike the
clear role of lateral flexion in locomotion (Jayne and Lauder, 1995; Westneat and
Wainwright, 2001).
Rotation about the X-axis of our JCS (red axis in Fig. 7B) measures roll of the
head about its long axis, relative to the body. Because neurocranial roll does not appear to
confer any advantage to suction feeding, we were surprised by the amount of cranial roll
detected—although of the three cranial rotations measured, it still had the lowest
magnitudes for each species (Fig. 5). Cranial roll is possibly a byproduct of simultaneous
neurocranial elevation and yaw, which may destabilize the body and produce superfluous
motion in the form of axial torsion. This destabilizing effect may explain why roll in L.
armatus, which produces the most motion across the most joints, is so high. We predicted
that more well-developed zygapophyses may act to prevent roll but we found the
opposite correlation in our three study species. We observed the most roll in L. armatus,
which had distinct zygapophyses on the first five vertebrae (Fig. 4F), less roll in M.
salmoides with zygapophyses on the first four vertebrae (Fig. 4E), and the least roll in the
species with zygapophyses on just the first three vertebrae, E. lateralis (Fig. 4D). It
appears that other features, such as overall body form, may influence the amount of
cranial roll more than the number of zygapophyses.
Advantages and limitations of VROMM
VROMM shows promise as an alternative to XROMM for measuring 3D skeletal
kinematics without X-ray imaging, but only for situations where external markers can be

25
rigidly attached to the bones, as is the case in the dermal bones of ray-finned fishes with
tightly attached skin. The overall marker tracking precision for this study was 0.122 mm,
compared with 0.1 mm or better for XROMM (Knörlein et al., 2016). Several factors
account for the lower precision of VROMM, including refraction, external marker
motion, and calibration object design. Because VROMM uses standard (not X-ray)
cameras, images can be distorted by the refraction that occurs at the air-tank-water
interface. This is especially true when cameras are positioned more obliquely to the tank,
since higher angles of incidence increase refraction and may reduce precision (Henrion et
al., 2015).
We found lower precision for L. armatus than E. lateralis (0.182 versus 0.104
mm), which may have been caused by greater effects of refraction and by greater marker
motion. The effect of refraction is likely to be greater when the animal moves across the
tank during a strike, perhaps explaining why trials were less precise for L. armatus—
which tended to use more body ram—than for E. lateralis. It is also possible that skin
deformations and whole-body movements caused the external markers to move,
especially in L. armatus which had looser skin.
Accuracy of 2D and 3D methods for measuring AOR
The JCS method was generally more accurate than the Reuleaux method when
analyzing non-planar motions. Optimizing the accuracy of the Reuleaux method requires
that certain conditions be met. For example, two landmarks should never form—or come
close to forming—a straight line with the AOR (Fig 7A). This can result in high errors,
since near-parallel lines must extend for longer distances before intersecting. It follows

26
that landmark placement relative to the AOR requires careful consideration when using
the 2D method, but this can only be accomplished if the AOR position is assumed a
priori. Therefore, obtaining high errors with this method becomes more likely when we
consider the high variability of AOR positions among and within species (Fig. 6).
The Reuleaux method also requires a high level of confidence that the motion is
planar, since non-planar motions increase error (Fig. 7C). One way this issue is
commonly avoided is by limiting analysis to footage where the camera is aimed
perpendicular to the animal. But this should be done cautiously, as there can be instances
when motion is non-planar even when perpendicular views are acquired. While tradeoffs
exist between the Reuleaux and JCS methods (e.g., between ease of use and accuracy),
they share the assumption that there is a single AOR. This assumption is reasonable,
especially for the original purpose of the Reuleaux method, which was to describe the
kinematics of machines consisting of rigid parts with constrained motions (Reuleaux,
1876). However, since biological motion is not always so uniform and constrained, the
AOR may change dynamically throughout a behavior. For the purposes of this study,
finding the overall AOR is useful for approximating where dorsal flexion may occur
along the vertebral column. Finally, the JCS method doubled as a tool for both locating
the AOR and measuring 3D neurocranial motion, the latter of which the Reuleaux
method cannot do.
Concluding remarks
Correlating kinematics and the AOR for neurocranial elevation with axial skeletal
morphology is valuable for exploring the role of the axial skeleton during suction

27
feeding. The magnitude of neurocranial motion can approximate the degree of dorsal
flexion the axial skeleton must accommodate, and the AOR can approximate where that
flexion is likely to occur. A more extensive comparison of diverse morphologies and a
more quantitative analysis of in vivo skeletal motion may uncover the relationship
between body shape, axial morphology, and neurocranial kinematics.
Our data show that neurocranial motions during suction feeding are not only 3D,
but that interspecific variation can exist in all dimensions. Neurocranial motions are made
possible by flexion in the cervical region, making their motions neck-like. Since yaw and
roll were sensitive to directionality (Fig. 5), these values likely represent only half the
total flexibility of the vertebral column, such that a mean absolute value of 5° yaw
indicates a total range of motion of 10° (i.e., from left to right). The cervical vertebrae in
Morone saxatilis undergo substantial amounts of lateral flexion during some C-starts
(Nowroozi and Brainerd, 2013), further supporting the idea that fish cervical vertebrae
are not only distinct in their morphology and mechanical properties, but also in their
motions. Given this added complexity, it is unclear how the axial morphology may be
optimized for both feeding and swimming motions and whether functional tradeoffs are
made. This study underscores the importance of studying post-cranial morphology to
understand suction feeding fully.
28
Acknowledgements
We thank Adam Summers and Ben Knörlein for their technical expertise,
J. D. Laurence-Chasen and Thomas Martinson for their assistance with collecting and
processing data, Florian Witzmann for his insights, as well as the staff of University of
Washington, Friday Harbor Labs. This research was supported by the National Science
Foundation [1661129] to E.L.B., and [1655756] to E.L.B and A.L.C, a BBSRC Future
Leader Fellowship to A.L.C., the Blinks Research Fellowship to Y.E.J. and the Bushnell
Research and Education Fund to Y.E.J.
Data availability
Data have been deposited and opened for public use in the XMAPortal (xmaportal. org),
in the studies ‘Largemouth Bass Feeding’, with permanent ID BROWN6 and ‘VROMM
Suction Feeding in Fishes’ with permanent ID BROWN50. Video data stored in
accordance with best practices for video data management in organismal biology
(Brainerd et al., 2017).

29
References
Astley, H. C., Abbott, E. M., Azizi, E., Marsh, R. L. and Roberts, T. J. (2013).
Chasing maximal performance: a cautionary tale from the celebrated jumping
frogs of Calaveras County. J. Exp. Biol. 216, 3947–3953.
Brainerd, E. L., Baier, D. B., Gatesy, S. M., Hedrick, T. L., Metzger, K. A., Gilbert,
S. L. and Crisco, J. J. (2010). X-ray reconstruction of moving morphology
(XROMM): precision, accuracy and applications in comparative biomechanics
research. J. Exp. Zool. A 313, 262–279.
Camp, A. L. and Brainerd, E. L. (2014). Role of axial muscles in powering mouth
expansion during suction feeding in largemouth bass (Micropterus salmoides). J.
Exp. Biol. 217, 1333–1345.
Carroll, A. M., Wainwright, P. C., Huskey, S. H., Collar, D. C. and Turingan, R. G.
(2004). Morphology predicts suction feeding performance in centrarchid fishes. J.
Exp. Biol. 207, 3873–3881.
Carroll, A. M. and Wainwright, P. C. (2006). Muscle function and power output during
suction feeding in largemouth bass, Micropterus salmoides. Comp. Biochem.
Physiol. A 143, 389–399.
Chen, J. and Katona, T. R. (1999) The limitations of the instantaneous centre of
rotation in joint research. J. Oral Rehabil. 26, 274–279.
Day, S. W., Higham, T. E., Cheer, A. Y. and Wainwright, P. C. (2005). Spatial and
temporal patterns of water flow generated by suction-feeding bluegill sunfish
Lepomis macrochirus resolved by particle image velocimetry. J. Exp. Biol. 208,
2661–2671.

30
Ferry-Graham, L. A., Wainwright, P. C. and Lauder, G. V. (2003). Quantification of
flow during suction feeding in bluegill sunfish. Zool. 106, 159–168.
Gray, J. (1933). Studies in animal locomotion. I. The movement of fish with special
reference to the eel. J. Exp. Biol. 10, 88–104.
Gregory, W. K. (1933). Fish skulls: a study in the evolution of natural mechanisms.
Trans. Am. Phil. Soc. 23, 76–481.
Hebrank, J. H., Hebrank, M. R., Long, J. H., Block, B. A. and Wainwright, S. A.
(1990). Backbone mechanics of the blue marlin Makaira nigricans (pisces,
istiophoridae). J. Exp. Biol. 148, 449–459.
Henrion, S., Spoor, C. W., Pieters, R. P. M., Müller, U. K. and van Leeuwen, J. L.
(2015). Refraction corrected calibration for aquatic locomotion research:
application of Snell’s law improves spatial accuracy. Bioinspir. Biomim. 10,
doi:10.1088/1748-3190/10/4/046009.
Higham, T. E., Day, S. W. and Wainwright, P. C. (2006). Multidimensional analysis
of suction feeding performance in fishes: fluid speed, acceleration, strike accuracy
and the ingested volume of water. J. Exp. Biol. 209, 2713–2725.
Holmes, R. (1989). Functional interpretations of the vertebral structure in paleozoic
labyrinthodont amphibians. Hist. Biol. 2, 111–124.
Huet, L., Goosse, V., Parmentier, E. and Vandewalle, P. (1999). About some skeletal
particularities of the first vertebrae related to the mode of prey capture in
Uranoscopus scaber (Uranoscopidae). Cybium 23, 161–167.

31
Jayne, B. C. and Lauder, G.V. (1995). Speed effects on midline kinematics during
steady undulatory swimming of largemouth bass, Micropterus salmoides. J. Exp.
Biol. 198, 585–602.
Knörlein, B. J., Baier, D. B., Gatesy, S. M., Laurence-Chasen, J. D. and Brainerd, E.
L. (2016). Validation of XMALab software for marker-based XROMM. J. Exp.
Biol, doi: 10.1242/jeb.145383.
Lauder, G. V. and Liem, K. F. (1981). Prey capture by Luciocephalus pulcher:
implications for models of jaw protrusion in teleost fishes. Environ. Biol. Fish. 6,
257–268.
Liem, K. F. (1978). Modulatory multiplicity in the functional repertoire of the feeding
mechanism in cichlid fishes. I. Piscivores. J. Morphol. 158, 323–360.
Lesiuk, T. P. and Lindsey, C. C. (1978). Morphological peculiarities in the neck-
bending Amazonian characoid fish Rhaphiodon vulpinus. Can. J. Zool. 56, 991–
997.
Long, J. H., Adcock, B. and Root, R. G. (2002). Force transmission via axial tendons in
undulating fish: a dynamic analysis. Comp. Biochem. Physiol. A 133, 911–929.
Moran, C. J., Ferry, L. A. and Gibb, A. C. (2016). Why does Gila elegans have a bony
tail? A study of swimming morphology convergence. Zool. 119, 175–181.
Muller, M., Osse, J. W. M. and Verhagen, J. H. G. (1982). A quantitative
hydrodynamical model of suction feeding in fish. J. Theor. Biol. 95, 49–79.
Nowroozi, B. N. and Brainerd, E. L. (2012). Regional variation in the mechanical
properties of the vertebral column during lateral bending in Morone saxatilis. J.
R. Soc. Interface 9, 2667–2679.

32
Nowroozi, B. N., Harper, C. J., De Kegel, B., Adriaens, D. and Brainerd, E. L.
(2012). Regional variation in morphology of vertebral centra and intervertebral
joints in striped bass, Morone saxatilis. J. Morphol. 273, 441–452.
Nowroozi, B. N. and Brainerd, E. L. (2013). X-ray motion analysis of the vertebral
column during the startle response in striped bass, Morone saxatilis. J. Exp. Biol.
216, 2833–2842.
Nowroozi, B. N. and Brainerd, E. L. (2014). Importance of mechanics and kinematics
in determining the stiffness contribution of the vertebral column during body-
caudal-fin swimming in fishes. Zool. 117, 28–35.
Porter, M. E., Roque, C. M. and Long, J. H. (2009). Turning maneuvers in sharks:
predicting body curvature from axial morphology. J. Morphol. 270, 954–965.
Reuleaux, F. (1876). The kinematics of machinery: outline of a theory of machines
(translated by A. B. W. Kennedy). London, Macmillan.
Schaeffer, B. and Rosen, D. E. (1961). Major adaptive levels in the evolution of the
actinopterygian feeding mechanism. Integr. Comp. Biol. 1, 187–204.
Thys, T. (1997). Spatial variation in epaxial muscle activity during prey strike in
largemouth bass (Micropterus salmoides). J. Exp. Biol. 200, 3021–3031.
Van Wassenbergh, S., Strother, J.A., Flammang, B. E., Ferry-Graham, L. A. and
Aerts, P. (2008). Extremely fast prey capture in pipefish is powered by elastic
recoil. J. R. Soc. Interface 5, 285–296.
Van Wassenbergh, S., Day, S. W., Hernández, L. P., Higham, T. E. and
Skorczewski, T. (2015). Suction power output and the inertial cost of rotating the
neurocranium to generate suction in fish. J. Theor. Biol. 372, 159–167.

33
Westneat, M. W. and Wainwright, S. A. (2001). Mechanical design for swimming:
muscle, tendon, and bone. Fish Physiol. 19, 271–311.

34
Figures
Figure 1. Axial morphology and neurocranial elevation. Lateral view of the axial
skeleton in the region hypothesized to undergo dorsal flexion during neurocranial
elevation. Shaded in green is the region used for taking bone area measurements.
Illustration is based on the morphology of Micropterus salmoides in a resting position.
BP, body plane; NC, neurocranium; NS, neural spine; Occ, occiput; Pty, pterygiophore;
SN, supraneural; SOC, supraoccipital crest; V, Vertebra.

35
Figure 2. Determining the AOR and kinematic trajectory of the neurocranium. (A)
The starting and final positions of neurocranial elevation. The intersection of the lines
through the neurocranium marks the position of the axis of rotation (AOR). (B)
Hypothetical JCS positions for measuring neurocranial motion. As shown by points 1
(red) and 2 (orange), dorsoventral and anteroposterior placement of a JCS affects
measured X- and Y-translation values, respectively. Translation is reduced only when the
JCS is positioned closer to the actual AOR and translation is zero at the AOR where
motion is captured as a pure rotation. (C) Three examples of neurocranial elevation, with
final neurocranium positions and AORs in corresponding colors, showing the kinematic
significance of AOR position.

36
Figure 3. Quantification of body form and bone area percentage in the region just
caudal to the neurocranium (means±s.e.m.). (A) Body depth measured as dorsoventral
body height divided by width. (B) Depth of the epaxial area. (C) Area percentage
occupied by bone in a 2D X-ray projection of the epaxial area between the neurocranium
and the first dorsal pterygiophore.

37
Figure 4. Comparative axial morphology for three study species. (A-C) Lateral view,
CT volume renderings of (A) E. lateralis, (B) M. salmoides and (C) L. armatus. Images
are maximum intensity projections with inverted gray levels to make X-ray positive
images. (D-F) Mesh models of the first five vertebrae of (D) E. lateralis, (E) M.
salmoides and (F) L. armatus. Mesh models were made from dissected and rearticulated
vertebrae, and are shown in lateral view with cranial to the left. For A, a different contrast
was applied to the supraoccipital crest, relative to the rest of the skeleton, to accurately
show the bone in this area. Occ, occiput; PostZyg, post-zygapophysis; PreZyg, pre-
zygapophysis; V1-V5, vertebrae 1 to 5.

38
Figure 5. Kinematic profiles of the neurocranium, relative to the body plane, during
the expansive phase. In each graph, each line represents rotation during a single strike.
Lines are color coded by strike, so each strike has the same color for all rotations.
Positive roll indicates clockwise rotation of the head (from an anterior view). Positive
yaw indicates the head turning to the left (from a dorsal view). Positive neurocranial
elevation denotes upward head lifting. The Y-axis of each graph is scaled the same
throughout, whereas the X-axis is scaled differently for each species, with time 0
indicating the frame before the onset of neurocranial elevation.

39
Figure 6. Normalized AOR position
for each species. The position of the
AOR for each strike (open circles) is
plotted as the dorsoventral and
anteroposterior distances (normalized
to vertebral centrum length) of the
AOR from the occiput. (A) E. lateralis,
(B) M. salmoides, and (C) L. armatus.
The occiput is the origin (0, 0), with
positive X-and Y-coordinates denoting
caudal and dorsal positions,
respectively. For each species, the
average AOR position is shown as a
large, filled circle. AOR was measured
with the 3D JCS method (Fig. 7B).

40
Figure 7. Comparison of 2D and 3D methods for locating the AOR, using simulated
planar and non-planar neurocranial motion. (A) The 2D Reuleaux method uses
changes in landmark position (red and orange circles) to estimate the true AOR (gray
circle). Each landmark is connected by a line (black dashed arrows), which is then
bisected by a perpendicular line (black solid lines). The intersection of any two
perpendicular lines is the estimated AOR position. Pairwise combinations of landmarks
generate a total of 15 AOR estimates (green circles). (B) The 3D method creates multiple
joint coordinate systems (JCSs) to identify the position that minimizes translation values.
(C) Both methods were used to calculate the AOR from simulations of both planar (black
triangles) and non-planar (gray triangles) neurocranial elevation at three distances
posterior to the occiput. Error for the Reuleaux method was calculated as the mean
(±s.e.m.) linear distance between the 15 estimated AORs and the actual AOR. Maximum
error of the 3D method is equal to the JCS sampling density, 1 mm for these simulations.

41
Figure 8. Methods for VROMM videography. All images are from E. lateralis. (A)
Lateral view, generalized marker attachment sites for the neurocranium (NC) and body
plane (BP). (B) Dorsal view, camera positions used for feeding trials. Blue shading shows
each camera view, with the darkest area showing where the fish is visible from all three
cameras (though only two camera views are needed). (C) High-speed video frames at
mid-strike from all three camera views with VROMM-animated models of the
neurocranium and body plane superimposed. Markers on the pectoral girdle and hypaxial
region are visible but were not analyzed in this study.
42
CHAPTER 2
Dual function of epaxial musculature for swimming and suction feeding in largemouth bass
Yordano E. Jimenez1 and Elizabeth L. Brainerd1
1Department of Ecology and Evolutionary Biology, Brown University, Providence, RI,
USA.

43
Abstract
The axial musculature of many fishes generates the power for both swimming and
suction feeding. In the case of the epaxial musculature, unilateral activation bends the
body laterally for swimming, and bilateral activation bends the body dorsally to elevate
the neurocranium for suction feeding. But how does a single muscle group effectively
power these two distinct behaviors? Prior electromyographic (EMG) studies have
identified fishes’ ability to activate dorsal and ventral epaxial regions independently, but
no studies have directly compared the intensity and spatial activation patterns between
swimming and feeding. We measured EMG activity throughout the epaxial musculature
during swimming (turning, sprinting, and fast-starts) and suction feeding (goldfish and
pellet strikes) in largemouth bass (Micropterus salmoides). We found that swimming
involved obligate activation of ventral epaxial regions whereas suction feeding involved
obligate activation of dorsal epaxial regions, suggesting regional specialization of the
epaxial musculature. However, during fast-starts and suction feeding on live prey, bass
routinely activated the whole epaxial musculature, demonstrating the dual function of this
musculature in the highest performance behaviors. Activation intensities in suction
feeding were substantially lower than fast-starts which, in conjunction with suboptimal
shortening velocities, suggests that bass maximize axial muscle performance during
locomotion and underutilize it for suction feeding.

44
Introduction
For over 500 million years, axial musculature has been integral to the undulatory
locomotion of fishes. After 200 million years of functioning as a locomotor structure
(Fletcher et al., 2014; Webb, 1982), many fishes co-opted the axial musculature for high-
performance suction feeding (Lauder, 1982; Longo et al., 2016; Schaeffer and Rosen,
1961) and integrated the cranial feeding apparatus with the post-cranial musculature.
Although outsourcing power to the trunk muscles enabled fishes to generate powerful
cranial expansion, it placed new mechanical demands on the axial musculature since,
unlike locomotion, which involves lateral flexion of the trunk and tail, suction feeding
involves dorsiflexion of the head and caudoventral rotation of the pectoral girdle. So how
do fish modulate contraction patterns of the axial musculature to produce both swimming
and suction feeding?
One possibility is that each of the two behaviors uses different regions within the
epaxial and/or hypaxial musculature. In this study we focus in on the epaxial
musculature, but a parallel study of hypaxial musculature, particularly in a species that
relies heavily on hypaxial musculature for suction feeding (e.g. catfishes; Van
Wassenbergh et al., 2005) would also be interesting. For epaxial regionalization, a
common view has been that the epaxial musculature just behind the head generates power
for suction feeding (Coughlin and Carroll, 2006; Lauder, 1980; Liem, 1978), while the
remainder of axial musculature is used primarily for locomotion (Ellerby and Altringham,
2001; Franklin and Johnston, 1997; Shadwick et al., 1998). It was only recently
discovered that the axial musculature in some fishes generates over 95% of the power for
suction feeding (Camp et al., 2015; Camp et al., 2018). This expansion power originates

45
from muscle shortening in the cranial two-thirds of the body, which comprises over 70%
of the white axial muscle mass(Camp and Brainerd, 2014). Consequently, swimming and
suction feeding appear to use much of the same muscle mass to generate power,
challenging the notion of a craniocaudal division of labor.
We reviewed prior studies on the activation of the epaxial musculature in
swimming and suction feeding in largemouth bass (Jayne and Lauder, 1995; Thys, 1997)
and synthesized their findings to develop a new hypothesis. We propose that fishes
modulate muscle function by selectively activating ventral regions of the epaxial
musculature for swimming and dorsal regions for suction feeding. We developed this
hypothesis based on the following electromyographic (EMG) evidence. In bass, suction
feeding always activated muscle in the dorsal epaxial regions between 0.15 and 0.25
body lengths (BL), while the ventral regions remained inactive (Thys, 1997). In contrast,
burst swimming (i.e., locomotor behaviors that activate the white musculature) always
activated muscle in the ventral epaxial regions near the tail at ~0.75 BL (Jayne and
Lauder, 1995). Activation of dorsal epaxial regions seemed to depend on the type of burst
swimming (Jayne and Lauder, 1995). For example, fishes consistently activated all
epaxial regions when performing rapid escape and predatory maneuvers (i.e., fast-starts);
however, they activated only the ventral epaxial regions for sprinting, leaving the dorsal
regions inactive (Jayne and Lauder, 1995; also see Ellerby and Altringham, 2001 for
similar results in trout). These studies speculated that differences between sprints and
fast-starts produced these recruitment patterns, but they did not quantify the relationship
between performance and muscle activation patterns.

46
These studies provide a glimpse into the potential contributions of motor control
to the dual function of the epaxial musculature, but several factors preclude our ability to
draw conclusions from the existing data with confidence. Firstly, the swimming studies
did not measure how frequently muscle activity was observed in different regions.
Secondly, Thys (1997) did not measure suction feeding performance, and the swimming
studies did not measure and compare performance within and between locomotor
behaviors. Finally, methodological differences among these studies prevent quantitative
comparisons of the intensity and spatial patterns of activation between swimming and
suction feeding (e.g., electrode construction, different animals, different sampling
distributions).
The goal of this study is to test our functional regionalization hypothesis by
quantifying and comparing the regional contributions of the axial musculature to burst
swimming and suction feeding in largemouth bass. Using electromyography, we
measured electrical activity in the epaxial musculature to identify which regions are
active during low- and high-performance locomotion and feeding. Electrodes were
implanted in the dorsal and middle positions of the epaxial musculature in three
longitudinal positions known to generate power for swimming and/or suction feeding. An
additional electrode was placed in the ventralmost epaxial region of the cranialmost
position (figure 1a). We also quantified suction feeding performance with an intraoral
pressure transducer and evaluated swimming performance with high-speed video.

47
Methods
Animals
Bass were purchased from Hickling’s Fish Farm located in Edmeston, New York.
Fish were kept at Brown University and fed a mixed diet of goldfish and carnivore
pellets. Standard lengths for bass 01, 02, and 04 were 245 mm, 247 mm, and, 259 mm
respectively. All husbandry and experimental procedures complied with Brown
University IACUC protocol #1509000157.
Experimental Design
To detect disparities in muscle activity related to function and performance, we
recorded EMGs during swimming and suction feeding in largemouth bass at different
performance intensities. To elicit variable feeding performance, we alternated between
feeding pellet food and live goldfish and quantified intraoral pressure changes to measure
the effects of food type on performance. We elicited three types of burst swimming—
turns, sprints, and fasts-starts. All three burst swimming behaviors use white muscle
fibers, but they differ in their mechanics and intensities. We categorized turning and
sprinting as lower-performance behaviors and fast-starting as a high-performance
behavior.
Trials were filmed from a dorsal view with a GoPro camera at either 60 or 100
frames per second. To synchronize video with EMG and pressure data, a computer
monitor displaying real-time EMG and pressure recordings was positioned in the
camera’s field of view. Video, EMG, and pressure data for this publication have been
deposited in the ZMAPortal (zmaportal.org) in the study ‘Largemouth bass feeding and

48
swimming EMG’ with permanent ID ZMA17. Video data are stored in accordance with
best practices for video data management in organismal biology (Brainerd et al., 2017).
Bass were generally fed goldfish and pellets in alternating order to ensure that
differential performance was associated with food type and not with satiation. To ensure
that muscle activity during suction feeding was not confounded with locomotor activity,
we used video footage to exclude trials in which any ipsilateral flexion (relative to the
electrodes) of the body is concurrent with the strike. We recorded tail beat frequencies
comparable to the maximum frequencies recorded in other fish species (Bainbridge,
1958; Wardle, 1975) similar in size to our bass (245 mm, 247 mm, and, 259 mm),
suggesting that we indeed elicited strong sprinting performance.
Intraoral Pressure Recordings
To measure intraoral pressure, we surgically implanted a cannula onto the buccal
cavity under anesthesia with buffered tricaine methanesulfonate (Norton and Brainerd,
1993). All fish were given a minimum one-week recovery period after surgery. On the
day of experimentation, the pressure transducer was threaded into to the cannula until the
sensor was partially exposed to the oral cavity.
Prior studies and our pressure data justify the classification of pellet and goldfish
strikes as low- and high-performance behaviors, respectively. Pellet and goldfish strikes
in our study produced significantly different peak pressures, as has been previously
reported in multiple studies (Lauder, 1980; Norton and Brainerd, 1993). Two-way
ANOVA revealed no significant effect of individual on peak pressure and pooled data
from all three individuals showed bass produce significantly greater (P < 0.05) pressure

49
differentials for goldfish than for pellets (figure S1). Furthermore, we elicited peak
pressures comparable to those measured in bass in at least two other studies (Carroll and
Wainwright, 2006; Norton and Brainerd, 1993), suggesting that we elicited maximal or
near-maximal suction-feeding performance.
Electromyography
Bipolar electrodes were constructed from 0.1 mm diameter, enamel-insulated
silver wire. We glued together the last 10 cm of each wire pair along their length with
cyanoacrylate and removed approximately 1 mm of insulation from the tip of each wire at
the glued end. At the exposed end, we separated the last 3 mm of wire into a “V” shape
and bent them back to form recurved anchoring hooks. Each bipolar electrode was placed
inside a 23-gauge hypodermic needle, with the hooked end resting on the beveled
opening of the needle. Electrodes were percutaneously implanted through the soft tissue
between the scales to a depth halfway between the skin and the mid-sagittal plane. Once
all the electrodes had been implanted, they were glued together to form a common cable.
The common cable was secured onto the skin with suture in two locations to relieve any
tension from the electrodes and to prevent them from dislodging from the animal.
Connector pins were soldered onto the exposed ends of the wire once the electrodes had
been implanted and the fish had been returned to its tank.
Electrodes were implanted in a total of nine positions in each bass. The
cranialmost of the longitudinal positions (0.35 0.50, and 0.70 BL) was implanted with
three electrodes corresponding to the different dorsoventral regions of the epaxial
musculature—the dorsal-pointing arm (DPA), the posterior-pointing cone (PPC), and the

50
anterior-pointing cone (APC; figure 1). The data from all body regions include values
from all three bass, with the exception of both the DPA and PPC of the midbody, for
which we collected data from only two out of three individuals (see figure S2 for
electrode sampling distribution). Immediately after collecting data, bass were CT scanned
with an in vivo veterinary CT scanner to confirm electrode placement (Animage Fidex
scanner; isovolumetric voxels 0.15 mm).
Signal Filtering and Processing
Electromyograms were amplified by 10,000 (A-M systems, differential AC
amplifier, model 1700, Everett, WA, USA) with low- and high-pass hardware filters set
to 10 kHz and 100Hz, respectively. A 60 Hz hardware notch filter was also used to
reduce noise from ambient AC circuits. Analog to digital conversion was done using
PowerLab data acquisition hardware at a sampling frequency of 10 kHz, and EMGs were
recorded in LabChart (AD Instruments, Sydney, Australia). Raw EMG signals were
rectified and software-filtered using the biosignalEMG package for R-studio (Guerrero
and Macias-Diaz, 2018). Raw data were processed with a butterworth filter with low- and
high-pass settings of 100 Hz and 1 kHz, respectively. Using the envelope function in
biosignalEMG, we created an envelope around the filtered data using a moving average
with a window size set to 15 points. For each channel, we selected a raw voltage value
for considering whether a muscle was active or inactive; muscles that exceeded this
voltage value were considered to exhibit above-threshold muscle activity (ATMA). To
minimize bias, threshold voltage was selected by visually comparing several (but not all)
trials with different levels of muscle activity. We then selected a voltage value that

51
seemed to represent the minimum threshold for active muscle and applied that value
consistently, including trials that we did not visually examine for setting the threshold
values. We calculated activation intensity by normalizing voltages for all behaviors to
maximum voltage measured by each electrode across all behaviors or within each
behavior (feeding or swimming; as noted in figure legends). The highest intensities
always occurred during fast-starts, so intensities within each electrode were normalized to
the highest fast-start value, except when normalizing within the feeding behaviors.
Statistics
Statistical analyses, including linear regressions, ANOVAs, Tukey post-hoc tests,
and t-tests were performed in R using its native functions. ANOVA’s with significant
results were followed up with Tukey’s HSD post-hoc tests. For all tests, a P-value < 0.05
was considered statistically significant.
Results
Variation of Spatial Activation Patterns
The presence of above-threshold muscle activity (ATMA) in the epaxial
musculature at 0.35 and 0.50 body lengths (BL) varied with food type (figure 2a). The
dorsal-pointing arm (DPA; the dorsal epaxial region) at the cranial position (0.35 BL)
was active for 100% of goldfish and pellet strikes, indicating that muscle activity in the
cranial DPA, in contrast to the midbody and caudal DPA, is obligate during suction
feeding. Furthermore, the cranial and midbody anterior-pointing cones (APC; the ventral
epaxial region) were active for goldfish strikes significantly more often than for pellet
52
strikes (cranial: 79% versus 42%; midbody: 63% versus 35%; paired t-test: P < 0.05).
ATMA percentages for the cranial and midbody posterior-pointing cone (PPC; the
middle epaxial region) were intermediate to those of the DPA and the APC, and though
not statistically different, two out of three bass recruited the cranial PPC and all
individuals recruited the midbody PPC more often for goldfish strikes. Despite variation
across individuals, each bass—with the exception of bass02’s cranial PPC where ATMA
percentages were 100% for both food types—recruited ventral muscle regions (PPC and
APC) more frequently for goldfish strikes compared to pellet strikes.
In contrast to suction feeding, the relationship between burst swimming
performance and regional activation was spatially inverted along the dorsoventral axis
(figure 2b). In all three bass, burst swimming elicited muscle activity from the cranial and
midbody APC for all performance levels and behavior types. Compared to the APC, the
cranial, midbody, and caudal PPC had slightly lower ATMA percentages—though still
above 75%—for turns, sprints, and stage-2 fast-starts. In the cranial, midbody, and caudal
DPA, ATMA percentages for turns and sprints fell between 40 and 65% but remained at
100% for both stages of fast-starts.
Muscle activation varied with longitudinal position for feeding, but not for burst
swimming (figure 2). ATMA percentages for suction feeding generally decreased
craniocaudally, while ATMA percentages for burst swimming behaviors remained
relatively similar. For example, goldfish strikes were similar in the cranial and midbody
DPA (> 90%), but decreased significantly in the caudal DPA (paired t-test: P < 0.05).
ATMA percentages for high-performance swimming were always 100%, indicating that
the epaxial muscle was active in all longitudinal and dorsoventral positions for stage-1

53
and -2 fast-starts. The remainder of the results section addresses data exclusively from the
cranial region at 0.35 BL.
Effects of Activation Intensity on Performance
We found a relationship between behavior and peak muscle activation intensity,
calculated as percent of the peak fast-start voltage (the highest voltages) measured from
each electrode (figure 3). Mean activation intensities in the DPA were generally lowest
for sprints and turning maneuvers (5 to 13%; range of means across individuals),
intermediate for pellet and goldfish strikes (6 to 58%), slightly higher in stage-2 fast-
starts (17 to 65%), and highest in stage-1 fast-starts (56 to 63%). In both the PPC and
APC, feeding strikes had substantially lower mean activation intensities than stage-1 (45
to 86%) and stage-2 (21 to 56%) fast-start intensities. Mean activation intensities in the
PPC and APC were lowest in strikes (0 to 17%), intermediate in sprints and turning
maneuvers (8 to 30%), and highest in stage-1 and -2 fast-starts (45 to 86%).
We performed a multifactorial ANOVA and found that individual, muscle region,
behavior, and interactions between these factors all had a significant effect on activation
intensity—with the exception of muscle region, which considered alone did not have a
significant effect. Within each individual, food type had no significant effect on
activation intensity. Muscle activation intensity was variable between individuals, but
showed a general trend of very high recruitment for fast-starts relative to other behaviors
(figure 3). In all three muscle regions for all individuals, stage-1 fast-starts used
significantly higher activation intensities than sprints, turns, and suction feeding, with the
exception of the DPA in bass02 where goldfish strikes and stage-1 fast-starts were not
54
statistically different. Suction feeding (both food types) always used activation intensities
statistically similar to or greater than sprints and turns.
Continuous performance variables for swimming and suction feeding were
significantly correlated with weighted activation intensity, which estimates the number of
active muscle fibers (figure 4 and table S1). Weighted activation intensity was strongly
correlated with the tail beat frequency of sprinting (figure 4a; bass01: R2 = 0.68; bass02;
R2 = 0.67; bass04; R2 = 0.66), and somewhat less strongly correlated with peak pressure
for all strikes—including failed attempts (figure 4b; bass01: R2 = 0.19 bass02; R2 = 0.43;
bass04; R2 = 0.50; see figure S3 for midbody feeding data). Weighted activation intensity
takes the activation intensity for each electrode and multiplies it by the cross-sectional
area of its corresponding region. The sum of the values was then divided by the total
cross-sectional area of the epaxial muscle to generate an estimate of the percentage of
muscle fibers active within the entire cross-sectional area.
Discussion
Functional Regionalization
Bass modulated function and performance by adjusting the regional distribution
of muscle recruitment while also varying muscle activation intensity (figure 5). Bass
recruited distinct epaxial regions depending on whether they were swimming or suction
feeding (figure 5a, c), yet they remained fully capable of recruiting all three dorsoventral
regions for high-performance behaviors (figure 5b, d). Bass also used a wide range of
activation intensities within and among behaviors, reflecting the different mechanical
demands of each behavior and the range of intensities at which they were performed

55
(figure 3). This was evident in sprinting and suction feeding behaviors where continuous
performance variables correlated strongly with weighted activation intensities (figure 4,
S3). Suction feeding required contributions from more muscle fibers to produce greater
peak pressures during buccal expansion (Carroll and Wainwright, 2006), and sprinting
required contributions from more muscle fibers to increase tail beat frequency and swim
more quickly (Ampatzis et al., 2013). We surmise that the dual function of the axial
musculature for both swimming and suction feeding depends on the ability to produce
these distinct activation patterns.
The dual function of the epaxial musculature was produced primarily through
dorsoventral regionalization, and these regionalized activation patterns are consistent
with the neuroanatomy of this musculature. Axial muscle fibers in fishes are innervated
by both primary and secondary motoneurons (Westerfield et al., 1986). Primary
motoneurons innervate large territories of muscle fibers and receive input from Mauthner
neurons which can produce complete activation of the axial musculature (Ampatzis et al.,
2013; Bello-Rojas et al., 2019; Liu and Westerfield, 1988; Tytell and Lauder, 2002). In
comparison, secondary motoneurons innervate smaller, overlapping territories of muscle
fibers that can produce graded activation of the axial musculature (Ampatzis et al., 2013;
Bello-Rojas et al., 2019; Liu and Westerfield, 1988; McLean et al., 2007). This dual
innervation allows primary motoneurons to activate the entire axial musculature at higher
intensities during fast-starts, while still permitting secondary motoneurons to activate the
dorsal and ventral epaxial regions independently at lower intensities during non-fast-start
behaviors. Interestingly, prior studies suggest that regional activation of the the hypaxial
musclulature may mirror epaxial motor patterns. Hypaxial motoneuron distributions are

56
similar to those of the epaxial musculature (Westerfield et al., 1986), and experimental
data shows decoupled activity of different regions in the post-anal hypaxials of
largemouth bass during locomotion (Jayne and Lauder, 1995). Although these studies
documented the independent activation of myomeric regions (Ellerby and Altringham,
2001; Jayne and Lauder, 1995; Thys, 1997), here we tested and confirmed their
functional significance for both swimming and suction feeding.
Epaxial Contributions to Suction Feeding
Our data indicate that both dorsal and ventral epaxial regions in the cranial two-
thirds of the body can contribute to high-performance suction feeding. Dorsal regions
were nearly always active and used higher intensities than ventral regions (figures 2, 3).
The ventralmost region in the cranial and midbody positions was active for 70% of
goldfish strikes and—despite having significantly lower activation intensities—could still
contribute to power output owing to the relatively large cross-sectional area of the APC
(figures 4, S3). In terms of mass and cross-sectional area, the dorsal-pointing arm (DPA)
was the smallest while the anterior-pointing cone (APC) was the largest—having a cross-
sectional area over twice as large as the DPA. Owing to their size and/or activation
intensities, both dorsal and ventral regions appeared to contribute to high suction power
during buccal expansion.
Our finding of full epaxial activation offers insight into epaxial mechanics in
high-performance suction feeding. Epaxial mechanics have previously been modelled as
a lever system wherein forces from the epaxial musculature act on the in-lever and forces
within the buccal cavity act on the out-lever (Carroll et al., 2004). This model assumed

57
that the fulcrum of this lever system was the post-temporal supra-cleithral (PTSC) joint,
such that only force generated dorsal to the fulcrum would contribute to neurocranial
elevation and force generated ventral to the fulcrum would resist neurocranial elevation.
However, a more recent study found that the axis of rotation (i.e., the fulcrum) for cranial
elevation is positioned at the level of the vertebral column—ventral to the PTSC joint and
ventral to most of the epaxial muscle in bass (Jimenez et al., 2018). Therefore, muscle
positioned dorsal to the fulcrum, including the middle and ventral regions (PPC and APC
and sloping portion between them), may contribute power to neurocranial elevation.
Indeed, bass activated the ventralmost epaxial region (APC) significantly more often for
high-performance strikes than for low-performance strikes in both the cranial and
midbody positions (figure 2a-b), suggesting that APC recruitment contributes to suction
performance. Furthermore, the correlation between weighted activation intensity and
peak pressure in both the cranial (figure 4b) and midbody (figure S3) regions shows that
greater areas of muscle—including the APC—are recruited in order to produce observed
changes in suction performance. However, APC muscle fibers positioned very close to
the vertebral column may shorten very little and potentially contribute more toward joint
stabilization than power production.
We suspect that bass maximize power output of the axial musculature for
swimming (i.e., fast-starts) but underutilize it for suction feeding. Maximizing power
output from muscle, though determined by many other factors (Gabaldón et al., 2008;
Marsh, 1999; Marsh and Bennett, 1986), generally requires meeting two conditions: all
fibers within the muscle must be activated and must shorten at an approximate rate of
one-third of their maximum shortening velocity (Marsh and Bennett, 1986; Rome, 2005).

58
Fast-starts met the first of these conditions by activating all epaxial regions at high
activation intensities (figures 2, 3), and though muscle shortening in swimming has not
been measured in bass, other species have been shown to use optimal shortening
velocities during fast-starts (Franklin and Johnston, 1997; James and Johnston, 1998). In
contrast, suction feeding met neither of these strain-activation conditions, as bass used
suboptimal muscle shortening velocities (Camp et al., 2015) and low activation
intensities (figure 3). Consequently, the epaxial musculature generated submaximal
power for most of their strikes. Interestingly, non-Mauthner dependent behaviors like
sprinting and turning often produced higher activation intensities than those used for
feeding, indicating that bass could—but did not—produce more power from the axial
musculature for feeding (figure 3).
Turning
The bass in our study performed turns characterized by slow, high-amplitude
body flexion where the head and tail nearly touched. Because bass often used this
behavior for repositioning themselves and reversing their direction, with little translation
of the center of mass, we were surprised to find that white muscle was always active
during these relatively slow maneuvers (figure2a), often at intensities comparable to
those of sprinting (figure 3). We suspect that using white muscle for a relatively slow
behavior like turning may be due to the position of the muscle fibers relative to the
vertebral column rather than their contractile properties as fast-twitch muscles. Although
we cannot comment on the activity or inactivity of red muscle fibers during these turns,
we speculate that the large distance between the superficial red muscle and the neutral

59
axis of bending (the vertebral column) would require extreme shortening to produce
considerable lateral flexion (Rome and Sosnicki, 1991). However, deeper white muscle
fibers, being positioned closer to the neutral axis and oriented oblique to the long-axis of
the fish, have a higher gear ratio and may be better for flexing the body with relatively
less muscle fiber shortening (Alexander, 1969; Brainerd and Azizi, 2005).
Evolutionary Considerations of a Dual-Function System
The evolutionary history of the axial musculature poses a challenge: how do we
best evaluate form-function relationships in this dual-function structure? The
conventional approach has been to examine this muscle group from either a swimming or
feeding perspective. However, adopting this strategy poses the risk of misidentifying
form-function relationships, as structures that appear to underperform might actually be
dual-function structures acting within the context of their secondary function. Perhaps a
more appropriate framework would be one that identifies primary and secondary
functions by comparing muscle performance during swimming and suction feeding. If
only one function fully exerts the muscle, it is reasonable to hypothesize that selection
pressure for that function may have been more important in shaping its morphology and
contractile properties (Rome, 1998).
Although many fishes have co-opted the axial musculature for suction feeding, we
are not aware of any studies that have examined whether this co-opting has created
tradeoffs in muscle function and performance. It is reasonable to hypothesize that
tradeoffs exist between high-performance undulatory locomotion and feeding, as both
behaviors recruit all regions of the epaxial musculature yet require disparate types of

60
axial flexion. These different axial motions create distinct strain gradients throughout the
muscle mass—lateral flexion in locomotion (Wakeling and Johnston, 1999) and
dorsoventral flexion in feeding are likely to produce mediolateral and dorsoventral strain
gradients, respectively. Such non-uniform strain of the muscle would likely negatively
affect performance, as muscle fibers would operate at different points on their force-
length and power-velocity curves, thereby decreasing power output. Prior studies have
hypothesized that the complex fiber architecture of the axial musculature functions as a
gearing system that homogenizes muscle fiber strain to allow for high power production
in locomotion (Alexander, 1969; Rome and Sosnicki, 1991; Van Leeuwen et al., 2008;
Wakeling and Johnston, 1999). However, since the muscle strain gradient for suction
feeding occurs on a different axis, feeding would require a different gearing system.
Thus, performance tradeoffs may exist at this muscle-architecture level. Given such
considerations, we suggest that a dual-function framework is a strong conceptual tool for
examining and comparing form-function relationships of the axial musculature in fishes
with diverse locomotor and feeding strategies.

61
Acknowledgments
We are grateful to Erika Tavares for research administrative support, to Thomas Roberts
and Stephen Gatesy for general advice on this project, and Richard Marsh for his
assistance with analyzing EMG signals and his guidance throughout the course of the
experiments. We also thank Ariel Camp, David Ellerby, and Anabela Maia for their
insights and thoughtful discussions. This research was supported by National Science
Foundation (NSF) grants 1655756 and 1661129 to E.L.B. and by the American Society
of Ichthyologists and Herpetologists’ Raney Award, the Bushnell Graduate Education
and Research Fund, and an NSF Graduate Research Fellowship to Y.E.J.
Data availability
Video, EMG, and pressure data used in this study are available on the Zoological Motion
Analysis Portal upon request (zmaportal.org, Study Identifier ZMA17).

62
References
Alexander, R. M. (1969). The orientation of muscle fibres in the myomeres of fishes. J.
Mar. Biol. Assoc. United Kingdom 49, 263–290.
Ampatzis, K., Song, J., Ausborn, J. and El Manira, A. (2013). Pattern of innervation
and recruitment of different classes of motoneurons in adult zebrafish. J. Neurosci.
33, 10875–10886.
Bainbridge, R. (1958). The speed of swimming of fish as related to size and the
frequency and amplitude of the tail beat. J. Exp. Biol. 35, 109–133.
Bello-Rojas, S., Istrate, A. E., Kishore, S. and McLean, D. L. (2019). Central and
peripheral innervation patterns of defined axial motor units in larval zebrafish. J.
Comp. Neurol. (doi: 10.1002/cne.24689)
Brainerd, E. L. and Azizi, E. (2005). Muscle fiber angle, segment bulging and
architectural gear ratio in segmented musculature. J. Exp. Biol. 208, 3249–3261.
Brainerd, E. L., Blob, R. W., Hedrick, T. L., Creamer, A. T. and Müller, U. K.
(2017). Data management rubric for video data in organismal biology. Integr. Comp.
Biol. 57, 33–47. (doi: 10.1093/icb/icx060)
Camp, A. L. and Brainerd, E. L. (2014). Role of axial muscles in powering mouth
expansion during suction feeding in largemouth bass (Micropterus salmoides). J.
Exp. Biol. 217, 1333–1345. (doi: 10.1242/jeb.095810)
Camp, A. L., Roberts, T. J. and Brainerd, E. L. (2015). Swimming muscles power
suction feeding in largemouth bass. Proc. Natl. Acad. Sci. 112, 8690– 8695. (doi:
10.1073/pnas.1508055112)
Camp, A. L., Roberts, T. J. and Brainerd, E. L. (2018). Bluegill sunfish use high

63
power outputs from axial muscles to generate powerful suction-feeding strikes. J.
Exp. Biol. 221, 178160 (doi: 10.1242/jeb.178160)
Carroll, A. M. and Wainwright, P. C. (2006). Muscle function and power output during
suction feeding in largemouth bass, Micropterus salmoides. Comp. Biochem.
Physiol. A. Mol. Integr. Physiol. 143, 389–399.
Carroll, A. M., Wainwright, P. C., Huskey, S. H., Collar, D. C. and Turingan, R. G.
(2004). Morphology predicts suction feeding performance in centrarchid fishes. J.
Exp. Biol. 207, 3873–3881.
Coughlin, D. J. and Carroll, A. M. (2006). In vitro estimates of power output by epaxial
muscle during feeding in largemouth bass. Comp. Biochem. Physiol. - A Mol. Integr.
Physiol. 145, 533–539.
Ellerby, D. J. and Altringham, J. D. (2001). Spatial variation in fast muscle function of
the rainbow trout Oncorhynchus mykiss during fast-starts and sprinting. J. Exp. Biol.
204, 2239–2250.
Fletcher, T., Altringham, J. D., Peakall, J., Wignall, P. and Dorrell, R. (2014).
Hydrodynamics of fossil fishes. Proc. R. Soc. B Biol. Sci. 281, 1–9. (doi.
10.1098/rspb.2014.0703)
Franklin, C. E. and Johnston, I. A. (1997). Muscle power output during escape
responses in antarctic fish. J. Exp. Biol. 200, 703–712.
Gabaldón, A. M., Nelson, F. E. and Roberts, T. J. (2008). Relative shortening velocity
in locomotor muscles: Turkey ankle extensors operate at low V/Vmax. Am. J.
Physiol. - Regul. Integr. Comp. Physiol. 294, 200–210.
Guerrero, J. A. and Macias-Diaz, J. E. (2018). biosignalEMG: Tools for

64
electromyogram signals (EMG) analysis. R package version 2.1.0.
James, R. S. and Johnston, I. A. (1998). Scaling of muscle performance during escape
responses in the fish Myoxocephalus scorpius L. J. Exp. Biol. 201, 913–923.
Jayne, B. C. and Lauder, G. V. (1995). Are muscle fibers within fish myotomes
activated synchronously? Patterns of recruitment within deep myomeric musculature
during swimming in largemouth bass. J. Exp. Biol. 198, 805–15.
Jimenez, Y. E., Camp, A. L., Grindall, J. D. and Brainerd, E. L. (2018). Axial
morphology and 3D neurocranial kinematics in suction-feeding fishes. Biol. Open 7,
bio036335. (doi: 10.1242/bio.036335)
Lauder, G. V. (1980). The suction feeding mechanism in sunfishes (Lepomis): an
experimental analysis. J. Exp. Biol. 88, 49–72.
Lauder, G. V. (1982). Patterns of evolution in the feeding mechanism of actinopterygian
fishes. Am. Zool. 22, 275–285.
Liem, K. F. (1978). Modulatory multiplicity in the functional repertoire of the feeding
mechanism in cichlid fishes. I. Piscivores. J. Morphol. 158, 323–360.
Liu, D. W. and Westerfield, M. (1988). Function of indentified motoneurones and co-
ordination of primary and secondary motor systems during zebra fish swimming. J.
Physiol. 403, 73–89.
Longo, S. J., McGee, M. D., Oufiero, C. E., Waltzek, T. B. and Wainwright, P. C.
(2016). Body ram, not suction, is the primary axis of suction-feeding diversity in
spiny-rayed fishes. J. Exp. Biol. 219, 119–128.
Marsh, R. L. (1999). How muscles deal with real-world loads: the influence of length
trajectory on muscle performance. J. Exp. Biol. 202, 3377–3385.

65
Marsh, R. L. and Bennett, A. F. (1986). Thermal dependence of contractile properties
of skeletal muscle from the lizard Sceloporus occidentalis with comments on
methods for fitting and comparing force-velocity curves. J. Exp. Biol. 126, 63–77.
McLean, D. L., Fan, J., Higashijima, S., Hale, M. E. and Fetcho, J. R. (2007). A
topographic map of recruitment in spinal cord. Nature 446, 71–75.
Norton, S. F. and Brainerd, E. L. (1993). Convergence in the feeding mechanics of
ecomorphologically similar species in the Centrarchidae and Cichlidae. J. Exp. Biol.
176, 11–29.
Rome, L. C. (1998). Matching muscle performance to changing demand. In Principles of
animal design: the optimization and symmorphosis debate (ed. Weibel, E. R.),
Taylor, C. R.), and Bolis, L.), pp. 103–113. Cambridge University Press.
Rome, L. C. (2005). Principles of actuation in the muscular system of fish. IEEE J.
Ocean. Eng. 30, 630–646.
Rome, L. C. and Sosnicki, A. A. (1991). Myofilament overlap in swimming carp. II.
Sarcomere length changes during swimming. Am. J. Physiol. 260, 289–296.
Schaeffer, B. and Rosen, D. E. (1961). Major adaptive levels in the evolution of the
actinopterygian feeding mechanism. Am. Zool. 1, 187–204.
Shadwick, R. E., Steffensen, J. E., Katz, S. L. and Knower, T. (1998). Muscle
dynamics in fish during steady swimming. Am. Zool. 38, 755–770.
Thys, T. (1997). Spatial variation in epaxial muscle activity during prey strike in
largemouth bass (Micropterus salmoides). J. Exp. Biol. 200, 3021–3031.
Tytell, E. D. and Lauder, G. V. (2002). The C-start escape response of Polypterus
senegalus: bilateral muscle activity and variation during stage 1 and 2. J. Exp. Biol.

66
205, 2591–2603.
Van Leeuwen, J. L., Van Der Meulen, T., Schipper, H. and Kranenbarg, S. (2008).
A functional analysis of myotomal muscle-fibre reorientation in developing
zebrafish Danio rerio. J. Exp. Biol. 211, 1289–1304.
Van Wassenbergh, S., Herrel, A., Adriaens, D. and Aerts, P. (2005). A test of mouth-
opening and hyoid-depression mechanisms during prey capture in a catfish using
high-speed cineradiography. J. Exp. Biol. 208, 4627–4639.
Wakeling, J. M. and Johnston, I. A. (1999). White muscle strain in the common carp
and red to white muscle gearing ratios in fish. J. Exp. Biol. 202, 521–528.
Wardle, C. S. (1975). Limit of fish swimming speed. Nature 255, 725–727.
Webb, P. W. (1982). Locomotor patterns in the evolution of actinopterygian fishes. Am.
Zool. 22, 329–342.
Westerfield, M., McMurray, J. V. and Eisen, J. S. (1986). Identified motoneurons and
their innervation of axial muscles in the zebrafish. J. Neurosci. 6, 2267–2277.

67
Figures
Figure 1. Anatomy of the axial musculature and electrode placement. (a) Lateral
view of a largemouth bass showing the serially repeating segments of W-shaped
myomeres of the axial musculature. Blue dots represent electrode placement in three
longitudinal positions: cranial (0.35 BL), midbody (0.50 BL), and caudal (0.70 BL). (b)
Cross-sectional view of the axial musculature, showing the relative proportions and
distributions of red and white muscle fibers. (c) Lateral view of a myomere showing the
three subregions of the dorsal epaxial region considered in this study. Abbreviations:
APC, anterior-pointing cone; DPA, dorsal-pointing arm; PPC, posterior-pointing cone.

68
Figure 2. Percent of trials with above-threshold muscle activity for different
behaviors across different epaxial regions. Each plot shows a different anatomical
region where the top row is dorsal and the left column is cranial. Each bar is the mean ±
s.e.m. of the percentage values from all three individuals (except for swimming behaviors
in the midbody region where N = 2). For feeding behaviors, data from successful and
unsuccessful strike attempts are both included in this analysis. (a) Cranial region at 0.35
BL (b) Midbody region at 0.50 BL and (c) caudal region at 0.70 BL. Abbreviations:
APC, anterior-pointing cone; DPA, dorsal-pointing arm; PPC, posterior-pointing cone;
S1, stage 1; S2, stage 2.

69
Figure 3. Normalized muscle activation intensity in three dorsoventral regions at
0.35 BL. Activation intensities were normalized to the peak fast-start voltage (the highest
voltages) recorded from each electrode. Dorsoventral regions are separated by row and
different individuals are separated by column. For feeding behaviors, only data from
successful strikes are included in this analysis. Each colored box includes a horizontal
line (median value) that separates the second (top) and third (bottom) quartiles, while the
top and bottom error bars are the first and fourth quartiles, respectively, and
individual points are outliers. Abbreviations: APC, anterior-pointing cone; DPA, dorsal-
pointing arm; PPC, posterior-pointing cone; S1, stage 1; S2, stage 2.

70
Figure 4. Effects of muscle activation at 0.35 BL on (a) sprinting and (b) suction
feeding performance. Weighted activation intensity was calculated by normalizing each
electrode to the max voltage measured for the corresponding behavior (feeding or
sprinting), weighing the normalized intensity from each dorsoventral region by its
percentage of epaxial cross-sectional area and adding all the weighted values. Data from
successful and unsuccessful strike attempts are both included in (b). Black circle, bass01;
red triangle, bass02; blue square, bass04. Regression equations, R2 values, and p-values
in Table S1.

71
Figure 5. Diagrammatic representation of the intensities and spatial distributions of
muscle activity associated with different behaviors and performance. Lower-
performance feeding (a) uses only the dorsalmost region at moderate intensities. Higher-
performance feeding (b) recruits the dorsal and ventral regions at high and moderate
intensities, respectively. Lower-performance burst swimming (c; sprinting) typically uses
only the ventralmost region at moderate intensities (20 to 40% full activation). High-
performance burst swimming (d; fast-starts) maximally recruits the entire epaxial muscle
mass. Feeding activation is expected to be bilateral (although this study used only
unilateral electrode sampling), whereas swimming activation is primarily unilateral.

72
Figure S1. Effects of prey type on peak pressure. Data are pooled from all three bass.
Mean ± s.e.m. peak pressures for successful strikes were 1.79 ± 0.09 kPa for pellets (N =
31) and 5.32 ± 0.81 kPa for goldfish (N = 25).

73
Figure S2. Sampling distributions for each individual. Locomotion and feeding data
were collected from all marked sites, except for those marked with an ‘f’.
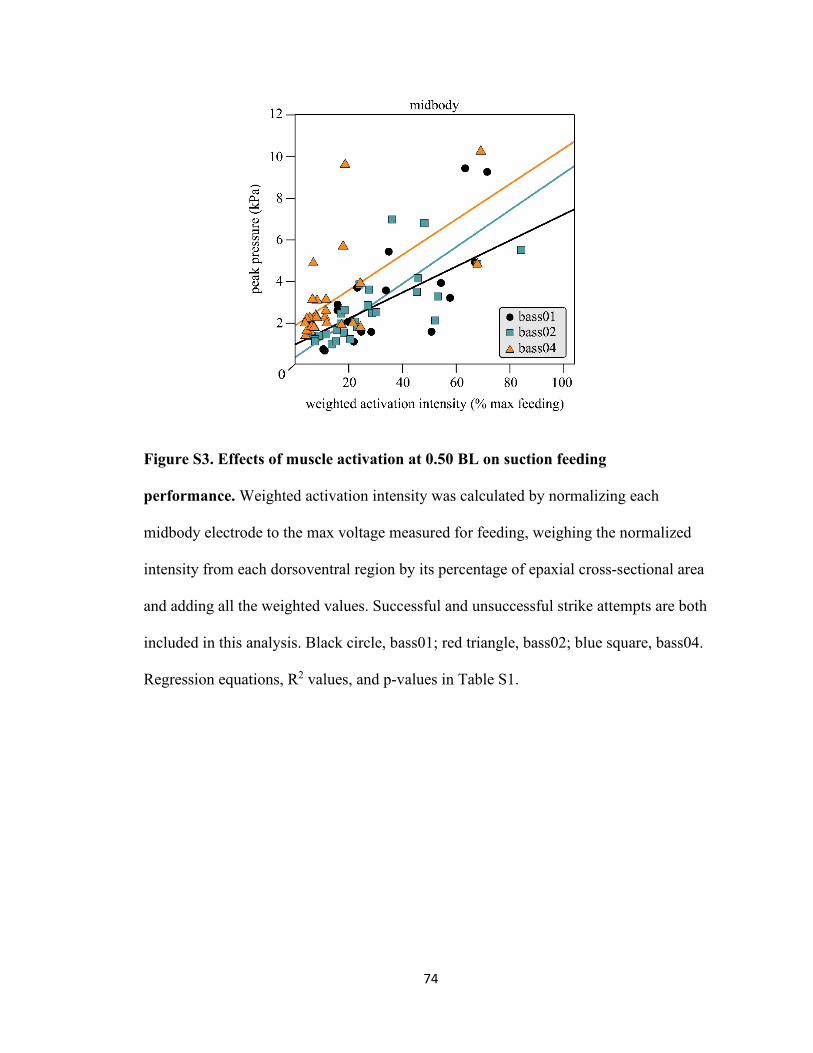
74
Figure S3. Effects of muscle activation at 0.50 BL on suction feeding
performance. Weighted activation intensity was calculated by normalizing each
midbody electrode to the max voltage measured for feeding, weighing the normalized
intensity from each dorsoventral region by its percentage of epaxial cross-sectional area
and adding all the weighted values. Successful and unsuccessful strike attempts are both
included in this analysis. Black circle, bass01; red triangle, bass02; blue square, bass04.
Regression equations, R2 values, and p-values in Table S1.

75
Table S1. Summary of linear regression analyses for figures 4 and S3. In all cases,
there is a positive and significant relationship between performance and weighted
activation intensity. As noted in the methods, we did not analyze midbody data for
sprinting behaviors due to incomplete sampling in that region.

76
CHAPTER 3
Motor control of the epaxial musculature of bluegill sunfish in swimming and suction feeding
Yordano E. Jimenez1, and Elizabeth L. Brainerd1
1Department of Ecology and Evolutionary Biology, Brown University, 80 Waterman
Street, Providence, RI 02912, USA

77
Abstract
Fishes possess an impressive repertoire of swimming and feeding behaviors that
in a majority of cases rely on the same power source: the axial musculature. Since
feeding and locomotion actuate this musculoskeletal system in different ways, integrating
these systems would likely require modular motor control. To characterize bilateral motor
control of the epaxial muscle in feeding and locomotion, we measured muscle activity in
four bluegill sunfish (Lepomis macrochirus) using electromyography. We also compared
these results with our recent findings on largemouth bass (Micropterus salmoides), a
closely related species. We found that bluegill sunfish, like bass, recruit epaxial regions
in a dorsal-to-ventral manner to increase feeding performance, such that high-
performance feeding activates all muscle dorsal to the vertebral column. Unlike bass,
sunfish did not seem to use a ventral-to-dorsal recruitment strategy to increase locomotor
performance. Among all behaviors, fast-starts activated the highest muscle volumes but
were in many cases statistically similar to the muscle volumed activated for suction
feeding on live prey. Muscle activity was present in both sides of the body in nearly all
feeding and fast-start behaviors. However, the active muscle volume was bilaterally
symmetrical in feeding and bilaterally asymmetrical in locomotion, with higher regional
volumes active on the side of muscle shortening. Finally, bluegill sunfish activated
epaxial volumes during high-performance suction feeding that were on par with most
fast-starts, whereas this was not the case for bass. Our findings suggest that centrarchid
fishes use similar motor control strategies for feeding, but interspecific differences in
peak suction feeding performance are due to differences in peak active muscle volume.

78
Introduction
Motor control makes muscle functionally versatile, enabling animals to match
their movements to a wide range of physical and environmental conditions. Variable
muscle recruitment can adjust the speed, force, and direction of movement, and
altogether change what type of behavior is produced (Biewener and Corning, 2001;
Ellerby et al., 2001; Jimenez and Brainerd, 2020). For example, monitor lizards vary
activity of red and white muscle fibers to maintain similar locomotor speeds despite
temperature changes expected to have detrimental effects on locomotor performance
(Jayne et al., 1990). Golden-colored manakins alter the activation patterns of flight
muscles during courtship displays to produce audible snaps with their wings—a behavior
markedly different from powered flight (Fuxjager et al., 2017). Thus, comparing the
activation patterns of muscle under various conditions and during different behaviors can
elucidate the functional versatility, specialization, limitations, and evolution of muscle.
In fishes, the axial musculature is equipped with a neural circuitry that enables
most species to switch seamlessly between distinct mechanical tasks: axial locomotion
and suction feeding (Jimenez and Brainerd, 2020). Axial locomotion involves lateral
body bending produced by alternating contractions of the left and right sides of the axial
musculature. In contrast, suction feeding involves rapid cranial expansion that is
typically, through numerous musculoskeletal linkages in the skull, driven by neurocranial
elevation from the pull of the epaxials, and/or pectoral girdle retraction from the pull of
hypaxials (Camp and Brainerd, 2014; Camp et al., 2018; Camp et al., 2020; Van
Wassenbergh et al., 2005). This configuration enables the axial muscles to routinely
generate over 90% of suction power (Camp et al., 2015; Camp et al., 2018; Jimenez and

79
Brainerd, 2020). These starkly different behaviors involving different musculoskeletal
regions, the head and the body, are united by a common power source, and the emerging
challenge is to determine the mechanical and evolutionary implications of such a dual-
function muscle. A critical first step in this effort is to quantify the motor control patterns
that have integrated these two musculoskeletal systems. To do so, it is important to first
review motor control of axial locomotion and feeding in fishes.
Fishes use several recruitment strategies to adjust performance of axial
locomotion. The first strategy recruits muscle in order of fiber type, where the
progression of muscle activation starts with slow-twitch muscle (small red fibers) and
ends with fast-twitch muscle (large white fibers), a phenomenon known as the size
principle (Boddeke et al., 1959; Henneman, 1957; Henneman et al., 1965). Consequently,
fish activate only red muscle fibers at low swimming speeds but activate an increasing
number of white muscle fibers with increasing tailbeat frequency (Jayne and Lauder,
1994; Jimenez and Brainerd, 2020; Johnston et al., 1977). This pattern is also observed in
fish species with pink muscle fibers, with an intermediate stage of pink fiber activation
between the red and white fiber activation (Coughlin and Rome, 1996; Johnston et al.,
1977). Once white muscle fibers are recruited, subsequent increases in performance are
produced not by activating different fiber types, but by activating a greater number of
white fibers (Bello-Rojas et al., 2019; Jimenez and Brainerd, 2020; McLean et al., 2007),
which comprise 75 – 100% of the muscle’s cross-sectional area in most bony fishes
(Boddeke et al., 1959; Greer‐Walker and Pull, 1975). For example, largemouth bass
(Micropterus salmoides) vary locomotor performance by activating muscle in a ventral-
to-dorsal progression, where low-frequency sprinting recruits only the ventral epaxial

80
regions and high-frequency sprinting activates both ventral and dorsal epaxial regions
(Jimenez and Brainerd, 2020). At the peak of locomotor performance, evasive and
predatory fast-starts, fishes can recruit the totality of fibers in all regions of the axial
musculature (Ellerby and Altringham, 2001; Jimenez and Brainerd, 2020; Lauder, 1980;
Liu and Hale, 2014; Tytell and Lauder, 2002; Westneat et al., 1998). Underlying these
complex activation patterns is a motor pool comprised of spatially diverse motor units
that, depending on the behavior, can independently activate different muscle regions and
different numbers of muscle fibers within those regions (Bello-Rojas et al., 2019;
McLean et al., 2007).
Suction-feeding fishes use the same axial motor pool for both locomotion and
feeding and can modulate performance with variable white muscle activity. Largemouth
bass increase suction feeding performance via incremental recruitment of different
epaxial regions (Jimenez and Brainerd, 2020) and increased activation intensity (Carroll
and Wainwright, 2006; Jimenez and Brainerd, 2020). An important difference is that the
progression of muscle recruitment is inverted in suction feeding, such that muscle activity
starts dorsally and progresses ventrally. For example, low-motivation strikes on pellet
food recruit the dorsal region partially, but high-motivation strikes on live prey are more
likely to activate all epaxial regions. Unlike locomotion, suction feeding exhibits a
rostrocaudal recruitment pattern where low-performance strikes activate rostral muscle,
but high-performance strikes activate rostral, midbody, and caudal muscle (Jimenez and
Brainerd, 2020; Thys, 1997). Until now, axial motor control as a dual-function
phenomenon has only been studied directly in one species so far, largemouth bass
(Jimenez and Brainerd, 2020). Neuroanatomical similarities across taxa would suggest

81
fish share the capacity to modulate behavior and performance with similar motor control
strategies, but good reasons exist to expect variability.
Fishes exhibit a wide range of variability in the ability to suction feed (Carroll et
al., 2004; Longo et al., 2016; Oufiero et al., 2012) and the mechanical contributions of
the axial musculature to suction feeding can vary by species (Camp et al., 2020). Thus,
some species may be capable of generating high muscle power outputs for suction
feeding, whereas others are not. For example, largemouth bass use very low activation
intensities (Jimenez and Brainerd, 2020) and generate only a fraction of the muscle’s
theoretical maximum power in suction feeding (Camp et al., 2015; Carroll et al., 2009).
In contrast, bluegill sunfish routinely generate very high power outputs, up to 438 Wkg-1
(Camp et al., 2018). The varying mechanical contributions of the axial musculature to
suction feeding raises the question—what is responsible for interspecific and intraspecific
variation in suction feeding power?
Research Objectives
The objectives of this study were threefold. (1) Determine whether the dual-
function recruitment patterns found in largemouth bass also exist in a closely-related
species with a different body shape, ecological niche, and feeding strategy, such as
bluegill sunfish (Higham, 2007; Jimenez and Brainerd, 2020; Norton and Brainerd,
1993). Is there evidence that the observed recruitment patterns in suction feeding are
conserved? (2) Assess muscle recruitment in a species that produces high muscle power
for suction feeding relative to bass. Can a species that is more of a ‘suction specialist’
recruit a greater cross-sectional area of the musculature to generate greater power

82
outputs? (3) Quantify and compare the bilateral muscle activity between locomotor and
feeding behaviors in the same set of experimental animals. Is muscle activity bilaterally
symmetrical for suction feeding and bilaterally asymmetrical for swimming?
Methods
Animals
Bluegill sunfish (Lepomis macrochirus) were caught at Morses Pond in
Wellesley, Massachusetts. Fish (standard length 176, 156, 142, and 149 mm for Lm01,
Lm02, Lm03, Lm04, respectively) were housed at Brown University in tanks at room
temperature. We acclimated the fish for a minimum of six weeks, during which time they
were trained to feed on carnivore pellets and live prey, such as goldfish (Carassius
auratus) and rosies (Pimephales promelas). Two weeks prior to surgery and
experimentation, we fed the fish less frequently (and eventually not at all) to increase
their appetite. All procedures were approved by the Institutional Animal Care and Use
Committee (IACUC) of Brown University and followed guidelines and policies set forth
by the IACUC of Brown University.
Experimental Design
To detect disparities in muscle activity related to function and performance, we
recorded EMGs during swimming and feeding in bluegill sunfish at a range of
performance intensities. To elicit variable feeding performance, we alternated between
feeding bass pellet food and live goldfish and quantified intraoral pressure changes to
measure the effects of prey type on performance. We elicited three types of burst

83
swimming—turns, sprints, and fasts-starts. All three burst swimming behaviors use white
muscle fibers, but they differ in their mechanics and intensities. We categorized turning
and sprinting as lower-performance behaviors and fast-starting as a high-performance
behavior. Trials were filmed from a lateral view and a dorsal or anterior view with a
GoPro camera at a minimum of 60 frames per second. We synchronized EMG recordings
with sonomicrometry recordings by sending a 1 Hz signal from the LabChart PowerLab
(Model PL3516) to the sonomicrometry acquisition software. To synchronize data and
video, this 1 Hz signal was also sent to a flashing LED light in the field of view of the
cameras. Video, EMG, and sonomicrometry data for this publication have been deposited
in the ZMAPortal (zmaportal.org) in the study ‘Sunfish EMG and Sonomicrometry in
Feeding and Locomotion’ with permanent ID ZMA27. Video data are stored in
accordance with best practices for video data management in organismal biology
(Brainerd et al., 2017).
Sunfish were fed pellets and live prey (goldfish and rosies) in haphazard order to
ensure that differential performance was associated with food type and not with satiation
during data collection. Data from successful and unsuccessful suction strikes are both
included in this analysis. To ensure that muscle activity during suction feeding was not
confounded with locomotor activity, we used video footage and sonomicrometry to
exclude trials with substantial lateral body movements during the strike. We recorded a
range of tail beat frequencies (3 to 22 Hz, based on the duration of a half wave of muscle
shortening) comparable to the range of frequencies recorded in largemouth bass (Jimenez
and Brainerd, 2020) and other fish species similar in length to our sunfish, suggesting that
we indeed elicited strong sprinting performance.

84
Electrode construction
Bipolar electrodes were constructed from 0.1 mm diameter, Teflon-insulated
stainless-steel wire. We braided together the two wires and added a tighter braid to the
last ~3 cm on the recording end, where we offset the tips by 3 mm. After offsetting the
wires, we removed approximately 1 mm of insulation from the tip of the recording end
for each wire. Connector pins were soldered onto the connector ends of the wire. The
recording end of the bipolar electrode was placed inside the beveled opening of the
needle and back to form a hook, allowing the leads with connector pins to hang on the
outside of the needle.
Surgical procedures
Prior to each surgery, we anesthetized and CT scanned each individual in vivo and
took measurements of the intended implantation sites. Fish were anesthetized via
immersion in 0.12 g/L buffered MS-222 (Tricaine methanesulfonate). We then placed the
fish in a surgical tray with a flow of anesthetic solution and intubated the mouth to flow
oxygenated water over the gills. For each sonomicrometer (4 total per individual), we
removed scales from the implantation site, made a small dermal incision (1 mm), and
used a 16-gauge needle with a blunted tip to make a path for the sonomicrometer-holder
unit. We then sutured the external arms of the holder onto the skin. Electrodes (six to
eight per individual) were then percutaneously implanted through the soft tissue between
the scales to a depth halfway between the skin and the midline. The electrode and
sonomicrometer wires exiting from the muscle were glued together (E600 flexible craft

85
adhesive) to form a common cable, which we then sutured onto the region above the head
to prevent the sonomicrometers from dislodging. The common cable was secured onto
the skin with suture in two locations to relieve any tension from the wires and to prevent
them from dislodging from the animal.
Implantation sites
Electrodes were implanted in a total of six positions in each sunfish at ~35% SL
(Fig. 1A). Three electrodes were implanted on each side of the body, each location
corresponding to the different dorsoventral regions of the epaxial musculature—the
dorsal-pointing arm (DPA), the posterior-pointing cone (PPC), and the anterior-pointing
cone (APC; Fig. 1), anatomical regions which also approximate the territories of distinct
motorneurons (Bello-Rojas et al., 2019). Sonomicrometers were positioned to measure
strain of the musculature at different distances from the neutral axes of bending, not to
measure strain within a single myomere. Each sonomicrometer transducer was mounted
on a custom-made stainless steel holder with three arms (Olson and Marsh, 1998) that
allowed the transducer to be positioned at the desired muscle depth. We implanted two
pairs of transducers (1 mm diameter) in the epaxial musculature on the left side of the
body. Each pair was approximately 15 mm apart, with each unit on either side of the
electrodes. Each pair was also oriented parallel to the long-axis of the animal, defined as
a line going from the snout tip to the notch in the caudal fin. One pair was implanted
dorsomedially at approximately 14 mm dorsal to the vertebral column and 3 mm lateral
to midline. The other pair was implanted ventrolaterally at approximately 8 mm dorsal to
the vertebral column and 5 mm lateral to the midline (Fig. 1A). After each experiment,

86
sunfish were CT scanned with an in vivo veterinary CT scanner to confirm electrode and
sonomicrometer positions (Animage Fidex scanner; isovolumetric voxels 0.15 mm).
Data collection and filtering
Electromyograms were amplified by 1,000 or 10,000 (A-M systems, differential
AC amplifier, model 1700, Everett, WA, USA), depending on signal strength, with low-
and high-pass hardware filters set to 10 kHz and 100 Hz, respectively. A 60 Hz hardware
notch filter was also used to reduce noise from ambient AC circuits. Analog to digital
conversion was done using PowerLab data acquisition hardware at a sampling frequency
of 4 kHz, and EMGs were recorded in LabChart (AD Instruments, Sydney, Australia).
Raw EMG signals were rectified and software-filtered using the biosignalEMG package
for R-studio. Raw data were processed with a butterworth filter with low- and high-pass
settings of 100 Hz and 1 kHz, respectively.
Muscle length (L) data were recorded at a sampling rate of 1041 Hz in SonoLab
software (version 3.4.81) using a Sonometrics system (Model TR-USB Series 8). We
measured water temperature to get the muscle temperature in our ectothermic fish, and
inputted the appropriate speed of sound at the beginning of each experiment to account
for any temperature changes (Marsh, 2016). Post-processing of the sonomicrometer
signals was done in Igor Pro (Wavemetrics) and muscle length data were smoothed using
the smooth.spline function in the stats package in before and after calculating strain (R
Development Core Team, 2018). Initial muscle length (Li) was defined as the muscle
length prior to the onset of the behavior and muscle shortening. Strain was calculated as
(L-Li)/Li.

87
Data Analysis
For each channel, we selected a raw voltage value for considering whether a
muscle was active or inactive; channels with activity exceeding this voltage value were
considered active. Using the envelope function in biosignalEMG, we created an envelope
of the filtered data using a moving average with a window size set to 5 frames or 1.25
milliseconds. We calculated activation intensity (AI) by normalizing the voltage
envelopes (VE) of all trials to the maximum voltage envelope (VEmax) within a given
individual and electrode (AI = VE/VEmax). We estimated active muscle volume by
multiplying activation intensity of each electrode by its relative cross-sectional area, and
adding this value for all three regions. The relative cross-sectional area for each epaxial
region was estimated by dividing the cross-section into dorsoventral thirds, consisting of
a dorsal, middle, and ventral third, and dividing the area of each region by the total
epaxial area. Unless otherwise noted, the activation intensities and active muscle volumes
for feeding behaviors were calculated from the side with the highest value (left or right of
a given region). Activation intensities and active muscle volumes for locomotor
behaviors calculated from the ipsilateral side, the side of the body undergoing muscle
shortening.
Statistics
Statistical analyses, including linear regressions, eta-squared test of variance,
ANOVAs, and Tukey post-hoc tests were performed in R using its native functions.
ANOVA’s with significant results were followed up with Tukey’s HSD post-hoc tests. A
P-value < 0.05 was considered statistically significant for all tests.

88
Results
Muscle activation and strain
Epaxial muscle actively shortened in both feeding and locomotor behaviors (Fig.
2). In both behaviors, muscle activated prior to the onset of muscle shortening. An
example suction strike on a live goldfish (Fig. 2A) shows the onset of simultaneous
bilateral muscle activation in all epaxial regions promptly followed by rapid muscle
shortening. We observed pre-lengthening in some strikes, but this was not present in all
trials. The example fast-start (Fig. 2B) shows bilateral asymmetry of muscle activity,
where stage-1 muscle activity is prominent ipsilaterally (the side of the body undergoing
muscle shortening), followed by prominent contralateral muscle activity that begins just
prior to stage 2. Muscle strain and video data were used to determine the side of active
muscle shortening (i.e., the direction of body bending during swimming behaviors). For
example, strain data aided in determining the which electrodes were ipsilateral and
contralateral in swimming behaviors. For example, muscle activity recorded in the
electrodes on the left side of the body is considered ipsilateral activity only if the fish is
bending to the left. However, we refrain from further analysis of strain data in this study,
as strain data were analyzed in a separate study (Jimenez et al., in review).
Regional Muscle Activation
The presence of muscle activity varied with epaxial region and feeding behavior
(Fig. 3A). On average, the percent of trials with above-threshold muscle activity was
highest in the dorsalmost region (dorsal-pointing arm, DPA), intermediate in the middle
region (posterior-pointing cone, PPC), and lowest in the ventralmost region (anterior-

89
pointing cone, APC). Mean frequencies decreased from dorsal to ventral for all feeding
behaviors on both sides of the body. Furthermore, average frequencies were consistently
highest in goldfish strikes, intermediate in pellet strikes, and lowest in chews. Each
individual activated the DPA more frequently for suction feeding (goldfish and pellet
strikes) than for chewing, except for the left DPA in Lm03. Ventral muscle regions (PPC
and APC) were also activated more frequently for goldfish strikes than for pellet strikes
and chews. Across locomotor behaviors, the frequency of ipsilateral muscle activity
varied with behavior but not by region (Fig. 3B). Stage-1 and -2 fast-starts activated all
six epaxial muscle regions in over 95% of trials. In contrast, ipsilateral muscle activity
was present for over 65% of sprints and over 90% of turning maneuvers in each of the
three regions. Activity in the contralateral muscle during sprints and turns was present in
0-100% of trials, depending on the individual and the muscle region.
Activation Intensity
Muscle activation intensity was significantly affected by behavior, accounting for
58% of the variance in activation intensity (Fig. 4; factorial ANOVA, P < 0.01; eta-
squared test of variance). Other significant effects included individual, and behavior-
region, behavior-individual, and region-individual interactions (P < 0.01, interaction
terms separated by dashes), but combined accounted for less than 3% of the variance
(eta-squared test of variance). Region alone and region-individual-behavior interactions
had no statistically significant effect on activation intensity. Mean ± s.d. normalized
activation intensity for pooled data grouped only by behavior were from highest to

90
lowest: stage-1 fast-starts (54 ±27%), stage-2 fast-starts (33 ± 25%), goldfish strikes (17
± 20%), sprints (3 ± 5%), turns (4 ± 5%), pellet strikes (2 ± 2%), chews (1 ± 2%).
We performed a tukey post-hoc test to determine which interactions between
individual, region, and behavior were statistically significant. Goldfish strikes had higher
mean activation intensities than pellet strikes and chews in all three epaxial regions for all
individuals, including Lm02 where the average difference was small. However, these
differences were only statistically significant in two cases: the goldfish strike-chew
comparison in the DPA of Lm01 and Lm04. Pellet strikes and chews used statistically
similar intensities across all epaxial regions and individuals. Goldfish strikes and stage-1
fast-starts used statistically similar activation intensities in 5 of 12 cases—the DPA and
PPC of Lm01 and Lm03, and the APC of Lm03. In the other 7 cases, stage-1 fast-starts
used statistically higher activation intensities than goldfish strikes. Activation intensities
were also statistically similar in goldfish strikes and stage-2 fast-starts in 10 of 12 cases,
except for the PPC and APC of Lm02, where activation intensities were statistically
greater for stage-2 fast-starts. Goldfish strikes were in all cases statistically similar to
sprints and turns. Within each region of each individual, stage-1 fast-starts used
statistically higher activation intensities than both sprints and turns, and stage-2 fast-starts
used statistically higher activation intensities than sprints. Stage-2 fast-starts used
statistically higher activation intensities than turns in 10 of 12 cases, those statistically
non-significant being the DPA and APC of Lm04. We found no statistical differences
between sprint and turn activation intensities for any region of any individual.

91
Active Muscle Volume
We estimated the percentage of active fibers within the whole cross-sectional area
of the epaxials at 35% standard length (SL) in bluegill sunfish and largemouth bass
(Jimenez and Brainerd, 2020). Behavior had a statistically significant and primary effect
on the active muscle volume in both species, accounting for 73% of variance in bass and
59% of variance in sunfish (factorial ANOVA, P < 0.01; eta-squared). Within each
species, all other significant and non-significant effects combined accounted for less than
4% of variation. Furthermore, we suspected that a substantial portion of intraspecific
variation in active muscle volume was due to motivation and performance. Thus, we
pooled all data to statistically test species differences in total activation intensity (Fig. 5).
Behavior, species, and behavior-species interactions all had statistically significant
effects (factorial ANOVA, P <0.01) but behavior accounted for 60% of the variance
(60%) as compared to 2% explained by the other two variables (eta-squared test). Sunfish
and bass used similar activation intensities for each behavior except turns (tukey post-hoc
test, P < 0.01). In both species, stage-1 fast-starts activated significantly more muscle
volume than all other behaviors, including stage-2 fast-starts. Stage-2 fast-starts activated
significantly more muscle volume than all other behaviors, except stage-1 fast-starts.
Bilateral Symmetry of Activation Intensity
Bilateral activation intensity was symmetrical in feeding (similar intensities on the
left and right sides) but asymmetrical in axial locomotion (higher intensities ipsilaterally).
Feeding behaviors used bilaterally symmetrical activation intensities at a statistically
greater frequency than swimming (Fig. 6). Bilateral symmetry was significantly affected

92
by function—feeding or locomotion—in all three muscle regions (factorial ANOVA
followed by tukey post-hoc tests, P < 0.001). Although the other interactions also had a
statistically significant effect on bilateral symmetry (function-region, function-individual,
function-region-individual), these interactions combined explained only 7% of variance,
whereas function alone explained 86% of variance (eta-squared test). As a result, we
plotted the pooled data from all muscle regions of all four individuals (Fig. 6). The
percentage of trials with bilateral symmetry were then taken for each electrode of each
individual for each behavior. Activation intensity was bilaterally symmetrical in more
than 75% of feeding trials for 30 of 36 points (4 fish x 3 bilateral electrode pairs per fish
x 3 feeding behaviors). Conversely, activation intensity was bilaterally symmetrical for
less than 25% of swimming trials for 43 of 48 points.
Bilaterally symmetrical activation intensities were defined differently for feeding
and locomotion, given inherent differences in body movement: axial locomotion uses
lateral body flexion and feeding uses dorsiflexion (Jimenez et al., in review; see methods
for explanation of statistical analysis). For feeding, we tested for similarity of activation
intensity between electrode pairs in the left and right sides while ignoring which side had
the higher value. For swimming, we considered only whether ipsilateral activity (the side
producing muscle shortening and positive mechanical work) was greater than
contralateral activity. Given these a priori expectations based on the mechanics of each
behavior, the threshold of similarity (feeding) or difference (swimming) for each
behavior was based on the highest standard deviation measured for a behavior in any
given electrode of the individual. If muscle activation intensities of the left and right sides
were within 20% for a goldfish strike or within 2% for a chew (absolute percentage), then
93
that specific trial was counted as symmetrical. For swimming, stage-1 ipsilateral
activation intensity had to be 27% higher than contralateral activity during stage 1 to be
counted as asymmetrical or ipsilateral sprint activity needed an activation intensity that
was 5% higher than contralateral activity.
Discussion
Comparison of Bluegill Sunfish and Largemouth Bass
Muscle recruitment patterns of bluegill sunfish show important similarities and
differences to those of largemouth bass (Jimenez and Brainerd, 2020). Similarities
between these species include (1) dorsal-to-ventral activation of the epaxial musculature
associated with increased feeding performance, (2) activation of all epaxial regions in
fast-starts, and (3) substantially higher activation intensities for fast-starts than for all
other behaviors. Differences between these species include (1) bluegill sunfish did not
show a strong dorsoventral regionalization of muscle activity associated with swimming
performance, whereas largemouth bass were less likely to use the dorsal muscle regions
for low-performance swimming, (2) bluegill sunfish used activation intensities for
goldfish strikes that were substantially higher than pellet strikes, whereas these were very
similar in largemouth bass, (3) bluegill used activation intensities for the highest
performance goldfish strikes that were similar to the highest activity in fast-starts.
Overall, the recruitment patterns observed in largemouth bass and bluegill sunfish are
consistent with a neuroanatomy, described in zebrafish (Danio rerio) and goldfish
(Cyprinus carpio), which consists of motoneurons that innervate overlapping
dorsoventral epaxial regions (Bello-Rojas et al., 2019; Fetcho, 1987; Westerfield et al.,

94
1986). Our observations and those made in prior anatomical and experimental studies
suggest that teleost fishes possess the pre-requisite neuroanatomy necessary for
modulating suction feeding performance through regionalized and graded recruitment of
axial muscle.
Differences between largemouth bass and bluegill sunfish also suggest that
muscle activation intensity can limit muscle power output during suction feeding. Active
muscle volume for sunfish and bass overlap considerably (Fig. 5), coinciding with the
overlapping mass-specific power outputs generated by the epaxial muscle of these
species (Camp et al., 2018). Yet, at the highest levels of suction feeding performance,
bass and sunfish produce considerably different muscle power outputs, and as we find
here, the highest recorded active muscle volumes are considerably greater in sunfish as
compared to the highest values for bass (Fig. 5). For example, the highest recorded mass-
specific power of the axial muscle for sunfish (438 Wkg-1) is over three times greater
than that recorded for bass (141 Wkg−1; Camp et al., 2018), and here we showed sunfish
routinely used active muscle volumes two to three times greater than the highest value
recorded in bass (Fig. 5). These complementary findings suggest that although epaxial
muscle is critical to suction feeding in these species, only some species may maximize
the mechanical potential of the muscle for suction feeding. Sunfish generate very high
suction powers using epaxial activation intensities on par with fast-starts, whereas bass
do not.

95
Comparing Bilateral Mechanics
Analyzing the bilateral symmetry of activation intensity of the epaxial
musculature revealed that feeding and locomotion use distinct motor control strategies
(Fig. 6) and, consequently, different mechanical strategies (see Westneat et al., 1998 and
Tytell and Lauder, 2002 for bilateral asymmetry along the body). Feeding and
locomotion involve different muscle synergies, as each behavior requires the axial muscle
to flex in a different plane (Jimenez et al., in review). In swimming, the left and right
sides of the body are antagonistic: active shortening on one side (ipsilateral: positive
work) tends to produce lengthening on the other side (contralateral: negative work). In
suction feeding, the left and right sides of the body are synergistic, as muscle on both
sides generate positive work to elevate the neurocranium. Thus, if positive work
production is unilateral for swimming but bilateral for feeding, it is plausible that high-
performance suction feeding can produce higher net muscle power outputs than fast-
starts. Although axial muscle in opposite sides of the body is necessarily antagonistic in
locomotion, this arrangement may still provide performance advantages.
It has been speculated that the preparatory phase of the fast start (stage one) can
enhance performance in the propulsive phase (stage two) (Franklin and Johnston, 1997).
Higher muscle power outputs, higher mechanical outputs, velocities, and accelerations in
stage-2 fast-starts provide evidence of enhancement (Altringham and Johnston, 1990;
Frith and Blake, 1995; James and Johnston, 1998; Tytell and Lauder, 2008), although the
specific mechanisms of performance enhancement remain unclear. Since active
lengthening of muscle enhances force production, active lengthening of contralateral
muscle during stage one increases muscle force and power in stage two (James and

96
Johnston, 1998). However, only a relatively small percentage of muscle fibers actively
lengthen in swimming, and any mechanical enhancement due to active lengthening would
be limited to that smaller group of fibers. Thus, a hypothesis of stage two mechanical
enhancement would have to account for active lengthening in a few fibers and passive
lengthening in most fibers. An alternative hypothesis suggests that intramuscular
pressures in the contralateral muscle enhances fast-start performance through elastic
energy storage (Westneat et al., 1998), and not necessarily enhanced muscle
performance. Finally, competing hypotheses exist for explaining contralateral muscle
activity and higher stage-2 performance, including body stiffening, force transmission,
and escape trajectory (Westneat et al., 1998), in which contralateral activity is not
primarily explained in terms of mechanical enhancement. Future studies are needed to
more precisely establish or rule out any of these hypothesized mechanical functions,
which may vary across species with different body shapes and swimming modes (R
Development Core Team, 2018).
Muscle Activation in Fast-starts
Bluegill sunfish activated epaxial muscle bilaterally for fast-starts, but with higher
activation intensities on the side of muscle shortening (Fig. 2,6). Other fish species have
also been shown to activate the axial muscle bilaterally for fast-starts, although muscle
recruitment patterns for fast-starts can vary intra- and interspecifically (Czuwala et al.,
1999; Ellerby and Altringham, 2001; Hale, 2002; Tytell and Lauder, 2002; Westneat et
al., 1998). One example of intraspecific variation includes the muskellunge (Esox
masquinongy), which activate muscle unilaterally along the whole body during stage-1 of

97
C-starts, but activate muscle bilaterally in posterior regions during stage-1 of S-starts
(Hale et al., 2002). Interspecific variation of bilateral muscle activity during C-starts
ranges from some species using bilateral activity for some stages, unilateral activity for
other stages, and in some cases, no activity whatsoever in stage-2 fast-starts (Hale et al.,
2002). In comparison, we show both qualitatively (Fig. 2B) and quantitatively (Fig. 3B)
that bluegill sunfish use bilateral muscle activity in both stages of the fast-start. Two
factors may account for these interspecific differences, one biological and the other
methodological. The biological source of variation could be the diversity of neural
circuits that drive fast-starts (Liu and Hale, 2014). Although it is plausible that these
differences are due to interspecific differences in muscle activation patterns, we suspect
the more important factor is methodological. We used a thresholding method to
determine whether the muscle was active or inactive, whereas other studies used different
methods. In some cases, EMG bursts with very low voltages seem to be reasonably ruled
out as inactive, but in our analysis may have been included as active. Although these
methodological and biological factors may have important interpretive implications, it is
worth noting that all are in agreement that muscle on the side of muscle shortening uses
higher levels of muscle activity than muscle on the side of muscle lengthening for fast-
starts (Fig. 6).
Comparing Muscle Function Across Behaviors
Species from various vertebrate taxa have been shown to modulate muscle
activity in response to variable conditions and for different behaviors (Azizi et al., 2008;
Biewener and Gillis, 1999; Carr et al., 2011; Gillis and Biewener, 2000; Roberts et al.,
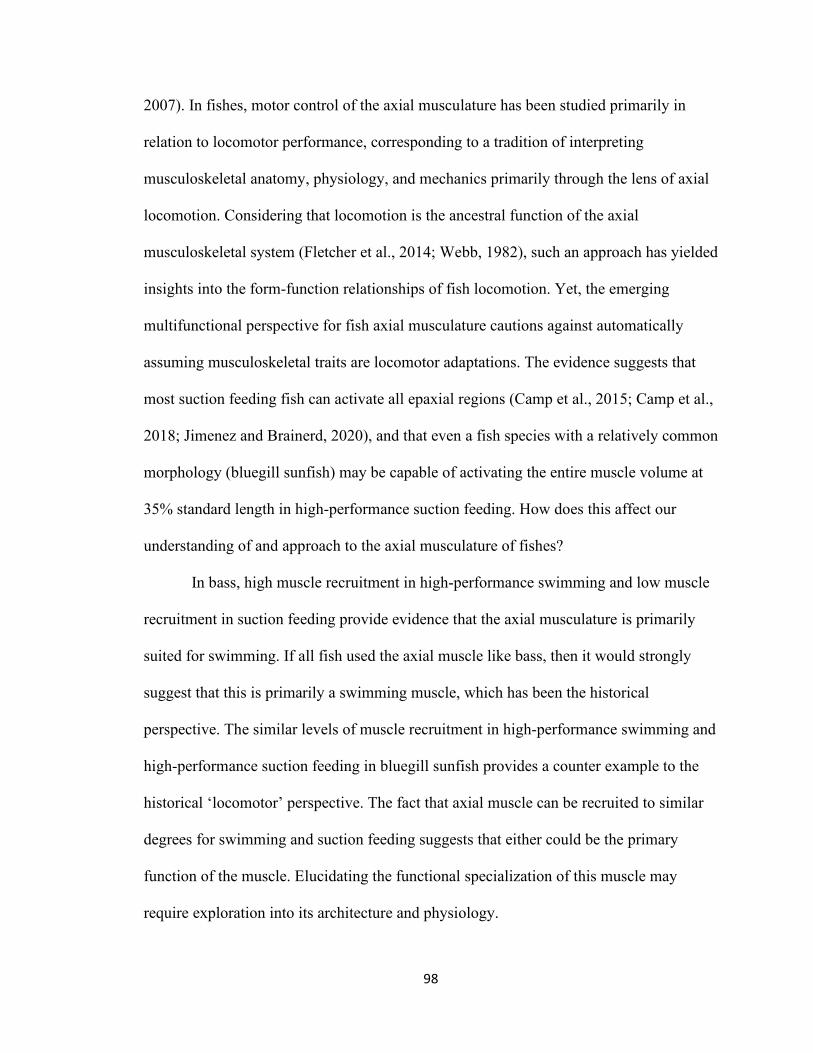
98
2007). In fishes, motor control of the axial musculature has been studied primarily in
relation to locomotor performance, corresponding to a tradition of interpreting
musculoskeletal anatomy, physiology, and mechanics primarily through the lens of axial
locomotion. Considering that locomotion is the ancestral function of the axial
musculoskeletal system (Fletcher et al., 2014; Webb, 1982), such an approach has yielded
insights into the form-function relationships of fish locomotion. Yet, the emerging
multifunctional perspective for fish axial musculature cautions against automatically
assuming musculoskeletal traits are locomotor adaptations. The evidence suggests that
most suction feeding fish can activate all epaxial regions (Camp et al., 2015; Camp et al.,
2018; Jimenez and Brainerd, 2020), and that even a fish species with a relatively common
morphology (bluegill sunfish) may be capable of activating the entire muscle volume at
35% standard length in high-performance suction feeding. How does this affect our
understanding of and approach to the axial musculature of fishes?
In bass, high muscle recruitment in high-performance swimming and low muscle
recruitment in suction feeding provide evidence that the axial musculature is primarily
suited for swimming. If all fish used the axial muscle like bass, then it would strongly
suggest that this is primarily a swimming muscle, which has been the historical
perspective. The similar levels of muscle recruitment in high-performance swimming and
high-performance suction feeding in bluegill sunfish provides a counter example to the
historical ‘locomotor’ perspective. The fact that axial muscle can be recruited to similar
degrees for swimming and suction feeding suggests that either could be the primary
function of the muscle. Elucidating the functional specialization of this muscle may
require exploration into its architecture and physiology.

99
Acknowledgments
We are grateful to Erika Tavares for research administrative support, to Thomas Roberts
and Andrew Biewener for valuable comments and discussion on the manuscript, to David
Ellerby for help with collecting animals, and to Jake Parsons, Jarrod Petersen, and Amy
Rutter for assistance with surgeries. This research was supported by National Science
Foundation (NSF) grant nos. 1655756 and 1661129 to E.L.B., a Doctoral Dissertation
Enhancement Grant from the Bushnell Graduate Education and Research Fund to Y.E.J.
and an NSF Graduate Research Fellowship to Y.E.J.

100
References
Altringham, J. D. and Johnston, I. A. (1990). Modelling muscle power output in a
swimming fish. J. Exp. Biol. 148, 395–402.
Azizi, E., Brainerd, E. L. and Roberts, T. J. (2008). Variable gearing in pennate
muscles. Proc. Natl. Acad. Sci. 105, 1745–1750.
Bello-Rojas, S., Istrate, A. E., Kishore, S. and McLean, D. L. (2019). Central and
peripheral innervation patterns of defined axial motor units in larval zebrafish. J.
Comp. Neurol. 2557–2572.
Biewener, A. A. and Corning, W. R. (2001). Dynamics of mallard (Anas
platyrhynchos) gastrocnemius function during swimming versus terrestrial
locomotion. J. Exp. Biol. 204, 1745–1756.
Biewener, A. A. and Gillis, G. B. (1999). Dynamics of muscle function during
locomotion: accommodating variable conditions. J. Exp. Biol. 202, 3387–3396.
Boddeke, R., Slijper, E. J. and Van Der Stelt, A. (1959). Histological characteristics of
the body musculature of fishes in connection with their mode of life. Proc. K.
Ned. Akad. van Wet. 62, 576–588.
Brainerd, E. L., Blob, R. W., Hedrick, T. L., Creamer, A. T. and Müller, U. K.
(2017). Data management rubric for video data in organismal biology. Integr.
Comp. Biol. 57, 33–47.
Camp, A. L. and Brainerd, E. L. (2014). Role of axial muscles in powering mouth
expansion during suction feeding in largemouth bass (Micropterus salmoides). J.
Exp. Biol. 217, 1333–1345.
Camp, A. L., Roberts, T. J. and Brainerd, E. L. (2015). Swimming muscles power

101
suction feeding in largemouth bass. Proc. Natl. Acad. Sci. 112, 8690– 8695.
Camp, A. L., Roberts, T. J. and Brainerd, E. L. (2018). Bluegill sunfish use high
power outputs from axial muscles to generate powerful suction-feeding strikes. J.
Exp. Biol. 221, jeb.178160.
Camp, A. L., Olsen, A. M., Hernandez, L. P. and Brainerd, E. L. (2020). Fishes can
use axial muscles as anchors or motors for powerful suction feeding. J. Exp. Biol.
223, jeb.225649.
Carr, J. A., Ellerby, D. J. and Marsh, R. L. (2011). Function of a large biarticular hip
and knee extensor during walking and running in Guinea fowl (Numida
meleagris). J. Exp. Biol. 214, 3405–3413.
Carroll, A. M. and Wainwright, P. C. (2006). Muscle function and power output during
suction feeding in largemouth bass, Micropterus salmoides. Comp. Biochem.
Physiol. A. Mol. Integr. Physiol. 143, 389–399.
Carroll, A. M., Wainwright, P. C., Huskey, S. H., Collar, D. C. and Turingan, R. G.
(2004). Morphology predicts suction feeding performance in centrarchid fishes. J.
Exp. Biol. 207, 3873–3881.
Carroll, A. M., Ambrose, A. M., Anderson, T. A. and Coughlin, D. J. (2009). Feeding
muscles scale differently from swimming muscles in sunfish (Centrarchidae).
Biol. Lett. 5, 274–277.
Coughlin, D. J. and Rome, L. C. (1996). The roles of pink and red muscle in powering
steady swimming in scup, Stenotomus chrysops. Am. Zool. 36, 666–677.
Czuwala, P. J., Blanchette, C., Varga, S., Root, R. G. and Long, J. H. (1999). A
mechanical model for the rapid body flexures of fast-starting fish. Proc. 11th Int.

102
Symp. Unmanned Untethered Submers. Technol. 415–426.
Ellerby, D. J. and Altringham, J. D. (2001). Spatial variation in fast muscle function of
the rainbow trout Oncorhynchus mykiss during fast-starts and sprinting. J. Exp.
Biol. 204, 2239–2250.
Ellerby, D. J., Spierts, I. L. Y. and Altringham, J. D. (2001). Fast muscle function in
the European eel (</i>Anguilla anguilla<i> L.) during aquatic and terrestrial
locomotion. J. Exp. Biol. 204, 2231–8.
Fetcho, J. R. (1987). A review of the organization and evolution of motoneurons
innervating the axial musculature of vertebrates. Brain Res. Rev. 12, 243–280.
Fletcher, T., Altringham, J. D., Peakall, J., Wignall, P. and Dorrell, R. (2014).
Hydrodynamics of fossil fishes. Proc. R. Soc. B Biol. Sci. 281, 1–9.
Franklin, C. E. and Johnston, I. A. (1997). Muscle power output during escape
responses in antarctic fish. J. Exp. Biol. 200, 703–712.
Frith, H. R. and Blake, R. W. (1995). The mechanical power output and
hydromechanical efficiency of northern pike (Esox lucius) fast-starts. J. Exp. Biol.
198, 1863–1873.
Fuxjager, M. J., Fusani, L., Goller, F., Trost, L., Maat, A. Ter, Gahr, M., Chiver, I.,
Ligon, R. M., Chew, J. and Schlinger, B. A. (2017). Neuromuscular
mechanisms of an elaborate wing display in the golden-collared manakin
(Manacus vitellinus). J. Exp. Biol. 220, 4681–4688.
Gillis, G. B. and Biewener, A. A. (2000). Hindlimb extensor muscle function during
jumping and swimming in the toad (Bufo marinus). J. Exp. Biol. 203, 3547–3563.
Greer‐Walker, M. and Pull, G. A. (1975). A survey of red and white muscle in marine

103
fish. J. Fish Biol. 7, 295–300.
Hale, M. E. (2002). S- and C-start escape responses of the muskellunge (Esox
masquinongy) require alternative neuromotor mechanisms. J. Exp. Biol. 205,
2005–2016.
Hale, M. E., Long Jr., J. H., McHenry, M. J. and Westneat, M. W. (2002). Evolution
of behavior and neural control of the fast-start escape response. Evolution (N. Y).
56, 993–1007.
Henneman, E. (1957). Relation between size of neurons and their susceptibility to
discharge. Science (80-. ). 126, 1345–1347.
Henneman, E., Somjen, G. and Carpenter, D. O. (1965). Functional significance of
cell size in spinal motoneurons. J. Neurophysiol. 28, 560–580.
Higham, T. E. (2007). Feeding, fins and braking maneuvers: locomotion during prey
capture in centrarchid fishes. J. Exp. Biol. 210, 107–117.
James, R. S. and Johnston, I. A. (1998). Scaling of muscle performance during escape
responses in the fish Myoxocephalus scorpius L. J. Exp. Biol. 201, 913–923.
Jayne, B. C. and Lauder, G. V. (1994). How swimming fish use slow and fast muscle
fibers: implications for models of vertebrate muscle recruitment. J. Comp.
Physiol. A 175, 123–131.
Jayne, B. C., Bennett, A. F. and Lauder, G. V. (1990). Muscle recruitment during
terrestrial locomotion: How speed and temperature affect fibre type use in a
lizard. J. Exp. Biol. 152, 101–128.
Jimenez, Y. E. and Brainerd, E. L. (2020). Dual function of epaxial musculature for
swimming and suction feeding in largemouth bass. Proc. R. Soc. B Biol. Sci. 287,

104
p.20192631.
Jimenez, Y. E., Marsh, R.L., and Brainerd, E.L. (2021) A biomechanical paradox in
fish: swimming and suction feeding produce orthogonal strain gradients in the
axial musculature. Sci. Rep. In review.
Johnston, I. A., Davison, W. and Goldspink, G. (1977). Energy metabolism of carp
swimming muscles. J. Comp. Physiol. B 114, 203–216.
Lauder, G. V. (1980). Evolution of the feeding mechanism in primitive actionopterygian
fishes: a functional anatomical analysis of Polypterus, Lepisosteus, and Amia. J.
Morphol. 163, 283–317.
Liu, Y. C. and Hale, M. E. (2014). Alternative forms of axial startle behaviors in fishes.
Zoology 117, 36–47.
Longo, S. J., McGee, M. D., Oufiero, C. E., Waltzek, T. B. and Wainwright, P. C.
(2016). Body ram, not suction, is the primary axis of suction-feeding diversity in
spiny-rayed fishes. J. Exp. Biol. 219, 119–128.
Marsh, R. L. (2016). Speed of sound in muscle for use in sonomicrometry. J. Biomech.
49, 4138–4141.
McLean, D. L., Fan, J., Higashijima, S., Hale, M. E. and Fetcho, J. R. (2007). A
topographic map of recruitment in spinal cord. Nature 446, 71–75.
Norton, S. F. and Brainerd, E. L. (1993). Convergence in the feeding mechanics of
ecomorphologically similar species in the Centrarchidae and Cichlidae. J. Exp.
Biol. 176, 11–29.
Olson, J. M. and Marsh, R. L. (1998). Activation patterns and length changes in
hindlimb muscles of the bullfrog Rana catesbeiana during jumping. J. Exp. Biol.

105
201, 2763–2777.
Oufiero, C. E., Holzman, R. A., Young, F. and Wainwright, P. C. (2012). New
insights from serranid fishes on the role of trade-offs in suction-feeding
diversification. J. Exp. Biol. 3845–3855.
RDevelopmentCoreTeam (2018). R: a language and environment for statistical
computing. http://www.R-project.org/.
Roberts, T. J., Higginson, B. K., Nelson, F. E. and Gabaldón, A. M. (2007). Muscle
strain is modulated more with running slope than speed in wild turkey knee and
hip extensors. J. Exp. Biol. 210, 2510–2517.
Thys, T. (1997). Spatial variation in epaxial muscle activity during prey strike in
largemouth bass (Micropterus salmoides). J. Exp. Biol. 200, 3021–3031.
Tytell, E. D. and Lauder, G. V. (2002). The C-start escape response of Polypterus
senegalus: bilateral muscle activity and variation during stage 1 and 2. J. Exp.
Biol. 205, 2591–2603.
Tytell, E. D. and Lauder, G. V. (2008). Hydrodynamics of the escape response in
bluegill sunfish, Lepomis macrochirus. J. Exp. Biol. 211, 3359–3369.
Van Wassenbergh, S., Herrel, A., Adriaens, D. and Aerts, P. (2005). A test of mouth-
opening and hyoid-depression mechanisms during prey capture in a catfish using
high-speed cineradiography. J. Exp. Biol. 208, 4627–4639.
Webb, P. W. (1982). Locomotor patterns in the evolution of actinopterygian fishes. Am.
Zool. 22, 329–342.
Westerfield, M., McMurray, J. V. and Eisen, J. S. (1986). Identified motoneurons and
their innervation of axial muscles in the zebrafish. J. Neurosci. 6, 2267–2277.

106
Westneat, M. W., Hale, M. E., McHenry, M. J. and Long Jr., J. H. (1998). Mechanics
of the fast-start: Muscle function and the role of intramuscular pressure in the
escape behavior of Amia calva and Polypterus palmas. J. Exp. Biol. 201, 3041–
3055.

107
Figures
Figure 1. Electrode and sonomicrometer placement in the epaxial musculature. (A)
Lateral view of a bluegill sunfish showing the serially repeating segments of W-shaped
myomeres of the axial musculature. Red circles show approximate electrode positions in
the three epaxial regions at 35% standard length considered in this study. Blue and green
circles show positions of the two sonomicrometers pairs from which muscle shortening
was measured. (B) Lateral view of an isolated myomere showing the three epaxial
regions examine in this study. (C) Cross-sectional view of electrode (bilateral) and
sonomicrometer (left side only) positions. Only one sonomicrometer from each pair is
shown. Longitudinal muscle strain was measured in the dorsomedial region (blue pair)
and ventrolateral region (green pair). APC, anterior-pointing cone; DPA, dorsal-pointing
arm; PPC, posterior-pointing cone.

108
Figure 2. Muscle activity and shortening for high-performance suction feeding and
swimming. Columns show EMG traces from different sides of the body and rows show
different epaxial regions, where the top row is the dorsalmost region and bottom row is
the ventralmost region. (A) Muscle activity during a suction strike on live prey in the left
and right sides of the body with muscle strain measured with sonomicrometers positioned
in the dorsomedial muscle on the left side of the body. (B) Muscle activity during a fast-
start in the ipsilateral and contralateral sides of the body with muscle strain measured
with sonomicrometers positioned in the ventrolateral muscle on the left side of the body.
Ipsilateral denotes the side with muscle shortening and contralateral denotes the side with
muscle lengthening. Scale bars to the right of each trace are 1 millivolt. APC, anterior-
pointing cone; DPA, dorsal-pointing arm; PPC, posterior-pointing cone; S1, stage 1; S2,
stage 2.

109
Figure 3. Percent of trials with above-threshold muscle activity in different epaxial
regions for different behaviors. (A) Feeding behaviors (B) Swimming behaviors. Each
plot shows a different anatomical region where each column is a different side of the
body and the top row is the dorsalmost region. Each bar is the mean ± s.d. of the
percentage values from all individuals. Individuals Lm01-04 are denoted by triangle,
square, circle, inverted triangle, respectively. APC, anterior-pointing cone; DPA, dorsal-
pointing arm; PPC, posterior-pointing cone; S1, stage 1; S2, stage 2.

110
Figure 4. Normalized muscle activation intensity for each individual, region, and
behavior. Activation intensities were normalized to the peak fast-start voltage (the
highest voltages) recorded from each electrode. Columns show different individuals and
rows show different dorsoventral regions. For swimming, activation intensity is always
for the side of muscle shortening (e.g., left electrodes for a left body bend). For feeding,
the side with the highest activation intensity is used. For feeding behaviors, data from
both successful and unsuccessful (n = 6 goldfish) suction feeding strikes are included in
this analysis. Each colored box includes a horizontal line (median value) that separates
the second (top) and third (bottom) quartiles, while the top and bottom error bars are the
first and fourth quartiles, respectively, and individual points are outliers (defined as
points exceeding or deceeding the interquartile range by 1.5). APC, anterior-pointing
cone; DPA, dorsal-pointing arm; PPC, posterior-pointing cone; S1, stage 1; S2, stage 2.

111
Figure 5. Active muscle volume used for different behaviors in sunfish and bass.
Active muscle volume at 35% SL was estimated by multiplying activation intensity of
each electrode by its relative cross-sectional area and adding this value for all three
epaxial regions. Active muscle volume was calculated from three electrodes for each
behavior. For feeding, the side with the higher activation intensity for a given epaxial
region was used. For swimming, the side with active muscle shortening for locomotion
was used. Bass data from Jimenez and Brainerd, 2020 were analyzed for this study.
112
Figure 6. Bilateral symmetry of activation intensity for feeding and locomotion.
Behaviors are grouped by the direction of their movements—dorsiflexion for feeding and
lateral flexion for locomotion—which are expected to be symmetrical and asymmetrical,
respectively. Individuals Lm01-04 are denoted by triangle, square, circle, inverted
triangle, respectively. Epaxial regions are not distinguished by color or symbol.
113
CHAPTER 4
A biomechanical paradox in fish: swimming and suction feeding produce orthogonal strain gradients in the axial musculature
Yordano E. Jimenez1, Richard L. Marsh1, and Elizabeth L. Brainerd1
1Department of Ecology and Evolutionary Biology, Brown University, 80 Waterman
Street, Providence, RI 02912, USA

114
Abstract
The axial musculature of fishes has historically been characterized as the
powerhouse for explosive swimming behaviors. However, recent studies show that some
fish also use their ‘swimming’ muscles to generate over 90% of the power for suction
feeding. Can the axial musculature achieve high power output for these two mechanically
distinct behaviors? Muscle power output is enhanced when all of the fibers within a
muscle shorten at optimal velocity. Yet, axial locomotion produces a mediolateral
gradient of muscle strain that should force some fibers to shorten too slowly and others
too fast. This mechanical problem prompted research into the gearing of fish axial muscle
and led to the discovery of helical fiber orientations that homogenize fiber velocities
during swimming, but does such a strain gradient also exist and pose a problem for
suction feeding? We measured muscle strain in bluegill sunfish, Lepomis macrochirus,
and found that suction feeding produces a gradient of longitudinal strain that, unlike the
mediolateral gradient for locomotion, occurs along the dorsoventral axis. A dorsoventral
strain gradient within a muscle with fiber architecture shown to counteract a mediolateral
gradient suggests that bluegill sunfish should not be able to generate high power outputs
from the axial muscle during suction feeding—yet prior work shows that they do, up to
438 Wkg-1. Solving this biomechanical paradox may be critical to understanding how
many fishes have co-opted ‘swimming’ muscles into a suction feeding powerhouse.

115
Introduction
Whether an animal is swimming, jumping, running or flying, the mechanical
output of muscle is one of the key drivers of performance. Hence, studying the conditions
in which muscle contractions produce maximal force, work, and power is critical to
understanding how animals execute the behaviors that enable them to survive (Askew
and Marsh, 1998; Azizi and Roberts, 2010; Peplowski and Marsh, 1997; Roberts et al.,
2019; Rome et al., 1988). When chasing prey or evading predators, fish accelerate
through the water using their axial musculature to flex the body from side to side (Frith
and Blake, 1995; Johnston et al., 1995; Tytell and Lauder, 2002; Wakeling and Johnston,
1998). As the axial muscles contract and bend the body, lateral body flexion produces a
mediolateral gradient of strain within the axial muscle mass, with the greatest shortening
occurring near the skin and the least shortening near the backbone (Fig. 1a)(Alexander,
1969; Azizi and Brainerd, 2007; Coughlin et al., 1996; Wakeling and Johnston, 1999).
Beam-like bending of an axial musculature with longitudinal muscle fiber orientations
(i.e., the null morphology) would produce heterogeneous fiber strains and velocities, and
given the power-velocity properties of muscle (Coughlin and Akhtar, 2015; Young and
Rome, 2001), only a thin band of fibers would shorten at velocities that generate high
powers (Fig. 1b). As a result, this gradient is thought to severely limit muscle power
output. The detrimental mechanical implications of this null morphology prompted
investigations into the mechanical role of the helical fiber orientations observed in fish
and shark axial muscle. Multiple studies have shown that these complex muscle fiber
orientations form a sophisticated gearing system that makes muscle fiber strain and
shortening velocity more homogeneous than predicted by beam-like bending of the null

116
morphology (Alexander, 1969; Azizi and Brainerd, 2007; Ellerby and Altringham, 2001;
Gemballa and Vogel, 2002; Rome and Sosnicki, 1991; Van Leeuwen et al., 2008). This
strain-homogenizing fiber architecture is thought to enable high power outputs from
fibers throughout the whole muscle mass, independent of their distance from the vertebral
column (i.e., the neutral axis). This hypothesis is supported by numerous studies showing
that fish generate very high power from the white axial musculature during fast-starts,
rapid evasive and predatory swimming maneuvers (Frith and Blake, 1995; James and
Johnston, 1998; Johnston et al., 1995; Wakeling and Johnston, 1998).
In addition to locomotion, many fishes have co-opted the axial musculature for
suction feeding (Camp and Brainerd, 2014; Carroll and Wainwright, 2006; Jimenez and
Brainerd, 2020; Lauder, 1982). Species like largemouth bass (Micropterus salmoides)
and bluegill sunfish (Lepomis macrochirus) generate over 90% of their suction power by
actively shortening most of the ‘locomotor’ muscle mass (Camp and Brainerd, 2014;
Camp et al., 2015; Camp et al., 2018; Jimenez and Brainerd, 2020). Suction feeding
studies have typically modelled epaxial mechanics with the assumption that the epaxial
muscle mass functions like muscle belly actuating a lever system (Fig. 1c)(Carroll et al.,
2004; Day et al., 2015; Holzman et al., 2008; Lauder and Liem, 1981; Lesiuk and
Lindsey, 1978; Wainwright et al., 2007). This lever model has yielded valuable insights
for comparative studies of suction feeding performance across species (Carroll et al.,
2004; Day et al., 2015; Holzman et al., 2008; Wainwright et al., 2007). The lever model
infers from specimen manipulation that the fulcrum is at the level of a joint within the
pectoral girdle and makes the simplifying assumption that the input muscle force acts on
a single point of the neurocranium, implying that epaxial muscle shortens uniformly

117
(Carroll et al., 2004). The lever model is challenged by the finding that neurocranial
elevation usually involves dorsal flexion of multiple intervertebral joints, suggesting
smooth bending rather than hinge-like rotation occurs (Jimenez et al., 2018). Hence, we
hypothesize that suction feeding is powered by beam-like bending that produces a
dorsoventral gradient of longitudinal strain in the axial musculature, where muscle strain
decreases from dorsal to ventral during any given bout of muscle shortening (Fig. 1d).
A dorsoventral gradient of longitudinal strain in the epaxial muscle mass
(hereafter also referred to as muscle strain) during feeding would be anatomically
orthogonal to the mediolateral gradient in swimming. If muscle fiber architecture is
indeed specialized to homogenize fiber strain within the musculature as it undergoes
heterogeneous longitudinal strain during locomotion, high muscle power outputs are
unlikely during suction feeding because the muscle fibers would be oriented to counteract
a mediolateral gradient, not a dorsoventral gradient. Conversely, if the architecture were
specialized for equalizing fiber strain along a dorsoventral gradient, this would likely
impede locomotor power production. Thus, behaviors with motions that produce
anatomically orthogonal strain gradients in the muscle might have gearing solutions that
conflict with each other, preventing the muscle from generating maximum power output
for both swimming and suction feeding, and perhaps limiting peak muscle performance
to only one of these vital behaviors. Here, we measured muscle shortening using
sonomicrometry to determine whether the dorsal half of the axial musculature, the
epaxial musculature, of bluegill sunfish exhibits a dorsoventral gradient of longitudinal
strain in suction feeding and a mediolateral gradient of longitudinal strain in locomotion.

118
Methods
Animals and training protocol
Bluegill sunfish (Lepomis macrochirus) were caught at Morses Pond in
Wellesley, Massachusetts. Fish (standard length 176, 156, and 149 mm for Lm01, Lm02,
and Lm04, respectively) were housed at Brown University in tanks at room temperature.
We acclimated the fish for a minimum of six weeks, during which time they were trained
to feed on carnivore pellets and live prey, such as goldfish (Carassius auratus) and rosies
(Pimephales promelas). All procedures were approved by the Institutional Animal Care
and Use Committee (IACUC) of Brown University and followed guidelines and policies
set forth by the IACUC of Brown University. Reporting of methods and results followed
ARRIVE guidelines (du Sert et al., 2020).
Sonomicrometer positions
We anesthetized and CT scanned each individual in vivo to measure the
mediolateral and dorsoventral distances from the vertebral column at the intended
implantation sites. Sonomicrometers were positioned to measure strain at different
distances from the neutral axes of bending, not to measure strain within a single
myomere. Each sonomicrometer transducer was mounted on a custom-made stainless
steel holder with three arms (Olson and Marsh, 1998) that allowed the transducer to be
positioned at the desired muscle depth.. We implanted two pairs of transducers (1 mm
diameter) in the epaxial musculature on the left side of the body at approximately 35%
standard length (SL; Fig. 2a). Each pair was approximately 15 mm apart and parallel to
the long-axis of the animal, defined as a line going from the snout tip to the notch in the

119
caudal fin. One pair was implanted dorsomedially at approximately 14 mm dorsal to the
vertebral column and 3 mm lateral to midline. The other pair was implanted
ventrolaterally at approximately 8 mm dorsal to the vertebral column and 5 mm lateral to
the midline. After each experiment, we anesthetized and CT-scanned each individual to
confirm sonomicrometer positions.
Surgical procedures
Fish were anesthetized via immersion in 0.12 g/L buffered MS-222 (Tricaine
methanesulfonate). We then placed the fish in a surgical tray with a flow of anesthetic
solution, and intubated the mouth to flow oxygenated water over the gills. For each
sonomicrometer (4 total per individual), we removed scales from the region of
implantation, made a small dermal incision (1 mm), and used a 16-gauge needle with a
blunted tip to make a path for the sonomicrometer-holder unit. We then sutured the
external arms of the holder onto the skin. As a part of a related project, we also implanted
three electrodes in the epaxial muscle on each side of the body at approximately 35% SL.
The electrode and sonomicrometers wires exiting from the muscle were glued together
(E600 flexible craft adhesive) to form a common cable, which we then sutured onto the
region above the head to prevent the sonomicrometers from dislodging.
Data collection
Muscle length (L) data were recorded at a sampling rate of 1041 Hz in SonoLab
software (version 3.4.81) using a Sonometrics system (Model TR-USB Series 8). We
measured water temperature to get the muscle temperature in our ectothermic fish, and

120
input the appropriate speed of sound at the beginning of each experiment to account for
any temperature changes(Marsh, 2016). We synchronized strain recordings and light
video by using a LabChart PowerLab (Model PL3516) to send a 1 Hz signal to the
sonomicrometry acquisition software and a flashing LED light in the field of view of the
cameras. We elicited various swimming (turns [i.e., non-fast start body bends], sprints
and fast-starts) and feeding behaviors (suction feeding on live prey and pellets, coughs,
and chews) that require varying degrees of axial flexion. We used synchronized
recordings to classify behaviors and to exclude trials in which the fish moved in more
than one plane (e.g., suction feeding strikes with concomitant lateral flexion). Post-
processing of the sonomicrometer signals was done in Igor Pro (Wavemetrics) and
recordings were smoothed using the smooth.spline function in the stats package in (R
Development Core Team, 2018). Initial muscle length (Li) was defined as the muscle
length prior to the onset of the behavior and muscle shortening. Strain was calculated as
(L-Li)/Li.
Statistical analysis
Each trial consists of a full or half wavelength of lengthening or shortening,
depending on the behavior. Each data point is the absolute value of peak strain measured
at both positions during the behavior. As neither the dorsomedial nor ventrolateral
position is an independent variable, we performed a model 2 major axis linear regression
using the lmodel2 package in R (Legendre and Oksanen, 2018). A major axis regression
is appropriate for data because both the dorsomedial and ventrolateral positions are
expected to have similar measurement errors, and the relationship between X and Y is

121
symmetric (Smith, 2009). Regression results and confidence intervals can be found in
Table 1.
Results
We found that locomotor behaviors produced a mediolateral gradient of
longitudinal strain in the epaxial muscle, while feeding behaviors produced a
dorsoventral gradient of longitudinal strain (Figs 2 and 3; see supplementary Fig. S1 for
sample EMG traces). If longitudinal muscle strain were homogeneous, strain would be
the same at the dorsoventral position (‘A’) and mediolateral position (‘B’), independent
of their different distances from the neutral axes of bending. In this case, the slopes of the
regressions in Figure 3 would be equal to one. However, linear regressions showed that
all three individuals had slopes statistically significantly greater than one during
locomotion, indicating that longitudinal strain was larger in the lateral muscle region.
Conversely, linear regressions showed that all three individuals had slopes statistically
significantly less than one during feeding, indicating that longitudinal strain was larger in
the dorsal muscle region (Fig. 3 and Table 1; significance based on the 95% confidence
intervals not overlapping with a slope of one). Finally, although we excluded non-planar
feeding behaviors from our formal analysis, we found that side strikes (feeding behaviors
with simultaneous dorsiflexion and lateral flexion) produced muscle length dynamics
consistent with the finding of anatomically orthogonal strain gradients (Fig. 4).

122
Discussion
The Paradox
Our discovery of a dorsoventral strain gradient in feeding presents a paradox:
bluegill sunfish should not be able to attain high power outputs from their epaxial muscle
in suction feeding, but they do. Bluegill sunfish can generate exceptionally high epaxial
muscle power, up to 438 Wkg -1, in the most powerful strikes (Camp et al., 2018). What
makes this a paradox? Within the current paradigm, muscle fiber architecture is
specialized to equalize fiber strain mediolaterally for axial locomotion. Thus, this same
architecture is not expected to be able to equalize fiber strain dorsoventrally in feeding.
Yet, the seeming contradiction (i.e., the paradox) is that bluegill sunfish do generate very
high axial muscle power despite the expectation that a dorsoventral gradient should
prevent them from doing so.
The current paradigm of fish axial locomotion and white muscle mechanics has
argued and shown to varying degrees that (1) lateral body flexion causes the whole
musculature to deform heterogeneously along a mediolateral gradient, (2) muscle fiber
orientations in the axial musculature are specialized to allow for homogeneous fiber
strain within a whole muscle undergoing heterogeneous strain during locomotion because
(3) heterogeneous fiber strain is mechanically detrimental. We regard point one as
uncontroversial, since it has been demonstrated repeatedly across different species,
including here in bluegill. We regard points two and three as assumptions that, if rejected
or refined, can resolve the paradox in bluegill sunfish and provide a new biomechanical
insight. Point two could be rejected if epaxial fiber gearing in bluegill sunfish were
specialized for suction feeding, not swimming. Point two could also be rejected if epaxial

123
fiber gearing were specialized for both suction feeding and swimming with a
sophisticated, albeit unknown, gearing system that can homogenize strain for
anatomically orthogonal gradients. Finally, point three could be rejected if bluegill
sunfish were capable of generating peak power for both behaviors without any
specialized fiber gearing. Here we consider each of these solutions to the paradox briefly.
The first possibility is that, in bluegill sunfish, gearing of the epaxial muscles is
specialized for power production during feeding and cannot produce high muscle power
output during swimming. Very high muscle power is routinely observed in fishes during
fast-starts (Franklin and Johnston, 1997; Frith and Blake, 1995; Johnston et al., 1995;
Wakeling and Johnston, 1998), but fast-start power has not been measured in bluegill
sunfish. Bluegill sunfish may have responded to selective pressures favoring a muscle
fiber architecture that homogenizes fiber strain along the dorsoventral axis to maximize
muscle power output for prey capture. This scenario would challenge the prevailing and
well-supported view that most fish maximize axial muscle power output during fast-starts
(Frith and Blake, 1995; Johnston et al., 1995; Wakeling and Johnston, 1998), and future
studies would be needed to determine whether bluegill sunfish actually do achieve high
mass-specific powers during fast-starts. The second possibility is that bluegill sunfish do
indeed maximize muscle power for both behaviors, but require a sophisticated gearing
system that can homogenize fiber strain for orthogonal gradients. Since gearing is
determined by fiber angulation and three-dimensional muscle deformation (Azizi et al.,
2008; Brainerd and Azizi, 2005; Holt et al., 2016), the former of which cannot change in
a given organism, the only possible way to produce orthogonal gearing gradients would
be if the bulging or shearing within the muscle mass was different for each behavior.

124
Both of the aforementioned solutions assume that having a gradient of fiber strain
(i.e., fiber strain heterogeneity) is as problematic as previously suggested (Alexander,
1969; Van Leeuwen et al., 2008). The problem of heterogeneous fiber strain has often
relied on assessing muscle performance based on experimentally derived isotonic muscle
properties. However, such assessments of muscle performance must be made with
caution. Even operating under this assumption, power-velocity curves can have a broad
plateau where muscle fibers not shortening at velocities that generate peak power (Vopt)
can still generate high power (Askew and Marsh, 1998). In addition to isotonic
properties, Vopt can vary based on the frequency, strain trajectory, and activation patterns
of the behavior, among many other factors (Askew and Marsh, 1998; Askew and Marsh,
2002). Due to these complex interactions, the sensitivity of in vivo power production to
fiber strain heterogeneity is unclear.
Implications for Suction Feeding Muscle Mechanics
Most suction feeding studies have assumed or implied uniform muscle strain
when modelling epaxial muscle mechanics (Fig. 1c)(Carroll et al., 2004; Day et al., 2015;
Holzman et al., 2008). Contrary to this assumption, we show that suction feeding
produces a dorsoventral gradient of longitudinal strain in the epaxial musculature of
bluegill sunfish (Fig. 1d), where muscle strain varies along the dorsoventral axis of the
cross-section of muscle (Figs 2 and 3). Yet much of our current understanding of epaxial
mechanics is based on muscle strain measurements that we now know do not represent
the entire muscle. If strain had been measured in a ventral epaxial region, longitudinal
muscle strain would be lower in magnitude and muscle function would have been

125
interpreted differently, as active shortening would imply positive power production (i.e.,
a motor), but active contractions with minimal shortening would imply isometric force
production (i.e., a strut or stabilizer). Of course, all of this assumes a null morphology of
longitudinal muscle fibers, which is certainly not the case in the axial muscle of fishes
(Alexander, 1969; Gemballa and Vogel, 2002; Van Leeuwen et al., 2008). Hence,
conclusions about in vivo epaxial mechanics should be made cautiously when using
longitudinal strain. Determining in vivo muscle mechanics in suction feeding may require
quantifying the variables that have been shown to influence the gearing of muscle—fiber
orientations and in vivo muscle deformation (Azizi et al., 2008; Brainerd and Azizi,
2005).
Side Strikes: Mixed Swimming and Feeding Behaviors
Bluegill sunfish occasionally bent their heads to the side while attacking live prey
that were not located directly in front of the mouth. These side strikes were characterized
by dorsiflexion with simultaneous lateral flexion (Fig. 4). Although we excluded such
feeding trials from our formal analysis in order to analyze lateral and dorsal bending
separately, they illustrate the complexity of muscle length dynamics during behaviors
involving simultaneous motion in two planes. These muscle length dynamics are both
implied by the orthogonal gradients in planar feeding and planar swimming (Fig. 3) and
evident in otherwise anomalous longitudinal strain data (Fig. 4). Suction strikes with
simultaneous dorsal and lateral flexion are distinguished from sequences of behaviors
with relatively discrete motions, such as lateral flexion for acceleration followed by
dorsiflexion for suction feeding followed by lateral flexion for deceleration (Higham,

126
2007). Among many interesting points, how exactly do side strikes affect power
production? Does the concave side of the body (where muscle shortens) contribute
positive power to cranial expansion? Conversely, does the convex side generate negative
power, thereby resisting cranial expansion? While these questions are difficult to answer,
comparing performance of planar strikes and side strikes may be a feasible way of doing
so. Considering the complexity of the physical environments that many fish species
inhabit, side strikes may be, along with planar strikes, an important part of the food
capture repertoire of fishes in the wild.
Methodological Considerations
We suspect that longitudinal muscle strain for suction feeding is a linear function
of distance from the neutral axis, although we could not determine the linearity of this
relationship with the spatial distribution of our sampling. Determining linearity would
require measuring longitudinal strain in at least three positions at different distances from
the neutral axis of interest and ideally at the same distances from the neutral axis of the
other behavior—such that all strain recordings are equally affected by non-planar
motions. For example, a robust configuration for detecting a linear strain gradient in
suction feeding would involve measuring longitudinal strain at a dorsal, middle, and
ventral position, with each instrument positioned close to the vertical septum where
longitudinal muscle strain is low for swimming. A related issue is whether the
measurements of midline curvature in conjunction with beam theory can be used to
calculate longitudinal muscle strain. This concept has been successfully implemented in
locomotion studies but requires a dorsal or ventral view of fish swimming in order to
127
calculate midline curvature from a digitized outline of the body (Coughlin et al., 1996;
Katz and Shadwick, 1998; Shadwick et al., 1998; Van Leeuwen et al., 1990). Of critical
importance to this technique is the observation that the midline, calculated using the left
and right edges of the body, is an accurate estimate of the vertebral column’s position.
Such methodology is not feasible for dorsiflexion during feeding as the dorsal and ventral
edges of the body are not equidistant from the vertebral column, and so a calculated
midline curvature would not accurately estimate vertebral curvature. Although it is not
feasible to estimate longitudinal strain with a lateral view of feeding, techniques such as
fluoroscopy, rotoscoping, and XROMM, could be used to test the relationship between
vertebral flexion and longitudinal epaxial strain. Even so, this relationship may not be
simple because the epaxial muscles are physically connected with the hypaxial muscles,
the ventral half of the axial musculature that plays a complementary but distinct
kinematic role in suction feeding—actuation of the hyo-pectoral interface (Camp, 2019).
Finally, quantitatively associating the neutral axis of axial dorsiflexion with a discrete
anatomical structure is complicated by the kinematic variability of suction feeding
behaviors at both the individual and species levels, although the available evidence
suggests that the neutral axis of bending is approximately at the level of the vertebral
column (Jimenez et al., 2018).
Concluding Remarks
Past studies have only examined the problem of heterogeneous fiber strain in the
axial musculature of fishes within the context of locomotion. Our findings suggest that
we must broaden our investigation of strain heterogeneity to include suction feeding.

128
Strain heterogeneity may be particularly problematic for species that require high mass-
specific power outputs from the axial musculature, such as bluegill sunfish (Camp et al.,
2018). In contrast, strain heterogeneity may be less problematic for species that activate
only a small cross-sectional area of the epaxial muscle during suction feeding
(largemouth bass)(Jimenez and Brainerd, 2020), and those that generate relatively low
mass-specific power from axial muscle during suction feeding (largemouth bass and
channel catfish)(Camp et al., 2018; Camp et al., 2020). Interspecific variation of suction
feeding and locomotor performance is well-known in fishes, but here we show how the
muscle mechanics for high-performance swimming and high-performance suction
feeding may be at odds. Indeed, orthogonal strain gradients may create mechanical
constraints and tradeoffs between axial locomotion and suction feeding in fishes.
Investigating the dual functionality of this muscle will elucidate how many fishes have
successfully co-opted, and perhaps in some cases mechanically specialized, the
‘locomotor’ muscle for generating powerful feeding behaviors that are crucial for
survival.

129
Acknowledgments
We are grateful to Erika Tavares for research administrative support, to Thomas Roberts
and Andrew Biewener for general advice on this project, to David Ellerby for help with
collecting animals, and to Jake Parsons, Jarrod Petersen, and Amy Rutter for assistance
with surgeries. This research was supported by National Science Foundation (NSF) grant
nos. 1655756 and 1661129 to E.L.B., a Doctoral Dissertation Enhancement Grant from
the Bushnell Graduate Education and Research Fund to Y.E.J. and an NSF Graduate
Research Fellowship to Y.E.J.

130
References
Alexander, R. M. (1969). The orientation of muscle fibres in the myomeres of fishes. J.
Mar. Biol. Assoc. United Kingdom 49, 263–290.
Askew, G. N. and Marsh, R. L. (1998). Optimal shortening velocity (V/Vmax) of
skeletal muscle during cyclical contractions: length-force effects and velocity-
dependent activation and deactivation. J. Exp. Biol. 201, 1527–1540.
Askew, G. N. and Marsh, R. L. (2002). Muscle designed for maximum short-term
power output: quail flight muscle. J. Exp. Biol. 205, 2153–2160.
Azizi, E. and Brainerd, E. L. (2007). Architectural gear ratio and muscle fiber strain
homogeneity in segmented musculature. J. Exp. Zool. 307, 145–155.
Azizi, E. and Roberts, T. J. (2010). Muscle performance during frog jumping: influence
of elasticity on muscle operating lengths. Proc. R. Soc. B Biol. Sci. 277, 1523–
1530.
Azizi, E., Brainerd, E. L. and Roberts, T. J. (2008). Variable gearing in pennate
muscles. Proc. Natl. Acad. Sci. 105, 1745–1750.
Brainerd, E. L. and Azizi, E. (2005). Muscle fiber angle, segment bulging and
architectural gear ratio in segmented musculature. J. Exp. Biol. 208, 3249–3261.
Camp, A. L. (2019). What fish can teach us about the feeding functions of postcranial
muscles and joints. Integr. Comp. Biol. 59, 383–393.
Camp, A. L. and Brainerd, E. L. (2014). Role of axial muscles in powering mouth
expansion during suction feeding in largemouth bass (Micropterus salmoides). J.
Exp. Biol. 217, 1333–1345.
Camp, A. L., Roberts, T. J. and Brainerd, E. L. (2015). Swimming muscles power

131
suction feeding in largemouth bass. Proc. Natl. Acad. Sci. 112, 8690– 8695.
Camp, A. L., Roberts, T. J. and Brainerd, E. L. (2018). Bluegill sunfish use high
power outputs from axial muscles to generate powerful suction-feeding strikes. J.
Exp. Biol. 221, jeb.178160.
Camp, A. L., Olsen, A. M., Hernandez, L. P. and Brainerd, E. L. (2020). Fishes can
use axial muscles as anchors or motors for powerful suction feeding. J. Exp. Biol.
223, jeb.225649.
Carroll, A. M. and Wainwright, P. C. (2006). Muscle function and power output during
suction feeding in largemouth bass, Micropterus salmoides. Comp. Biochem.
Physiol. A. Mol. Integr. Physiol. 143, 389–399.
Carroll, A. M., Wainwright, P. C., Huskey, S. H., Collar, D. C. and Turingan, R. G.
(2004). Morphology predicts suction feeding performance in centrarchid fishes. J.
Exp. Biol. 207, 3873–3881.
Coughlin, D. J. and Akhtar, M. (2015). Contractile properties of the myotomal muscle
of sheepshead, Archosargus probatocephalus. J. Exp. Zool. 323, 169–178.
Coughlin, D. J., Valdes, L. and Rome, L. C. (1996). Muscle length changes during
swimming in scup: sonomicrometry verifies the anatomical high-speed cine
technique. J. Exp. Biol. 199, 459–463.
Day, S. W., Higham, T. E., Holzman, R. A. and Van Wassenbergh, S. (2015).
Morphology, kinematics, and dynamics: the mechanics of suction feeding in
fishes. Integr. Comp. Biol. 55, 21–35.
du Sert, N. P., Ahluwalia, A., Alam, S., Avey, M. T., Baker, M., Browne, W. J.,
Clark, A., Cuthill, I. C., Dirnagl, U., Emerson, M., et al. (2020). Reporting

132
animal research: explanation and elaboration for the ARRIVE guidelines 2.0.
Ellerby, D. J. and Altringham, J. D. (2001). Spatial variation in fast muscle function of
the rainbow trout Oncorhynchus mykiss during fast-starts and sprinting. J. Exp.
Biol. 204, 2239–2250.
Franklin, C. E. and Johnston, I. A. (1997). Muscle power output during escape
responses in antarctic fish. J. Exp. Biol. 200, 703–712.
Frith, H. R. and Blake, R. W. (1995). The mechanical power output and
hydromechanical efficiency of northern pike (Esox lucius) fast-starts. J. Exp. Biol.
198, 1863–1873.
Gemballa, S. and Vogel, F. (2002). Spatial arrangement of white muscle fibers and
myoseptal tendons in fishes. Comp. Biochem. Physiol. - A Mol. Integr. Physiol.
133, 1013–1037.
Higham, T. E. (2007). Feeding, fins and braking maneuvers: locomotion during prey
capture in centrarchid fishes. J. Exp. Biol. 210, 107–117.
Holt, N. C., Danos, N., Roberts, T. J. and Azizi, E. (2016). Stuck in gear: age-related
loss of variable gearing in skeletal muscle. J. Exp. Biol. 219, 998–1003.
Holzman, R. A., Collar, D. C., Day, S. W., Bishop, K. L. and Wainwright, P. C.
(2008). Scaling of suction-induced flows in bluegill: morphological and kinematic
predictors for the ontogeny of feeding performance. J. Exp. Biol. 211, 2658–2668.
James, R. S. and Johnston, I. A. (1998). Scaling of muscle performance during escape
responses in the fish Myoxocephalus scorpius L. J. Exp. Biol. 201, 913–923.
Jimenez, Y. E. and Brainerd, E. L. (2020). Dual function of epaxial musculature for
swimming and suction feeding in largemouth bass. Proc. R. Soc. B Biol. Sci. 287,

133
p.20192631.
Jimenez, Y. E., Camp, A. L., Grindall, J. D. and Brainerd, E. L. (2018). Axial
morphology and 3D neurocranial kinematics in suction-feeding fishes. Biol. Open
7, bio036335.
Johnston, I. A., Van Leeuwen, J. L., Davies, M. L. F. and Beddow, T. A. (1995). How
fish power predation fast-starts. J. Exp. Biol. 198, 1851–1861.
Katz, S. L. and Shadwick, R. E. (1998). Curvature of swimming fish midlines as an
index of muscle strain suggests swimming muscle produces net positive work. J.
Theor. Biol. 193, 243–256.
Lauder, G. V. (1982). Patterns of evolution in the feeding mechanism of actinopterygian
fishes. Am. Zool. 22, 275–285.
Lauder, G. V. and Liem, K. F. (1981). Prey capture by Luciocephalus pulcher:
implications for models of jaw protrusion in teleost fishes. Environ. Biol. Fishes
6, 257–268.
Legendre, P. and Oksanen, J. (2018). Package ‘lmodel2.’
Lesiuk, T. P. and Lindsey, C. C. (1978). Morphological peculiarities in the neck-
bending Amazonian characoid fish Rhaphiodon vulpinus. Can. J. Zool. 56, 991–
997.
Marsh, R. L. (2016). Speed of sound in muscle for use in sonomicrometry. J. Biomech.
49, 4138–4141.
Olson, J. M. and Marsh, R. L. (1998). Activation patterns and length changes in
hindlimb muscles of the bullfrog Rana catesbeiana during jumping. J. Exp. Biol.
201, 2763–2777.

134
Peplowski, M. M. and Marsh, R. L. (1997). Work and power output in the hindlimb
muscles of Cuban tree frogs Osteopilus septentrionalis during jumping. J. Exp.
Biol. 200, 2861–2870.
RDevelopmentCoreTeam (2018). R: a language and environment for statistical
computing. http://www.R-project.org/.
Roberts, T. J., Eng, C. M., Sleboda, D. A., Holt, N. C., Brainerd, E. L., Stover, K. K.,
Marsh, R. L. and Azizi, E. (2019). The multi-scale, three-dimensional nature of
skeletal muscle contraction. Physiology 34, 402–408.
Rome, L. C. and Sosnicki, A. A. (1991). Myofilament overlap in swimming carp. II.
Sarcomere length changes during swimming. Am. J. Physiol. 260, 289–296.
Rome, L. C., Funke, R. P., Alexander, R. M., Lutz, G., Aldridge, H., Scott, F. and
Freadman, M. (1988). Why animals have different muscle fibre types. Nature
335, 824–827.
Shadwick, R. E., Steffensen, J. E., Katz, S. L. and Knower, T. (1998). Muscle
dynamics in fish during steady swimming. Am. Zool. 38, 755–770.
Smith, R. J. (2009). Use and misuse of the reduced major axis for line-fitting. Am. J.
Phys. Anthropol. 140, 476–486.
Tytell, E. D. and Lauder, G. V. (2002). The C-start escape response of Polypterus
senegalus: bilateral muscle activity and variation during stage 1 and 2. J. Exp.
Biol. 205, 2591–2603.
van der Hoop, J. M., Fahlman, A., Shorter, K. A., Gabaldon, J., Rocho-Levine, J.,
Petrov, V. and Moore, M. J. (2018). Swimming energy economy in bottlenose
dolphins under variable drag loading. Front. Mar. Sci. 5, 1–13.

135
Van Leeuwen, J. L., Lankheet, M. J. M., Akster, H. A. and Osse, J. W. M. (1990).
Function of red axial muscles of carp (Cyprinus carpio): recruitment and
normalized power output during swimming in different modes. J. Zool. 220, 123–
145.
Van Leeuwen, J. L., Van Der Meulen, T., Schipper, H. and Kranenbarg, S. (2008).
A functional analysis of myotomal muscle-fibre reorientation in developing
zebrafish Danio rerio. J. Exp. Biol. 211, 1289–1304.
Wainwright, P. C., Carroll, A. M., Collar, D. C., Day, S. W., Higham, T. E. and
Holzman, R. A. (2007). Suction feeding mechanics, performance, and diversity
in fishes. Integr. Comp. Biol. 47, 96–106.
Wakeling, J. M. and Johnston, I. A. (1998). Muscle power output limits fast-start
performance in fish. J. Exp. Biol. 201, 1505–1526.
Wakeling, J. M. and Johnston, I. A. (1999). White muscle strain in the common carp
and red to white muscle gearing ratios in fish. J. Exp. Biol. 202, 521–528.
Young, I. S. and Rome, L. C. (2001). Mutually exclusive muscle designs: the power
output of the locomotory and sonic muscles of the oyster toadfish (Opsanus tau).
Proc. R. Soc. B Biol. Sci. 268, 1965–1970.

136
Figures
Figure 1. Patterns of longitudinal strain in the epaxial musculature for swimming
and suction feeding. (a) Axial locomotion: lateral body flexion produces a mediolateral
gradient of longitudinal strain in the axial muscle mass. The neutral axis, the vertebral
column, undergoes neither shortening nor lengthening. If the muscle fibers were oriented
longitudinally, they would also experience this strain gradient. (b) A diagrammatic
power-velocity curve, illustrating how a gradient of fiber strain rate would affect power
production. Muscle shortening velocities in some regions would be faster (circle) or
slower (triangle) than those needed for generating maximal power (Vopt), and only some
regions (star) would shorten at Vopt. (c,d) Alternative models of epaxial mechanics in
suction feeding. (c) The lever model of neurocranial elevation for suction feeding 30.

137
Epaxial forces acting on the in-lever generate neurocranial elevation, intraoral forces
acting on the out-lever resist neurocranial elevation, and the fulcrum occurs at the level of
the S-PT joint in the pectoral girdle. Epaxial muscle dorsal to this joint shortens
uniformly to produce neurocranial elevation, and therefore could potentially all contract
at Vopt, but muscle ventral to this joint (dark grey) cannot contribute to cranial elevation.
(d) An alternative, the beam model of neurocranial elevation for suction feeding, where
neurocranial elevation is produced by the dorsiflexion of multiple intervertebral joints.
All muscle dorsal to the vertebral column can shorten to produce neurocranial elevation,
but the amount of longitudinal shortening is largest in the dorsal region and approaches
zero at vertebral column. We test this hypothesis of a dorsoventral gradient in suction
feeding in this study. Abbreviation: S-PT, supracleithral and post-temporal bones.

138
Figure 2. Sonomicrometer placement and in vivo muscle length dynamics. (a) Lateral
view of the implantation sites for each sonomicrometer pair. (b) Epaxial length dynamics
during an evasive fast-start alongside a transverse view of sonomicrometer positions
relative to the neutral axis of bending (solid red line). In lateral flexion, longitudinal
strain is expected to vary as a function of mediolateral distance from the neutral axis, and
thus the dorsoventral position of the instrument can be ignored. (c) Epaxial length
dynamics during a suction feeding on live prey alongside a transverse view of
sonomicrometer positions. In dorsiflexion, longitudinal strain is expected to vary as a
function of dorsoventral distance from the neutral axis (solid red line), and thus the
mediolateral position of the instrument can be ignored. Lengthening before shortening, as

139
shown here, occurred in some but not most feeding strikes. Thick lines indicate the
duration of muscle activity (see supplementary Fig. S1 for sample EMG traces). Data
shown are from individual Lm01.

140
Figure 3. Feeding produces a strain gradient anatomically orthogonal to swimming.
Longitudinal strain measured at the ventrolateral location (‘B’) as a function of strain
measured at the dorsomedial location (‘A’) for three individual L. macrochirus (Lm01,
02 and 04). Locomotion: open blue circles. Feeding: closed red circles. In the absence of
either mediolateral or dorsoventral strain gradients, the strains at the two locations are
predicted to be equal as is indicated by the dashed lines with a slope of 1.0. Regression
lines are shown with 95% confidence intervals. Regression coefficients, equations, and
statistics for linear regressions can be found in Table 1. Inset shows cross-sectional view
of positions ‘A’ and ‘B’. Abbreviations: ML, mediolateral; DV, dorsoventral.

141
Figure 4. Muscle length dynamics in burst swimming followed by mixed swimming
and feeding behavior. Plot shows a sprint (grey area) followed by a strike with body
bending to the right (orange area). The sprint sequence shows the expected cycles of
muscle lengthening and shortening, and more importantly, the higher magnitudes of
longitudinal strain the lateral sonomicrometer (green) relative to the medial
sonomicrometer pair. The sprint sequence is then followed by a strike on pellet food with
simultaneous lateral flexion to the right, which shows the more complex yet expected
pattern of high muscle shortening in the dorsal region (blue) with muscle lengthening in
the lateral region (green). Data shown are from individual Lm01.

142
Figure S1. Sample EMG traces showing epaxial muscle activity in feeding and
locomotion. Timing of muscle length changes are indicated by red arrows. Data were
sampled at 4000 Hz and EMG signals were filtered with a bandwidth of 100 – 1,000 Hz.
Traces correspond to data shown in Fig. 2.

143
Table 1. Summary of major axis regression analysis.