museum mobilization: data-informed expectations of today's audiences
TRANSCRIPT

Museum Mobilization: The New
Data-Informed Expectations of
Audiences
Colleen Dilenschneider
IMPACTS Research
Know Your Own Bone
In the Vanguard of the Museum Revolution
PA Museums’ 2016 Annual Conference
April 11, 2016

The data is in!
• IMPACTS Research
1) Ongoing - 224 VSOs in the USA
2) Client organization data
• National Awareness, Attitudes & Usage Study
– Ongoing - 98,000+ individuals
– Considered largest VSO-related survey in the US
Evolving engagement methods and changing demographics reveal a
four-part pattern…

PERSONALIZATIO
N
SOCIALIZATION
FACILITATION
MOBILIZATION
The (Data-Informed)
Engagement
Pyramid

No, thanks.

RELEVANT
CONNECTIVE
ACCESSIBLE
MISSION
The (Data-Informed)
Engagement
Pyramid

Facilitation (ACCESS)
• Who currently comes in the door?
– Audience research
• Who do we need to come in the door?
– Market research
• How do they come in the door and is this
best for our mission & solvency?
– Admission vs. affordable access vs.
membership vs. events vs. programs

o.0.948 : 1.000
MUSEUM “HISTORIC” VISITOR

Let’s update our “historic” visitor!

Attendance to Cultural Visitor-Serving Organizations(Year 2011-2015, by age cohort)
28.7% 29.2%29.9% 30.4% 30.9%
14.2% 14.3% 14.1% 14.1% 14.0%
23.8% 23.3% 23.1% 22.7% 22.5%
0%
10%
20%
30%
40%
50%
Year 2011 Year 2012 Year 2013 Year 2014 Year 2015
VIS
ITO
R P
ER
CE
NT
AG
E
Millennial Gen X Baby Boomer
1
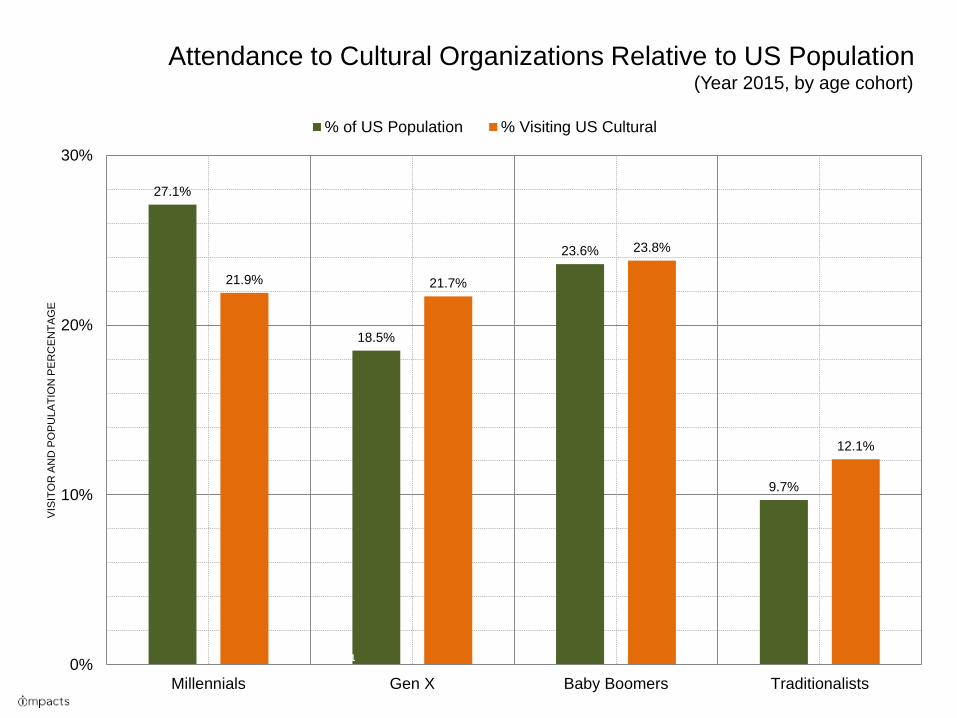
Attendance to Cultural Organizations Relative to US Population(Year 2015, by age cohort)
27.1%
18.5%
23.6%
9.7%
21.9% 21.7%
23.8%
12.1%
0%
10%
20%
30%
Millennials Gen X Baby Boomers Traditionalists
VIS
ITO
R A
ND
PO
PU
LA
TIO
N P
ER
CE
NT
AG
E
% of US Population % Visiting US Cultural
1

Socialization (CONNECTION)
Content
Connection is king
• Knowing how to communicate with these audiences
• We live in a real-time, connected world
– Making the connection
– Facilitating the sharing of that connection
• Public relations is everyone’s job today
– Marketing, fundraising, membership, operations, education, human resources, executive leadership
• (And, yes, so is social media)

High-Propensity Visitor Indicators(Comparison by age cohort)
135.9
160.3
223.7
0 50 100 150 200 250
"Super-connected" (broadband)
Millennials Gen X Baby Boomers
1 100
INDEX VALUE

Sources of information for high-propensity visitors
2
32
51
53
84
117
188
295
471
503
557
0 100 200 300 400 500 600
Direct mail
Periodicals and magazines - print
Newspaper - print
Radio - satellite and terrestrial
Television
Peer review web
WOM
Web
Mobile web
Social media
Index Value

Diffusion of Messaging
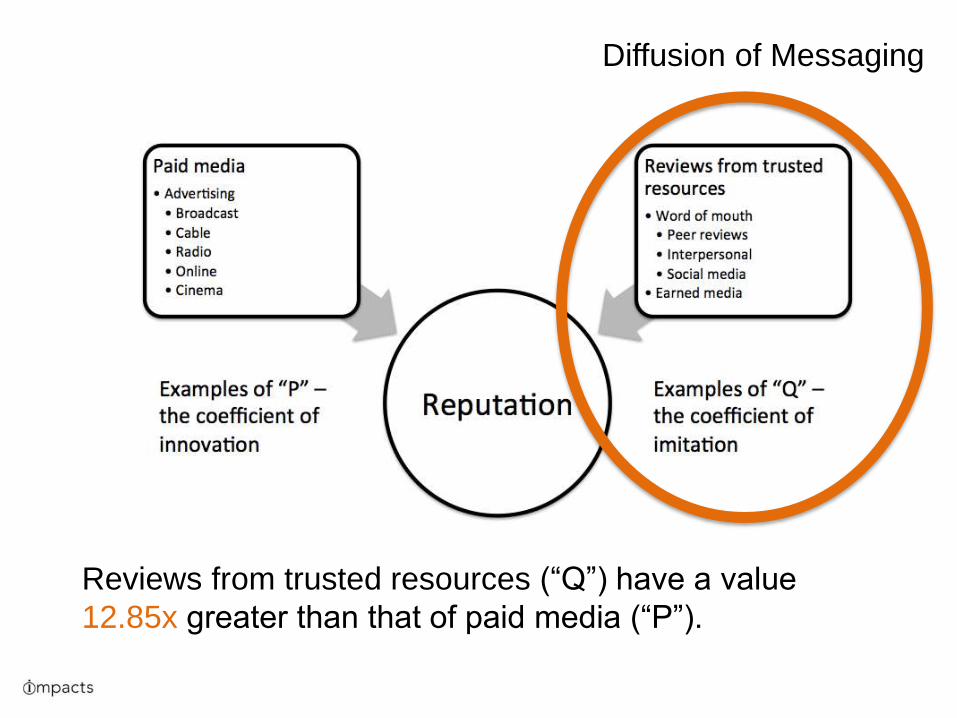
Diffusion of Messaging
Reviews from trusted resources (“Q”) have a value
12.85x greater than that of paid media (“P”).

Content
Connectivity is king

Connection “IRL”
The best thing about a visit to a cultural organization
34.5
55.3
69.7
78.2
111.8
119.6
303.2
0 50 100 150 200 250 300 350
Peace and quiet ("sanctuary from hectic day")
Visiting a new place
Enjoying a day off from work/school
Learning something new
Interacting with staff/volunteers/performers
Seeing/interacting with exhibits/performance
Time with family and friends
1 100
INDEX VALUE

Personalization (RELEVANCE)
• Making the connection matter
• One size does not fit all
– Onsite/online individual attention
– Targeted programs for based on individual
audiences and/or unique motivations
• Affecting everything!
– Membership, fundraising, education
programs, online engagement, group tours


Personal Facilitated Experience
(PFE)
A one-to-one or one-to-few interaction between a
docent, volunteer, or other onsite museum-affiliated
individual and a visitor, couple, or small family.

Admission value
7378
0
20
40
60
80
100
Overall Affirmative PFE

Employee courtesy
7176
0
20
40
60
80
100
Overall Affirmative PFE

Entertainment experience
7075
0
20
40
60
80
100
Overall Affirmative PFE

Educational experience
7176
0
20
40
60
80
100
Overall Affirmative PFE

Overall satisfaction by daypart
72
70
6766 66
6768
70
67
63
61 6162
63
66 66
50
55
60
65
70
75
80
9-10a 10-11a 11a-12p 12-1p 1-2p 2-3p 3-4p >4p
PFE Non-PFE

Mobilization (MISSION)
• Where business and mission meet
• Taking action for our missions
– Visit, donate, become a member, volunteer,
advocacy, etc.
• This makes us successful and feeds back
into access

77
86 87 88
76 75
0
20
40
60
80
100
Free Admission Belonging Supporting Impact Exclusive Access Discounts
VA
LU
E F
OR
CO
ST
OF
ME
MB
ER
SH
IP
PRIMARY BENEFIT OF MEMBERSHIP
Value for Membership Cost by Primary Member Benefit
NOT
VALUABL
E
VERY
VALUABLE

$71
$95 $96$98
$69
$64
$0
$25
$50
$75
$100
$125
Free Admission Belonging Supporting Impact Exclusive Access Discounts
AN
NU
AL C
OS
T O
F M
EM
BE
RS
HIP
PRIMARY BENEFIT OF MEMBERSHIP
Average Annual Membership Cost by Primary Member Benefit
NOT
VALUABL
E
VERY
VALUABLE

Revenue Efficiency: A composite metric contemplative of onsite-related
earned and contributed revenues (e.g. admission, contributions, grants,
membership, programs) contemplated relative to the cost to deliver onsite
services (i.e. operating expenses) and the number of persons served
onsite. Generally, a more “revenue efficient” organization exhibits more
favorable financial key performance indicators (e.g. greater revenues,
greater net operating surplus) and reduced financial volatility than does a
less revenue efficient organization. Data informing the IMPACTS revenue
efficiency calculation are commonly available in an organization’s
financial statements, annual reports, and Form 990 filings.
Reputational Equities: A composite metric contemplative of numerous
visitor perceptions such as reputation, trust, authority, credibility, and
satisfaction that collectively indicate the market’s opinion of an
organization’s relative efficacy in delivering its mission. As mentioned
previously, IMPACTS collects perceptual data from 224 visitor-serving
organizations in the US to inform its reputational equities calculation.

A B
C
DE
F
G
H
I
J K
L
M
AB
C
DE
F
G
H
I
J K
L
M
Revenue Efficiency Reputational Equities
MORE
LESS
Relative Revenue Efficiency and Reputational EquitiesUS Museums – 1Q 2015


“IRL” > 01000111000100010

• California Academy of Sciences
• Carnegie Museums
• Exploratorium
• European Union
• European Union Cultural
Consortium
• MAXXI, Museo Nazionale delle
Arti del XXI Secolo
• Monterey Bay Aquarium
• Musée du Louvre
• Musée d'Orsay
• National Aquarium
• National Oceanic and
Atmospheric Administration
• Stanford University
• Tennessee Aquarium
• The David and Lucile Packard
Foundation
• The Ocean Project
• United Nations Educational,
Scientific and Cultural
Organization
• US Department of State
THANKS AND APPRECIATION TO:

Have questions or ideas?
Please contact me!
Know Your Own Bonecolleendilen.com
@cdillytwitter.com/cdilly
facebook.com/colleendilen
linkedin.com/in/colleendilenschneider
Colleen Dilenschneider