music score processing greater efficiency through analysis chuck peters william & gayle cook...
TRANSCRIPT

1
Music Score ProcessingGREATER EFFICIENCY THROUGH ANALYSIS
• CHUCK PETERS
WILLIAM & GAYLE COOK MUSIC LIBRARY
INDIANA UNIVERSITY

2
Full / Mini; 74163; 61%
Collected Works; 7553; 6%
Performing En-sembles; 4437; 4%
Uncataloged; 35273; 29%
Music Scores = 121,730 Titles
Full / Mini Collected Works Performing Ensembles Uncataloged
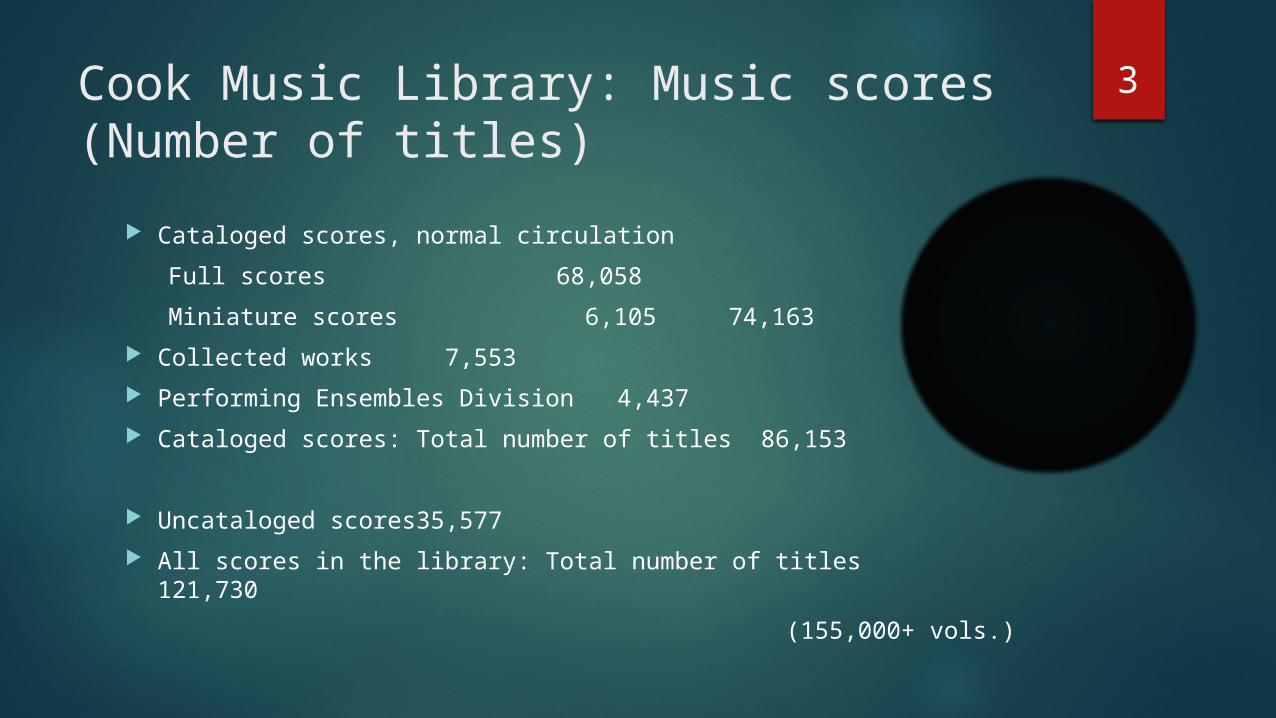
3Cook Music Library: Music scores(Number of titles)
Cataloged scores, normal circulation
Full scores 68,058
Miniature scores 6,105 74,163
Collected works 7,553
Performing Ensembles Division 4,437
Cataloged scores: Total number of titles 86,153
Uncataloged scores 35,577
All scores in the library: Total number of titles 121,730
(155,000+ vols.)
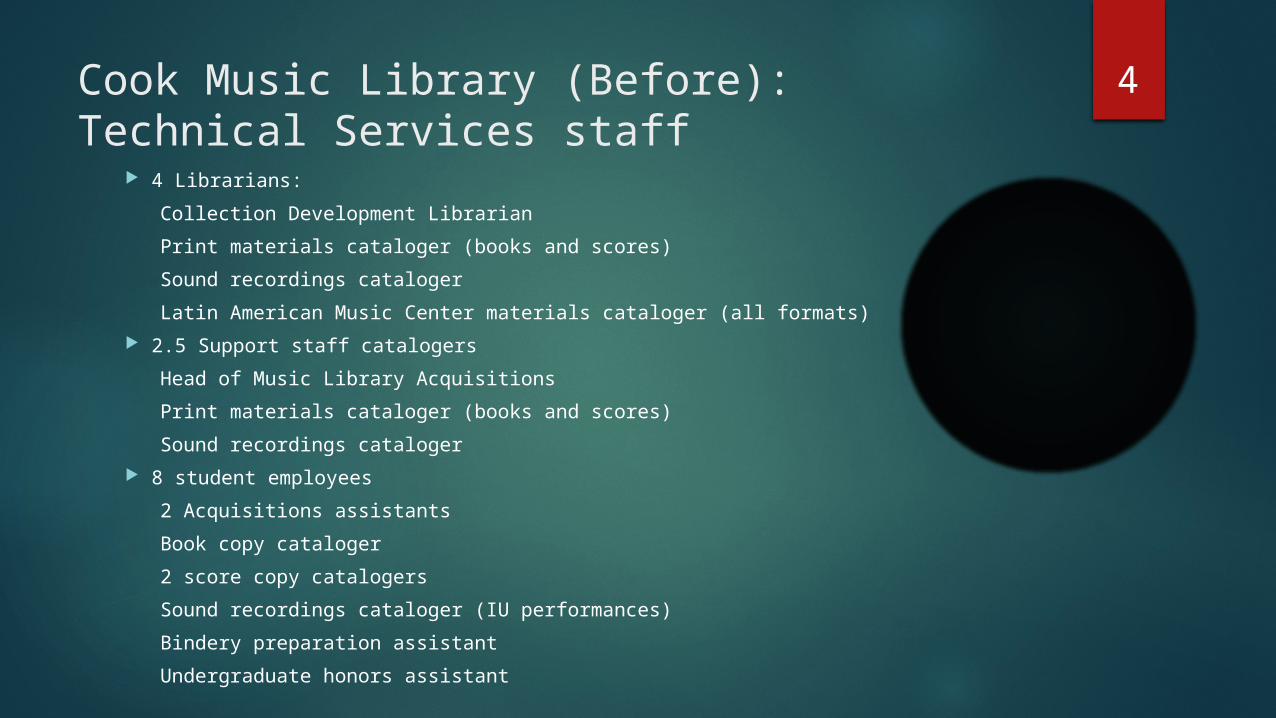
4Cook Music Library (Before):Technical Services staff
4 Librarians:
Collection Development Librarian
Print materials cataloger (books and scores)
Sound recordings cataloger
Latin American Music Center materials cataloger (all formats)
2.5 Support staff catalogers
Head of Music Library Acquisitions
Print materials cataloger (books and scores)
Sound recordings cataloger
8 student employees
2 Acquisitions assistants
Book copy cataloger
2 score copy catalogers
Sound recordings cataloger (IU performances)
Bindery preparation assistant
Undergraduate honors assistant

5
The analysis included all processes involving music scores:
• Firm – Approval – Standing orders
• Downloading copy and placing the order
• Initial receipt and processing
• Workflow routing: Fast Cat or Backlog (Frontlog)
• Cataloging: copy cataloging and original
• Final processing: bindery, label, vault, reserves, etc.

6
The Frontlog part of the analysis• FAST CAT PROCESS WORKING AS IT SHOULD
• HOWEVER, FRONTLOG STILL GROWING!

7

8
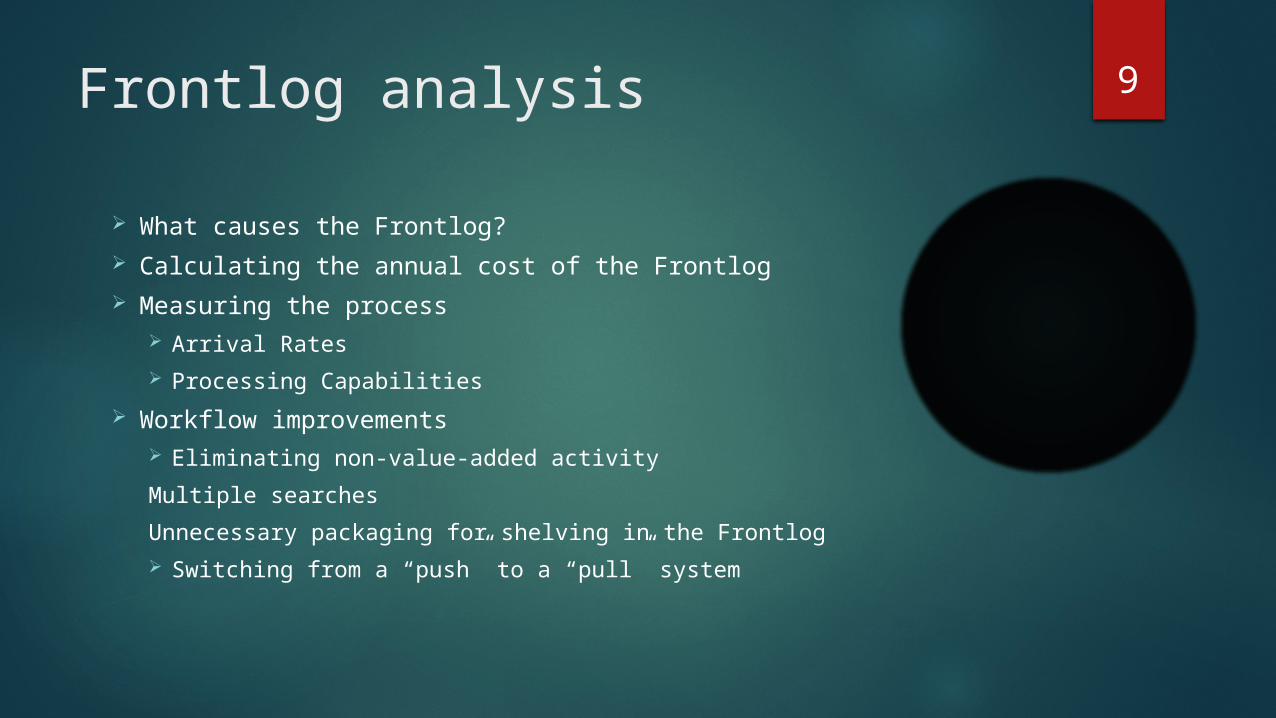
9Frontlog analysis
What causes the Frontlog? Calculating the annual cost of the Frontlog Measuring the process
Arrival Rates Processing Capabilities
Workflow improvements Eliminating non-value-added activity
Multiple searches
Unnecessary packaging for shelving in the Frontlog Switching from a “push” to a “pull” system
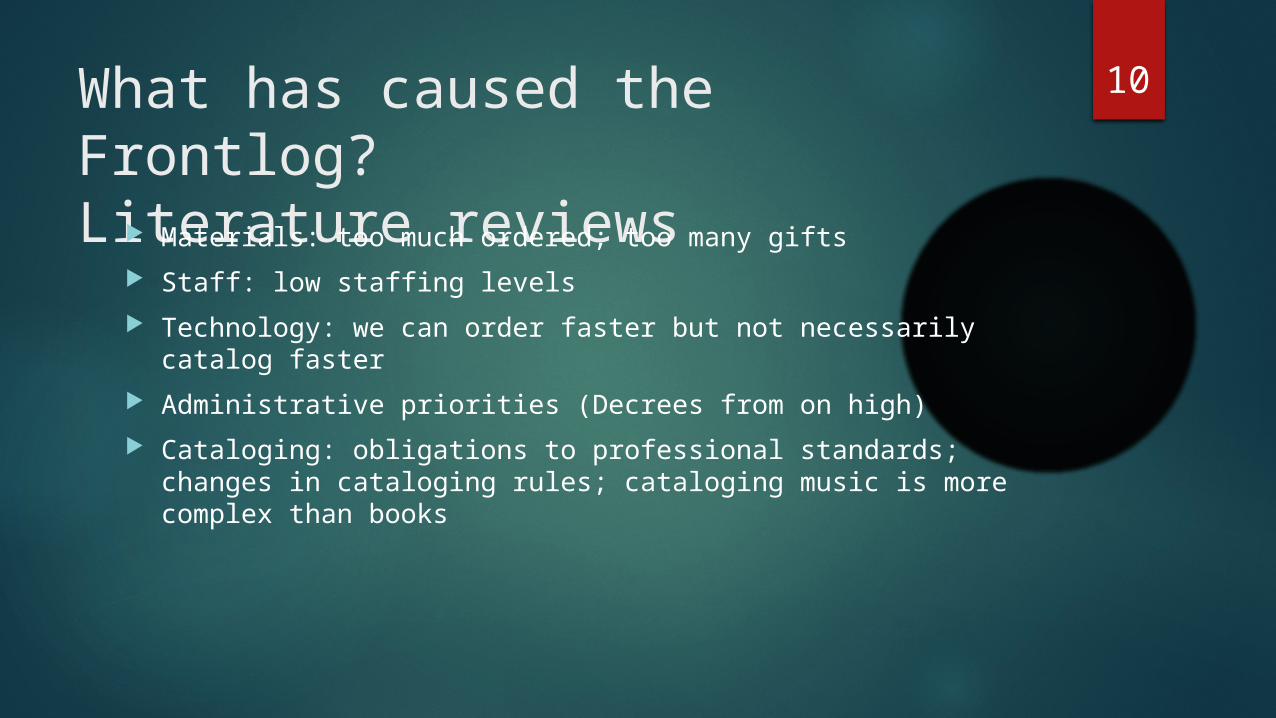
10What has caused the Frontlog?Literature reviews
Materials: too much ordered; too many gifts
Staff: low staffing levels
Technology: we can order faster but not necessarily catalog faster
Administrative priorities (Decrees from on high)
Cataloging: obligations to professional standards; changes in cataloging rules; cataloging music is more complex than books
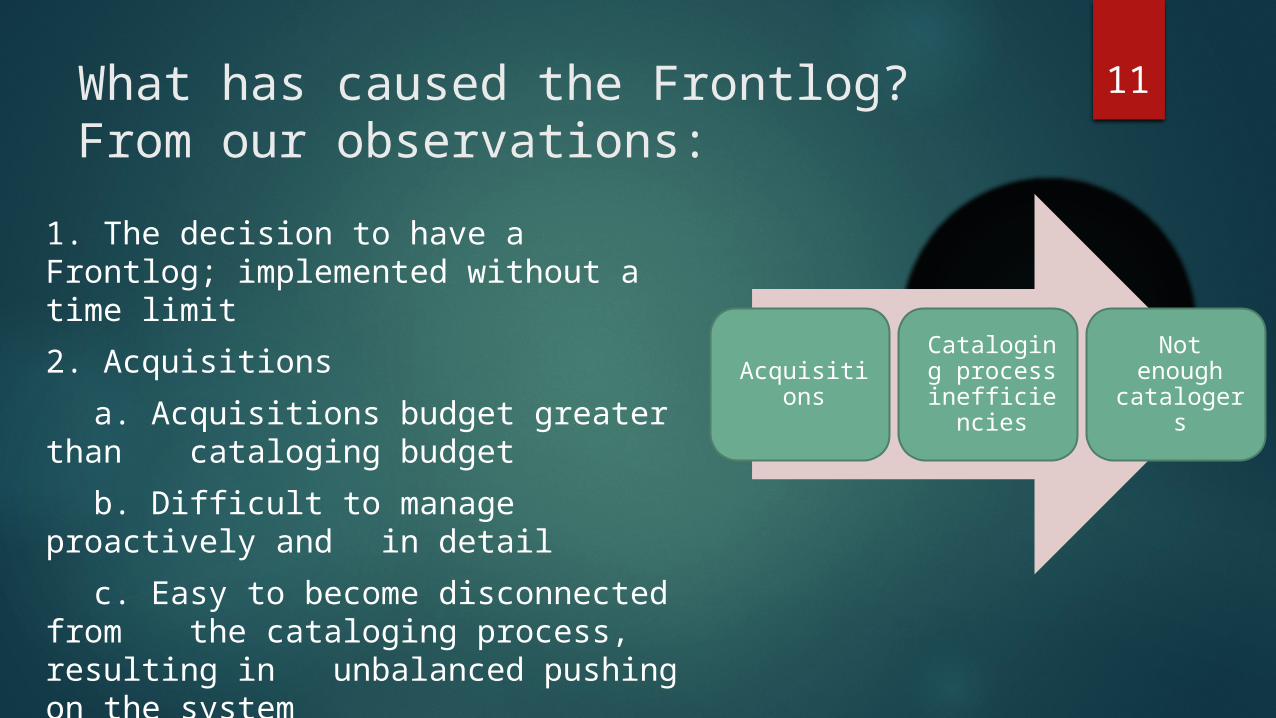
11What has caused the Frontlog?From our observations:
1. The decision to have a Frontlog; implemented without a time limit
2. Acquisitions
a. Acquisitions budget greater than cataloging budget
b. Difficult to manage proactively and in detail
c. Easy to become disconnected from the cataloging process, resulting in unbalanced pushing on the system
3. Gifts: unpredictable
Acquisitions
Cataloging process
inefficiencies
Not enough catalogers

12What has caused the Frontlog?From our observations:
4. We must maintain professional cataloging standards
5. Workflow inefficiencies within Tech Services
a. Acquisitions arrival rate unknown (see above)
b. Processing capability unknown
c. Redundant work being performed
6. Resource shortages within Tech Services
Acquisitions
Cataloging process
inefficiencies
Not enough catalogers

13Metrics needed for consistent performance
Key metrics that should be available at any time:
• How many items can Acquisitions process in [time period]?
• Number of titles ordered / received / outstanding / gifts
Firm; Approval; Standing orders
• How many items can be cataloged in [time period]?
• How many items cataloged vs shelved in the Frontlog?
• Staffing: academic calendar, reserves, FY deadlines, etc.; training to multiple tasks
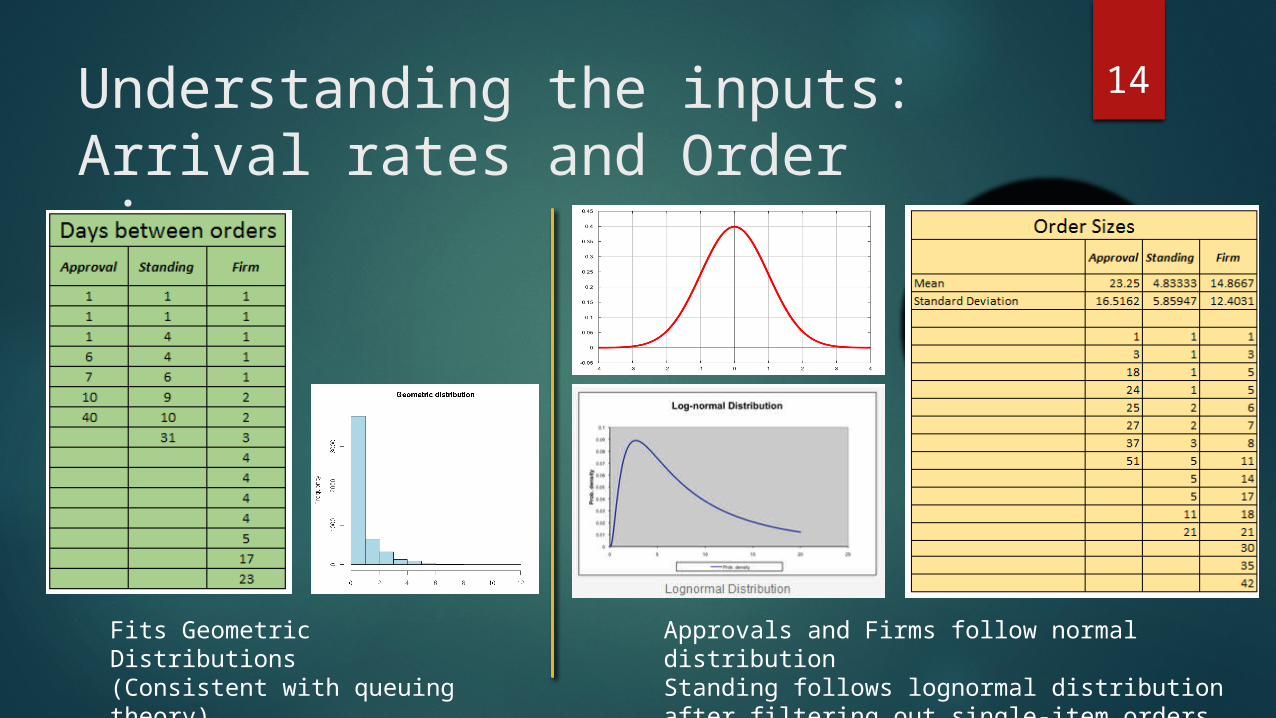
14Understanding the inputs:Arrival rates and Order sizes
Fits Geometric Distributions(Consistent with queuing theory)
Approvals and Firms follow normal distributionStanding follows lognormal distribution after filtering out single-item orders

15Gathering the raw data:Calculating Acquisitions functions
Search OCLC for copy
Place orders
Receive orders
Invoice check-in process
Materials processing: Fast Cat or Frontlog
Property stamp
Barcode
Tattle tape
Scores and parts in envelopes
Process gift donations
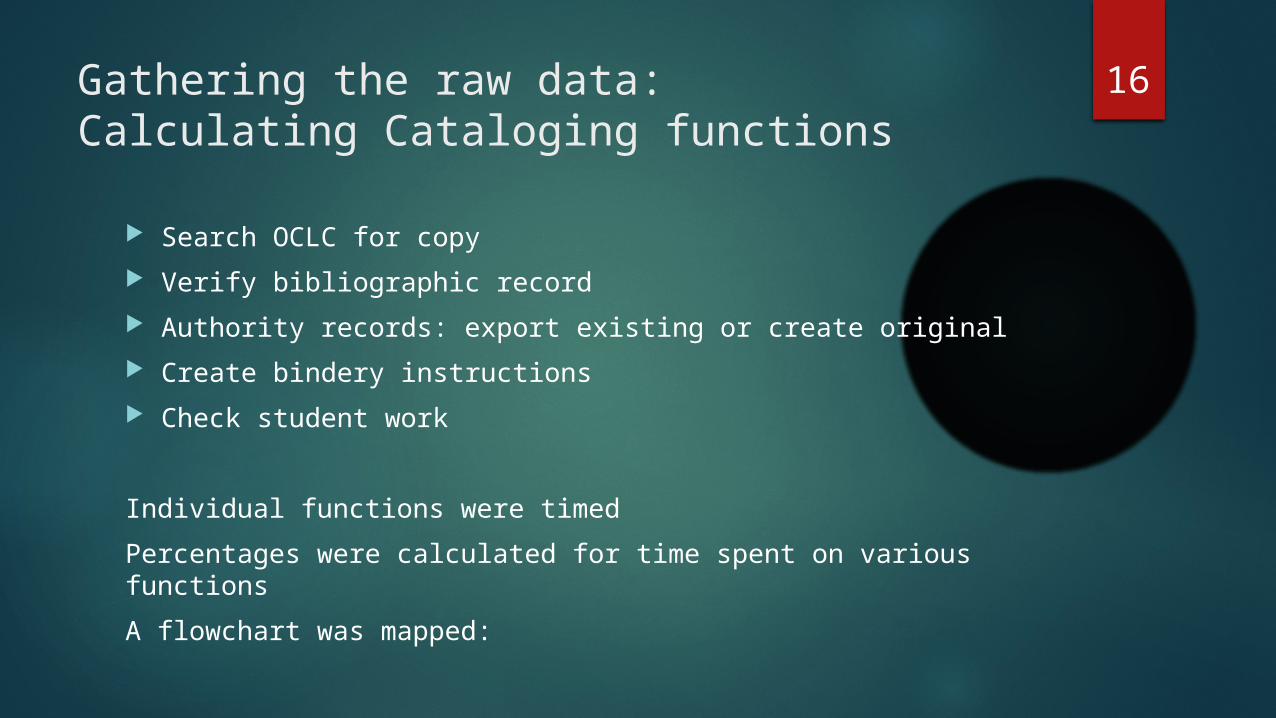
16Gathering the raw data:Calculating Cataloging functions
Search OCLC for copy
Verify bibliographic record
Authority records: export existing or create original
Create bindery instructions
Check student work
Individual functions were timed
Percentages were calculated for time spent on various functions
A flowchart was mapped:

17Workflow Improvement:Mapping the Process
Before: After:
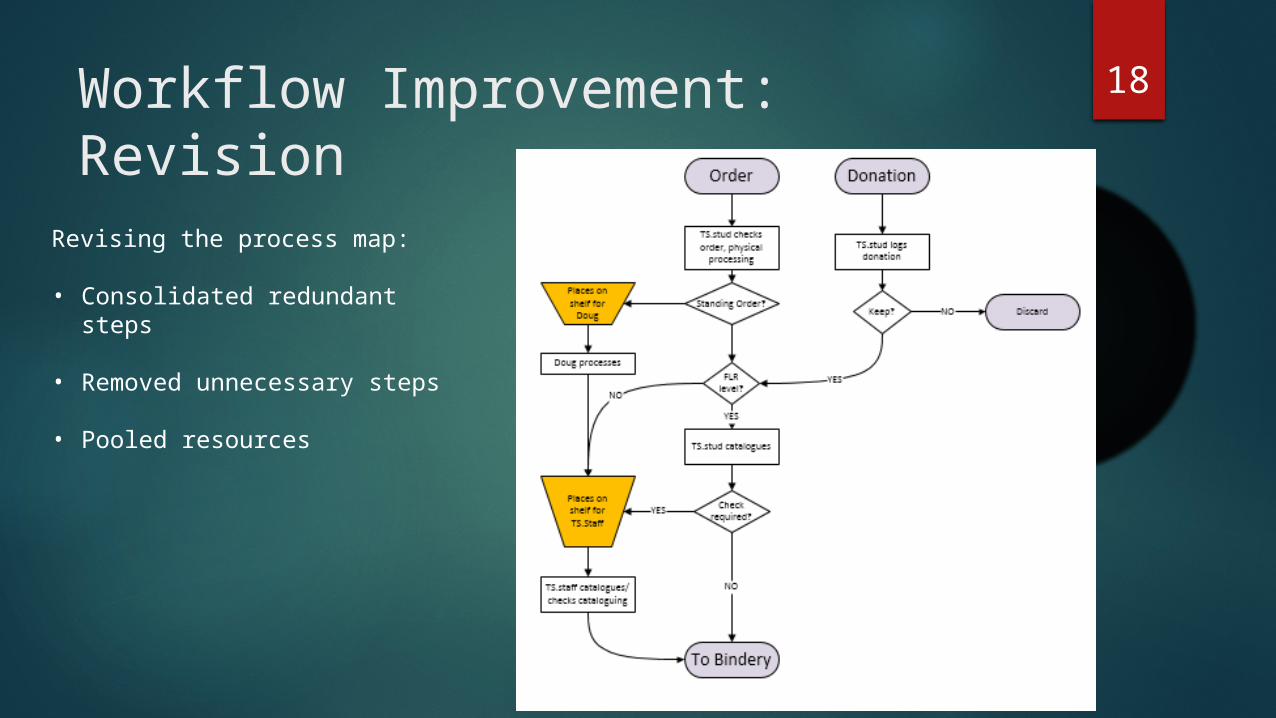
18Workflow Improvement: Revision
Revising the process map:
• Consolidated redundant steps
• Removed unnecessary steps
• Pooled resources

19What changed?
Student job descriptions were combined
Knowledgeable staff moved to the beginning of the receiving process (keeping materials from being added to the Frontlog)
Acquisitions invoice process became more automated, eliminating the need to create brief bibliographic records
Cataloging copy: full level or above accepted
Duplicate searches were removed from the process
Unnecessary authority records no longer created
Duplicate checking of work was eliminated
Performing Ensembles Librarian trained in copy cataloging
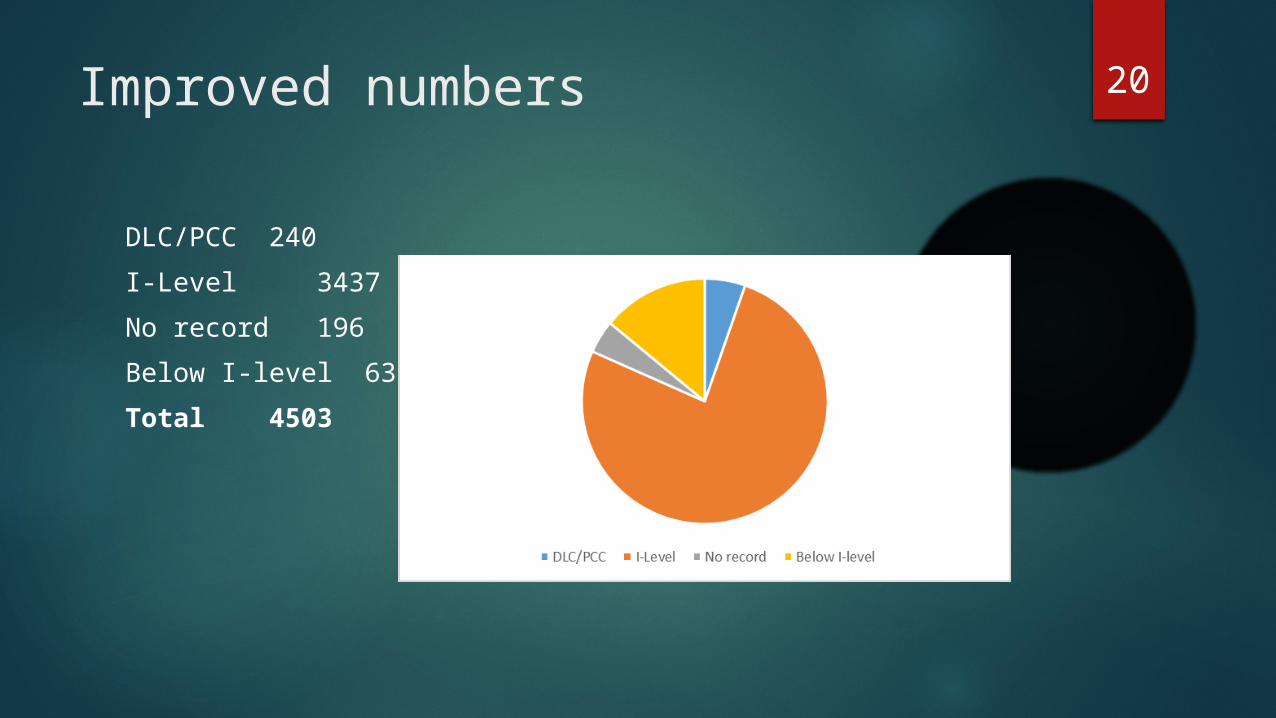
20Improved numbers
DLC/PCC 240
I-Level 3437
No record 196
Below I-level 630
Total 4503

21Workflow Improvement: ImplicationsWe need to: Revisit professional standards
Rewrite job descriptions
Temporary (student hourly) positions
Support staff
Retrain
Implement data collection and analysis
Maintain an integrated workflow
Acquisitions—Cataloging—Processing and bindery