music & visual arts - national center for education...
TRANSCRIPT

US Department of Education
NCES 2009 488
NATIONAL ASSESSMENT OF EDUCATIONAL PROGRESS AT GRADE 8
Music amp Visual Arts
NCES 2009ndash488
US Department of Education
The Nationrsquos Report CardTM informs the public
about the academic achievement of elementary and
secondary students in the United States Report cards
communicate the findings of the National Assessment of
Educational Progress (NAEP) a continuing and nationally
representative measure of achievement in various subjects
over time
Since 1969 NAEP assessments have been conducted
periodically in reading mathematics science writing US
history civics geography the arts and other subjects
NAEP collects and reports information on student
performance at the national state and local levels
Contents 1 Executive Summary
4 Introduction
7 Music
19 Visual Arts
34 Technical Notes and Data Appendix
making the assessment an integral part of our nationrsquos
evaluation of the condition and progress of education
Only academic achievement data and related background
information are collected The privacy of individual
students and their families is protected
NAEP is a congressionally authorized project of the
National Center for Education Statistics (NCES) within the
Institute of Education Sciences of the US Department of
Education The Commissioner of Education Statistics is
responsible for carrying out the NAEP project The National
Assessment Governing Board oversees and sets policy
for NAEP
What is The Nationrsquos Report Cardtrade
This report presents the results of the 2008 National Assessment of Educational Progress (NAEP) in the arts which was given to a nationally representative sample of 7900 eighth-grade public and private school students Approximately one-half of these students were assessed in music and the other half were assessed in visual arts
This report presents the results of the 2008 National Assessment of Educational Progress (NAEP) in the arts which was given to a nationally representative sample of 7900 eighth-grade public and private school students Approximately one-half of these students were assessed in music and the other half were assessed in visual arts
The MUSIC portion of the assessment measured studentsrsquo ability to respond to music in various ways Students were asked to analyze and describe aspects of music they heard critique instrumental and vocal performances and demonstrate their knowledge of standard musical notation and musicrsquos role in society One question for example asked students to identify the instrument they heard in the beginning solo of ldquoRhapsody in Bluerdquo that was played for them
The average responding score for music was reported on a NAEP scale of 0 to 300 Scores ranged from 105 for the lowest-performing students to 194 for the highest-performing students
The VISUAL ARTS portion of the assessment included questions that measured studentsrsquo ability to respond to art as well as questions that measured their ability to create art Responding questions asked students to analyze and describe works of art and design For example students were asked to describe specific differences in how certain parts of an artistrsquos self-portrait were drawn The average responding score for visual arts was reported on a NAEP scale of 0 to 300 with scores ranging from 104 for the lowest-performing students to 193 for the highest-performing students
Creating questions on the other hand required students to create works of art and design of their own For example students were asked to create a self-portrait that was scored for identifying detail compositional elements and use of materials The average creating task score for visual arts was reported separately as the average percentage of the maximum possible score from 0 to 100 with a national average of 52 In general students who performed well on the responding questions also performed well on the creating questions
ARTS 2008ARTS 2008 1
Racialethnic and gender gaps evident in both music and visual arts Although the results for music and visual arts are reported separately and cannot be compared some general patterns in differences between student groups were similar in the two disciplines
bull Average responding scores in both music and visual arts were 22 to 32 points higher for White and AsianPacific Islander students than for Black and Hispanic students The creating task scores in visual arts were also higher for White and Asian Pacific Islander students than for their Black and Hispanic peers
bull Average responding scores for female students were 10 points higher than for male students in music and 11 points higher in visual arts Female students also outperformed male students in creating visual art
Frequency of arts instruction remains steady In 2008 fifty-seven percent of eighth-graders attended schools where music instruction was offered at least three or four times a week and 47 percent attended schools where visual arts
instruction was offered at least as often There were no statistically significant changes since 1997 in the percentages of students attending schools offering instruction in music or visual arts with varying frequency
There were also no significant differences found between the percentages of students in different racialethnic or gender groups attending schools with varying opportunities for instruction in either music or visual arts in 2008
COMPARISONS BETWEEN 1997 AND 2008
Although the questions in the 2008 assessment were taken from those administered in the 1997 arts assessment some of the scoring procedures could not be replicated in 2008 Therefore comparisons cannot be made between studentsrsquo scores in those two years However comparisons can be made for the percentages of students who responded correctly to the multiple-choice questions in the assessment and the percentages of students based on responses to background questions that were asked in both years
THE NATIONrsquoS REPORT CARD 2
Music
71 correctly identifi ed a symphony orchestra as the type of ensemble that played a piece of music
52 were able to identify Africa as the region of origin for a musical excerpt and could describe a characteristic of the musicrsquos style
20 were able to identify the name of a piano dynamic marking and explain its meaning
Visual Arts
53 were able to describe specifi c differences in how certain parts of an artistrsquos self-portrait were drawn
34 were able to describe two characteristics of the medium of charcoal as used in an artistrsquos self-portrait
19 were able to connect the formal characteristics
More students writing down music and writing about their artwork in arts classes The percentage of eighth-grade students who reported being asked by their teacher to write down music in music class showed an increase from 26 percent in 1997 to 33 percent in 2008 (fi gure A) However the percentages of students who reported engaging in other activities such as listening to music singing playing instruments working on group assignments and making up their own music in 2008 were not found to be signifi cantly different from the percentages of students in 1997
The percentage of eighth-grade students who were asked by their teacher to write about their artwork in visual arts class increased from 21 percent in 1997 to 27 percent in 2008 (figure B) The percentage of students whose teacher had them choose their own art project on the other hand decreased from 47 percent to 39 percent over the same period Additionally the percentage of students who reported visiting an art museum gallery or exhibit with their class decreased from 22 percent in 1997 to 16 percent in 2008 There were no signifi cant changes for other activities such as painting or drawing making things out of clay or other materials or working in pairs or groups
of an artistrsquos self-portrait with what the artist was trying to communicate
Figure A Percentage of students at grade 8 who are asked to write down music at least once a month in music class 1997 and 2008
1997
2008 33
26
0 10 20 30 40 50 60 70 80 90 100
Percent
Significantly different (p lt 05) from 2008
Figure B Percentage of students at grade 8 who are asked to write about their artwork at least once a month in art class 1997 and 2008
1997
2008 27
21
0 10 20 30 40 50 60 70 80 90 100
Percent
Significantly different (p lt 05) from 2008 SOURCE US Department of Education Institute of Education Sciences National Center for Education Statistics National Assessment of Educational Progress (NAEP) 1997 and 2008 Arts Assessments
ARTS 2008 3
The 2008 NAEP arts assessment measured studentsrsquo knowledge and skills in the arts by asking them to observe describe analyze and evaluate existing works of music and visual art and to create original works of visual art
The Eighth-Grade Arts Assessment The Arts Framework The NAEP arts framework serves as the blueprint for the assessment describing the specifi c knowlshyedge and skills that should be assessed in the arts disciplines Developed under the guidance of the National Assessment Governing Board the framework reflects the input of arts educators artists assessment specialists policymakers representatives from the business community and members of the public The National Standards for Arts Education1 also served as an important reference in the development of the NAEP arts framework
The framework specifies that studentsrsquo arts knowledge and skills be measured in four arts disciplines dance music theatre and visual arts Additionally three arts processesmdashresponding creating and performingmdashare central to studentsrsquo experiences in these disciplines While the responding process refers to observing describing
1 National Standards for Arts Education (1994) Reston Virginia Music Educators National Conference
analyzing and evaluating works of art the creating process refers to expressing ideas and feelings in the form of an original work of art Due to budget constraints only the responding process in music and both the responding and creating processes in visual arts were assessed in 2008
To learn more about the arts framework visit httpwwwnagborgpublicationsframeworks arts-framework08pdf
Assessment Design Because of the breadth of content covered in the NAEP arts assessment each student was assessed in only one arts discipline either music or visual arts
The responding process in music and visual arts was assessed with multiple-choice questions and constructed-response questions that required students to produce answers of a few words or sentences The constructed-response questions that assessed the creating process included questions that required students to generate written answers and to create original works of visual art
THE NATIONrsquoS REPORT CARD 4
Scoring Studentsrsquo Work in the Arts One of the challenges of the arts assessment was scoring studentsrsquo work Specific scoring guides were developed for the responding questions in music and the responding and creating questions in visual arts Scorers were then trained to apply these criteria appropriately when evaluating studentsrsquo responses that demonstrated a wide range of skill levels in music and visual arts
The scoring guides for the sample questions presented in this report and other released questions from the assessment are available in the NAEP Questions Tool at httpncesedgov nationsreportcarditmrls
Reporting Arts Results The results in this report are based on a nationally representative sample of 7900 eighth-grade students from 260 public and private schools Approximately one-half of these students were assessed in music and the other half were assessed in visual arts
Because music and visual arts are two distinct disciplines results are reported separately for
each area and cannot be compared The average responding scores for music and visual arts are reported on two separate NAEP scales each ranging from 0 to 300 The average creating task score for visual arts is reported as the average percentage of the maximum possible score ranging from 0 to 100 The arts assessment results cannot be reported in terms of the NAEP achievement levels (Basic Profi cient and Advanced) given the complex and diverse nature of the assessment tasks both within and across the arts disciplines
Comparisons Between 1997 and 2008 Although the questions in the 2008 assessment were taken from those administered in the previous arts assessment in 1997 not all of the results can be compared between the two years (see the Technical Notes for more information) While comparisons across years cannot be made for the average responding and creating task scores the percentages of studentsrsquo correct responses to the multiple-choice questions in 2008 can be compared to those in 1997 These results are provided in appendix table A-3 for music and table A-4 for visual arts
ARTS 2008 5
Accommodations and Exclusions in NAEP Testing accommodations (for example providing students with extra testing time or administering the assessment to students individually rather than in a group) are made available for students with disabilities and for English language learners participating in NAEP Even with the availability of accommodations a portion of these students was excluded from the NAEP arts assessment by their schools In the 2008 arts assessment overall exclusion rates for students with disabilities andor English language learners were 2 percent of all students for music and for visual arts (see appendix table A-6)
More information about NAEPrsquos policy on the inclusion of special-needs students is available at httpncesedgovnationsreportcardabout inclusionasp
Interpreting Results NAEP uses widely accepted statistical standards for presenting and discussing results Findings are reported based on statistical significance at the 05 level using t-tests with appropriate adjustments for multiple comparisons (using the False Discovery Rate procedure) Results that are reported to be ldquohigherrdquo or ldquolowerrdquo have been found to be statistically signifi cant
In addition to the overall results for eighth-graders in the nation performance is presented for different student groups These results should not be used to establish a cause-and-effect relationship between background characteristics and achievement A complex mix of education and socioeconomic factors may affect student performance
For additional information about interpreting results see the Technical Notes section of this report or visit httpncesedgovnationsreportcard tdwanalysisinferasp
THE NATIONrsquoS REPORT CARD 6
7ARTS 2008
The 2008 arts assessment in music measured studentsrsquo ability to respond to music There were a total of four music sections in the arts assessment each of which contained between 8 and 16 multiple-choice and constructed-response (or open-ended) questions Many of the music questions in the assessment included multiple parts Each student who was assessed in music was presented with two of the four sections Because the length of the recorded music that was played for students varied in each section the amount of time provided for students to complete two music sections ranged from 58 minutes to 63 minutes
Students were asked to analyze and describe aspects of music they heard critique instrumental and vocal performances and demonstrate their knowledge of standard musical notation and musicrsquos role in society Examples of the different types of music questions are presented later in this section
8 THE NATIONrsquoS REPORT CARD
174
Eighty-nine-point score gap between lowest- and highest- performing students in music While the overall average responding score in music was set at 150 in 2008 students at grade 8 exhibited a wide range of responding scores (figure 1) For example scores ranged from 105 for lower-performing students at the 10th percentile to 194 for higher-performing students at the 90th percentile Students at the 50th percentile had a score of 151
SOURCE US Department of Education Institute of Education Sciences National Center for Education Statistics National Assessment of Educational Progress (NAEP) 2008 Arts Assessment
Figure 1 Average responding scale score and percentile scores in NAEP music at grade 8 2008
Overall 10th 25th 50th 75th 90th average score Percentile score
150
194
128
105
0
300 200
190
180
170
160
150
140
130
120
110
100
Scale score
151
174
A constructed-response question that asked
students to write two measures of rhythmic
music notation was included in one of the four
music sections Due to budget constraints this
was the only question in the assessment that
asked students to create music therefore an
average creating task score for music could not
be reported However results for this question
and other released questions from the 2008 arts
assessment are available at httpncesedgov
nationsreportcarditmrls
Creating Music
9ARTS 2008
Racialethnic gender and socioeconomic gaps in music scores
In addition to the overall average responding score In general the same patterns in score gaps seen in in music results are also available based on student other NAEP subjects were also evident in the results for characteristics such as raceethnicity gender and music (figure 2) The percentages of students in each eligibility for the National School Lunch Program student group can be found in appendix table A-5
RaceEthnicity In 2008 average responding scores in music for White and AsianPacific Islander students were 29 to 32 points higher than the scores for Black and Hispanic students There were no signifi cant differences between the average responding scores of White and AsianPacific Islander students or between the scores of Black and Hispanic students
Figure 2 Average responding scale score in NAEP music at grade 8 by selected student characteristics 2008
Scale score 300
200
190
180
170
160
150
140
130
120
110
0 White Black Hispanic Asian Male Female Eligible Not
Pacific eligible Islander
Raceethnicity
161
130 129
159
Gender
145
155
Eligibility for freereduced-price
school lunch
132
161
NOTE Black includes African American Hispanic includes Latino and Pacific Islander includes Native Hawaiian Race categories exclude Hispanic origin Sample sizes were insuffishycient to permit reliable estimates for students whose raceethnicity was American IndianAlaska Native or unclassified For the eligibility for freereduced-price school lunch category results are not shown for students whose eligibility status was not available SOURCE US Department of Education Institute of Education Sciences National Center for Education Statistics National Assessment of Educational Progress (NAEP) 2008 Arts Assessshyment
10 THE NATIONrsquoS REPORT CARD
Gender On average female students had a higher respondshying score in music than their male counterparts There was a 10-point gap between the two groups in 2008
Eligibility for FreeReduced-Price School Lunch NAEP uses studentsrsquo eligibility for the National School Lunch Program as an indicator of poverty
2 The score-point difference is based on the difference between the unrounded scores as opposed to the rounded scores shown in the fi gure
Students from lower-income families are typically eligible for freereduced-price school lunch (see the Technical Notes at the end of this report for eligibility criteria) while students from higher-income families typically are not On average the responding score for students who were eligible was 28 points2 lower than the score for students who were not eligible
Music scores vary by type and location of schools
Results by selected school characteristics also show based on the type of school or its location Differences differences in average responding scores for music in access to arts instruction and quality curricula (fi gure 3) It is important to note that there may be many socioeconomic status and other factors not measured reasons students performed differently on average in NAEP may influence student achievement in the arts
Type of School Public school students made up 93 percent of eighth-graders in the nation in 2008 while the other 7 percent of students attended private schools The average responding score in music for eighth-graders in public schools was 14 points lower than the score for students in private schools
School Location Results are available for four school location categories city suburb town and rural Descriptions of how these school location categories are defi ned are included in the Technical Notes section of this report
In 2008 eighth-graders who attended city schools had a lower average responding score in music than students who attended suburban town and rural schools There were no significant differences in the average scores among students in suburban town and rural school locations
Figure 3 Average responding scale score in NAEP music at grade 8 by selected school characteristics 2008
Scale score 300
200
190
180
170
160
150
140
130
120
110
0
School location
142
155 156 150
Type of school
149
163
Public Private City Suburb Town Rural
SOURCE US Department of Education Institute of Education Sciences National Center for Education Statistics National Assessment of Educational Progress (NAEP) 2008 Arts Assessment
11ARTS 2008
Context for Arts Education in Music Information collected from school and student on the availability and nature of music education in questionnaires helps to provide the context in which their schools Students provided information on their arts learning takes place For the music portion of the participation in music activities assessment school administrators provided information
Frequency of music instruction remains steady School administrators were asked how often eighth-graders attending their schools might receive instruction in music Fifty-seven percent of eighth-graders attended schools where students could have received music instruction at least three or four times a week in 2008 (figure 4) This was higher than the percentages of students attending schools where music was offered less frequently or not at all
Although the data are not shown here access to music instruction as reported by school administrators did not differ significantly by raceethnicity gender or eligibility for freereduced-price school lunch For example the percentage of Black students attending schools where music was offered at least 3 or 4 times a week was not significantly different from the percentage of White students
The same question was asked of school administrators in 1997 making it possible to look for changes in the instruction patterns over time The apparent increase between 1997 and 2008 in the percentage of students attending schools where music was available at least three or four times a week was not statistically significant nor were there any significant changes in the percentages of students attending schools where music was offered once or twice a week less than once a week or not at all
Figure 4 Percentage of students at grade 8 by school-reported frequency with which instruction in music is available 1997 and 2008
1997
2008
Once or twice a week 27
38
At least 3 or 4 times a week 57
43
9Subject not offered 8
Less than once a week
10
8
0 10 20 30 40 50 60 70 80 90 100
Percent
NOTE Detail may not sum to totals because of rounding SOURCE US Department of Education Institute of Education Sciences National Center for Education Statistics National Assessment of Educational Progress (NAEP) 1997 and 2008 Arts Assessments
71 percent of eighth-graders attended schools where administrators reported that their state or district had a curriculum in music in 2008
77 percent of students attended schools where music was taught by a full-time specialist
12 THE NATIONrsquoS REPORT CARD
More students writing down music in music class Students responded to a series of questions about how often they did certain activities in music class For each activity listed in figure 5 students indicated if they were asked by their teacher to do it almost every day once or twice a week once or twice a month or never or hardly ever Students were also given the option of indicating that they did not have music in school The results summarized here show the combined percentages for all eighth-grade students who reported that they did various music-related activities at least once a month
For the most part students were as likely to be asked by their teachers to engage in these musical activities in 2008 as in 1997 There were no significant changes in the percentages of students who reported that teachers played music for them to listen to or asked them to sing play an instrument work on group assignments or make up their own music Only the percentage of students who reported being asked to write down music showed a statistically significant increase from 26 percent in 1997 to 33 percent in 2008
About one-third of students participate in musical performance activities at school Students were also asked several questions about their participation in musical performance activities at school These included whether or not they played in a band played in an orchestra or sang in a chorus or choir Overall 34 percent of eighth-graders reported participating in one or more of these musical activities at school in 2008 (fi gure 6) Although questions about participation in these musical activities were also asked in 1997 changes in the format of the questions prohibit comparing results from the two years
Figure 5 Percentage of students at grade 8 by student-reported in-school activities their teachers ask them to do in music class at least once a month 1997 and 2008
16
17
36
26
33
28
28
30
49
51
35
33
Listen to music
Sing
Play instruments
Write down music
Work on group assignments
Make up own music 1997
2008
0 10 20 30 40 50 60 70 80 90 100
Percent
Significantly different (p lt 05) from 2008
Figure 6 Percentage of students at grade 8 by student-reported participation in musical activities in school 2008
Play in a band
Play in an orchestra
Sing in a chorus or choir
One or more of the three activities
17
34
16
5
0 10 20 30 40 50 60 70 80 90 100
Percent
NOTE Students were permitted to select more than one musical activity The percentage for the category ldquoOne or more of the three activitiesrdquo was derived from studentsrsquo responses to each of the other three categories and was not a separate option by itself SOURCE US Department of Education Institute of Education Sciences National Center for Education Statistics National Assessment of Educational Progress (NAEP) 1997 and 2008 Arts Assessments
13ARTS 2008
What Eighth-Graders Know and Can Do in Music The item map below is useful for understanding studentsrsquo performance at different points on the responding scale The scale scores on the left represent the average scores for students who were likely to get the questions correct or partially correct Scores for the 25th and 75th percentiles are also noted The descriptions of selected assessment questions are listed on the right
For example the map shows that higher-performing eighth-graders in the upper range of the scale with an average score of 265 were likely to be able to identify one element of jazz present in ldquoRhapsody
Grade 8 NAEP Music Responding Item Map
Scale score Question description
in Bluerdquo Middle-performing students with an average score of 163 were likely to be able to describe one feature of a song that identifies it as a spiritual
Constructed-response questions for which students could earn partial credit may appear on the map multiple times once for each level of credit For example a question asking students to provide the name of a piano dynamic marking and to explain its meaning appears at the score of 192 for responses receiving full credit and at 183 for responses receiving partial credit
300
275 Identify piece of music as coming from twentieth century and provide limited justifi cation why 265 Identify one element of jazz present in ldquoRhapsody in Bluerdquo
239 Describe an emotion or mood created by a composition and describe two ways in which emotion or mood was created
237 Provide a partial identifi cation and description of the errors in pitch in an instrumental solo
230 Describe a similarity and a difference between two written vocal parts
228 Identify the solo instrument beginning ldquoRhapsody in Bluerdquo (page 17)
225 Provide a comparison between the tone color of two different singers
195 Select a line drawing refl ective of the texture of an example of music (page 15)
195 Identify the term for a fermata symbol
192 Identify the name of a piano dynamic marking and explain its meaning (page 16)
183 Either identify the name of a piano dynamic marking or explain its meaning (page 16)
182 Provide a limited explanation of why spirituals were important in peoplersquos lives
176 Identify a correct time signature for a piece of music
172 Identify region of origin of African musical excerpt and provide a description of a characteristic related to its style (page 18)
167 Identify a bass clef symbol
166 Identify the type of instrumental ensemble performing an excerpt
163 Describe one feature of a song that identifi es it as a spiritual
151 Identify the length of the introduction of ldquoShalom My Friendsrdquo
136 Identify directional contour of part of melodic phrase
124 Identify region of origin of African musical excerpt and provide partial explanation of its style characteristics (page 18)
84 Describe an emotion or mood created by a composition 49 Identify region of origin of African musical excerpt (page 18)
0
174 75th percentile
128 25th percentile
NOTE Regular type denotes a constructed-response question Italic type denotes a multiple-choice question The position of a question on the scale represents the average scale score attained by students who had a 65 percent probability of obtaining credit at a specific level of a constructed-response question or a 74 percent probability of correctly answering a four-option multiple-choice question SOURCE US Department of Education Institute of Education Sciences National Center for Education Statistics National Assessment of Educational Progress (NAEP) 2008 Arts Assessment
14 THE NATIONrsquoS REPORT CARD
A
SAMPLE QUESTION Identifying the Texture of a Musical Example The sample question below asked students to identify the texture of a musical example that was played (The term ldquotexturerdquo was defined for the students as the blend of various musical sounds and the ways in which the lines of music in a piece are related)
The music played for this question came from the beginning of ldquoContrapunctus 4rdquo from The Art of the Fugue by JS Bach In the recording the fugue was played by a brass quartet The fugue begins with one instrument entering and playing the subject (the initial melody) of the fugue followed by the other members of the quartet each playing the melody The audio for this question is available in the NAEP Questions Tool at httpncesedgov nationsreportcarditmrls
Each of the four diagrams below illustrates an example of a texture that could occur in a piece of music In 2008 fifty-two percent of eighth-graders selected the correct answer (choice A) which shows the general pattern of musical lines that occurred in the music that was played This was not found to be significantly different from the 52 percent who answered correctly in 1997 The other three choices are incorrect because they show patterns of musical lines that did not match the music that was played Choice B shows a group of three voices in alternation with a solo line choice C shows an alternation of two lines with no accompanying lines or voices and choice D shows a solo line with a block chord accompaniment
Percentage of students in each response category at grade 8 2008
Choice A Choice B Choice C Choice D Omitted
52 18 5 25 Rounds to zero NOTE Detail may not sum to totals because of rounding SOURCE US Department of Education Institute of Education Sciences National Center for Education Statistics National Assessment of Educational Progress (NAEP) 2008 Arts Assessment
Which diagram best illustrates the texture of the music
B
DC
AAAAAAAAAAAAAAAAAAAAAAAA
15ARTS 2008
SAMPLE QUESTION Reading Musical NotationThis two-part sample question was taken from a set of questions that asked students to demonstrate knowledge of standard musical notation In the question below students were asked to provide the name and meaning of the symbol indicated in circle 1 in the music shown here No recorded music was played for this question The question that pertains to the symbol indicated in circle 2 is not
shown here but is available in the NAEP Questions Tool at httpncesedgovnationsreportcarditmrls
Student responses for this two-part question were rated using three scoring levels Adequate Limited and Inadequate Examples of Adequate and Limited responses are shown here Inadequate responses failed to provide correct information for either part of the question
Adequate Limited Inadequate Omitted
20 9 62 Rounds to zero NOTE Detail may not sum to totals because the percentage of responses rated as ldquoOff-taskrdquo is not shown Off-task responses are those that do not provide any information related to the assessment taskSOURCE US Department of Education Institute of Education Sciences National Center for Education Statistics National Assessment of Educational Progress (NAEP) 2008 Arts Assess-ment
Percentage of students in each response category at grade 8 2008
1
2
What does the symbol in circle 1 tell the performer to do
What is the musical (Italian) name for the symbol in circle 1
This sample response was rated ldquoAdequaterdquo because it provided the symbolrsquos meaning (that the music should be performed softly) and the symbolrsquos correct name (piano) Twenty percent of eighth-graders received a rating of ldquoAdequaterdquo on this question
This sample response was rated ldquoLimitedrdquo because it provided the symbolrsquos meaning but not its correct name (Pianissimo refers to the symbol pp which indicates that music should be performed very softly) Nine percent of studentsrsquo responses to this question were rated ldquoLimitedrdquo
What does the symbol in circle 1 tell the performer to do
What is the musical (Italian) name for the symbol in circle 1
16 THE NATIONrsquoS REPORT CARD
D
At the beginning of the piece a solo is played on
a flute
an oboe
a saxophone
a clarinet
A
B
C
DDDDDDDDD
SAMPLE QUESTION Identifying the Sound of an Instrument The sample question below asked students to identify the sound of an instrument The music played for this question comes from the opening of ldquoRhapsody in Bluerdquo by American composer George Gershwin The audio is available in the NAEP Questions Tool at httpncesedgov nationsreportcarditmrls
In 2008 fifty percent of eighth-graders correctly identified the clarinet as the instrument on which the solo was played (choice D) This was not found to be significantly different from the 52 percent who answered correctly in 1997 Choices A B and C are also woodwind instruments like the clarinet but were not the instrument on which the solo at the beginning of the piece was played
Choice A Choice B Choice C Choice D Omitted
12 15 22 50 Rounds to zero NOTE Detail may not sum to totals because of rounding SOURCE US Department of Education Institute of Education Sciences National Center for Education Statistics National Assessment of Educational Progress (NAEP) 2008 Arts Assessshyment
Percentage of students in each response category at grade 8 2008
17ARTS 2008
D
D
SAMPLE QUESTION Identifying Origin of a Musical Style The two-part sample question below asked students to identify music from a particular culture and to describe the features that help to characterize its style The music played for this question came from an African song entitled ldquoDrodoperdquo The audio is available in the NAEP Questions Tool at httpncesedgovnationsreportcarditmrls
Student responses for this two-part question were rated using four scoring levels Developed Adequate Limited and Inadequate Examples of Developed and Adequate responses are shown here Responses rated as Limited only provided a correct response to the first part of the question Responses rated as Inadequate failed to provide a correct response for either part of the question
This sample response was rated ldquoDevelopedrdquo because it both indicated the correct region of origin of the music and cited the ldquocall and responserdquo feature of the music that is common among many types of African songs Mentioning the use of specific percussion instruments such as drums also contributed to this response receiving a rating of ldquoDevelopedrdquo Fifty-two percent of eighth-graders received a rating of ldquoDevelopedrdquo on this question
From where does the music come
North America
South America
Asia
Africa
Other than the language used in the song describe one feature of the music that helps to identify it as coming from the part of the world you selected Be specific in your description
A
B
C
DDDDDDDDDDDDDDDDDD
From where does the music come
North America
South America
Asia
Africa
Other than the language used in the song describe one feature of the music that helps to identify it as coming from the part of the world you selected Be specific in your description
A
B
C
This sample response was rated ldquoAdequaterdquo Although it indicated the correct region of origin of the music the description of a feature of the music was vague Twenty-four percent of studentsrsquo responses to this question were rated ldquoAdequaterdquo
DDDDDDDDDDDDDDDDDDDDDDDDDDDD
Percentage of students in each response category at grade 8 2008
Developed Adequate Limited Inadequate Omitted
52 24 19 5 Rounds to zero NOTE Detail may not sum to totals because the percentage of responses rated as ldquoOff-taskrdquo is not shown Off-task responses are those that do not provide any information related to the assessment task SOURCE US Department of Education Institute of Education Sciences National Center for Education Statistics National Assessment of Educational Progress (NAEP) 2008 Arts Assessshyment
18 THE NATIONrsquoS REPORT CARD
19ARTS 2008
The 2008 arts assessment included four sections in visual arts that measured studentsrsquo ability to respond to and create visual art Students were given two of the four sections each of which contained between 7 and 11 multiple-choice and constructed-response questions Many of the visual arts questions in the assessment contained multiple parts The amount of time provided for students to complete two visual arts sections ranged from 75 minutes to 104 minutes
Responding questions asked students to analyze and describe works of art and design thereby demonstrating their knowledge of media and techniques visual organization the cultural contexts of artworks how works of art convey meaning and the relationship between form and function in design Creating questions assessed studentsrsquo ability to communicate in works of art think of different solutions to visual problems and generate ideas for and then create works of art and design These creating questions represented approximately one-half of the total assessment time in visual arts Some examples of the different types of visual arts questions are presented later in this section
20 THE NATIONrsquoS REPORT CARD
Eighty-nine-point score gap between lowest- and highest- performing students in visual arts The overall average responding score for visual arts was set at 150 in 2008 (figure 7) In addition to the overall average responding score results are shown for students at selected percentiles on the responding scale There was an 89-point gap between the scores for students at the 10th and 90th percentiles
The assessment also included questions that asked students to create works of art and design Results for these questions are presented as the average creating task score which is expressed as the average percentage of the maximum possible score ranging from 0 to 100 (see the Technical Notes for an explanation of how the score was calculated) In 2008 the overall average creating task score for grade 8 students was 52 (fi gure 8)
Responding and creating results related Because the NAEP arts framework describes the integration among the arts processes it is useful to explore the relationship between studentsrsquo results on the responding and creating questions in visual arts On average students who performed well on the responding questions also performed well on the creating questions (figure 9) For example students performing above the 75th percentile on the responding scale also had the highest average creating task score (62) Lower-performing students at or below the 25th percentile on the responding scale had the lowest average creating task score (40)
Figure 7 Average responding scale score and percentile scores in NAEP visual arts at grade 8 2008
150
104
174
300 200
190
180
170
160
150
140
130
120
110
Scale score
193
152
128
Overall 10th 25th 50th 75th 90th average score Percentile score
100
0
Figure 8 Average creating task score in NAEP visual arts at grade 8 2008
Overall 52
0 10 20 30 40 50 60 70 80 90 100
Percent of maximum score
Figure 9 Average creating task score in NAEP visual arts at grade 8 by responding score level 2008
Responding score level
Lower (lt 25th percentile)
Lower-middle (25thndash50th percentiles)
Upper-middle (50thndash75th percentiles)
Upper (gt 75th percentile)
Average creating task score
50
40
62
55
0 10 20 30 40 50 60 70 80 90 100
Percent of maximum score
SOURCE US Department of Education Institute of Education Sciences National Center for Education Statisshytics National Assessment of Educational Progress (NAEP) 2008 Arts Assessment
21ARTS 2008
Race ethnicity
54
55
46
43
49
Black
Hispanic
AsianPacific Islander
Male
White
Gender
Eligibility for free
reduced-price school lunch
54
55
46 Eligible
Not eligible
Female
Patterns in score gaps by student characteristics similar for responding to and creating visual arts
In general patterns in score differences based on student characteristics were similar for results in both responding (fi gure 10) and creating (fi gure 11)
130
120
110
RaceEthnicity In 2008 average responding scores in visual arts were 22 to 31 points higher for White and AsianPacifi c Islander students than for Black and Hispanic students There were no signifi cant differences between the average responding scores of White and AsianPacific Islander students or between the scores of Black and Hispanic students
Similarly the average creating task scores of White and AsianPacific Islander students were higher than the scores of Black and Hispanic students but there were no significant differences between the scores of White and AsianPacific Islander students or between the scores of Black and Hispanic students
Gender On average female eighth-graders had a higher responding score in visual arts than their male counterparts There was an 11-point3 gap between the two groups in 2008 The average creating task score for female students was also 5 points higher than the score for male students
Eligibility for FreeReduced-Price School Lunch On average eighth-graders who were eligible for free reduced-price school lunch had a lower responding score in visual arts than those who were not eligible There was a 29-point gap between the two groups in 2008 Students who were eligible also had an average creating task score that was 9 points lower than the score for students who were not eligible
3 The score-point gap is based on the difference between the unrounded scores as opposed to the rounded scores shown in the fi gure
Figure 10 Average responding scale score in NAEP visual arts at
200
190
180
170
160
150
140
Raceethnicity
160
129 134
156
Gender
145
155
300 Scale score
Eligibility for freereduced-price
school lunch
132
161
grade 8 by selected student characteristics 2008
0 White Black Hispanic Asian Male Female Eligible Not
Pacific eligible Islander
Figure 11 Average creating task score in NAEP visual arts at grade 8 by selected student characteristics 2008
0 10 20 30 40 50 60 70 80 90 100
Percent of maximum score
NOTE Black includes African American Hispanic includes Latino and Pacifi c Islander includes Native Hawaiian Race categories exclude Hispanic origin Sample sizes were insufshyficient to permit reliable estimates for students whose raceethnicity was American Indian Alaska Native or unclassified For the eligibility for freereduced-price school lunch category results are not shown for students whose eligibility status was not available SOURCE US Department of Education Institute of Education Sciences National Center for Education Statistics National Assessment of Educational Progress (NAEP) 2008 Arts Assessment
22 THE NATIONrsquoS REPORT CARD
No signifi cant difference in responding scores between public and private school students
While the general patterns in results for responding not all the apparent differences were found to be to and creating visual arts by selected school statistically signifi cant characteristics were similar (fi gures 12 and 13)
Type of School The apparent difference in 2008 between the average responding scores in visual arts for eighth-graders in public and private schools was not found to be statistically significant However the average creating task score was lower for public school students than for private school students
School Location Students attending suburban schools in 2008 had a higher average responding score in visual arts than students in city schools There were no significant differences in the average responding scores between students from suburban schools and town or rural schools
In the creating process of visual arts students attending suburban schools had a higher average creating task score than students in both city and town schools The average creating task score of students in suburban schools was not signifi cantly different from the score of students in rural schools
Because responding results are presented as scale scores and creating results are presented as average percentages it is not possible to compare the magnitude of differences between these scores For example an 11-point difference on the 0ndash300 responding scale between students attending schools in city and suburban locations is not necessarily greater than a 5-point difference between the same two groups on the 0ndash100 creating task scale
Figure 12 Average responding scale score in NAEP visual arts at grade 8 by selected school characteristics 2008
140
130
120
110
0 Public Private
200
190
180
170
160
150
City Suburb Town Rural
School location
144
155 149 151
Type of school
149
159
300 Scale score
Figure 13 Average creating task score in NAEP visual arts at
City
Suburb
Town
Rural
School location
52
49
50
54
Public
Private
Type of school 60
51
grade 8 by selected school characteristics 2008
0 10 20 30 40 50 60 70 80 90 100
Percent of maximum score
SOURCE US Department of Education Institute of Education Sciences National Center for Education Statistics National Assessment of Educational Progress (NAEP) 2008 Arts Assessment
23ARTS 2008
Context for Arts Education in Visual Arts To provide the context in which arts learning takes and nature of visual arts education in their schools place results are presented here based on school and studentsrsquo responses about their participation in administratorsrsquo responses related to the availability visual arts activities
Frequency of visual arts instruction remains steady School administrators were asked how often eighth-graders attending their schools might receive instruction in visual arts Forty-seven percent of eighth-graders attended schools where students could possibly receive visual arts instruction at least three or four times a week in 2008 (fi gure 14) This was higher than the percentages of students attending schools where visual arts were offered less frequently or not at all
Although the data are not shown here access to visual arts instruction did not differ significantly by race ethnicity gender or eligibility for freereduced-price school lunch For example the percentage of students who were eligible for freereduced-price school lunch attending schools where visual arts were offered once or twice a week was not significantly different from the percentage of students who were not eligible
The same question was asked of school administrators in 1997 making it possible to look for changes in the instruction patterns over time The results showed no significant changes between 1997 and 2008 in the percentages of students who attended schools where visual arts were available at least three or four times a week once or twice a week less than once a week or not at all
Figure 14 Percentage of students at grade 8 by school-reported frequency with which instruction in visual arts is available 1997 and 2008
1997
2008 47
52At least 3 or 4 times a week
30
25Once or twice
a week
5
10
Less than once a week
17
14
Subject not offered
0 10 20 30 40 50 60 70 80 90 100
Percent
NOTE Detail may not sum to totals because of rounding SOURCE US Department of Education Institute of Education Sciences National Center for Education Statistics National Assessment of Educational Progress (NAEP) 1997 and 2008 Arts Assessments
77 percent of eighth-graders attended schools where administrators reported that visual arts were taught by a full-time specialist
69 percent of students attended schools that followed a state or district curriculum in visual arts
24 THE NATIONrsquoS REPORT CARD
More students writing about their artwork
Students responded to a series of questions about how often they did certain activities in visual arts class For each activity listed in figure 15 students indicated if their teacher had them do it every day once a week once a month or never or hardly ever The results summarized here show the combined percentages for students who reported that they did various art-related activities at least once a month
The percentage of students who reported that their teacher had them write about their artwork increased from 21 percent in 1997 to 27 percent in 2008 However the percentage of students whose teacher had them choose their own art project decreased from 47 percent in 1997 to 39 percent in 2008 There were no significant changes between 1997 and 2008 in the percentages of students who reported that their teachers had them paint or draw make things out of clay or other materials work in a pair or group on an art project talk with others about their own or othersrsquo artwork or look at videotapes filmstrips slides or television programs about art
Fewer students visit art museums with class in 2008 Exposure to art museums and exhibits outside of school may help students learn about and engage in visual arts Sixteen percent of students in 2008 reported that they had gone with their class to an art museum gallery or exhibit at least once in the last year which was smaller than the 22 percent in 1997 (fi gure 16)
Although not presented here graphically 54 percent of eighth-graders reported that they or their teacher saved their artwork in a portfolio in 2008 which was not signifi cantly different from the 50 percent in 1997
About half of students save artwork in a portfolio
Figure 15 Percentage of students at grade 8 by student-reported in-school activities their teachers have them do in art at least once a month 1997 and 2008
45
43
21
27
50
43
39
47
41
38
80
80
53
40
Paint or draw
Make things out of clay or
other materials
Choose own art project
Work in a pair or a group on an
art project
Talk with others about own artwork or
that of other students
Write about own artwork
Look at videotapes filmstrips slides
or television programs about art
1997
2008
0 10 20 30 40 50 60 70 80 90 100
Percent
Significantly different (p lt 05) from 2008
Figure 16 Percentage of students at grade 8 who reported visiting an art museum gallery or exhibit with their class at least once a year 1997 and 2008
1997
2008 16
22
0 10 20 30 40 50 60 70 80 90 100
Percent
Significantly different (p lt 05) from 2008 SOURCE US Department of Education Institute of Education Sciences National Center for Education Statistics National Assessment of Educational Progress (NAEP) 1997 and 2008 Arts Assessments
25ARTS 2008
What Eighth-Graders Know and Can Do in Visual Arts The item map below is useful for understanding studentsrsquo performance at different points on the responding scale The scale scores on the left represent the average scores for students who were likely to get the questions correct or partially correct Scores for the 25th and 75th percentiles are also noted The descriptions of selected assessment questions are listed on the right
For example the map shows that higher-performing eighth-graders in the upper range of the scale with an average score of 237 were likely to be able
Grade 8 NAEP Visual Arts Responding Item Map Scale score Question description
to identify the style of an artwork as surrealism Middle-performing students with an average score of 144 were likely to be able to analyze the subject of five motherchild portraits of different genres
Constructed-response questions for which students could earn partial credit may appear on the map multiple times once for each level of credit For example a question asking students to describe two characteristics of charcoal in a self-portrait appears at the score of 201 for responses receiving full credit and at 134 for responses receiving partial credit
300
285 Support plausible interpretation of Schiele self-portrait with observations about style line and color 280 Explain how an unusualunexpected feature of a Bearden collage contributes to the work as a whole 256 Analyze and support with references to the work the narrative conveyed by a Bearden collage 241 Describe at least three aspects of own self-portrait that communicate something about you 240 Explain materials and design of own package idea for transporting fi sh on bicycle 237 Identify the style of an artwork as surrealism 229 Label and specifi cally describe one or two features of a Bearden collage that the artist wants you to notice 224 Identify a technical similarity between Schiele and Kollwitz self-portraits (page 28) 221 Explain how artist used light and shadow to create realism in motherchild portrait 220 Explain three ways an artist made some things look near and some far in motherchild portrait 213 Support plausible interpretation of Schiele self-portrait with observations about style line or color 205 Explain how Bearden creates contrast between interior and exterior areas in collage 202 Describe two aspects of own self-portrait that communicate something about you 201 Describe two characteristics of charcoal in Kollwitz self-portrait (page 29) 197 Identify an example of Renaissance art 197 Identify compositional emphasis in a Bearden collage 189 Identify an example of 20th century western art 176 Compare in specifi c terms how Kollwitz has drawn different parts of her self-portrait and offer plausible
interpretation for differences (pages 30 and 31) 176 Explain where artist has used light and shadow to create realism in motherchild portrait
172 Describe and support how memory of place is shown in own collage 170 Explain how artist used light to create a lack of realism in motherchild portrait 144 Analyze subject of fi ve motherchild portraits of different genres 136 Describe one aspect of own self-portrait that communicates something about you 134 Describe one characteristic of charcoal in Kollwitz self-portrait (page 29)
128 Identify an unusualunexpected feature of the Bearden collage 62 Describe memory of place andor aspect(s) of own collage 61 Describe what Schiele self-portrait is communicating or describe an aspect of style line or color
0
174 75th percentile
128 25th percentile
NOTE Regular type denotes a constructed-response question Italic type denotes a multiple-choice question The position of a question on the scale represents the average scale score attained by students who had a 65 percent probability of obtaining credit at a specific level of a constructed-response question or a 74 percent probability of correctly answering a four-option multiple-choice question SOURCE US Department of Education Institute of Education Sciences National Center for Education Statistics National Assessment of Educational Progress (NAEP) 2008 Arts Assessment
26 THE NATIONrsquoS REPORT CARD
Self-portrait B Egon Schiele Crayon and watercolor on buff paper Galerie St Etienne
Self-portrait A Kathe Kollwitz Charcoal on brown laid paper National Gallery of Art
Sample Questions for Visual Arts Students were asked a series of questions related to two self-portraits shown here one by Kathe Kollwitz (A) and one by Egon Schiele (B) These questions required students to apply their knowledge of aesthetic properties to the two artworks and to consider the relationships between these properties and the expressive qualities of each work Students were then asked to create a self-portrait of their own
27ARTS 2008
B
SAMPLE QUESTION Recognizing a Technical Similarity Between Two Self-Portraits
The sample question below asked students to recognize a technical similarity between the Kollwitz and Schiele self-portraits In both works
In 2008 thirty-seven percent of students correctly identified this common feature of the two artworks (choice B) This was not found to be significantly
expressive loose lines are combined with precise different from the 36 percent who answered drawing correctly in 1997 Choices A C and D do not
accurately describe technical similarities between the two works
Which statement describes a technical similarity between self-portraits A and B
The figure in each work is seen from the same point of view
Both works combine loose gestural lines with careful drawing
The compositions in both works are symmetrical
Both works rely on light and shadow to emphasize depth
A
C
D
BBBBBBBBBBBBBBBBBBBBBBBB
Choice A Choice B Choice C Choice D Omitted
8 37 8 46
Percentage of students in each response category at grade 8 2008
Rounds to zero NOTE Detail may not sum to totals because of rounding SOURCE US Department of Education Institute of Education Sciences National Center for Education Statistics National Assessment of Educational Progress (NAEP) 2008 Arts Assessshyment
28 THE NATIONrsquoS REPORT CARD
SAMPLE QUESTION Characteristics of Charcoal The sample question below asked students to Unacceptable Examples of Acceptable and Partial describe characteristics of the medium of charcoal responses are shown here Responses rated as visible in the Kollwitz self-portrait Student Unacceptable did not describe characteristics of the responses for this question were rated using medium of charcoal evident in the self-portrait three scoring levels Acceptable Partial and
This sample response was rated ldquoAcceptablerdquo because it demonstrated the studentrsquos knowledge of charcoal as a medium The student expressed what Kollwitz was able to accomplish with charcoal in her self-portrait Thirty-four percent of eighth-graders received a rating of ldquoAcceptablerdquo on this question
Self-portrait A is a charcoal drawing Describe two characteristics of charcoal that you see in self-portrait A
1
2
Acceptable Partial Unacceptable Omitted
34 38 27 1 NOTE Detail may not sum to totals because the percentage of responses rated as ldquoOff-taskrdquo is not shown Off-task responses are those that do not provide any information related to the assessment task SOURCE US Department of Education Institute of Education Sciences National Center for Education Statistics National Assessment of Educational Progress (NAEP) 2008 Arts Assessshyment
Percentage of students in each response category at grade 8 2008
This sample response was rated ldquoPartialrdquo because it provided only one example of how charcoal was used in the self-portrait The student recognized that pressing harder on charcoal results in a darker mark as is evident in the Kollwitz self-portrait However the second part of the response did not describe another characteristic of charcoal as a medium Thirty-eight percent of studentsrsquo responses to this question were rated ldquoPartialrdquo
Self-portrait A is a charcoal drawing Describe two characteristics of charcoal that you see in self-portrait A
1
2
29ARTS 2008
a s
SAMPLE QUESTION Relationship Between Technical Approach and Meaning
Both parts of this sample response were rated ldquoAcceptablerdquo This response accurately described the differences between the parts of the drawing and then used thesss eeee oooo bbbbsssseeeeerrrr vvvvvaaaattttiiiiii oooooo nnnnnnnsssssss tttttt ooooooo ooooooooffffffffffffffffeeeeeeeerrrrrr aaaaaaaannnnnnnn iiiiiiiinnnnnnnnssssssssiiiiiiiigggggggghhhhhhhhttttttttffffffffuuuuuuuullllllll andddd pllausible interpretation of the reasons for those differences
Fifty-three percent of students received a rating of ldquoAcceptablerdquo for part A and 19 percent received an ldquoAcceptablerdquo rating for part B Students who received the ldquoAcceptablerdquo rating were able to both comprehend
pthe formal characteristics of the self-portrait and discuss the relationship between those characteristics and the artistrsquos possible expressive goals
Look at self-portrait A Compare how Kollwitz has drawn her head and hand with the way she has drawn her arm Be specific
A
Explain what you think Kollwitz may have been trying to communicate about herself by drawing these different parts of her self-portrait in different ways
B
THE NATIONrsquoS REPORT CARD
The two-part sample question below required students to analyze and interpret the Kollwitz self-portrait to explore relationships between technical approach and meaning Part A of the question asked students about the workrsquos formal characteristics while part B asked them to connect those characteristics with what the artist was attempting to communicate Student responses
to each of the two parts were rated separately using three scoring levels Acceptable Partial and Unacceptable Examples of Acceptable and Partial student responses for each part of this question are shown here Unacceptable responses for the question neither addressed differences in the way the parts of the self-portrait are drawn nor offered interpretations linked to observations
30
Both parts of this sample response received a ldquoPartialrdquo rating This response accurately described the way the arm is drawn but did not specifi cally address the ways in which the head and hand are drawn differently from the arm ldquoPartialrdquo credit was given for recognizing some characteristics of the artwork While a few plausible interpretations about what Kollwitz was trying to communicate are provided in the second part of the response none of these is clearly linked to the descriptions offered in the fi rst part
Look at self-portrait A Compare how Kollwitz has drawn her head and hand with the way she has drawn her arm Be specifi c
A
Explain what you think Kollwitz may have been trying to communicate about herself by drawing these different parts of her self-portrait in different ways
Fifteen percent of the student responses were rated B ldquoPartialrdquo for part A and 52 percent were rated ldquoPartialrdquo for part B
Percentage of students in each response category at grade 8 2008
Part A Part B
Acceptable Partial Unacceptable Omitted
53 15 31 2
Acceptable Partial Unacceptable Omitted
19 52 25 3
NOTE Detail may not sum to totals because the percentage of responses rated as ldquoOff-taskrdquo is not shown Off-task responses are those that do not provide any information related to the assessment task SOURCE US Department of Education Institute of Education Sciences National Center for Education Statistics National Assessment of Educational Progress (NAEP) 2008 Arts Assessment
31ARTS 2008
t t t t
a t
t t
s c
t
ldquoldquo
SAMPLE QUESTION Creating a Self-Portrait After students had observed the Kollwitz and Schiele self-portraits and studied relationships between the technical and expressive qualities of the two artworks they were asked to create a self-portrait of their own Students were given a set of
a mirror and a sheet of 12-inch by 18-inch white drawing paper and were asked to use these tools to create a self-portrait that would express something important about their personalities These self-portraits were rated using four scoring levels
12 Cray-pas (colored oil pastels) a charcoal pencil Sufficient Uneven Minimal and Insufficient
ChChCharararracacacteteteririristststicicic ooofff wowoworkrkksss rararateteteddd ldquoSldquoSSufufu ficficccieieientntntrdquordquordquo bbbototothhh ofoffo ttt hehehe stststudududu enenenen tststsrsquorsquorsquo rererere spspspoononon seseesessss prprpp essesenenene teteteddd heheherererr sssshohohowewew ddd clclc eaeaeae rr ananandddd spspspp ecifiifififi cccc obobobseseservrvrvatatatioioionsnsns ttthahahaa tt cococommmmmm unununiciccatatatededed sssomomommetetethihihi ngngg immmm poop rtrtrtananan ttt ababbouououo ttt ththth eeee ararartitit stststs ThThThTh eyeyy iiincncncn ororo popoorararaa teteteedddd ididdeenentititit fyfyfyininingg dedede tata ilii iinn tetett rmrmrm ss ofofoff pppererrersososos nananana ll fefefeeatata ururu eses aandndd ininn sstutuudededentntt rerere spsppppononon seseee 11 ananann aaa ctctivivi itiityyy (a(a(artrtt mmm akaka inining)g)g) ThThheee seses lflfflflf -p-p-pororortrtrtrt aiaiaitststss shshshowowowow edeeded pppururu popoposeses efufuffu lll usussu eee ofofof cccommompopoosisis tititt ononon alal eeelelemememme ntntntsss anann ddddd sososososso phphphphphp isssisstitttiticacacacateteteedddd usussuseee ofofof mmm atataterereriaiaiaalssl FoFoFo rr exexexe amamamm plplplpleee iinnn ststststudududeneneenttt rerereespspspp onononnsesese 111 hthththh eee smsmms udududu gigigigg ngngngn g ooofff CrCrCrCr ayayayy-p-p-pasasas cccrerereatatatatededed anananan aaaaffiffiffiffininininitytyty aaamomomoo ngngng tttt hehehehee hhhheaeaeaaee ddddd aaa rmrmrm ananana ddd hahahandndnddn ananana ddd lolooolo oosoososeee wewewewe lllll-p-p-p-pp lalalaacececece dddd lililiinenenenesssss adadadadd dedededdeddddd dededed fifinfinnfinitititioioionnn tototoo ttthehehee bbbb ododododo yyy
Percentage of students in each response category at grade 8 2008
BoBoBoBBothththth wwworororoorksksksk aaaaalslslslsooo shshhs howwowowedeede vvvererere yyyyy gogogoododod uuu sesese ooofff prprpropopo ororortititionnno n cocococoo lololorrr aaaaandndnd lll inininn eeee aaandndndd wwwererer eee fuufullllllyyy dededevevev lololopepep dd anananndd nininindididid vivividududualalalizizizizi ededededded FoFoFoF rrr exexexxamamamamplpleee iiinnn stststududdenene n ttt rerere spspps onononn seseee 222222 thhhhhhthhththhhhth e stststs udududd enenenntt skskkk liliii lfflflflf ululullylyly uuuseseseseedddd cocococo lolorrr tototo eempmpmmp hahhah sisisizezez aaa ndndndndn cccrerere atatat eeeeeee cococo ntntnttrarraaststs bbbetetetwewewewe eenenn sssspepepppecicicificficficfic pppp araara tstst s ooff heherrr seseselflfl -p-pp ororor trtrtraiaiaittt BoBoBoBothththh sss tututudededed nntntn rrresesespopoo nsnsnsn eses 11 aaandndndnd 222 aalslslsooo shsshshowowededed eeevivivvvidededeencnccccncncncccc e ofoffof ttttheheehh sss tututudededed ntntntntsss hahahah vivivingngng ssspepeepentntntnt tttimimimeee obobob seseservrvinini gggg thththeee KoKoKolllll wwiwwww tz anana ddd ScScScSchihihielele ee seses lflflf-p-p-porororortrtrrtrraiaiaitststs FoFoFoFooururr pppererercececentntnt ooo fff stststudududenenntstststsrsquorsquorsquorsquo sssesss lfshypopopoortrtrt rararaaitititsss wewewererere rrratatatededed ldquoldquoSuSuSuu ffiffifficicciennee ttrdquordquordquo
1
2
Sufficient Uneven Minimal Insufficient Omitted
4 25 57 14 Rounds to zero NOTE Detail may not sum to totals because the percentage of responses rated as ldquoOff-taskrdquo is not shown Off-task responses are those that do not provide any information related to the assessment task SOURCE US Department of Education Institute of Education Sciences National Center for Education Statistics National Assessment of Educational Progress (NAEP) 2008 Arts Assessshyment
32 THE NATIONrsquoS REPORT CARD
Works at the ldquoUnevenrdquo level made some specific observations They sometimes employed pertinent compositional elements gave attention to details such as facial features to convey expression andor effectively used materials to communicate However ldquoUnevenrdquo works were typically inconsistent or incomplete in parts
In the sample presented here the student gave her work individuality by vivid use of color facial expression and the symbols incorporated in her jewelry and the background However elements of her work seem inconsistent and lacking in deliberation such as the placement and rendering of the symbols and colors in the background Twenty-five percent of studentsrsquo self-portraits were rated ldquoUnevenrdquo
As with many works rated at the ldquoMinimalrdquo level in the sample self-portrait shown here efforts at specific observations were apparent but relatively minimal (the red lines in the eyes) Compositional successes may seem more accidental than deliberate and use of materials was unskilled For example while this student may have been attempting to convey some sense of an individual person by emphasizing only his eyes and mouth with color he lacked the skill to make this choice distinctive enough to convey his message Fifty-seven percent of studentsrsquo self-portraits were rated ldquoMinimalrdquo
Most self-portraits rated ldquoInsufficientrdquo were generally so schematic as to convey little or nothing about the student Like the sample self-portrait shown here they showed unspecific observation little awareness of composition and highly unskilled use of materials In contrast to the ldquoMinimalrdquo response there were no features in this self-portrait that conveyed anything specific about a person and it remained at a general level Fourteen percent of studentsrsquo self-portraits were rated ldquoInsufficientrdquo
33ARTS 2008
Sampling and Weighting The schools and students who participate in NAEP assessments are selected to form a representative sample of the nation The national sample of eighth-graders in the 2008 arts assessment was chosen using a multistage design that involved drawing students from the sampled public and private schools across the country The results from the assessed students were combined to provide accurate estimates of the overall performance of students in the nation
Each school that participated in the assessment and each student assessed represents a portion of the population of interest Results are weighted to make appropriate inferences between the student samples and the respective populations from which they are drawn Sampling weights are adjusted for the disproportionate representation of some groups in the selected sample This includes the oversampling of schools with high concentrations of students from certain racialethnic groups and the lower sampling rates of students who attend very small schools
School and Student Participation Rates The school and student participation rates for public and private schools in the 2008 arts assessment are provided in table A-1
NCES statistical standards require that a nonresponse bias analysis be conducted for any school or student group with a participation rate that falls below 85 percent The participation rates for the 2008 NAEP arts assessment indicated a need for a school nonresponse bias analysis for the private school sample The results showed that school substitution and nonresponse adjustments were not effective in reducing nonresponse bias for the percentage of Hispanic students enrolled and type of private schools (Catholic and other private schools) The disproportionate nonresponse resulted
in an overestimation of the percentage of Hispanic students an overestimation of the percentage of Catholic school students and an underestimation of the percentage of other private school students
Table A-1 School and student participation rates in NAEP arts at grade 8 by subject and type of school 2008
Subject and type of school
Music
Nation
Public
Private
Visual arts
Nation
Public
Private
School participation Student participation
Number of Number of schools Weighted students Weighted
participating percent assessed percent
260 97 4000 93
220 99 3400 93
30 76 500 97
260 97 3900 92
220 99 3400 92
30 76 500 94
NOTE The numbers of schools are rounded to the nearest ten and the numbers of students are rounded to the nearest hundred Detail may not sum to totals because of rounding SOURCE US Department of Education Institute of Education Sciences National Center for Education Statistics National Assessment of Educational Progress (NAEP) 2008 Arts Assessment
Interpreting Statistical Signifi cance Comparisons over time or between groups in this report are based on statistical significance at the 05 level using t-tests with appropriate adjustments for multiple comparisons (using the False Discovery Rate procedure) These statistical tests consider both the size of the differences and standard errors of the two statistics being compared Standard errors are margins of error and estimates based on smaller groups are likely to have larger margins of error relative to estimates based on larger groups Note for example that differences based on schoolshyadministrator-reported estimates have smaller sample sizes than differences based on student-reported estimates resulting in smaller signifi cant differences in the student-reported data than in the
THE NATIONrsquoS REPORT CARD 34
school-administrator-reported data The size of the standard errors may also be influenced by other factors such as how representative the students assessed are of the entire population
When an estimate has a large standard error a numerical difference that seems large may not be statistically significant Differences of the same magnitude may or may not be statistically significant depending upon the size of the standard errors of the estimates For example a 10-point difference between male and female students may be statistically significant while a 10-point difference between students attending public and private schools may not be Standard errors for the estimates presented in this report are available at httpncesedgovnationsreportcardnaepdata and on the 2008 arts results website at http nationsreportcardgovarts_2008
National School Lunch Program NAEP collects data on student eligibility for the National School Lunch Program (NSLP) as an indicator of poverty Under the guidelines of NSLP children from families with incomes below 130 percent of the poverty level are eligible for free meals Those from families with incomes between 130 and 185 percent of the poverty level are eligible for reduced-price meals (For the period July 1 2007 through June 30 2008 for a family of four 130 percent of the poverty level was an annual income of $27000 and 185 percent was $38000) For more information on NSLP visit httpwww fnsusdagovcndlunch
School Location Results of the 2008 NAEP arts assessment were reported for four mutually exclusive categories of school location These categories are based on standard definitions established by the Federal Office of Management and Budget using population and geographic information from the US Census Bureau The classification system is referred to as ldquourban-centric locale codesrdquo which classifies territory into four major types
city suburb town and rural More details on the classification system can be found at httpnces edgovccdrural_localesasp
The Creating Task Score Studentsrsquo performance on questions assessing the creating process in visual arts is presented as the average creating task score in this report The creating task score for each creating question (task) is the sum of the percentage of students receiving full credit and a fraction of the percentage of students receiving partial credit The individual scores are then averaged together to report an average creating task score for the entire set of the visual arts creating questions
An example of computing the creating task score is provided below for a sample question in this report that asks eighth-graders to draw a self-portrait Responses to this question were scored ldquoSufficientrdquo ldquoUnevenrdquo ldquoMinimalrdquo or ldquoInsufficientrdquo The percentages of students falling into these four scoring levels are 4 percent 25 percent 57 percent and 14 percent respectively (table A-2) Responses at these four levels receive
1score weights of 1 23 and 0 respectively The
3creating task score for this question is computed as 1 (4) + 2 (25) + 1 (57) + 0 (14) = 403 3
Table A-2 Example showing how the creating task score was computed for a sample question in NAEP visual arts at grade 8 2008
Percentage Percentage of of students times
Scoring level students Score weight score weight
Sufficient 4 1 4
Uneven 25 2 3 17
Minimal 57 1 3 19
Insufficient 14 0 0
Creating task score (4 + 17 + 19 + 0) = 40
SOURCE US Department of Education Institute of Education Sciences National Center for Education Statistics National Assessment of Educational Progress (NAEP) 2008 Arts Assessment
ARTS 2008 3535
Comparing Results Between the 1997 and 2008 Assessments Although the assessment questions adminshyistered in 2008 were selected from those used in the 1997 assessment due to changes in scoring procedures and materials the 2008 score results in music and visual arts could not be directly compared to the results in 1997
In the 2008 arts assessment the scoring guides for constructed-response questions the sample questions and student responses used to train scorers and the standardized training procedures were updated to refl ect changes in training and scoring procedures that have been adapted for use across all NAEP assessments since 1997 In addition because the student artwork used as training samples for visual arts in 1997 had degraded over time and because of differences in the availability of certain types of art supplies and tools between 1997 and 2008 new samples were developed for scoring studentsrsquo responses to the creating questions in 2008
However since the scoring method for multiple-choice questions was the same in 1997 and 2008 direct comparisons could be made between the two years on results for these questions in music and visual arts (tables A-3 and A-4) Because multiple-choice questions were only a portion of the assessment and only assessed certain types of topics in the responding process of music and visual arts the changes in studentsrsquo performance between 1997 and 2008 on these questions did not represent the performance changes for the constructed-response questions or the entire assessment
Table A-3 Percentage correct for multiple-choice questions in NAEP music at grade 8 1997 and 2008
Percent correct
Question description 1997 2008
Overall 53 51
Identify directional contour of part of melodic phrase 79 77
Identify form of vocal music in a recording (musical excerpt 1) 78 76
Identify the type of instrumental ensemble performing an excerpt 75 71
Identify form of musical examples as theme and variations 64 64
Identify a bass clef symbol 63 62
Identify pitch contour of melody in a recording 63 56
Identify saxophone as instrument playing melody 66 56
Identify a half note in printed music 52 56
Identify a correct time signature for a piece of printed music 55 52
Select a line drawing refl ective of the texture of an example of music 52 52
Identify the solo instrument beginning ldquoRhapsody in Bluerdquo 52 50
Identify form of vocal music in a recording (musical excerpt 2) 60 49
Identify an appropriate texture drawing for a homophonic excerpt 51 48
Identify term best describing the texture 47 47
Identify an appropriate description of the texture of a recorded excerpt 50 44
Identify correct time signature for recorded excerpt 42 43
Identify the name of a pitch shown in the treble clef 42 41
Identify an octave interval in a printed score 37 38
Identify the term for fermata symbol 38 33
Identify which voices enter fi rst in a choral excerpt 32 28
Identify the quality of a triad in a printed score 15 21 Significantly different (p lt 05) from 2008 SOURCE US Department of Education Institute of Education Sciences National Center for Education Statistics National Assessment of Educational Progress (NAEP) 1997 and 2008 Arts Assessments
Table A-4 Percentage correct for multiple-choice questions in NAEP visual arts at grade 8 1997 and 2008
Percent correct
Question description 1997 2008
Overall 42 42
Identify purpose of insulating package material 61 62
Identify an example of 20th-century western art 55 59
Infer from photograph advantages of shrink-wrap packaging 57 57
Identify an example of a Renaissance painting 48 50
Identify compositional emphasis in a Bearden collage 49 46
Identify genre of a Bearden collage 34 37
Identify a technical similarity between Schiele and Kollwitz self-portraits 36 37
Identify an important compositional aspect of a Kollwitz self-portrait 40 37
Identify a stylistic emphasis in a Bearden collage 29 35
Identify a compositional feature of a medieval artwork 39 32
Identify the style of an artwork as surrealism 27 31
Identify an artistic style that infl uenced cubism 25 23 Significantly different (p lt 05) from 2008 SOURCE US Department of Education Institute of Education Sciences National Center for Education Statistics National Assessment of Educational Progress (NAEP) 1997 and 2008 Arts Assessments
THE NATIONrsquoS REPORT CARD 36
Table A-5 Percentage of students in NAEP arts assessment at grade 8 by selected student and school characteristics 2008
Student characteristics Music Visual arts
SD andor ELL
Identified 17 17
Excluded 2 2
Assessed 15 16
Without accommodations 6 6
With accommodations 8 10
SD
Identified 12 12
Excluded 1 2
Assessed 10 11
Without accommodations 3 2
With accommodations 7 8
ELL
Identified 6 6
Excluded 1 1
Assessed 5 6
Without accommodations 4 4
With accommodations 2 2 NOTE Students identified as both SD and ELL were counted only once under the combined SD andor ELL category but were counted separately under the SD and ELL categories Detail may not sum to totals because of rounding SOURCE US Department of Education Institute of Education Sciences National Center for Education Statistics National Assessment of Educational Progress (NAEP) 2008 Arts Assessment
Table A-6 Percentage of students with disabilities (SD) andor English language learners (ELL) identified excluded and assessed in NAEP music and visual arts at grade 8 as a percentage of all students 2008
NOTE Black includes African American Hispanic includes Latino and Pacific Islander includes Native Hawaiian Race categories exclude Hispanic origin Detail may not sum to totals because of rounding SOURCE US Department of Education Institute of Education Sciences National Center for Education Statistics National Assessment of Educational Progress (NAEP) 2008 Arts Assessment
Student and school characteristics Music Visual arts
Raceethnicity
White 61 61
Black 15 14
Hispanic 18 17
AsianPacific Islander 5 5
American IndianAlaska Native 1 2
Unclassified 1 1
Gender
Male 50 51
Female 50 49
Eligibility for freereduced-price school lunch
Eligible 36 37
Not eligible 57 56
Information not available 7 8
Type of school
Public 93 92
Private 7 8
School location
City 29 29
Suburb 37 36
Town 12 13
Rural 22 22
37ARTS 2008 37
u S d e p A r t M e n t o f e d u C A t i o n The National Assessment of Educational Progress (NAEP) is a congressionally authorized project sponsored by the US Department of Education The National Center for Education Statistics a department within the Institute of Education Sciences administers NAEP The Commissioner of Education Statistics is responsible by law for carrying out the NAEP project Arne Duncan John Easton Stuart Kerachsky Secretary Director Acting Commissioner US Department Institute of National Center for of Education Education Sciences Education Statistics
t h e n A t i o n A l A S S e S S M e n t g o V e r n i n g b o A r d In 1988 Congress created the National Assessment Governing Board to set policy for the National Assessment of Educational Progress commonly known as The Nations Report Card TM The Governing Board is an independent bipartisan group whose members include governors state legislators local and state school officials educators business representatives and members of the general public
Darvin M Winick Chair President Winick amp Associates Austin Texas
Amanda P Avallone Vice Chair Assistant Principal and Eighth-Grade Teacher
Summit Middle School Boulder Colorado
David J Alukonis Former Chairman Hudson School Board Hudson New Hampshire
Gregory Cizek Professor of Educational Measurement
University of North Carolina Chapel Hill North Carolina
Carol A DrsquoAmico President and Chief Executive Officer
Conexus Indiana Indianapolis Indiana
Honorable David P Driscoll Former Commissioner of Education
Massachusetts Department of Education
Malden Massachusetts
Louis M Fabrizio Director of Accountability Policy and Communications
North Carolina Department of Public Instruction
Raleigh North Carolina
Honorable Anitere Flores Member Florida House of Representatives Miami Florida
Alan J Friedman Consultant Museum Development and Science Communication
New York New York
David W Gordon County Superintendent of Schools Sacramento County Office of Education
Sacramento California
Robin C Hall Principal Beecher Hills Elementary School Atlanta Georgia
Kathi M King Twelfth-Grade Teacher Messalonskee High School Oakland Maine
Kim Kozbial-Hess Educational Technology Trainer Hawkins Elementary School Toledo Ohio
Henry Kranendonk Mathematics Curriculum Specialist Milwaukee Public Schools Milwaukee Wisconsin
James S Lanich President California Business for Education Excellence
Sacramento California
Honorable Cynthia L Nava Senator New Mexico State Senate Las Cruces New Mexico
Honorable Steven L Paine State Superintendent of Schools West Virginia Department of Education
Charleston West Virginia
Honorable Sonny Perdue Governor of Georgia Atlanta Georgia
Susan Pimentel Educational Consultant Hanover New Hampshire
Andrew C Porter Dean Graduate School of Education University of Pennsylvania Philadelphia Pennsylvania
Warren T Smith Sr Vice President Washington State Board of Education
Olympia Washington
Mary Frances Taymans SND Executive Director Secondary Schools Department National Catholic Educational Association
Washington DC
Oscar A Troncoso Principal Anthony High School Anthony Texas
Eileen L Weiser General Public Representative Ann Arbor Michigan
John Easton (Ex officio) Director Institute of Education Sciences US Department of Education Washington DC
Mary Crovo Interim Executive Director National Assessment Governing Board
Washington DC
t h e n a t i o n rsquo s r e p o r t c a r d
A r t s 2 0 0 8
M u s i c amp V i s u a l A r t s June 2009
M o r e i n f o r M A t i o n The report release site is httpnationsreportcardgov The NCES web electronic catalog is httpncesedgov pubsearch
For ordering information write to US Department of Education ED Pubs PO Box 1398 Jessup MD 20794-1398
or call toll free 1-877-4ED-Pubs
or order online at httpwwwedpubs org
S u g g e S t e d C i t A t i o n Keiper S Sandene BA Persky HR and Kuang M (2009) The Nationrsquos Report Card Arts 2008 Music amp Visual Arts (NCES 2009ndash488) National Center for Education Statistics Institute of Education Sciences US Department of Education Washington DC
C o n t A C t Emmanuel Sikali 202-502-7419 emmanuelsikaliedgov
ldquo t h e d e p A r t M e n t o f e d u C A t i o n rsquo S M i S S i o n i S t o p r o M o t e S t u d e n t A C h i e V e M e n t A n d p r e p A r A t i o n f o r g l o b A l C o M p e t i t i V e n e S S b y f o S t e r i n g e d u C A t i o n A l e x C e l l e n C e A n d e n S u r i n g e q u A l A C C e S S rdquo
wwwedgov
- Contents
- Executive Summary
- Introduction
- Music
-
- Eighty-nine-point score gap between lowest- and highest-performing students in music
- Racialethnic gender and socioeconomic gaps in music scores
- Music scores vary by type and location of schools
- Context for Arts Education in Music
- What Eighth-Graders Know and Can Do in Music
- Sample Questions for Music
-
- Visual Arts
-
- Eighty-nine-point score gap between lowest- and highest-performing students in visual arts
- Responding and creating results related
- Patterns in score gaps by student characteristics similar for responding to and creating visual arts
- No significant difference in responding scores between public and private school students
- Context for Arts Education in Visual Arts
- What Eighth-Graders Know and Can Do in Visual Arts
- Sample Questions for Visual Arts
-
- Technical Notes and Data Appendix13
- More Information
-

This report presents the results of the 2008 National Assessment of Educational Progress (NAEP) in the arts which was given to a nationally representative sample of 7900 eighth-grade public and private school students Approximately one-half of these students were assessed in music and the other half were assessed in visual arts
This report presents the results of the 2008 National Assessment of Educational Progress (NAEP) in the arts which was given to a nationally representative sample of 7900 eighth-grade public and private school students Approximately one-half of these students were assessed in music and the other half were assessed in visual arts
The MUSIC portion of the assessment measured studentsrsquo ability to respond to music in various ways Students were asked to analyze and describe aspects of music they heard critique instrumental and vocal performances and demonstrate their knowledge of standard musical notation and musicrsquos role in society One question for example asked students to identify the instrument they heard in the beginning solo of ldquoRhapsody in Bluerdquo that was played for them
The average responding score for music was reported on a NAEP scale of 0 to 300 Scores ranged from 105 for the lowest-performing students to 194 for the highest-performing students
The VISUAL ARTS portion of the assessment included questions that measured studentsrsquo ability to respond to art as well as questions that measured their ability to create art Responding questions asked students to analyze and describe works of art and design For example students were asked to describe specific differences in how certain parts of an artistrsquos self-portrait were drawn The average responding score for visual arts was reported on a NAEP scale of 0 to 300 with scores ranging from 104 for the lowest-performing students to 193 for the highest-performing students
Creating questions on the other hand required students to create works of art and design of their own For example students were asked to create a self-portrait that was scored for identifying detail compositional elements and use of materials The average creating task score for visual arts was reported separately as the average percentage of the maximum possible score from 0 to 100 with a national average of 52 In general students who performed well on the responding questions also performed well on the creating questions
ARTS 2008ARTS 2008 1
Racialethnic and gender gaps evident in both music and visual arts Although the results for music and visual arts are reported separately and cannot be compared some general patterns in differences between student groups were similar in the two disciplines
bull Average responding scores in both music and visual arts were 22 to 32 points higher for White and AsianPacific Islander students than for Black and Hispanic students The creating task scores in visual arts were also higher for White and Asian Pacific Islander students than for their Black and Hispanic peers
bull Average responding scores for female students were 10 points higher than for male students in music and 11 points higher in visual arts Female students also outperformed male students in creating visual art
Frequency of arts instruction remains steady In 2008 fifty-seven percent of eighth-graders attended schools where music instruction was offered at least three or four times a week and 47 percent attended schools where visual arts
instruction was offered at least as often There were no statistically significant changes since 1997 in the percentages of students attending schools offering instruction in music or visual arts with varying frequency
There were also no significant differences found between the percentages of students in different racialethnic or gender groups attending schools with varying opportunities for instruction in either music or visual arts in 2008
COMPARISONS BETWEEN 1997 AND 2008
Although the questions in the 2008 assessment were taken from those administered in the 1997 arts assessment some of the scoring procedures could not be replicated in 2008 Therefore comparisons cannot be made between studentsrsquo scores in those two years However comparisons can be made for the percentages of students who responded correctly to the multiple-choice questions in the assessment and the percentages of students based on responses to background questions that were asked in both years
THE NATIONrsquoS REPORT CARD 2
Music
71 correctly identifi ed a symphony orchestra as the type of ensemble that played a piece of music
52 were able to identify Africa as the region of origin for a musical excerpt and could describe a characteristic of the musicrsquos style
20 were able to identify the name of a piano dynamic marking and explain its meaning
Visual Arts
53 were able to describe specifi c differences in how certain parts of an artistrsquos self-portrait were drawn
34 were able to describe two characteristics of the medium of charcoal as used in an artistrsquos self-portrait
19 were able to connect the formal characteristics
More students writing down music and writing about their artwork in arts classes The percentage of eighth-grade students who reported being asked by their teacher to write down music in music class showed an increase from 26 percent in 1997 to 33 percent in 2008 (fi gure A) However the percentages of students who reported engaging in other activities such as listening to music singing playing instruments working on group assignments and making up their own music in 2008 were not found to be signifi cantly different from the percentages of students in 1997
The percentage of eighth-grade students who were asked by their teacher to write about their artwork in visual arts class increased from 21 percent in 1997 to 27 percent in 2008 (figure B) The percentage of students whose teacher had them choose their own art project on the other hand decreased from 47 percent to 39 percent over the same period Additionally the percentage of students who reported visiting an art museum gallery or exhibit with their class decreased from 22 percent in 1997 to 16 percent in 2008 There were no signifi cant changes for other activities such as painting or drawing making things out of clay or other materials or working in pairs or groups
of an artistrsquos self-portrait with what the artist was trying to communicate
Figure A Percentage of students at grade 8 who are asked to write down music at least once a month in music class 1997 and 2008
1997
2008 33
26
0 10 20 30 40 50 60 70 80 90 100
Percent
Significantly different (p lt 05) from 2008
Figure B Percentage of students at grade 8 who are asked to write about their artwork at least once a month in art class 1997 and 2008
1997
2008 27
21
0 10 20 30 40 50 60 70 80 90 100
Percent
Significantly different (p lt 05) from 2008 SOURCE US Department of Education Institute of Education Sciences National Center for Education Statistics National Assessment of Educational Progress (NAEP) 1997 and 2008 Arts Assessments
ARTS 2008 3
The 2008 NAEP arts assessment measured studentsrsquo knowledge and skills in the arts by asking them to observe describe analyze and evaluate existing works of music and visual art and to create original works of visual art
The Eighth-Grade Arts Assessment The Arts Framework The NAEP arts framework serves as the blueprint for the assessment describing the specifi c knowlshyedge and skills that should be assessed in the arts disciplines Developed under the guidance of the National Assessment Governing Board the framework reflects the input of arts educators artists assessment specialists policymakers representatives from the business community and members of the public The National Standards for Arts Education1 also served as an important reference in the development of the NAEP arts framework
The framework specifies that studentsrsquo arts knowledge and skills be measured in four arts disciplines dance music theatre and visual arts Additionally three arts processesmdashresponding creating and performingmdashare central to studentsrsquo experiences in these disciplines While the responding process refers to observing describing
1 National Standards for Arts Education (1994) Reston Virginia Music Educators National Conference
analyzing and evaluating works of art the creating process refers to expressing ideas and feelings in the form of an original work of art Due to budget constraints only the responding process in music and both the responding and creating processes in visual arts were assessed in 2008
To learn more about the arts framework visit httpwwwnagborgpublicationsframeworks arts-framework08pdf
Assessment Design Because of the breadth of content covered in the NAEP arts assessment each student was assessed in only one arts discipline either music or visual arts
The responding process in music and visual arts was assessed with multiple-choice questions and constructed-response questions that required students to produce answers of a few words or sentences The constructed-response questions that assessed the creating process included questions that required students to generate written answers and to create original works of visual art
THE NATIONrsquoS REPORT CARD 4
Scoring Studentsrsquo Work in the Arts One of the challenges of the arts assessment was scoring studentsrsquo work Specific scoring guides were developed for the responding questions in music and the responding and creating questions in visual arts Scorers were then trained to apply these criteria appropriately when evaluating studentsrsquo responses that demonstrated a wide range of skill levels in music and visual arts
The scoring guides for the sample questions presented in this report and other released questions from the assessment are available in the NAEP Questions Tool at httpncesedgov nationsreportcarditmrls
Reporting Arts Results The results in this report are based on a nationally representative sample of 7900 eighth-grade students from 260 public and private schools Approximately one-half of these students were assessed in music and the other half were assessed in visual arts
Because music and visual arts are two distinct disciplines results are reported separately for
each area and cannot be compared The average responding scores for music and visual arts are reported on two separate NAEP scales each ranging from 0 to 300 The average creating task score for visual arts is reported as the average percentage of the maximum possible score ranging from 0 to 100 The arts assessment results cannot be reported in terms of the NAEP achievement levels (Basic Profi cient and Advanced) given the complex and diverse nature of the assessment tasks both within and across the arts disciplines
Comparisons Between 1997 and 2008 Although the questions in the 2008 assessment were taken from those administered in the previous arts assessment in 1997 not all of the results can be compared between the two years (see the Technical Notes for more information) While comparisons across years cannot be made for the average responding and creating task scores the percentages of studentsrsquo correct responses to the multiple-choice questions in 2008 can be compared to those in 1997 These results are provided in appendix table A-3 for music and table A-4 for visual arts
ARTS 2008 5
Accommodations and Exclusions in NAEP Testing accommodations (for example providing students with extra testing time or administering the assessment to students individually rather than in a group) are made available for students with disabilities and for English language learners participating in NAEP Even with the availability of accommodations a portion of these students was excluded from the NAEP arts assessment by their schools In the 2008 arts assessment overall exclusion rates for students with disabilities andor English language learners were 2 percent of all students for music and for visual arts (see appendix table A-6)
More information about NAEPrsquos policy on the inclusion of special-needs students is available at httpncesedgovnationsreportcardabout inclusionasp
Interpreting Results NAEP uses widely accepted statistical standards for presenting and discussing results Findings are reported based on statistical significance at the 05 level using t-tests with appropriate adjustments for multiple comparisons (using the False Discovery Rate procedure) Results that are reported to be ldquohigherrdquo or ldquolowerrdquo have been found to be statistically signifi cant
In addition to the overall results for eighth-graders in the nation performance is presented for different student groups These results should not be used to establish a cause-and-effect relationship between background characteristics and achievement A complex mix of education and socioeconomic factors may affect student performance
For additional information about interpreting results see the Technical Notes section of this report or visit httpncesedgovnationsreportcard tdwanalysisinferasp
THE NATIONrsquoS REPORT CARD 6
7ARTS 2008
The 2008 arts assessment in music measured studentsrsquo ability to respond to music There were a total of four music sections in the arts assessment each of which contained between 8 and 16 multiple-choice and constructed-response (or open-ended) questions Many of the music questions in the assessment included multiple parts Each student who was assessed in music was presented with two of the four sections Because the length of the recorded music that was played for students varied in each section the amount of time provided for students to complete two music sections ranged from 58 minutes to 63 minutes
Students were asked to analyze and describe aspects of music they heard critique instrumental and vocal performances and demonstrate their knowledge of standard musical notation and musicrsquos role in society Examples of the different types of music questions are presented later in this section
8 THE NATIONrsquoS REPORT CARD
174
Eighty-nine-point score gap between lowest- and highest- performing students in music While the overall average responding score in music was set at 150 in 2008 students at grade 8 exhibited a wide range of responding scores (figure 1) For example scores ranged from 105 for lower-performing students at the 10th percentile to 194 for higher-performing students at the 90th percentile Students at the 50th percentile had a score of 151
SOURCE US Department of Education Institute of Education Sciences National Center for Education Statistics National Assessment of Educational Progress (NAEP) 2008 Arts Assessment
Figure 1 Average responding scale score and percentile scores in NAEP music at grade 8 2008
Overall 10th 25th 50th 75th 90th average score Percentile score
150
194
128
105
0
300 200
190
180
170
160
150
140
130
120
110
100
Scale score
151
174
A constructed-response question that asked
students to write two measures of rhythmic
music notation was included in one of the four
music sections Due to budget constraints this
was the only question in the assessment that
asked students to create music therefore an
average creating task score for music could not
be reported However results for this question
and other released questions from the 2008 arts
assessment are available at httpncesedgov
nationsreportcarditmrls
Creating Music
9ARTS 2008
Racialethnic gender and socioeconomic gaps in music scores
In addition to the overall average responding score In general the same patterns in score gaps seen in in music results are also available based on student other NAEP subjects were also evident in the results for characteristics such as raceethnicity gender and music (figure 2) The percentages of students in each eligibility for the National School Lunch Program student group can be found in appendix table A-5
RaceEthnicity In 2008 average responding scores in music for White and AsianPacific Islander students were 29 to 32 points higher than the scores for Black and Hispanic students There were no signifi cant differences between the average responding scores of White and AsianPacific Islander students or between the scores of Black and Hispanic students
Figure 2 Average responding scale score in NAEP music at grade 8 by selected student characteristics 2008
Scale score 300
200
190
180
170
160
150
140
130
120
110
0 White Black Hispanic Asian Male Female Eligible Not
Pacific eligible Islander
Raceethnicity
161
130 129
159
Gender
145
155
Eligibility for freereduced-price
school lunch
132
161
NOTE Black includes African American Hispanic includes Latino and Pacific Islander includes Native Hawaiian Race categories exclude Hispanic origin Sample sizes were insuffishycient to permit reliable estimates for students whose raceethnicity was American IndianAlaska Native or unclassified For the eligibility for freereduced-price school lunch category results are not shown for students whose eligibility status was not available SOURCE US Department of Education Institute of Education Sciences National Center for Education Statistics National Assessment of Educational Progress (NAEP) 2008 Arts Assessshyment
10 THE NATIONrsquoS REPORT CARD
Gender On average female students had a higher respondshying score in music than their male counterparts There was a 10-point gap between the two groups in 2008
Eligibility for FreeReduced-Price School Lunch NAEP uses studentsrsquo eligibility for the National School Lunch Program as an indicator of poverty
2 The score-point difference is based on the difference between the unrounded scores as opposed to the rounded scores shown in the fi gure
Students from lower-income families are typically eligible for freereduced-price school lunch (see the Technical Notes at the end of this report for eligibility criteria) while students from higher-income families typically are not On average the responding score for students who were eligible was 28 points2 lower than the score for students who were not eligible
Music scores vary by type and location of schools
Results by selected school characteristics also show based on the type of school or its location Differences differences in average responding scores for music in access to arts instruction and quality curricula (fi gure 3) It is important to note that there may be many socioeconomic status and other factors not measured reasons students performed differently on average in NAEP may influence student achievement in the arts
Type of School Public school students made up 93 percent of eighth-graders in the nation in 2008 while the other 7 percent of students attended private schools The average responding score in music for eighth-graders in public schools was 14 points lower than the score for students in private schools
School Location Results are available for four school location categories city suburb town and rural Descriptions of how these school location categories are defi ned are included in the Technical Notes section of this report
In 2008 eighth-graders who attended city schools had a lower average responding score in music than students who attended suburban town and rural schools There were no significant differences in the average scores among students in suburban town and rural school locations
Figure 3 Average responding scale score in NAEP music at grade 8 by selected school characteristics 2008
Scale score 300
200
190
180
170
160
150
140
130
120
110
0
School location
142
155 156 150
Type of school
149
163
Public Private City Suburb Town Rural
SOURCE US Department of Education Institute of Education Sciences National Center for Education Statistics National Assessment of Educational Progress (NAEP) 2008 Arts Assessment
11ARTS 2008
Context for Arts Education in Music Information collected from school and student on the availability and nature of music education in questionnaires helps to provide the context in which their schools Students provided information on their arts learning takes place For the music portion of the participation in music activities assessment school administrators provided information
Frequency of music instruction remains steady School administrators were asked how often eighth-graders attending their schools might receive instruction in music Fifty-seven percent of eighth-graders attended schools where students could have received music instruction at least three or four times a week in 2008 (figure 4) This was higher than the percentages of students attending schools where music was offered less frequently or not at all
Although the data are not shown here access to music instruction as reported by school administrators did not differ significantly by raceethnicity gender or eligibility for freereduced-price school lunch For example the percentage of Black students attending schools where music was offered at least 3 or 4 times a week was not significantly different from the percentage of White students
The same question was asked of school administrators in 1997 making it possible to look for changes in the instruction patterns over time The apparent increase between 1997 and 2008 in the percentage of students attending schools where music was available at least three or four times a week was not statistically significant nor were there any significant changes in the percentages of students attending schools where music was offered once or twice a week less than once a week or not at all
Figure 4 Percentage of students at grade 8 by school-reported frequency with which instruction in music is available 1997 and 2008
1997
2008
Once or twice a week 27
38
At least 3 or 4 times a week 57
43
9Subject not offered 8
Less than once a week
10
8
0 10 20 30 40 50 60 70 80 90 100
Percent
NOTE Detail may not sum to totals because of rounding SOURCE US Department of Education Institute of Education Sciences National Center for Education Statistics National Assessment of Educational Progress (NAEP) 1997 and 2008 Arts Assessments
71 percent of eighth-graders attended schools where administrators reported that their state or district had a curriculum in music in 2008
77 percent of students attended schools where music was taught by a full-time specialist
12 THE NATIONrsquoS REPORT CARD
More students writing down music in music class Students responded to a series of questions about how often they did certain activities in music class For each activity listed in figure 5 students indicated if they were asked by their teacher to do it almost every day once or twice a week once or twice a month or never or hardly ever Students were also given the option of indicating that they did not have music in school The results summarized here show the combined percentages for all eighth-grade students who reported that they did various music-related activities at least once a month
For the most part students were as likely to be asked by their teachers to engage in these musical activities in 2008 as in 1997 There were no significant changes in the percentages of students who reported that teachers played music for them to listen to or asked them to sing play an instrument work on group assignments or make up their own music Only the percentage of students who reported being asked to write down music showed a statistically significant increase from 26 percent in 1997 to 33 percent in 2008
About one-third of students participate in musical performance activities at school Students were also asked several questions about their participation in musical performance activities at school These included whether or not they played in a band played in an orchestra or sang in a chorus or choir Overall 34 percent of eighth-graders reported participating in one or more of these musical activities at school in 2008 (fi gure 6) Although questions about participation in these musical activities were also asked in 1997 changes in the format of the questions prohibit comparing results from the two years
Figure 5 Percentage of students at grade 8 by student-reported in-school activities their teachers ask them to do in music class at least once a month 1997 and 2008
16
17
36
26
33
28
28
30
49
51
35
33
Listen to music
Sing
Play instruments
Write down music
Work on group assignments
Make up own music 1997
2008
0 10 20 30 40 50 60 70 80 90 100
Percent
Significantly different (p lt 05) from 2008
Figure 6 Percentage of students at grade 8 by student-reported participation in musical activities in school 2008
Play in a band
Play in an orchestra
Sing in a chorus or choir
One or more of the three activities
17
34
16
5
0 10 20 30 40 50 60 70 80 90 100
Percent
NOTE Students were permitted to select more than one musical activity The percentage for the category ldquoOne or more of the three activitiesrdquo was derived from studentsrsquo responses to each of the other three categories and was not a separate option by itself SOURCE US Department of Education Institute of Education Sciences National Center for Education Statistics National Assessment of Educational Progress (NAEP) 1997 and 2008 Arts Assessments
13ARTS 2008
What Eighth-Graders Know and Can Do in Music The item map below is useful for understanding studentsrsquo performance at different points on the responding scale The scale scores on the left represent the average scores for students who were likely to get the questions correct or partially correct Scores for the 25th and 75th percentiles are also noted The descriptions of selected assessment questions are listed on the right
For example the map shows that higher-performing eighth-graders in the upper range of the scale with an average score of 265 were likely to be able to identify one element of jazz present in ldquoRhapsody
Grade 8 NAEP Music Responding Item Map
Scale score Question description
in Bluerdquo Middle-performing students with an average score of 163 were likely to be able to describe one feature of a song that identifies it as a spiritual
Constructed-response questions for which students could earn partial credit may appear on the map multiple times once for each level of credit For example a question asking students to provide the name of a piano dynamic marking and to explain its meaning appears at the score of 192 for responses receiving full credit and at 183 for responses receiving partial credit
300
275 Identify piece of music as coming from twentieth century and provide limited justifi cation why 265 Identify one element of jazz present in ldquoRhapsody in Bluerdquo
239 Describe an emotion or mood created by a composition and describe two ways in which emotion or mood was created
237 Provide a partial identifi cation and description of the errors in pitch in an instrumental solo
230 Describe a similarity and a difference between two written vocal parts
228 Identify the solo instrument beginning ldquoRhapsody in Bluerdquo (page 17)
225 Provide a comparison between the tone color of two different singers
195 Select a line drawing refl ective of the texture of an example of music (page 15)
195 Identify the term for a fermata symbol
192 Identify the name of a piano dynamic marking and explain its meaning (page 16)
183 Either identify the name of a piano dynamic marking or explain its meaning (page 16)
182 Provide a limited explanation of why spirituals were important in peoplersquos lives
176 Identify a correct time signature for a piece of music
172 Identify region of origin of African musical excerpt and provide a description of a characteristic related to its style (page 18)
167 Identify a bass clef symbol
166 Identify the type of instrumental ensemble performing an excerpt
163 Describe one feature of a song that identifi es it as a spiritual
151 Identify the length of the introduction of ldquoShalom My Friendsrdquo
136 Identify directional contour of part of melodic phrase
124 Identify region of origin of African musical excerpt and provide partial explanation of its style characteristics (page 18)
84 Describe an emotion or mood created by a composition 49 Identify region of origin of African musical excerpt (page 18)
0
174 75th percentile
128 25th percentile
NOTE Regular type denotes a constructed-response question Italic type denotes a multiple-choice question The position of a question on the scale represents the average scale score attained by students who had a 65 percent probability of obtaining credit at a specific level of a constructed-response question or a 74 percent probability of correctly answering a four-option multiple-choice question SOURCE US Department of Education Institute of Education Sciences National Center for Education Statistics National Assessment of Educational Progress (NAEP) 2008 Arts Assessment
14 THE NATIONrsquoS REPORT CARD
A
SAMPLE QUESTION Identifying the Texture of a Musical Example The sample question below asked students to identify the texture of a musical example that was played (The term ldquotexturerdquo was defined for the students as the blend of various musical sounds and the ways in which the lines of music in a piece are related)
The music played for this question came from the beginning of ldquoContrapunctus 4rdquo from The Art of the Fugue by JS Bach In the recording the fugue was played by a brass quartet The fugue begins with one instrument entering and playing the subject (the initial melody) of the fugue followed by the other members of the quartet each playing the melody The audio for this question is available in the NAEP Questions Tool at httpncesedgov nationsreportcarditmrls
Each of the four diagrams below illustrates an example of a texture that could occur in a piece of music In 2008 fifty-two percent of eighth-graders selected the correct answer (choice A) which shows the general pattern of musical lines that occurred in the music that was played This was not found to be significantly different from the 52 percent who answered correctly in 1997 The other three choices are incorrect because they show patterns of musical lines that did not match the music that was played Choice B shows a group of three voices in alternation with a solo line choice C shows an alternation of two lines with no accompanying lines or voices and choice D shows a solo line with a block chord accompaniment
Percentage of students in each response category at grade 8 2008
Choice A Choice B Choice C Choice D Omitted
52 18 5 25 Rounds to zero NOTE Detail may not sum to totals because of rounding SOURCE US Department of Education Institute of Education Sciences National Center for Education Statistics National Assessment of Educational Progress (NAEP) 2008 Arts Assessment
Which diagram best illustrates the texture of the music
B
DC
AAAAAAAAAAAAAAAAAAAAAAAA
15ARTS 2008
SAMPLE QUESTION Reading Musical NotationThis two-part sample question was taken from a set of questions that asked students to demonstrate knowledge of standard musical notation In the question below students were asked to provide the name and meaning of the symbol indicated in circle 1 in the music shown here No recorded music was played for this question The question that pertains to the symbol indicated in circle 2 is not
shown here but is available in the NAEP Questions Tool at httpncesedgovnationsreportcarditmrls
Student responses for this two-part question were rated using three scoring levels Adequate Limited and Inadequate Examples of Adequate and Limited responses are shown here Inadequate responses failed to provide correct information for either part of the question
Adequate Limited Inadequate Omitted
20 9 62 Rounds to zero NOTE Detail may not sum to totals because the percentage of responses rated as ldquoOff-taskrdquo is not shown Off-task responses are those that do not provide any information related to the assessment taskSOURCE US Department of Education Institute of Education Sciences National Center for Education Statistics National Assessment of Educational Progress (NAEP) 2008 Arts Assess-ment
Percentage of students in each response category at grade 8 2008
1
2
What does the symbol in circle 1 tell the performer to do
What is the musical (Italian) name for the symbol in circle 1
This sample response was rated ldquoAdequaterdquo because it provided the symbolrsquos meaning (that the music should be performed softly) and the symbolrsquos correct name (piano) Twenty percent of eighth-graders received a rating of ldquoAdequaterdquo on this question
This sample response was rated ldquoLimitedrdquo because it provided the symbolrsquos meaning but not its correct name (Pianissimo refers to the symbol pp which indicates that music should be performed very softly) Nine percent of studentsrsquo responses to this question were rated ldquoLimitedrdquo
What does the symbol in circle 1 tell the performer to do
What is the musical (Italian) name for the symbol in circle 1
16 THE NATIONrsquoS REPORT CARD
D
At the beginning of the piece a solo is played on
a flute
an oboe
a saxophone
a clarinet
A
B
C
DDDDDDDDD
SAMPLE QUESTION Identifying the Sound of an Instrument The sample question below asked students to identify the sound of an instrument The music played for this question comes from the opening of ldquoRhapsody in Bluerdquo by American composer George Gershwin The audio is available in the NAEP Questions Tool at httpncesedgov nationsreportcarditmrls
In 2008 fifty percent of eighth-graders correctly identified the clarinet as the instrument on which the solo was played (choice D) This was not found to be significantly different from the 52 percent who answered correctly in 1997 Choices A B and C are also woodwind instruments like the clarinet but were not the instrument on which the solo at the beginning of the piece was played
Choice A Choice B Choice C Choice D Omitted
12 15 22 50 Rounds to zero NOTE Detail may not sum to totals because of rounding SOURCE US Department of Education Institute of Education Sciences National Center for Education Statistics National Assessment of Educational Progress (NAEP) 2008 Arts Assessshyment
Percentage of students in each response category at grade 8 2008
17ARTS 2008
D
D
SAMPLE QUESTION Identifying Origin of a Musical Style The two-part sample question below asked students to identify music from a particular culture and to describe the features that help to characterize its style The music played for this question came from an African song entitled ldquoDrodoperdquo The audio is available in the NAEP Questions Tool at httpncesedgovnationsreportcarditmrls
Student responses for this two-part question were rated using four scoring levels Developed Adequate Limited and Inadequate Examples of Developed and Adequate responses are shown here Responses rated as Limited only provided a correct response to the first part of the question Responses rated as Inadequate failed to provide a correct response for either part of the question
This sample response was rated ldquoDevelopedrdquo because it both indicated the correct region of origin of the music and cited the ldquocall and responserdquo feature of the music that is common among many types of African songs Mentioning the use of specific percussion instruments such as drums also contributed to this response receiving a rating of ldquoDevelopedrdquo Fifty-two percent of eighth-graders received a rating of ldquoDevelopedrdquo on this question
From where does the music come
North America
South America
Asia
Africa
Other than the language used in the song describe one feature of the music that helps to identify it as coming from the part of the world you selected Be specific in your description
A
B
C
DDDDDDDDDDDDDDDDDD
From where does the music come
North America
South America
Asia
Africa
Other than the language used in the song describe one feature of the music that helps to identify it as coming from the part of the world you selected Be specific in your description
A
B
C
This sample response was rated ldquoAdequaterdquo Although it indicated the correct region of origin of the music the description of a feature of the music was vague Twenty-four percent of studentsrsquo responses to this question were rated ldquoAdequaterdquo
DDDDDDDDDDDDDDDDDDDDDDDDDDDD
Percentage of students in each response category at grade 8 2008
Developed Adequate Limited Inadequate Omitted
52 24 19 5 Rounds to zero NOTE Detail may not sum to totals because the percentage of responses rated as ldquoOff-taskrdquo is not shown Off-task responses are those that do not provide any information related to the assessment task SOURCE US Department of Education Institute of Education Sciences National Center for Education Statistics National Assessment of Educational Progress (NAEP) 2008 Arts Assessshyment
18 THE NATIONrsquoS REPORT CARD
19ARTS 2008
The 2008 arts assessment included four sections in visual arts that measured studentsrsquo ability to respond to and create visual art Students were given two of the four sections each of which contained between 7 and 11 multiple-choice and constructed-response questions Many of the visual arts questions in the assessment contained multiple parts The amount of time provided for students to complete two visual arts sections ranged from 75 minutes to 104 minutes
Responding questions asked students to analyze and describe works of art and design thereby demonstrating their knowledge of media and techniques visual organization the cultural contexts of artworks how works of art convey meaning and the relationship between form and function in design Creating questions assessed studentsrsquo ability to communicate in works of art think of different solutions to visual problems and generate ideas for and then create works of art and design These creating questions represented approximately one-half of the total assessment time in visual arts Some examples of the different types of visual arts questions are presented later in this section
20 THE NATIONrsquoS REPORT CARD
Eighty-nine-point score gap between lowest- and highest- performing students in visual arts The overall average responding score for visual arts was set at 150 in 2008 (figure 7) In addition to the overall average responding score results are shown for students at selected percentiles on the responding scale There was an 89-point gap between the scores for students at the 10th and 90th percentiles
The assessment also included questions that asked students to create works of art and design Results for these questions are presented as the average creating task score which is expressed as the average percentage of the maximum possible score ranging from 0 to 100 (see the Technical Notes for an explanation of how the score was calculated) In 2008 the overall average creating task score for grade 8 students was 52 (fi gure 8)
Responding and creating results related Because the NAEP arts framework describes the integration among the arts processes it is useful to explore the relationship between studentsrsquo results on the responding and creating questions in visual arts On average students who performed well on the responding questions also performed well on the creating questions (figure 9) For example students performing above the 75th percentile on the responding scale also had the highest average creating task score (62) Lower-performing students at or below the 25th percentile on the responding scale had the lowest average creating task score (40)
Figure 7 Average responding scale score and percentile scores in NAEP visual arts at grade 8 2008
150
104
174
300 200
190
180
170
160
150
140
130
120
110
Scale score
193
152
128
Overall 10th 25th 50th 75th 90th average score Percentile score
100
0
Figure 8 Average creating task score in NAEP visual arts at grade 8 2008
Overall 52
0 10 20 30 40 50 60 70 80 90 100
Percent of maximum score
Figure 9 Average creating task score in NAEP visual arts at grade 8 by responding score level 2008
Responding score level
Lower (lt 25th percentile)
Lower-middle (25thndash50th percentiles)
Upper-middle (50thndash75th percentiles)
Upper (gt 75th percentile)
Average creating task score
50
40
62
55
0 10 20 30 40 50 60 70 80 90 100
Percent of maximum score
SOURCE US Department of Education Institute of Education Sciences National Center for Education Statisshytics National Assessment of Educational Progress (NAEP) 2008 Arts Assessment
21ARTS 2008
Race ethnicity
54
55
46
43
49
Black
Hispanic
AsianPacific Islander
Male
White
Gender
Eligibility for free
reduced-price school lunch
54
55
46 Eligible
Not eligible
Female
Patterns in score gaps by student characteristics similar for responding to and creating visual arts
In general patterns in score differences based on student characteristics were similar for results in both responding (fi gure 10) and creating (fi gure 11)
130
120
110
RaceEthnicity In 2008 average responding scores in visual arts were 22 to 31 points higher for White and AsianPacifi c Islander students than for Black and Hispanic students There were no signifi cant differences between the average responding scores of White and AsianPacific Islander students or between the scores of Black and Hispanic students
Similarly the average creating task scores of White and AsianPacific Islander students were higher than the scores of Black and Hispanic students but there were no significant differences between the scores of White and AsianPacific Islander students or between the scores of Black and Hispanic students
Gender On average female eighth-graders had a higher responding score in visual arts than their male counterparts There was an 11-point3 gap between the two groups in 2008 The average creating task score for female students was also 5 points higher than the score for male students
Eligibility for FreeReduced-Price School Lunch On average eighth-graders who were eligible for free reduced-price school lunch had a lower responding score in visual arts than those who were not eligible There was a 29-point gap between the two groups in 2008 Students who were eligible also had an average creating task score that was 9 points lower than the score for students who were not eligible
3 The score-point gap is based on the difference between the unrounded scores as opposed to the rounded scores shown in the fi gure
Figure 10 Average responding scale score in NAEP visual arts at
200
190
180
170
160
150
140
Raceethnicity
160
129 134
156
Gender
145
155
300 Scale score
Eligibility for freereduced-price
school lunch
132
161
grade 8 by selected student characteristics 2008
0 White Black Hispanic Asian Male Female Eligible Not
Pacific eligible Islander
Figure 11 Average creating task score in NAEP visual arts at grade 8 by selected student characteristics 2008
0 10 20 30 40 50 60 70 80 90 100
Percent of maximum score
NOTE Black includes African American Hispanic includes Latino and Pacifi c Islander includes Native Hawaiian Race categories exclude Hispanic origin Sample sizes were insufshyficient to permit reliable estimates for students whose raceethnicity was American Indian Alaska Native or unclassified For the eligibility for freereduced-price school lunch category results are not shown for students whose eligibility status was not available SOURCE US Department of Education Institute of Education Sciences National Center for Education Statistics National Assessment of Educational Progress (NAEP) 2008 Arts Assessment
22 THE NATIONrsquoS REPORT CARD
No signifi cant difference in responding scores between public and private school students
While the general patterns in results for responding not all the apparent differences were found to be to and creating visual arts by selected school statistically signifi cant characteristics were similar (fi gures 12 and 13)
Type of School The apparent difference in 2008 between the average responding scores in visual arts for eighth-graders in public and private schools was not found to be statistically significant However the average creating task score was lower for public school students than for private school students
School Location Students attending suburban schools in 2008 had a higher average responding score in visual arts than students in city schools There were no significant differences in the average responding scores between students from suburban schools and town or rural schools
In the creating process of visual arts students attending suburban schools had a higher average creating task score than students in both city and town schools The average creating task score of students in suburban schools was not signifi cantly different from the score of students in rural schools
Because responding results are presented as scale scores and creating results are presented as average percentages it is not possible to compare the magnitude of differences between these scores For example an 11-point difference on the 0ndash300 responding scale between students attending schools in city and suburban locations is not necessarily greater than a 5-point difference between the same two groups on the 0ndash100 creating task scale
Figure 12 Average responding scale score in NAEP visual arts at grade 8 by selected school characteristics 2008
140
130
120
110
0 Public Private
200
190
180
170
160
150
City Suburb Town Rural
School location
144
155 149 151
Type of school
149
159
300 Scale score
Figure 13 Average creating task score in NAEP visual arts at
City
Suburb
Town
Rural
School location
52
49
50
54
Public
Private
Type of school 60
51
grade 8 by selected school characteristics 2008
0 10 20 30 40 50 60 70 80 90 100
Percent of maximum score
SOURCE US Department of Education Institute of Education Sciences National Center for Education Statistics National Assessment of Educational Progress (NAEP) 2008 Arts Assessment
23ARTS 2008
Context for Arts Education in Visual Arts To provide the context in which arts learning takes and nature of visual arts education in their schools place results are presented here based on school and studentsrsquo responses about their participation in administratorsrsquo responses related to the availability visual arts activities
Frequency of visual arts instruction remains steady School administrators were asked how often eighth-graders attending their schools might receive instruction in visual arts Forty-seven percent of eighth-graders attended schools where students could possibly receive visual arts instruction at least three or four times a week in 2008 (fi gure 14) This was higher than the percentages of students attending schools where visual arts were offered less frequently or not at all
Although the data are not shown here access to visual arts instruction did not differ significantly by race ethnicity gender or eligibility for freereduced-price school lunch For example the percentage of students who were eligible for freereduced-price school lunch attending schools where visual arts were offered once or twice a week was not significantly different from the percentage of students who were not eligible
The same question was asked of school administrators in 1997 making it possible to look for changes in the instruction patterns over time The results showed no significant changes between 1997 and 2008 in the percentages of students who attended schools where visual arts were available at least three or four times a week once or twice a week less than once a week or not at all
Figure 14 Percentage of students at grade 8 by school-reported frequency with which instruction in visual arts is available 1997 and 2008
1997
2008 47
52At least 3 or 4 times a week
30
25Once or twice
a week
5
10
Less than once a week
17
14
Subject not offered
0 10 20 30 40 50 60 70 80 90 100
Percent
NOTE Detail may not sum to totals because of rounding SOURCE US Department of Education Institute of Education Sciences National Center for Education Statistics National Assessment of Educational Progress (NAEP) 1997 and 2008 Arts Assessments
77 percent of eighth-graders attended schools where administrators reported that visual arts were taught by a full-time specialist
69 percent of students attended schools that followed a state or district curriculum in visual arts
24 THE NATIONrsquoS REPORT CARD
More students writing about their artwork
Students responded to a series of questions about how often they did certain activities in visual arts class For each activity listed in figure 15 students indicated if their teacher had them do it every day once a week once a month or never or hardly ever The results summarized here show the combined percentages for students who reported that they did various art-related activities at least once a month
The percentage of students who reported that their teacher had them write about their artwork increased from 21 percent in 1997 to 27 percent in 2008 However the percentage of students whose teacher had them choose their own art project decreased from 47 percent in 1997 to 39 percent in 2008 There were no significant changes between 1997 and 2008 in the percentages of students who reported that their teachers had them paint or draw make things out of clay or other materials work in a pair or group on an art project talk with others about their own or othersrsquo artwork or look at videotapes filmstrips slides or television programs about art
Fewer students visit art museums with class in 2008 Exposure to art museums and exhibits outside of school may help students learn about and engage in visual arts Sixteen percent of students in 2008 reported that they had gone with their class to an art museum gallery or exhibit at least once in the last year which was smaller than the 22 percent in 1997 (fi gure 16)
Although not presented here graphically 54 percent of eighth-graders reported that they or their teacher saved their artwork in a portfolio in 2008 which was not signifi cantly different from the 50 percent in 1997
About half of students save artwork in a portfolio
Figure 15 Percentage of students at grade 8 by student-reported in-school activities their teachers have them do in art at least once a month 1997 and 2008
45
43
21
27
50
43
39
47
41
38
80
80
53
40
Paint or draw
Make things out of clay or
other materials
Choose own art project
Work in a pair or a group on an
art project
Talk with others about own artwork or
that of other students
Write about own artwork
Look at videotapes filmstrips slides
or television programs about art
1997
2008
0 10 20 30 40 50 60 70 80 90 100
Percent
Significantly different (p lt 05) from 2008
Figure 16 Percentage of students at grade 8 who reported visiting an art museum gallery or exhibit with their class at least once a year 1997 and 2008
1997
2008 16
22
0 10 20 30 40 50 60 70 80 90 100
Percent
Significantly different (p lt 05) from 2008 SOURCE US Department of Education Institute of Education Sciences National Center for Education Statistics National Assessment of Educational Progress (NAEP) 1997 and 2008 Arts Assessments
25ARTS 2008
What Eighth-Graders Know and Can Do in Visual Arts The item map below is useful for understanding studentsrsquo performance at different points on the responding scale The scale scores on the left represent the average scores for students who were likely to get the questions correct or partially correct Scores for the 25th and 75th percentiles are also noted The descriptions of selected assessment questions are listed on the right
For example the map shows that higher-performing eighth-graders in the upper range of the scale with an average score of 237 were likely to be able
Grade 8 NAEP Visual Arts Responding Item Map Scale score Question description
to identify the style of an artwork as surrealism Middle-performing students with an average score of 144 were likely to be able to analyze the subject of five motherchild portraits of different genres
Constructed-response questions for which students could earn partial credit may appear on the map multiple times once for each level of credit For example a question asking students to describe two characteristics of charcoal in a self-portrait appears at the score of 201 for responses receiving full credit and at 134 for responses receiving partial credit
300
285 Support plausible interpretation of Schiele self-portrait with observations about style line and color 280 Explain how an unusualunexpected feature of a Bearden collage contributes to the work as a whole 256 Analyze and support with references to the work the narrative conveyed by a Bearden collage 241 Describe at least three aspects of own self-portrait that communicate something about you 240 Explain materials and design of own package idea for transporting fi sh on bicycle 237 Identify the style of an artwork as surrealism 229 Label and specifi cally describe one or two features of a Bearden collage that the artist wants you to notice 224 Identify a technical similarity between Schiele and Kollwitz self-portraits (page 28) 221 Explain how artist used light and shadow to create realism in motherchild portrait 220 Explain three ways an artist made some things look near and some far in motherchild portrait 213 Support plausible interpretation of Schiele self-portrait with observations about style line or color 205 Explain how Bearden creates contrast between interior and exterior areas in collage 202 Describe two aspects of own self-portrait that communicate something about you 201 Describe two characteristics of charcoal in Kollwitz self-portrait (page 29) 197 Identify an example of Renaissance art 197 Identify compositional emphasis in a Bearden collage 189 Identify an example of 20th century western art 176 Compare in specifi c terms how Kollwitz has drawn different parts of her self-portrait and offer plausible
interpretation for differences (pages 30 and 31) 176 Explain where artist has used light and shadow to create realism in motherchild portrait
172 Describe and support how memory of place is shown in own collage 170 Explain how artist used light to create a lack of realism in motherchild portrait 144 Analyze subject of fi ve motherchild portraits of different genres 136 Describe one aspect of own self-portrait that communicates something about you 134 Describe one characteristic of charcoal in Kollwitz self-portrait (page 29)
128 Identify an unusualunexpected feature of the Bearden collage 62 Describe memory of place andor aspect(s) of own collage 61 Describe what Schiele self-portrait is communicating or describe an aspect of style line or color
0
174 75th percentile
128 25th percentile
NOTE Regular type denotes a constructed-response question Italic type denotes a multiple-choice question The position of a question on the scale represents the average scale score attained by students who had a 65 percent probability of obtaining credit at a specific level of a constructed-response question or a 74 percent probability of correctly answering a four-option multiple-choice question SOURCE US Department of Education Institute of Education Sciences National Center for Education Statistics National Assessment of Educational Progress (NAEP) 2008 Arts Assessment
26 THE NATIONrsquoS REPORT CARD
Self-portrait B Egon Schiele Crayon and watercolor on buff paper Galerie St Etienne
Self-portrait A Kathe Kollwitz Charcoal on brown laid paper National Gallery of Art
Sample Questions for Visual Arts Students were asked a series of questions related to two self-portraits shown here one by Kathe Kollwitz (A) and one by Egon Schiele (B) These questions required students to apply their knowledge of aesthetic properties to the two artworks and to consider the relationships between these properties and the expressive qualities of each work Students were then asked to create a self-portrait of their own
27ARTS 2008
B
SAMPLE QUESTION Recognizing a Technical Similarity Between Two Self-Portraits
The sample question below asked students to recognize a technical similarity between the Kollwitz and Schiele self-portraits In both works
In 2008 thirty-seven percent of students correctly identified this common feature of the two artworks (choice B) This was not found to be significantly
expressive loose lines are combined with precise different from the 36 percent who answered drawing correctly in 1997 Choices A C and D do not
accurately describe technical similarities between the two works
Which statement describes a technical similarity between self-portraits A and B
The figure in each work is seen from the same point of view
Both works combine loose gestural lines with careful drawing
The compositions in both works are symmetrical
Both works rely on light and shadow to emphasize depth
A
C
D
BBBBBBBBBBBBBBBBBBBBBBBB
Choice A Choice B Choice C Choice D Omitted
8 37 8 46
Percentage of students in each response category at grade 8 2008
Rounds to zero NOTE Detail may not sum to totals because of rounding SOURCE US Department of Education Institute of Education Sciences National Center for Education Statistics National Assessment of Educational Progress (NAEP) 2008 Arts Assessshyment
28 THE NATIONrsquoS REPORT CARD
SAMPLE QUESTION Characteristics of Charcoal The sample question below asked students to Unacceptable Examples of Acceptable and Partial describe characteristics of the medium of charcoal responses are shown here Responses rated as visible in the Kollwitz self-portrait Student Unacceptable did not describe characteristics of the responses for this question were rated using medium of charcoal evident in the self-portrait three scoring levels Acceptable Partial and
This sample response was rated ldquoAcceptablerdquo because it demonstrated the studentrsquos knowledge of charcoal as a medium The student expressed what Kollwitz was able to accomplish with charcoal in her self-portrait Thirty-four percent of eighth-graders received a rating of ldquoAcceptablerdquo on this question
Self-portrait A is a charcoal drawing Describe two characteristics of charcoal that you see in self-portrait A
1
2
Acceptable Partial Unacceptable Omitted
34 38 27 1 NOTE Detail may not sum to totals because the percentage of responses rated as ldquoOff-taskrdquo is not shown Off-task responses are those that do not provide any information related to the assessment task SOURCE US Department of Education Institute of Education Sciences National Center for Education Statistics National Assessment of Educational Progress (NAEP) 2008 Arts Assessshyment
Percentage of students in each response category at grade 8 2008
This sample response was rated ldquoPartialrdquo because it provided only one example of how charcoal was used in the self-portrait The student recognized that pressing harder on charcoal results in a darker mark as is evident in the Kollwitz self-portrait However the second part of the response did not describe another characteristic of charcoal as a medium Thirty-eight percent of studentsrsquo responses to this question were rated ldquoPartialrdquo
Self-portrait A is a charcoal drawing Describe two characteristics of charcoal that you see in self-portrait A
1
2
29ARTS 2008
a s
SAMPLE QUESTION Relationship Between Technical Approach and Meaning
Both parts of this sample response were rated ldquoAcceptablerdquo This response accurately described the differences between the parts of the drawing and then used thesss eeee oooo bbbbsssseeeeerrrr vvvvvaaaattttiiiiii oooooo nnnnnnnsssssss tttttt ooooooo ooooooooffffffffffffffffeeeeeeeerrrrrr aaaaaaaannnnnnnn iiiiiiiinnnnnnnnssssssssiiiiiiiigggggggghhhhhhhhttttttttffffffffuuuuuuuullllllll andddd pllausible interpretation of the reasons for those differences
Fifty-three percent of students received a rating of ldquoAcceptablerdquo for part A and 19 percent received an ldquoAcceptablerdquo rating for part B Students who received the ldquoAcceptablerdquo rating were able to both comprehend
pthe formal characteristics of the self-portrait and discuss the relationship between those characteristics and the artistrsquos possible expressive goals
Look at self-portrait A Compare how Kollwitz has drawn her head and hand with the way she has drawn her arm Be specific
A
Explain what you think Kollwitz may have been trying to communicate about herself by drawing these different parts of her self-portrait in different ways
B
THE NATIONrsquoS REPORT CARD
The two-part sample question below required students to analyze and interpret the Kollwitz self-portrait to explore relationships between technical approach and meaning Part A of the question asked students about the workrsquos formal characteristics while part B asked them to connect those characteristics with what the artist was attempting to communicate Student responses
to each of the two parts were rated separately using three scoring levels Acceptable Partial and Unacceptable Examples of Acceptable and Partial student responses for each part of this question are shown here Unacceptable responses for the question neither addressed differences in the way the parts of the self-portrait are drawn nor offered interpretations linked to observations
30
Both parts of this sample response received a ldquoPartialrdquo rating This response accurately described the way the arm is drawn but did not specifi cally address the ways in which the head and hand are drawn differently from the arm ldquoPartialrdquo credit was given for recognizing some characteristics of the artwork While a few plausible interpretations about what Kollwitz was trying to communicate are provided in the second part of the response none of these is clearly linked to the descriptions offered in the fi rst part
Look at self-portrait A Compare how Kollwitz has drawn her head and hand with the way she has drawn her arm Be specifi c
A
Explain what you think Kollwitz may have been trying to communicate about herself by drawing these different parts of her self-portrait in different ways
Fifteen percent of the student responses were rated B ldquoPartialrdquo for part A and 52 percent were rated ldquoPartialrdquo for part B
Percentage of students in each response category at grade 8 2008
Part A Part B
Acceptable Partial Unacceptable Omitted
53 15 31 2
Acceptable Partial Unacceptable Omitted
19 52 25 3
NOTE Detail may not sum to totals because the percentage of responses rated as ldquoOff-taskrdquo is not shown Off-task responses are those that do not provide any information related to the assessment task SOURCE US Department of Education Institute of Education Sciences National Center for Education Statistics National Assessment of Educational Progress (NAEP) 2008 Arts Assessment
31ARTS 2008
t t t t
a t
t t
s c
t
ldquoldquo
SAMPLE QUESTION Creating a Self-Portrait After students had observed the Kollwitz and Schiele self-portraits and studied relationships between the technical and expressive qualities of the two artworks they were asked to create a self-portrait of their own Students were given a set of
a mirror and a sheet of 12-inch by 18-inch white drawing paper and were asked to use these tools to create a self-portrait that would express something important about their personalities These self-portraits were rated using four scoring levels
12 Cray-pas (colored oil pastels) a charcoal pencil Sufficient Uneven Minimal and Insufficient
ChChCharararracacacteteteririristststicicic ooofff wowoworkrkksss rararateteteddd ldquoSldquoSSufufu ficficccieieientntntrdquordquordquo bbbototothhh ofoffo ttt hehehe stststudududu enenenen tststsrsquorsquorsquo rererere spspspoononon seseesessss prprpp essesenenene teteteddd heheherererr sssshohohowewew ddd clclc eaeaeae rr ananandddd spspspp ecifiifififi cccc obobobseseservrvrvatatatioioionsnsns ttthahahaa tt cococommmmmm unununiciccatatatededed sssomomommetetethihihi ngngg immmm poop rtrtrtananan ttt ababbouououo ttt ththth eeee ararartitit stststs ThThThTh eyeyy iiincncncn ororo popoorararaa teteteedddd ididdeenentititit fyfyfyininingg dedede tata ilii iinn tetett rmrmrm ss ofofoff pppererrersososos nananana ll fefefeeatata ururu eses aandndd ininn sstutuudededentntt rerere spsppppononon seseee 11 ananann aaa ctctivivi itiityyy (a(a(artrtt mmm akaka inining)g)g) ThThheee seses lflfflflf -p-p-pororortrtrtrt aiaiaitststss shshshowowowow edeeded pppururu popoposeses efufuffu lll usussu eee ofofof cccommompopoosisis tititt ononon alal eeelelemememme ntntntsss anann ddddd sososososso phphphphphp isssisstitttiticacacacateteteedddd usussuseee ofofof mmm atataterereriaiaiaalssl FoFoFo rr exexexe amamamm plplplpleee iinnn ststststudududeneneenttt rerereespspspp onononnsesese 111 hthththh eee smsmms udududu gigigigg ngngngn g ooofff CrCrCrCr ayayayy-p-p-pasasas cccrerereatatatatededed anananan aaaaffiffiffiffininininitytyty aaamomomoo ngngng tttt hehehehee hhhheaeaeaaee ddddd aaa rmrmrm ananana ddd hahahandndnddn ananana ddd lolooolo oosoososeee wewewewe lllll-p-p-p-pp lalalaacececece dddd lililiinenenenesssss adadadadd dedededdeddddd dededed fifinfinnfinitititioioionnn tototoo ttthehehee bbbb ododododo yyy
Percentage of students in each response category at grade 8 2008
BoBoBoBBothththth wwworororoorksksksk aaaaalslslslsooo shshhs howwowowedeede vvvererere yyyyy gogogoododod uuu sesese ooofff prprpropopo ororortititionnno n cocococoo lololorrr aaaaandndnd lll inininn eeee aaandndndd wwwererer eee fuufullllllyyy dededevevev lololopepep dd anananndd nininindididid vivividududualalalizizizizi ededededded FoFoFoF rrr exexexxamamamamplpleee iiinnn stststududdenene n ttt rerere spspps onononn seseee 222222 thhhhhhthhththhhhth e stststs udududd enenenntt skskkk liliii lfflflflf ululullylyly uuuseseseseedddd cocococo lolorrr tototo eempmpmmp hahhah sisisizezez aaa ndndndndn cccrerere atatat eeeeeee cococo ntntnttrarraaststs bbbetetetwewewewe eenenn sssspepepppecicicificficficfic pppp araara tstst s ooff heherrr seseselflfl -p-pp ororor trtrtraiaiaittt BoBoBoBothththh sss tututudededed nntntn rrresesespopoo nsnsnsn eses 11 aaandndndnd 222 aalslslsooo shsshshowowededed eeevivivvvidededeencnccccncncncccc e ofoffof ttttheheehh sss tututudededed ntntntntsss hahahah vivivingngng ssspepeepentntntnt tttimimimeee obobob seseservrvinini gggg thththeee KoKoKolllll wwiwwww tz anana ddd ScScScSchihihielele ee seses lflflf-p-p-porororortrtrrtrraiaiaitststs FoFoFoFooururr pppererercececentntnt ooo fff stststudududenenntstststsrsquorsquorsquorsquo sssesss lfshypopopoortrtrt rararaaitititsss wewewererere rrratatatededed ldquoldquoSuSuSuu ffiffifficicciennee ttrdquordquordquo
1
2
Sufficient Uneven Minimal Insufficient Omitted
4 25 57 14 Rounds to zero NOTE Detail may not sum to totals because the percentage of responses rated as ldquoOff-taskrdquo is not shown Off-task responses are those that do not provide any information related to the assessment task SOURCE US Department of Education Institute of Education Sciences National Center for Education Statistics National Assessment of Educational Progress (NAEP) 2008 Arts Assessshyment
32 THE NATIONrsquoS REPORT CARD
Works at the ldquoUnevenrdquo level made some specific observations They sometimes employed pertinent compositional elements gave attention to details such as facial features to convey expression andor effectively used materials to communicate However ldquoUnevenrdquo works were typically inconsistent or incomplete in parts
In the sample presented here the student gave her work individuality by vivid use of color facial expression and the symbols incorporated in her jewelry and the background However elements of her work seem inconsistent and lacking in deliberation such as the placement and rendering of the symbols and colors in the background Twenty-five percent of studentsrsquo self-portraits were rated ldquoUnevenrdquo
As with many works rated at the ldquoMinimalrdquo level in the sample self-portrait shown here efforts at specific observations were apparent but relatively minimal (the red lines in the eyes) Compositional successes may seem more accidental than deliberate and use of materials was unskilled For example while this student may have been attempting to convey some sense of an individual person by emphasizing only his eyes and mouth with color he lacked the skill to make this choice distinctive enough to convey his message Fifty-seven percent of studentsrsquo self-portraits were rated ldquoMinimalrdquo
Most self-portraits rated ldquoInsufficientrdquo were generally so schematic as to convey little or nothing about the student Like the sample self-portrait shown here they showed unspecific observation little awareness of composition and highly unskilled use of materials In contrast to the ldquoMinimalrdquo response there were no features in this self-portrait that conveyed anything specific about a person and it remained at a general level Fourteen percent of studentsrsquo self-portraits were rated ldquoInsufficientrdquo
33ARTS 2008
Sampling and Weighting The schools and students who participate in NAEP assessments are selected to form a representative sample of the nation The national sample of eighth-graders in the 2008 arts assessment was chosen using a multistage design that involved drawing students from the sampled public and private schools across the country The results from the assessed students were combined to provide accurate estimates of the overall performance of students in the nation
Each school that participated in the assessment and each student assessed represents a portion of the population of interest Results are weighted to make appropriate inferences between the student samples and the respective populations from which they are drawn Sampling weights are adjusted for the disproportionate representation of some groups in the selected sample This includes the oversampling of schools with high concentrations of students from certain racialethnic groups and the lower sampling rates of students who attend very small schools
School and Student Participation Rates The school and student participation rates for public and private schools in the 2008 arts assessment are provided in table A-1
NCES statistical standards require that a nonresponse bias analysis be conducted for any school or student group with a participation rate that falls below 85 percent The participation rates for the 2008 NAEP arts assessment indicated a need for a school nonresponse bias analysis for the private school sample The results showed that school substitution and nonresponse adjustments were not effective in reducing nonresponse bias for the percentage of Hispanic students enrolled and type of private schools (Catholic and other private schools) The disproportionate nonresponse resulted
in an overestimation of the percentage of Hispanic students an overestimation of the percentage of Catholic school students and an underestimation of the percentage of other private school students
Table A-1 School and student participation rates in NAEP arts at grade 8 by subject and type of school 2008
Subject and type of school
Music
Nation
Public
Private
Visual arts
Nation
Public
Private
School participation Student participation
Number of Number of schools Weighted students Weighted
participating percent assessed percent
260 97 4000 93
220 99 3400 93
30 76 500 97
260 97 3900 92
220 99 3400 92
30 76 500 94
NOTE The numbers of schools are rounded to the nearest ten and the numbers of students are rounded to the nearest hundred Detail may not sum to totals because of rounding SOURCE US Department of Education Institute of Education Sciences National Center for Education Statistics National Assessment of Educational Progress (NAEP) 2008 Arts Assessment
Interpreting Statistical Signifi cance Comparisons over time or between groups in this report are based on statistical significance at the 05 level using t-tests with appropriate adjustments for multiple comparisons (using the False Discovery Rate procedure) These statistical tests consider both the size of the differences and standard errors of the two statistics being compared Standard errors are margins of error and estimates based on smaller groups are likely to have larger margins of error relative to estimates based on larger groups Note for example that differences based on schoolshyadministrator-reported estimates have smaller sample sizes than differences based on student-reported estimates resulting in smaller signifi cant differences in the student-reported data than in the
THE NATIONrsquoS REPORT CARD 34
school-administrator-reported data The size of the standard errors may also be influenced by other factors such as how representative the students assessed are of the entire population
When an estimate has a large standard error a numerical difference that seems large may not be statistically significant Differences of the same magnitude may or may not be statistically significant depending upon the size of the standard errors of the estimates For example a 10-point difference between male and female students may be statistically significant while a 10-point difference between students attending public and private schools may not be Standard errors for the estimates presented in this report are available at httpncesedgovnationsreportcardnaepdata and on the 2008 arts results website at http nationsreportcardgovarts_2008
National School Lunch Program NAEP collects data on student eligibility for the National School Lunch Program (NSLP) as an indicator of poverty Under the guidelines of NSLP children from families with incomes below 130 percent of the poverty level are eligible for free meals Those from families with incomes between 130 and 185 percent of the poverty level are eligible for reduced-price meals (For the period July 1 2007 through June 30 2008 for a family of four 130 percent of the poverty level was an annual income of $27000 and 185 percent was $38000) For more information on NSLP visit httpwww fnsusdagovcndlunch
School Location Results of the 2008 NAEP arts assessment were reported for four mutually exclusive categories of school location These categories are based on standard definitions established by the Federal Office of Management and Budget using population and geographic information from the US Census Bureau The classification system is referred to as ldquourban-centric locale codesrdquo which classifies territory into four major types
city suburb town and rural More details on the classification system can be found at httpnces edgovccdrural_localesasp
The Creating Task Score Studentsrsquo performance on questions assessing the creating process in visual arts is presented as the average creating task score in this report The creating task score for each creating question (task) is the sum of the percentage of students receiving full credit and a fraction of the percentage of students receiving partial credit The individual scores are then averaged together to report an average creating task score for the entire set of the visual arts creating questions
An example of computing the creating task score is provided below for a sample question in this report that asks eighth-graders to draw a self-portrait Responses to this question were scored ldquoSufficientrdquo ldquoUnevenrdquo ldquoMinimalrdquo or ldquoInsufficientrdquo The percentages of students falling into these four scoring levels are 4 percent 25 percent 57 percent and 14 percent respectively (table A-2) Responses at these four levels receive
1score weights of 1 23 and 0 respectively The
3creating task score for this question is computed as 1 (4) + 2 (25) + 1 (57) + 0 (14) = 403 3
Table A-2 Example showing how the creating task score was computed for a sample question in NAEP visual arts at grade 8 2008
Percentage Percentage of of students times
Scoring level students Score weight score weight
Sufficient 4 1 4
Uneven 25 2 3 17
Minimal 57 1 3 19
Insufficient 14 0 0
Creating task score (4 + 17 + 19 + 0) = 40
SOURCE US Department of Education Institute of Education Sciences National Center for Education Statistics National Assessment of Educational Progress (NAEP) 2008 Arts Assessment
ARTS 2008 3535
Comparing Results Between the 1997 and 2008 Assessments Although the assessment questions adminshyistered in 2008 were selected from those used in the 1997 assessment due to changes in scoring procedures and materials the 2008 score results in music and visual arts could not be directly compared to the results in 1997
In the 2008 arts assessment the scoring guides for constructed-response questions the sample questions and student responses used to train scorers and the standardized training procedures were updated to refl ect changes in training and scoring procedures that have been adapted for use across all NAEP assessments since 1997 In addition because the student artwork used as training samples for visual arts in 1997 had degraded over time and because of differences in the availability of certain types of art supplies and tools between 1997 and 2008 new samples were developed for scoring studentsrsquo responses to the creating questions in 2008
However since the scoring method for multiple-choice questions was the same in 1997 and 2008 direct comparisons could be made between the two years on results for these questions in music and visual arts (tables A-3 and A-4) Because multiple-choice questions were only a portion of the assessment and only assessed certain types of topics in the responding process of music and visual arts the changes in studentsrsquo performance between 1997 and 2008 on these questions did not represent the performance changes for the constructed-response questions or the entire assessment
Table A-3 Percentage correct for multiple-choice questions in NAEP music at grade 8 1997 and 2008
Percent correct
Question description 1997 2008
Overall 53 51
Identify directional contour of part of melodic phrase 79 77
Identify form of vocal music in a recording (musical excerpt 1) 78 76
Identify the type of instrumental ensemble performing an excerpt 75 71
Identify form of musical examples as theme and variations 64 64
Identify a bass clef symbol 63 62
Identify pitch contour of melody in a recording 63 56
Identify saxophone as instrument playing melody 66 56
Identify a half note in printed music 52 56
Identify a correct time signature for a piece of printed music 55 52
Select a line drawing refl ective of the texture of an example of music 52 52
Identify the solo instrument beginning ldquoRhapsody in Bluerdquo 52 50
Identify form of vocal music in a recording (musical excerpt 2) 60 49
Identify an appropriate texture drawing for a homophonic excerpt 51 48
Identify term best describing the texture 47 47
Identify an appropriate description of the texture of a recorded excerpt 50 44
Identify correct time signature for recorded excerpt 42 43
Identify the name of a pitch shown in the treble clef 42 41
Identify an octave interval in a printed score 37 38
Identify the term for fermata symbol 38 33
Identify which voices enter fi rst in a choral excerpt 32 28
Identify the quality of a triad in a printed score 15 21 Significantly different (p lt 05) from 2008 SOURCE US Department of Education Institute of Education Sciences National Center for Education Statistics National Assessment of Educational Progress (NAEP) 1997 and 2008 Arts Assessments
Table A-4 Percentage correct for multiple-choice questions in NAEP visual arts at grade 8 1997 and 2008
Percent correct
Question description 1997 2008
Overall 42 42
Identify purpose of insulating package material 61 62
Identify an example of 20th-century western art 55 59
Infer from photograph advantages of shrink-wrap packaging 57 57
Identify an example of a Renaissance painting 48 50
Identify compositional emphasis in a Bearden collage 49 46
Identify genre of a Bearden collage 34 37
Identify a technical similarity between Schiele and Kollwitz self-portraits 36 37
Identify an important compositional aspect of a Kollwitz self-portrait 40 37
Identify a stylistic emphasis in a Bearden collage 29 35
Identify a compositional feature of a medieval artwork 39 32
Identify the style of an artwork as surrealism 27 31
Identify an artistic style that infl uenced cubism 25 23 Significantly different (p lt 05) from 2008 SOURCE US Department of Education Institute of Education Sciences National Center for Education Statistics National Assessment of Educational Progress (NAEP) 1997 and 2008 Arts Assessments
THE NATIONrsquoS REPORT CARD 36
Table A-5 Percentage of students in NAEP arts assessment at grade 8 by selected student and school characteristics 2008
Student characteristics Music Visual arts
SD andor ELL
Identified 17 17
Excluded 2 2
Assessed 15 16
Without accommodations 6 6
With accommodations 8 10
SD
Identified 12 12
Excluded 1 2
Assessed 10 11
Without accommodations 3 2
With accommodations 7 8
ELL
Identified 6 6
Excluded 1 1
Assessed 5 6
Without accommodations 4 4
With accommodations 2 2 NOTE Students identified as both SD and ELL were counted only once under the combined SD andor ELL category but were counted separately under the SD and ELL categories Detail may not sum to totals because of rounding SOURCE US Department of Education Institute of Education Sciences National Center for Education Statistics National Assessment of Educational Progress (NAEP) 2008 Arts Assessment
Table A-6 Percentage of students with disabilities (SD) andor English language learners (ELL) identified excluded and assessed in NAEP music and visual arts at grade 8 as a percentage of all students 2008
NOTE Black includes African American Hispanic includes Latino and Pacific Islander includes Native Hawaiian Race categories exclude Hispanic origin Detail may not sum to totals because of rounding SOURCE US Department of Education Institute of Education Sciences National Center for Education Statistics National Assessment of Educational Progress (NAEP) 2008 Arts Assessment
Student and school characteristics Music Visual arts
Raceethnicity
White 61 61
Black 15 14
Hispanic 18 17
AsianPacific Islander 5 5
American IndianAlaska Native 1 2
Unclassified 1 1
Gender
Male 50 51
Female 50 49
Eligibility for freereduced-price school lunch
Eligible 36 37
Not eligible 57 56
Information not available 7 8
Type of school
Public 93 92
Private 7 8
School location
City 29 29
Suburb 37 36
Town 12 13
Rural 22 22
37ARTS 2008 37
u S d e p A r t M e n t o f e d u C A t i o n The National Assessment of Educational Progress (NAEP) is a congressionally authorized project sponsored by the US Department of Education The National Center for Education Statistics a department within the Institute of Education Sciences administers NAEP The Commissioner of Education Statistics is responsible by law for carrying out the NAEP project Arne Duncan John Easton Stuart Kerachsky Secretary Director Acting Commissioner US Department Institute of National Center for of Education Education Sciences Education Statistics
t h e n A t i o n A l A S S e S S M e n t g o V e r n i n g b o A r d In 1988 Congress created the National Assessment Governing Board to set policy for the National Assessment of Educational Progress commonly known as The Nations Report Card TM The Governing Board is an independent bipartisan group whose members include governors state legislators local and state school officials educators business representatives and members of the general public
Darvin M Winick Chair President Winick amp Associates Austin Texas
Amanda P Avallone Vice Chair Assistant Principal and Eighth-Grade Teacher
Summit Middle School Boulder Colorado
David J Alukonis Former Chairman Hudson School Board Hudson New Hampshire
Gregory Cizek Professor of Educational Measurement
University of North Carolina Chapel Hill North Carolina
Carol A DrsquoAmico President and Chief Executive Officer
Conexus Indiana Indianapolis Indiana
Honorable David P Driscoll Former Commissioner of Education
Massachusetts Department of Education
Malden Massachusetts
Louis M Fabrizio Director of Accountability Policy and Communications
North Carolina Department of Public Instruction
Raleigh North Carolina
Honorable Anitere Flores Member Florida House of Representatives Miami Florida
Alan J Friedman Consultant Museum Development and Science Communication
New York New York
David W Gordon County Superintendent of Schools Sacramento County Office of Education
Sacramento California
Robin C Hall Principal Beecher Hills Elementary School Atlanta Georgia
Kathi M King Twelfth-Grade Teacher Messalonskee High School Oakland Maine
Kim Kozbial-Hess Educational Technology Trainer Hawkins Elementary School Toledo Ohio
Henry Kranendonk Mathematics Curriculum Specialist Milwaukee Public Schools Milwaukee Wisconsin
James S Lanich President California Business for Education Excellence
Sacramento California
Honorable Cynthia L Nava Senator New Mexico State Senate Las Cruces New Mexico
Honorable Steven L Paine State Superintendent of Schools West Virginia Department of Education
Charleston West Virginia
Honorable Sonny Perdue Governor of Georgia Atlanta Georgia
Susan Pimentel Educational Consultant Hanover New Hampshire
Andrew C Porter Dean Graduate School of Education University of Pennsylvania Philadelphia Pennsylvania
Warren T Smith Sr Vice President Washington State Board of Education
Olympia Washington
Mary Frances Taymans SND Executive Director Secondary Schools Department National Catholic Educational Association
Washington DC
Oscar A Troncoso Principal Anthony High School Anthony Texas
Eileen L Weiser General Public Representative Ann Arbor Michigan
John Easton (Ex officio) Director Institute of Education Sciences US Department of Education Washington DC
Mary Crovo Interim Executive Director National Assessment Governing Board
Washington DC
t h e n a t i o n rsquo s r e p o r t c a r d
A r t s 2 0 0 8
M u s i c amp V i s u a l A r t s June 2009
M o r e i n f o r M A t i o n The report release site is httpnationsreportcardgov The NCES web electronic catalog is httpncesedgov pubsearch
For ordering information write to US Department of Education ED Pubs PO Box 1398 Jessup MD 20794-1398
or call toll free 1-877-4ED-Pubs
or order online at httpwwwedpubs org
S u g g e S t e d C i t A t i o n Keiper S Sandene BA Persky HR and Kuang M (2009) The Nationrsquos Report Card Arts 2008 Music amp Visual Arts (NCES 2009ndash488) National Center for Education Statistics Institute of Education Sciences US Department of Education Washington DC
C o n t A C t Emmanuel Sikali 202-502-7419 emmanuelsikaliedgov
ldquo t h e d e p A r t M e n t o f e d u C A t i o n rsquo S M i S S i o n i S t o p r o M o t e S t u d e n t A C h i e V e M e n t A n d p r e p A r A t i o n f o r g l o b A l C o M p e t i t i V e n e S S b y f o S t e r i n g e d u C A t i o n A l e x C e l l e n C e A n d e n S u r i n g e q u A l A C C e S S rdquo
wwwedgov
- Contents
- Executive Summary
- Introduction
- Music
-
- Eighty-nine-point score gap between lowest- and highest-performing students in music
- Racialethnic gender and socioeconomic gaps in music scores
- Music scores vary by type and location of schools
- Context for Arts Education in Music
- What Eighth-Graders Know and Can Do in Music
- Sample Questions for Music
-
- Visual Arts
-
- Eighty-nine-point score gap between lowest- and highest-performing students in visual arts
- Responding and creating results related
- Patterns in score gaps by student characteristics similar for responding to and creating visual arts
- No significant difference in responding scores between public and private school students
- Context for Arts Education in Visual Arts
- What Eighth-Graders Know and Can Do in Visual Arts
- Sample Questions for Visual Arts
-
- Technical Notes and Data Appendix13
- More Information
-
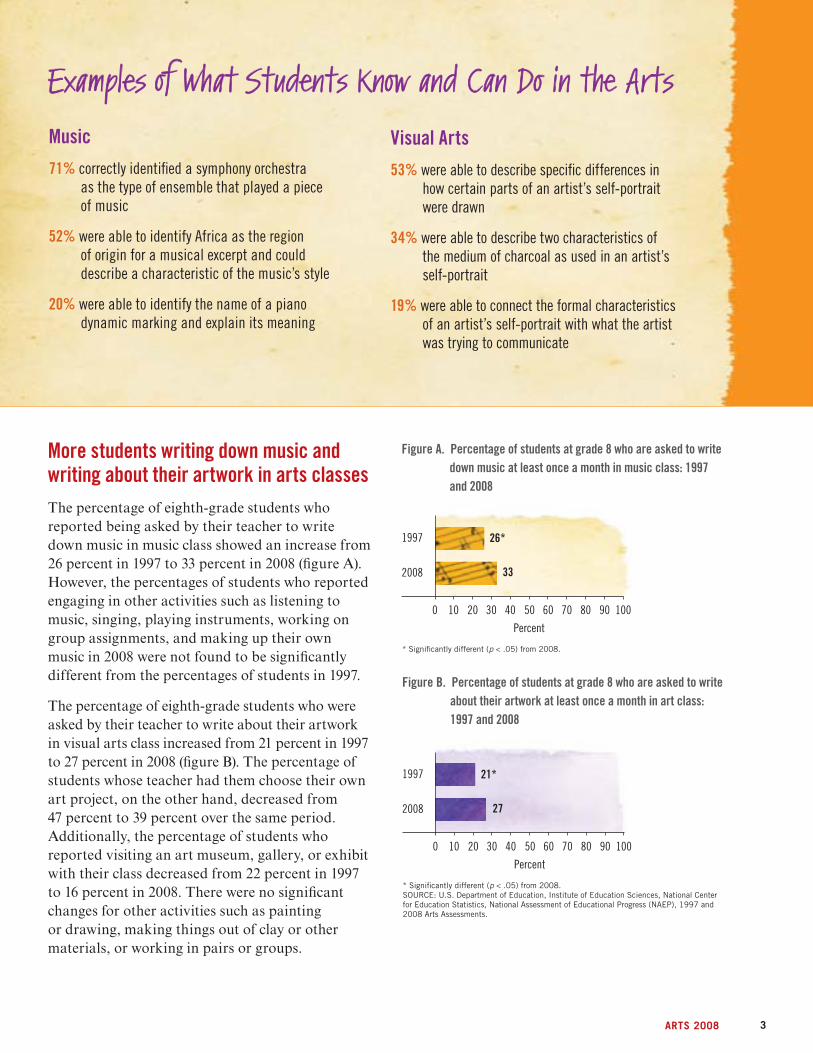
Music
71 correctly identifi ed a symphony orchestra as the type of ensemble that played a piece of music
52 were able to identify Africa as the region of origin for a musical excerpt and could describe a characteristic of the musicrsquos style
20 were able to identify the name of a piano dynamic marking and explain its meaning
Visual Arts
53 were able to describe specifi c differences in how certain parts of an artistrsquos self-portrait were drawn
34 were able to describe two characteristics of the medium of charcoal as used in an artistrsquos self-portrait
19 were able to connect the formal characteristics
More students writing down music and writing about their artwork in arts classes The percentage of eighth-grade students who reported being asked by their teacher to write down music in music class showed an increase from 26 percent in 1997 to 33 percent in 2008 (fi gure A) However the percentages of students who reported engaging in other activities such as listening to music singing playing instruments working on group assignments and making up their own music in 2008 were not found to be signifi cantly different from the percentages of students in 1997
The percentage of eighth-grade students who were asked by their teacher to write about their artwork in visual arts class increased from 21 percent in 1997 to 27 percent in 2008 (figure B) The percentage of students whose teacher had them choose their own art project on the other hand decreased from 47 percent to 39 percent over the same period Additionally the percentage of students who reported visiting an art museum gallery or exhibit with their class decreased from 22 percent in 1997 to 16 percent in 2008 There were no signifi cant changes for other activities such as painting or drawing making things out of clay or other materials or working in pairs or groups
of an artistrsquos self-portrait with what the artist was trying to communicate
Figure A Percentage of students at grade 8 who are asked to write down music at least once a month in music class 1997 and 2008
1997
2008 33
26
0 10 20 30 40 50 60 70 80 90 100
Percent
Significantly different (p lt 05) from 2008
Figure B Percentage of students at grade 8 who are asked to write about their artwork at least once a month in art class 1997 and 2008
1997
2008 27
21
0 10 20 30 40 50 60 70 80 90 100
Percent
Significantly different (p lt 05) from 2008 SOURCE US Department of Education Institute of Education Sciences National Center for Education Statistics National Assessment of Educational Progress (NAEP) 1997 and 2008 Arts Assessments
ARTS 2008 3
The 2008 NAEP arts assessment measured studentsrsquo knowledge and skills in the arts by asking them to observe describe analyze and evaluate existing works of music and visual art and to create original works of visual art
The Eighth-Grade Arts Assessment The Arts Framework The NAEP arts framework serves as the blueprint for the assessment describing the specifi c knowlshyedge and skills that should be assessed in the arts disciplines Developed under the guidance of the National Assessment Governing Board the framework reflects the input of arts educators artists assessment specialists policymakers representatives from the business community and members of the public The National Standards for Arts Education1 also served as an important reference in the development of the NAEP arts framework
The framework specifies that studentsrsquo arts knowledge and skills be measured in four arts disciplines dance music theatre and visual arts Additionally three arts processesmdashresponding creating and performingmdashare central to studentsrsquo experiences in these disciplines While the responding process refers to observing describing
1 National Standards for Arts Education (1994) Reston Virginia Music Educators National Conference
analyzing and evaluating works of art the creating process refers to expressing ideas and feelings in the form of an original work of art Due to budget constraints only the responding process in music and both the responding and creating processes in visual arts were assessed in 2008
To learn more about the arts framework visit httpwwwnagborgpublicationsframeworks arts-framework08pdf
Assessment Design Because of the breadth of content covered in the NAEP arts assessment each student was assessed in only one arts discipline either music or visual arts
The responding process in music and visual arts was assessed with multiple-choice questions and constructed-response questions that required students to produce answers of a few words or sentences The constructed-response questions that assessed the creating process included questions that required students to generate written answers and to create original works of visual art
THE NATIONrsquoS REPORT CARD 4
Scoring Studentsrsquo Work in the Arts One of the challenges of the arts assessment was scoring studentsrsquo work Specific scoring guides were developed for the responding questions in music and the responding and creating questions in visual arts Scorers were then trained to apply these criteria appropriately when evaluating studentsrsquo responses that demonstrated a wide range of skill levels in music and visual arts
The scoring guides for the sample questions presented in this report and other released questions from the assessment are available in the NAEP Questions Tool at httpncesedgov nationsreportcarditmrls
Reporting Arts Results The results in this report are based on a nationally representative sample of 7900 eighth-grade students from 260 public and private schools Approximately one-half of these students were assessed in music and the other half were assessed in visual arts
Because music and visual arts are two distinct disciplines results are reported separately for
each area and cannot be compared The average responding scores for music and visual arts are reported on two separate NAEP scales each ranging from 0 to 300 The average creating task score for visual arts is reported as the average percentage of the maximum possible score ranging from 0 to 100 The arts assessment results cannot be reported in terms of the NAEP achievement levels (Basic Profi cient and Advanced) given the complex and diverse nature of the assessment tasks both within and across the arts disciplines
Comparisons Between 1997 and 2008 Although the questions in the 2008 assessment were taken from those administered in the previous arts assessment in 1997 not all of the results can be compared between the two years (see the Technical Notes for more information) While comparisons across years cannot be made for the average responding and creating task scores the percentages of studentsrsquo correct responses to the multiple-choice questions in 2008 can be compared to those in 1997 These results are provided in appendix table A-3 for music and table A-4 for visual arts
ARTS 2008 5
Accommodations and Exclusions in NAEP Testing accommodations (for example providing students with extra testing time or administering the assessment to students individually rather than in a group) are made available for students with disabilities and for English language learners participating in NAEP Even with the availability of accommodations a portion of these students was excluded from the NAEP arts assessment by their schools In the 2008 arts assessment overall exclusion rates for students with disabilities andor English language learners were 2 percent of all students for music and for visual arts (see appendix table A-6)
More information about NAEPrsquos policy on the inclusion of special-needs students is available at httpncesedgovnationsreportcardabout inclusionasp
Interpreting Results NAEP uses widely accepted statistical standards for presenting and discussing results Findings are reported based on statistical significance at the 05 level using t-tests with appropriate adjustments for multiple comparisons (using the False Discovery Rate procedure) Results that are reported to be ldquohigherrdquo or ldquolowerrdquo have been found to be statistically signifi cant
In addition to the overall results for eighth-graders in the nation performance is presented for different student groups These results should not be used to establish a cause-and-effect relationship between background characteristics and achievement A complex mix of education and socioeconomic factors may affect student performance
For additional information about interpreting results see the Technical Notes section of this report or visit httpncesedgovnationsreportcard tdwanalysisinferasp
THE NATIONrsquoS REPORT CARD 6
7ARTS 2008
The 2008 arts assessment in music measured studentsrsquo ability to respond to music There were a total of four music sections in the arts assessment each of which contained between 8 and 16 multiple-choice and constructed-response (or open-ended) questions Many of the music questions in the assessment included multiple parts Each student who was assessed in music was presented with two of the four sections Because the length of the recorded music that was played for students varied in each section the amount of time provided for students to complete two music sections ranged from 58 minutes to 63 minutes
Students were asked to analyze and describe aspects of music they heard critique instrumental and vocal performances and demonstrate their knowledge of standard musical notation and musicrsquos role in society Examples of the different types of music questions are presented later in this section
8 THE NATIONrsquoS REPORT CARD
174
Eighty-nine-point score gap between lowest- and highest- performing students in music While the overall average responding score in music was set at 150 in 2008 students at grade 8 exhibited a wide range of responding scores (figure 1) For example scores ranged from 105 for lower-performing students at the 10th percentile to 194 for higher-performing students at the 90th percentile Students at the 50th percentile had a score of 151
SOURCE US Department of Education Institute of Education Sciences National Center for Education Statistics National Assessment of Educational Progress (NAEP) 2008 Arts Assessment
Figure 1 Average responding scale score and percentile scores in NAEP music at grade 8 2008
Overall 10th 25th 50th 75th 90th average score Percentile score
150
194
128
105
0
300 200
190
180
170
160
150
140
130
120
110
100
Scale score
151
174
A constructed-response question that asked
students to write two measures of rhythmic
music notation was included in one of the four
music sections Due to budget constraints this
was the only question in the assessment that
asked students to create music therefore an
average creating task score for music could not
be reported However results for this question
and other released questions from the 2008 arts
assessment are available at httpncesedgov
nationsreportcarditmrls
Creating Music
9ARTS 2008
Racialethnic gender and socioeconomic gaps in music scores
In addition to the overall average responding score In general the same patterns in score gaps seen in in music results are also available based on student other NAEP subjects were also evident in the results for characteristics such as raceethnicity gender and music (figure 2) The percentages of students in each eligibility for the National School Lunch Program student group can be found in appendix table A-5
RaceEthnicity In 2008 average responding scores in music for White and AsianPacific Islander students were 29 to 32 points higher than the scores for Black and Hispanic students There were no signifi cant differences between the average responding scores of White and AsianPacific Islander students or between the scores of Black and Hispanic students
Figure 2 Average responding scale score in NAEP music at grade 8 by selected student characteristics 2008
Scale score 300
200
190
180
170
160
150
140
130
120
110
0 White Black Hispanic Asian Male Female Eligible Not
Pacific eligible Islander
Raceethnicity
161
130 129
159
Gender
145
155
Eligibility for freereduced-price
school lunch
132
161
NOTE Black includes African American Hispanic includes Latino and Pacific Islander includes Native Hawaiian Race categories exclude Hispanic origin Sample sizes were insuffishycient to permit reliable estimates for students whose raceethnicity was American IndianAlaska Native or unclassified For the eligibility for freereduced-price school lunch category results are not shown for students whose eligibility status was not available SOURCE US Department of Education Institute of Education Sciences National Center for Education Statistics National Assessment of Educational Progress (NAEP) 2008 Arts Assessshyment
10 THE NATIONrsquoS REPORT CARD
Gender On average female students had a higher respondshying score in music than their male counterparts There was a 10-point gap between the two groups in 2008
Eligibility for FreeReduced-Price School Lunch NAEP uses studentsrsquo eligibility for the National School Lunch Program as an indicator of poverty
2 The score-point difference is based on the difference between the unrounded scores as opposed to the rounded scores shown in the fi gure
Students from lower-income families are typically eligible for freereduced-price school lunch (see the Technical Notes at the end of this report for eligibility criteria) while students from higher-income families typically are not On average the responding score for students who were eligible was 28 points2 lower than the score for students who were not eligible
Music scores vary by type and location of schools
Results by selected school characteristics also show based on the type of school or its location Differences differences in average responding scores for music in access to arts instruction and quality curricula (fi gure 3) It is important to note that there may be many socioeconomic status and other factors not measured reasons students performed differently on average in NAEP may influence student achievement in the arts
Type of School Public school students made up 93 percent of eighth-graders in the nation in 2008 while the other 7 percent of students attended private schools The average responding score in music for eighth-graders in public schools was 14 points lower than the score for students in private schools
School Location Results are available for four school location categories city suburb town and rural Descriptions of how these school location categories are defi ned are included in the Technical Notes section of this report
In 2008 eighth-graders who attended city schools had a lower average responding score in music than students who attended suburban town and rural schools There were no significant differences in the average scores among students in suburban town and rural school locations
Figure 3 Average responding scale score in NAEP music at grade 8 by selected school characteristics 2008
Scale score 300
200
190
180
170
160
150
140
130
120
110
0
School location
142
155 156 150
Type of school
149
163
Public Private City Suburb Town Rural
SOURCE US Department of Education Institute of Education Sciences National Center for Education Statistics National Assessment of Educational Progress (NAEP) 2008 Arts Assessment
11ARTS 2008
Context for Arts Education in Music Information collected from school and student on the availability and nature of music education in questionnaires helps to provide the context in which their schools Students provided information on their arts learning takes place For the music portion of the participation in music activities assessment school administrators provided information
Frequency of music instruction remains steady School administrators were asked how often eighth-graders attending their schools might receive instruction in music Fifty-seven percent of eighth-graders attended schools where students could have received music instruction at least three or four times a week in 2008 (figure 4) This was higher than the percentages of students attending schools where music was offered less frequently or not at all
Although the data are not shown here access to music instruction as reported by school administrators did not differ significantly by raceethnicity gender or eligibility for freereduced-price school lunch For example the percentage of Black students attending schools where music was offered at least 3 or 4 times a week was not significantly different from the percentage of White students
The same question was asked of school administrators in 1997 making it possible to look for changes in the instruction patterns over time The apparent increase between 1997 and 2008 in the percentage of students attending schools where music was available at least three or four times a week was not statistically significant nor were there any significant changes in the percentages of students attending schools where music was offered once or twice a week less than once a week or not at all
Figure 4 Percentage of students at grade 8 by school-reported frequency with which instruction in music is available 1997 and 2008
1997
2008
Once or twice a week 27
38
At least 3 or 4 times a week 57
43
9Subject not offered 8
Less than once a week
10
8
0 10 20 30 40 50 60 70 80 90 100
Percent
NOTE Detail may not sum to totals because of rounding SOURCE US Department of Education Institute of Education Sciences National Center for Education Statistics National Assessment of Educational Progress (NAEP) 1997 and 2008 Arts Assessments
71 percent of eighth-graders attended schools where administrators reported that their state or district had a curriculum in music in 2008
77 percent of students attended schools where music was taught by a full-time specialist
12 THE NATIONrsquoS REPORT CARD
More students writing down music in music class Students responded to a series of questions about how often they did certain activities in music class For each activity listed in figure 5 students indicated if they were asked by their teacher to do it almost every day once or twice a week once or twice a month or never or hardly ever Students were also given the option of indicating that they did not have music in school The results summarized here show the combined percentages for all eighth-grade students who reported that they did various music-related activities at least once a month
For the most part students were as likely to be asked by their teachers to engage in these musical activities in 2008 as in 1997 There were no significant changes in the percentages of students who reported that teachers played music for them to listen to or asked them to sing play an instrument work on group assignments or make up their own music Only the percentage of students who reported being asked to write down music showed a statistically significant increase from 26 percent in 1997 to 33 percent in 2008
About one-third of students participate in musical performance activities at school Students were also asked several questions about their participation in musical performance activities at school These included whether or not they played in a band played in an orchestra or sang in a chorus or choir Overall 34 percent of eighth-graders reported participating in one or more of these musical activities at school in 2008 (fi gure 6) Although questions about participation in these musical activities were also asked in 1997 changes in the format of the questions prohibit comparing results from the two years
Figure 5 Percentage of students at grade 8 by student-reported in-school activities their teachers ask them to do in music class at least once a month 1997 and 2008
16
17
36
26
33
28
28
30
49
51
35
33
Listen to music
Sing
Play instruments
Write down music
Work on group assignments
Make up own music 1997
2008
0 10 20 30 40 50 60 70 80 90 100
Percent
Significantly different (p lt 05) from 2008
Figure 6 Percentage of students at grade 8 by student-reported participation in musical activities in school 2008
Play in a band
Play in an orchestra
Sing in a chorus or choir
One or more of the three activities
17
34
16
5
0 10 20 30 40 50 60 70 80 90 100
Percent
NOTE Students were permitted to select more than one musical activity The percentage for the category ldquoOne or more of the three activitiesrdquo was derived from studentsrsquo responses to each of the other three categories and was not a separate option by itself SOURCE US Department of Education Institute of Education Sciences National Center for Education Statistics National Assessment of Educational Progress (NAEP) 1997 and 2008 Arts Assessments
13ARTS 2008
What Eighth-Graders Know and Can Do in Music The item map below is useful for understanding studentsrsquo performance at different points on the responding scale The scale scores on the left represent the average scores for students who were likely to get the questions correct or partially correct Scores for the 25th and 75th percentiles are also noted The descriptions of selected assessment questions are listed on the right
For example the map shows that higher-performing eighth-graders in the upper range of the scale with an average score of 265 were likely to be able to identify one element of jazz present in ldquoRhapsody
Grade 8 NAEP Music Responding Item Map
Scale score Question description
in Bluerdquo Middle-performing students with an average score of 163 were likely to be able to describe one feature of a song that identifies it as a spiritual
Constructed-response questions for which students could earn partial credit may appear on the map multiple times once for each level of credit For example a question asking students to provide the name of a piano dynamic marking and to explain its meaning appears at the score of 192 for responses receiving full credit and at 183 for responses receiving partial credit
300
275 Identify piece of music as coming from twentieth century and provide limited justifi cation why 265 Identify one element of jazz present in ldquoRhapsody in Bluerdquo
239 Describe an emotion or mood created by a composition and describe two ways in which emotion or mood was created
237 Provide a partial identifi cation and description of the errors in pitch in an instrumental solo
230 Describe a similarity and a difference between two written vocal parts
228 Identify the solo instrument beginning ldquoRhapsody in Bluerdquo (page 17)
225 Provide a comparison between the tone color of two different singers
195 Select a line drawing refl ective of the texture of an example of music (page 15)
195 Identify the term for a fermata symbol
192 Identify the name of a piano dynamic marking and explain its meaning (page 16)
183 Either identify the name of a piano dynamic marking or explain its meaning (page 16)
182 Provide a limited explanation of why spirituals were important in peoplersquos lives
176 Identify a correct time signature for a piece of music
172 Identify region of origin of African musical excerpt and provide a description of a characteristic related to its style (page 18)
167 Identify a bass clef symbol
166 Identify the type of instrumental ensemble performing an excerpt
163 Describe one feature of a song that identifi es it as a spiritual
151 Identify the length of the introduction of ldquoShalom My Friendsrdquo
136 Identify directional contour of part of melodic phrase
124 Identify region of origin of African musical excerpt and provide partial explanation of its style characteristics (page 18)
84 Describe an emotion or mood created by a composition 49 Identify region of origin of African musical excerpt (page 18)
0
174 75th percentile
128 25th percentile
NOTE Regular type denotes a constructed-response question Italic type denotes a multiple-choice question The position of a question on the scale represents the average scale score attained by students who had a 65 percent probability of obtaining credit at a specific level of a constructed-response question or a 74 percent probability of correctly answering a four-option multiple-choice question SOURCE US Department of Education Institute of Education Sciences National Center for Education Statistics National Assessment of Educational Progress (NAEP) 2008 Arts Assessment
14 THE NATIONrsquoS REPORT CARD
A
SAMPLE QUESTION Identifying the Texture of a Musical Example The sample question below asked students to identify the texture of a musical example that was played (The term ldquotexturerdquo was defined for the students as the blend of various musical sounds and the ways in which the lines of music in a piece are related)
The music played for this question came from the beginning of ldquoContrapunctus 4rdquo from The Art of the Fugue by JS Bach In the recording the fugue was played by a brass quartet The fugue begins with one instrument entering and playing the subject (the initial melody) of the fugue followed by the other members of the quartet each playing the melody The audio for this question is available in the NAEP Questions Tool at httpncesedgov nationsreportcarditmrls
Each of the four diagrams below illustrates an example of a texture that could occur in a piece of music In 2008 fifty-two percent of eighth-graders selected the correct answer (choice A) which shows the general pattern of musical lines that occurred in the music that was played This was not found to be significantly different from the 52 percent who answered correctly in 1997 The other three choices are incorrect because they show patterns of musical lines that did not match the music that was played Choice B shows a group of three voices in alternation with a solo line choice C shows an alternation of two lines with no accompanying lines or voices and choice D shows a solo line with a block chord accompaniment
Percentage of students in each response category at grade 8 2008
Choice A Choice B Choice C Choice D Omitted
52 18 5 25 Rounds to zero NOTE Detail may not sum to totals because of rounding SOURCE US Department of Education Institute of Education Sciences National Center for Education Statistics National Assessment of Educational Progress (NAEP) 2008 Arts Assessment
Which diagram best illustrates the texture of the music
B
DC
AAAAAAAAAAAAAAAAAAAAAAAA
15ARTS 2008
SAMPLE QUESTION Reading Musical NotationThis two-part sample question was taken from a set of questions that asked students to demonstrate knowledge of standard musical notation In the question below students were asked to provide the name and meaning of the symbol indicated in circle 1 in the music shown here No recorded music was played for this question The question that pertains to the symbol indicated in circle 2 is not
shown here but is available in the NAEP Questions Tool at httpncesedgovnationsreportcarditmrls
Student responses for this two-part question were rated using three scoring levels Adequate Limited and Inadequate Examples of Adequate and Limited responses are shown here Inadequate responses failed to provide correct information for either part of the question
Adequate Limited Inadequate Omitted
20 9 62 Rounds to zero NOTE Detail may not sum to totals because the percentage of responses rated as ldquoOff-taskrdquo is not shown Off-task responses are those that do not provide any information related to the assessment taskSOURCE US Department of Education Institute of Education Sciences National Center for Education Statistics National Assessment of Educational Progress (NAEP) 2008 Arts Assess-ment
Percentage of students in each response category at grade 8 2008
1
2
What does the symbol in circle 1 tell the performer to do
What is the musical (Italian) name for the symbol in circle 1
This sample response was rated ldquoAdequaterdquo because it provided the symbolrsquos meaning (that the music should be performed softly) and the symbolrsquos correct name (piano) Twenty percent of eighth-graders received a rating of ldquoAdequaterdquo on this question
This sample response was rated ldquoLimitedrdquo because it provided the symbolrsquos meaning but not its correct name (Pianissimo refers to the symbol pp which indicates that music should be performed very softly) Nine percent of studentsrsquo responses to this question were rated ldquoLimitedrdquo
What does the symbol in circle 1 tell the performer to do
What is the musical (Italian) name for the symbol in circle 1
16 THE NATIONrsquoS REPORT CARD
D
At the beginning of the piece a solo is played on
a flute
an oboe
a saxophone
a clarinet
A
B
C
DDDDDDDDD
SAMPLE QUESTION Identifying the Sound of an Instrument The sample question below asked students to identify the sound of an instrument The music played for this question comes from the opening of ldquoRhapsody in Bluerdquo by American composer George Gershwin The audio is available in the NAEP Questions Tool at httpncesedgov nationsreportcarditmrls
In 2008 fifty percent of eighth-graders correctly identified the clarinet as the instrument on which the solo was played (choice D) This was not found to be significantly different from the 52 percent who answered correctly in 1997 Choices A B and C are also woodwind instruments like the clarinet but were not the instrument on which the solo at the beginning of the piece was played
Choice A Choice B Choice C Choice D Omitted
12 15 22 50 Rounds to zero NOTE Detail may not sum to totals because of rounding SOURCE US Department of Education Institute of Education Sciences National Center for Education Statistics National Assessment of Educational Progress (NAEP) 2008 Arts Assessshyment
Percentage of students in each response category at grade 8 2008
17ARTS 2008
D
D
SAMPLE QUESTION Identifying Origin of a Musical Style The two-part sample question below asked students to identify music from a particular culture and to describe the features that help to characterize its style The music played for this question came from an African song entitled ldquoDrodoperdquo The audio is available in the NAEP Questions Tool at httpncesedgovnationsreportcarditmrls
Student responses for this two-part question were rated using four scoring levels Developed Adequate Limited and Inadequate Examples of Developed and Adequate responses are shown here Responses rated as Limited only provided a correct response to the first part of the question Responses rated as Inadequate failed to provide a correct response for either part of the question
This sample response was rated ldquoDevelopedrdquo because it both indicated the correct region of origin of the music and cited the ldquocall and responserdquo feature of the music that is common among many types of African songs Mentioning the use of specific percussion instruments such as drums also contributed to this response receiving a rating of ldquoDevelopedrdquo Fifty-two percent of eighth-graders received a rating of ldquoDevelopedrdquo on this question
From where does the music come
North America
South America
Asia
Africa
Other than the language used in the song describe one feature of the music that helps to identify it as coming from the part of the world you selected Be specific in your description
A
B
C
DDDDDDDDDDDDDDDDDD
From where does the music come
North America
South America
Asia
Africa
Other than the language used in the song describe one feature of the music that helps to identify it as coming from the part of the world you selected Be specific in your description
A
B
C
This sample response was rated ldquoAdequaterdquo Although it indicated the correct region of origin of the music the description of a feature of the music was vague Twenty-four percent of studentsrsquo responses to this question were rated ldquoAdequaterdquo
DDDDDDDDDDDDDDDDDDDDDDDDDDDD
Percentage of students in each response category at grade 8 2008
Developed Adequate Limited Inadequate Omitted
52 24 19 5 Rounds to zero NOTE Detail may not sum to totals because the percentage of responses rated as ldquoOff-taskrdquo is not shown Off-task responses are those that do not provide any information related to the assessment task SOURCE US Department of Education Institute of Education Sciences National Center for Education Statistics National Assessment of Educational Progress (NAEP) 2008 Arts Assessshyment
18 THE NATIONrsquoS REPORT CARD
19ARTS 2008
The 2008 arts assessment included four sections in visual arts that measured studentsrsquo ability to respond to and create visual art Students were given two of the four sections each of which contained between 7 and 11 multiple-choice and constructed-response questions Many of the visual arts questions in the assessment contained multiple parts The amount of time provided for students to complete two visual arts sections ranged from 75 minutes to 104 minutes
Responding questions asked students to analyze and describe works of art and design thereby demonstrating their knowledge of media and techniques visual organization the cultural contexts of artworks how works of art convey meaning and the relationship between form and function in design Creating questions assessed studentsrsquo ability to communicate in works of art think of different solutions to visual problems and generate ideas for and then create works of art and design These creating questions represented approximately one-half of the total assessment time in visual arts Some examples of the different types of visual arts questions are presented later in this section
20 THE NATIONrsquoS REPORT CARD
Eighty-nine-point score gap between lowest- and highest- performing students in visual arts The overall average responding score for visual arts was set at 150 in 2008 (figure 7) In addition to the overall average responding score results are shown for students at selected percentiles on the responding scale There was an 89-point gap between the scores for students at the 10th and 90th percentiles
The assessment also included questions that asked students to create works of art and design Results for these questions are presented as the average creating task score which is expressed as the average percentage of the maximum possible score ranging from 0 to 100 (see the Technical Notes for an explanation of how the score was calculated) In 2008 the overall average creating task score for grade 8 students was 52 (fi gure 8)
Responding and creating results related Because the NAEP arts framework describes the integration among the arts processes it is useful to explore the relationship between studentsrsquo results on the responding and creating questions in visual arts On average students who performed well on the responding questions also performed well on the creating questions (figure 9) For example students performing above the 75th percentile on the responding scale also had the highest average creating task score (62) Lower-performing students at or below the 25th percentile on the responding scale had the lowest average creating task score (40)
Figure 7 Average responding scale score and percentile scores in NAEP visual arts at grade 8 2008
150
104
174
300 200
190
180
170
160
150
140
130
120
110
Scale score
193
152
128
Overall 10th 25th 50th 75th 90th average score Percentile score
100
0
Figure 8 Average creating task score in NAEP visual arts at grade 8 2008
Overall 52
0 10 20 30 40 50 60 70 80 90 100
Percent of maximum score
Figure 9 Average creating task score in NAEP visual arts at grade 8 by responding score level 2008
Responding score level
Lower (lt 25th percentile)
Lower-middle (25thndash50th percentiles)
Upper-middle (50thndash75th percentiles)
Upper (gt 75th percentile)
Average creating task score
50
40
62
55
0 10 20 30 40 50 60 70 80 90 100
Percent of maximum score
SOURCE US Department of Education Institute of Education Sciences National Center for Education Statisshytics National Assessment of Educational Progress (NAEP) 2008 Arts Assessment
21ARTS 2008
Race ethnicity
54
55
46
43
49
Black
Hispanic
AsianPacific Islander
Male
White
Gender
Eligibility for free
reduced-price school lunch
54
55
46 Eligible
Not eligible
Female
Patterns in score gaps by student characteristics similar for responding to and creating visual arts
In general patterns in score differences based on student characteristics were similar for results in both responding (fi gure 10) and creating (fi gure 11)
130
120
110
RaceEthnicity In 2008 average responding scores in visual arts were 22 to 31 points higher for White and AsianPacifi c Islander students than for Black and Hispanic students There were no signifi cant differences between the average responding scores of White and AsianPacific Islander students or between the scores of Black and Hispanic students
Similarly the average creating task scores of White and AsianPacific Islander students were higher than the scores of Black and Hispanic students but there were no significant differences between the scores of White and AsianPacific Islander students or between the scores of Black and Hispanic students
Gender On average female eighth-graders had a higher responding score in visual arts than their male counterparts There was an 11-point3 gap between the two groups in 2008 The average creating task score for female students was also 5 points higher than the score for male students
Eligibility for FreeReduced-Price School Lunch On average eighth-graders who were eligible for free reduced-price school lunch had a lower responding score in visual arts than those who were not eligible There was a 29-point gap between the two groups in 2008 Students who were eligible also had an average creating task score that was 9 points lower than the score for students who were not eligible
3 The score-point gap is based on the difference between the unrounded scores as opposed to the rounded scores shown in the fi gure
Figure 10 Average responding scale score in NAEP visual arts at
200
190
180
170
160
150
140
Raceethnicity
160
129 134
156
Gender
145
155
300 Scale score
Eligibility for freereduced-price
school lunch
132
161
grade 8 by selected student characteristics 2008
0 White Black Hispanic Asian Male Female Eligible Not
Pacific eligible Islander
Figure 11 Average creating task score in NAEP visual arts at grade 8 by selected student characteristics 2008
0 10 20 30 40 50 60 70 80 90 100
Percent of maximum score
NOTE Black includes African American Hispanic includes Latino and Pacifi c Islander includes Native Hawaiian Race categories exclude Hispanic origin Sample sizes were insufshyficient to permit reliable estimates for students whose raceethnicity was American Indian Alaska Native or unclassified For the eligibility for freereduced-price school lunch category results are not shown for students whose eligibility status was not available SOURCE US Department of Education Institute of Education Sciences National Center for Education Statistics National Assessment of Educational Progress (NAEP) 2008 Arts Assessment
22 THE NATIONrsquoS REPORT CARD
No signifi cant difference in responding scores between public and private school students
While the general patterns in results for responding not all the apparent differences were found to be to and creating visual arts by selected school statistically signifi cant characteristics were similar (fi gures 12 and 13)
Type of School The apparent difference in 2008 between the average responding scores in visual arts for eighth-graders in public and private schools was not found to be statistically significant However the average creating task score was lower for public school students than for private school students
School Location Students attending suburban schools in 2008 had a higher average responding score in visual arts than students in city schools There were no significant differences in the average responding scores between students from suburban schools and town or rural schools
In the creating process of visual arts students attending suburban schools had a higher average creating task score than students in both city and town schools The average creating task score of students in suburban schools was not signifi cantly different from the score of students in rural schools
Because responding results are presented as scale scores and creating results are presented as average percentages it is not possible to compare the magnitude of differences between these scores For example an 11-point difference on the 0ndash300 responding scale between students attending schools in city and suburban locations is not necessarily greater than a 5-point difference between the same two groups on the 0ndash100 creating task scale
Figure 12 Average responding scale score in NAEP visual arts at grade 8 by selected school characteristics 2008
140
130
120
110
0 Public Private
200
190
180
170
160
150
City Suburb Town Rural
School location
144
155 149 151
Type of school
149
159
300 Scale score
Figure 13 Average creating task score in NAEP visual arts at
City
Suburb
Town
Rural
School location
52
49
50
54
Public
Private
Type of school 60
51
grade 8 by selected school characteristics 2008
0 10 20 30 40 50 60 70 80 90 100
Percent of maximum score
SOURCE US Department of Education Institute of Education Sciences National Center for Education Statistics National Assessment of Educational Progress (NAEP) 2008 Arts Assessment
23ARTS 2008
Context for Arts Education in Visual Arts To provide the context in which arts learning takes and nature of visual arts education in their schools place results are presented here based on school and studentsrsquo responses about their participation in administratorsrsquo responses related to the availability visual arts activities
Frequency of visual arts instruction remains steady School administrators were asked how often eighth-graders attending their schools might receive instruction in visual arts Forty-seven percent of eighth-graders attended schools where students could possibly receive visual arts instruction at least three or four times a week in 2008 (fi gure 14) This was higher than the percentages of students attending schools where visual arts were offered less frequently or not at all
Although the data are not shown here access to visual arts instruction did not differ significantly by race ethnicity gender or eligibility for freereduced-price school lunch For example the percentage of students who were eligible for freereduced-price school lunch attending schools where visual arts were offered once or twice a week was not significantly different from the percentage of students who were not eligible
The same question was asked of school administrators in 1997 making it possible to look for changes in the instruction patterns over time The results showed no significant changes between 1997 and 2008 in the percentages of students who attended schools where visual arts were available at least three or four times a week once or twice a week less than once a week or not at all
Figure 14 Percentage of students at grade 8 by school-reported frequency with which instruction in visual arts is available 1997 and 2008
1997
2008 47
52At least 3 or 4 times a week
30
25Once or twice
a week
5
10
Less than once a week
17
14
Subject not offered
0 10 20 30 40 50 60 70 80 90 100
Percent
NOTE Detail may not sum to totals because of rounding SOURCE US Department of Education Institute of Education Sciences National Center for Education Statistics National Assessment of Educational Progress (NAEP) 1997 and 2008 Arts Assessments
77 percent of eighth-graders attended schools where administrators reported that visual arts were taught by a full-time specialist
69 percent of students attended schools that followed a state or district curriculum in visual arts
24 THE NATIONrsquoS REPORT CARD
More students writing about their artwork
Students responded to a series of questions about how often they did certain activities in visual arts class For each activity listed in figure 15 students indicated if their teacher had them do it every day once a week once a month or never or hardly ever The results summarized here show the combined percentages for students who reported that they did various art-related activities at least once a month
The percentage of students who reported that their teacher had them write about their artwork increased from 21 percent in 1997 to 27 percent in 2008 However the percentage of students whose teacher had them choose their own art project decreased from 47 percent in 1997 to 39 percent in 2008 There were no significant changes between 1997 and 2008 in the percentages of students who reported that their teachers had them paint or draw make things out of clay or other materials work in a pair or group on an art project talk with others about their own or othersrsquo artwork or look at videotapes filmstrips slides or television programs about art
Fewer students visit art museums with class in 2008 Exposure to art museums and exhibits outside of school may help students learn about and engage in visual arts Sixteen percent of students in 2008 reported that they had gone with their class to an art museum gallery or exhibit at least once in the last year which was smaller than the 22 percent in 1997 (fi gure 16)
Although not presented here graphically 54 percent of eighth-graders reported that they or their teacher saved their artwork in a portfolio in 2008 which was not signifi cantly different from the 50 percent in 1997
About half of students save artwork in a portfolio
Figure 15 Percentage of students at grade 8 by student-reported in-school activities their teachers have them do in art at least once a month 1997 and 2008
45
43
21
27
50
43
39
47
41
38
80
80
53
40
Paint or draw
Make things out of clay or
other materials
Choose own art project
Work in a pair or a group on an
art project
Talk with others about own artwork or
that of other students
Write about own artwork
Look at videotapes filmstrips slides
or television programs about art
1997
2008
0 10 20 30 40 50 60 70 80 90 100
Percent
Significantly different (p lt 05) from 2008
Figure 16 Percentage of students at grade 8 who reported visiting an art museum gallery or exhibit with their class at least once a year 1997 and 2008
1997
2008 16
22
0 10 20 30 40 50 60 70 80 90 100
Percent
Significantly different (p lt 05) from 2008 SOURCE US Department of Education Institute of Education Sciences National Center for Education Statistics National Assessment of Educational Progress (NAEP) 1997 and 2008 Arts Assessments
25ARTS 2008
What Eighth-Graders Know and Can Do in Visual Arts The item map below is useful for understanding studentsrsquo performance at different points on the responding scale The scale scores on the left represent the average scores for students who were likely to get the questions correct or partially correct Scores for the 25th and 75th percentiles are also noted The descriptions of selected assessment questions are listed on the right
For example the map shows that higher-performing eighth-graders in the upper range of the scale with an average score of 237 were likely to be able
Grade 8 NAEP Visual Arts Responding Item Map Scale score Question description
to identify the style of an artwork as surrealism Middle-performing students with an average score of 144 were likely to be able to analyze the subject of five motherchild portraits of different genres
Constructed-response questions for which students could earn partial credit may appear on the map multiple times once for each level of credit For example a question asking students to describe two characteristics of charcoal in a self-portrait appears at the score of 201 for responses receiving full credit and at 134 for responses receiving partial credit
300
285 Support plausible interpretation of Schiele self-portrait with observations about style line and color 280 Explain how an unusualunexpected feature of a Bearden collage contributes to the work as a whole 256 Analyze and support with references to the work the narrative conveyed by a Bearden collage 241 Describe at least three aspects of own self-portrait that communicate something about you 240 Explain materials and design of own package idea for transporting fi sh on bicycle 237 Identify the style of an artwork as surrealism 229 Label and specifi cally describe one or two features of a Bearden collage that the artist wants you to notice 224 Identify a technical similarity between Schiele and Kollwitz self-portraits (page 28) 221 Explain how artist used light and shadow to create realism in motherchild portrait 220 Explain three ways an artist made some things look near and some far in motherchild portrait 213 Support plausible interpretation of Schiele self-portrait with observations about style line or color 205 Explain how Bearden creates contrast between interior and exterior areas in collage 202 Describe two aspects of own self-portrait that communicate something about you 201 Describe two characteristics of charcoal in Kollwitz self-portrait (page 29) 197 Identify an example of Renaissance art 197 Identify compositional emphasis in a Bearden collage 189 Identify an example of 20th century western art 176 Compare in specifi c terms how Kollwitz has drawn different parts of her self-portrait and offer plausible
interpretation for differences (pages 30 and 31) 176 Explain where artist has used light and shadow to create realism in motherchild portrait
172 Describe and support how memory of place is shown in own collage 170 Explain how artist used light to create a lack of realism in motherchild portrait 144 Analyze subject of fi ve motherchild portraits of different genres 136 Describe one aspect of own self-portrait that communicates something about you 134 Describe one characteristic of charcoal in Kollwitz self-portrait (page 29)
128 Identify an unusualunexpected feature of the Bearden collage 62 Describe memory of place andor aspect(s) of own collage 61 Describe what Schiele self-portrait is communicating or describe an aspect of style line or color
0
174 75th percentile
128 25th percentile
NOTE Regular type denotes a constructed-response question Italic type denotes a multiple-choice question The position of a question on the scale represents the average scale score attained by students who had a 65 percent probability of obtaining credit at a specific level of a constructed-response question or a 74 percent probability of correctly answering a four-option multiple-choice question SOURCE US Department of Education Institute of Education Sciences National Center for Education Statistics National Assessment of Educational Progress (NAEP) 2008 Arts Assessment
26 THE NATIONrsquoS REPORT CARD
Self-portrait B Egon Schiele Crayon and watercolor on buff paper Galerie St Etienne
Self-portrait A Kathe Kollwitz Charcoal on brown laid paper National Gallery of Art
Sample Questions for Visual Arts Students were asked a series of questions related to two self-portraits shown here one by Kathe Kollwitz (A) and one by Egon Schiele (B) These questions required students to apply their knowledge of aesthetic properties to the two artworks and to consider the relationships between these properties and the expressive qualities of each work Students were then asked to create a self-portrait of their own
27ARTS 2008
B
SAMPLE QUESTION Recognizing a Technical Similarity Between Two Self-Portraits
The sample question below asked students to recognize a technical similarity between the Kollwitz and Schiele self-portraits In both works
In 2008 thirty-seven percent of students correctly identified this common feature of the two artworks (choice B) This was not found to be significantly
expressive loose lines are combined with precise different from the 36 percent who answered drawing correctly in 1997 Choices A C and D do not
accurately describe technical similarities between the two works
Which statement describes a technical similarity between self-portraits A and B
The figure in each work is seen from the same point of view
Both works combine loose gestural lines with careful drawing
The compositions in both works are symmetrical
Both works rely on light and shadow to emphasize depth
A
C
D
BBBBBBBBBBBBBBBBBBBBBBBB
Choice A Choice B Choice C Choice D Omitted
8 37 8 46
Percentage of students in each response category at grade 8 2008
Rounds to zero NOTE Detail may not sum to totals because of rounding SOURCE US Department of Education Institute of Education Sciences National Center for Education Statistics National Assessment of Educational Progress (NAEP) 2008 Arts Assessshyment
28 THE NATIONrsquoS REPORT CARD
SAMPLE QUESTION Characteristics of Charcoal The sample question below asked students to Unacceptable Examples of Acceptable and Partial describe characteristics of the medium of charcoal responses are shown here Responses rated as visible in the Kollwitz self-portrait Student Unacceptable did not describe characteristics of the responses for this question were rated using medium of charcoal evident in the self-portrait three scoring levels Acceptable Partial and
This sample response was rated ldquoAcceptablerdquo because it demonstrated the studentrsquos knowledge of charcoal as a medium The student expressed what Kollwitz was able to accomplish with charcoal in her self-portrait Thirty-four percent of eighth-graders received a rating of ldquoAcceptablerdquo on this question
Self-portrait A is a charcoal drawing Describe two characteristics of charcoal that you see in self-portrait A
1
2
Acceptable Partial Unacceptable Omitted
34 38 27 1 NOTE Detail may not sum to totals because the percentage of responses rated as ldquoOff-taskrdquo is not shown Off-task responses are those that do not provide any information related to the assessment task SOURCE US Department of Education Institute of Education Sciences National Center for Education Statistics National Assessment of Educational Progress (NAEP) 2008 Arts Assessshyment
Percentage of students in each response category at grade 8 2008
This sample response was rated ldquoPartialrdquo because it provided only one example of how charcoal was used in the self-portrait The student recognized that pressing harder on charcoal results in a darker mark as is evident in the Kollwitz self-portrait However the second part of the response did not describe another characteristic of charcoal as a medium Thirty-eight percent of studentsrsquo responses to this question were rated ldquoPartialrdquo
Self-portrait A is a charcoal drawing Describe two characteristics of charcoal that you see in self-portrait A
1
2
29ARTS 2008
a s
SAMPLE QUESTION Relationship Between Technical Approach and Meaning
Both parts of this sample response were rated ldquoAcceptablerdquo This response accurately described the differences between the parts of the drawing and then used thesss eeee oooo bbbbsssseeeeerrrr vvvvvaaaattttiiiiii oooooo nnnnnnnsssssss tttttt ooooooo ooooooooffffffffffffffffeeeeeeeerrrrrr aaaaaaaannnnnnnn iiiiiiiinnnnnnnnssssssssiiiiiiiigggggggghhhhhhhhttttttttffffffffuuuuuuuullllllll andddd pllausible interpretation of the reasons for those differences
Fifty-three percent of students received a rating of ldquoAcceptablerdquo for part A and 19 percent received an ldquoAcceptablerdquo rating for part B Students who received the ldquoAcceptablerdquo rating were able to both comprehend
pthe formal characteristics of the self-portrait and discuss the relationship between those characteristics and the artistrsquos possible expressive goals
Look at self-portrait A Compare how Kollwitz has drawn her head and hand with the way she has drawn her arm Be specific
A
Explain what you think Kollwitz may have been trying to communicate about herself by drawing these different parts of her self-portrait in different ways
B
THE NATIONrsquoS REPORT CARD
The two-part sample question below required students to analyze and interpret the Kollwitz self-portrait to explore relationships between technical approach and meaning Part A of the question asked students about the workrsquos formal characteristics while part B asked them to connect those characteristics with what the artist was attempting to communicate Student responses
to each of the two parts were rated separately using three scoring levels Acceptable Partial and Unacceptable Examples of Acceptable and Partial student responses for each part of this question are shown here Unacceptable responses for the question neither addressed differences in the way the parts of the self-portrait are drawn nor offered interpretations linked to observations
30
Both parts of this sample response received a ldquoPartialrdquo rating This response accurately described the way the arm is drawn but did not specifi cally address the ways in which the head and hand are drawn differently from the arm ldquoPartialrdquo credit was given for recognizing some characteristics of the artwork While a few plausible interpretations about what Kollwitz was trying to communicate are provided in the second part of the response none of these is clearly linked to the descriptions offered in the fi rst part
Look at self-portrait A Compare how Kollwitz has drawn her head and hand with the way she has drawn her arm Be specifi c
A
Explain what you think Kollwitz may have been trying to communicate about herself by drawing these different parts of her self-portrait in different ways
Fifteen percent of the student responses were rated B ldquoPartialrdquo for part A and 52 percent were rated ldquoPartialrdquo for part B
Percentage of students in each response category at grade 8 2008
Part A Part B
Acceptable Partial Unacceptable Omitted
53 15 31 2
Acceptable Partial Unacceptable Omitted
19 52 25 3
NOTE Detail may not sum to totals because the percentage of responses rated as ldquoOff-taskrdquo is not shown Off-task responses are those that do not provide any information related to the assessment task SOURCE US Department of Education Institute of Education Sciences National Center for Education Statistics National Assessment of Educational Progress (NAEP) 2008 Arts Assessment
31ARTS 2008
t t t t
a t
t t
s c
t
ldquoldquo
SAMPLE QUESTION Creating a Self-Portrait After students had observed the Kollwitz and Schiele self-portraits and studied relationships between the technical and expressive qualities of the two artworks they were asked to create a self-portrait of their own Students were given a set of
a mirror and a sheet of 12-inch by 18-inch white drawing paper and were asked to use these tools to create a self-portrait that would express something important about their personalities These self-portraits were rated using four scoring levels
12 Cray-pas (colored oil pastels) a charcoal pencil Sufficient Uneven Minimal and Insufficient
ChChCharararracacacteteteririristststicicic ooofff wowoworkrkksss rararateteteddd ldquoSldquoSSufufu ficficccieieientntntrdquordquordquo bbbototothhh ofoffo ttt hehehe stststudududu enenenen tststsrsquorsquorsquo rererere spspspoononon seseesessss prprpp essesenenene teteteddd heheherererr sssshohohowewew ddd clclc eaeaeae rr ananandddd spspspp ecifiifififi cccc obobobseseservrvrvatatatioioionsnsns ttthahahaa tt cococommmmmm unununiciccatatatededed sssomomommetetethihihi ngngg immmm poop rtrtrtananan ttt ababbouououo ttt ththth eeee ararartitit stststs ThThThTh eyeyy iiincncncn ororo popoorararaa teteteedddd ididdeenentititit fyfyfyininingg dedede tata ilii iinn tetett rmrmrm ss ofofoff pppererrersososos nananana ll fefefeeatata ururu eses aandndd ininn sstutuudededentntt rerere spsppppononon seseee 11 ananann aaa ctctivivi itiityyy (a(a(artrtt mmm akaka inining)g)g) ThThheee seses lflfflflf -p-p-pororortrtrtrt aiaiaitststss shshshowowowow edeeded pppururu popoposeses efufuffu lll usussu eee ofofof cccommompopoosisis tititt ononon alal eeelelemememme ntntntsss anann ddddd sososososso phphphphphp isssisstitttiticacacacateteteedddd usussuseee ofofof mmm atataterereriaiaiaalssl FoFoFo rr exexexe amamamm plplplpleee iinnn ststststudududeneneenttt rerereespspspp onononnsesese 111 hthththh eee smsmms udududu gigigigg ngngngn g ooofff CrCrCrCr ayayayy-p-p-pasasas cccrerereatatatatededed anananan aaaaffiffiffiffininininitytyty aaamomomoo ngngng tttt hehehehee hhhheaeaeaaee ddddd aaa rmrmrm ananana ddd hahahandndnddn ananana ddd lolooolo oosoososeee wewewewe lllll-p-p-p-pp lalalaacececece dddd lililiinenenenesssss adadadadd dedededdeddddd dededed fifinfinnfinitititioioionnn tototoo ttthehehee bbbb ododododo yyy
Percentage of students in each response category at grade 8 2008
BoBoBoBBothththth wwworororoorksksksk aaaaalslslslsooo shshhs howwowowedeede vvvererere yyyyy gogogoododod uuu sesese ooofff prprpropopo ororortititionnno n cocococoo lololorrr aaaaandndnd lll inininn eeee aaandndndd wwwererer eee fuufullllllyyy dededevevev lololopepep dd anananndd nininindididid vivividududualalalizizizizi ededededded FoFoFoF rrr exexexxamamamamplpleee iiinnn stststududdenene n ttt rerere spspps onononn seseee 222222 thhhhhhthhththhhhth e stststs udududd enenenntt skskkk liliii lfflflflf ululullylyly uuuseseseseedddd cocococo lolorrr tototo eempmpmmp hahhah sisisizezez aaa ndndndndn cccrerere atatat eeeeeee cococo ntntnttrarraaststs bbbetetetwewewewe eenenn sssspepepppecicicificficficfic pppp araara tstst s ooff heherrr seseselflfl -p-pp ororor trtrtraiaiaittt BoBoBoBothththh sss tututudededed nntntn rrresesespopoo nsnsnsn eses 11 aaandndndnd 222 aalslslsooo shsshshowowededed eeevivivvvidededeencnccccncncncccc e ofoffof ttttheheehh sss tututudededed ntntntntsss hahahah vivivingngng ssspepeepentntntnt tttimimimeee obobob seseservrvinini gggg thththeee KoKoKolllll wwiwwww tz anana ddd ScScScSchihihielele ee seses lflflf-p-p-porororortrtrrtrraiaiaitststs FoFoFoFooururr pppererercececentntnt ooo fff stststudududenenntstststsrsquorsquorsquorsquo sssesss lfshypopopoortrtrt rararaaitititsss wewewererere rrratatatededed ldquoldquoSuSuSuu ffiffifficicciennee ttrdquordquordquo
1
2
Sufficient Uneven Minimal Insufficient Omitted
4 25 57 14 Rounds to zero NOTE Detail may not sum to totals because the percentage of responses rated as ldquoOff-taskrdquo is not shown Off-task responses are those that do not provide any information related to the assessment task SOURCE US Department of Education Institute of Education Sciences National Center for Education Statistics National Assessment of Educational Progress (NAEP) 2008 Arts Assessshyment
32 THE NATIONrsquoS REPORT CARD
Works at the ldquoUnevenrdquo level made some specific observations They sometimes employed pertinent compositional elements gave attention to details such as facial features to convey expression andor effectively used materials to communicate However ldquoUnevenrdquo works were typically inconsistent or incomplete in parts
In the sample presented here the student gave her work individuality by vivid use of color facial expression and the symbols incorporated in her jewelry and the background However elements of her work seem inconsistent and lacking in deliberation such as the placement and rendering of the symbols and colors in the background Twenty-five percent of studentsrsquo self-portraits were rated ldquoUnevenrdquo
As with many works rated at the ldquoMinimalrdquo level in the sample self-portrait shown here efforts at specific observations were apparent but relatively minimal (the red lines in the eyes) Compositional successes may seem more accidental than deliberate and use of materials was unskilled For example while this student may have been attempting to convey some sense of an individual person by emphasizing only his eyes and mouth with color he lacked the skill to make this choice distinctive enough to convey his message Fifty-seven percent of studentsrsquo self-portraits were rated ldquoMinimalrdquo
Most self-portraits rated ldquoInsufficientrdquo were generally so schematic as to convey little or nothing about the student Like the sample self-portrait shown here they showed unspecific observation little awareness of composition and highly unskilled use of materials In contrast to the ldquoMinimalrdquo response there were no features in this self-portrait that conveyed anything specific about a person and it remained at a general level Fourteen percent of studentsrsquo self-portraits were rated ldquoInsufficientrdquo
33ARTS 2008
Sampling and Weighting The schools and students who participate in NAEP assessments are selected to form a representative sample of the nation The national sample of eighth-graders in the 2008 arts assessment was chosen using a multistage design that involved drawing students from the sampled public and private schools across the country The results from the assessed students were combined to provide accurate estimates of the overall performance of students in the nation
Each school that participated in the assessment and each student assessed represents a portion of the population of interest Results are weighted to make appropriate inferences between the student samples and the respective populations from which they are drawn Sampling weights are adjusted for the disproportionate representation of some groups in the selected sample This includes the oversampling of schools with high concentrations of students from certain racialethnic groups and the lower sampling rates of students who attend very small schools
School and Student Participation Rates The school and student participation rates for public and private schools in the 2008 arts assessment are provided in table A-1
NCES statistical standards require that a nonresponse bias analysis be conducted for any school or student group with a participation rate that falls below 85 percent The participation rates for the 2008 NAEP arts assessment indicated a need for a school nonresponse bias analysis for the private school sample The results showed that school substitution and nonresponse adjustments were not effective in reducing nonresponse bias for the percentage of Hispanic students enrolled and type of private schools (Catholic and other private schools) The disproportionate nonresponse resulted
in an overestimation of the percentage of Hispanic students an overestimation of the percentage of Catholic school students and an underestimation of the percentage of other private school students
Table A-1 School and student participation rates in NAEP arts at grade 8 by subject and type of school 2008
Subject and type of school
Music
Nation
Public
Private
Visual arts
Nation
Public
Private
School participation Student participation
Number of Number of schools Weighted students Weighted
participating percent assessed percent
260 97 4000 93
220 99 3400 93
30 76 500 97
260 97 3900 92
220 99 3400 92
30 76 500 94
NOTE The numbers of schools are rounded to the nearest ten and the numbers of students are rounded to the nearest hundred Detail may not sum to totals because of rounding SOURCE US Department of Education Institute of Education Sciences National Center for Education Statistics National Assessment of Educational Progress (NAEP) 2008 Arts Assessment
Interpreting Statistical Signifi cance Comparisons over time or between groups in this report are based on statistical significance at the 05 level using t-tests with appropriate adjustments for multiple comparisons (using the False Discovery Rate procedure) These statistical tests consider both the size of the differences and standard errors of the two statistics being compared Standard errors are margins of error and estimates based on smaller groups are likely to have larger margins of error relative to estimates based on larger groups Note for example that differences based on schoolshyadministrator-reported estimates have smaller sample sizes than differences based on student-reported estimates resulting in smaller signifi cant differences in the student-reported data than in the
THE NATIONrsquoS REPORT CARD 34
school-administrator-reported data The size of the standard errors may also be influenced by other factors such as how representative the students assessed are of the entire population
When an estimate has a large standard error a numerical difference that seems large may not be statistically significant Differences of the same magnitude may or may not be statistically significant depending upon the size of the standard errors of the estimates For example a 10-point difference between male and female students may be statistically significant while a 10-point difference between students attending public and private schools may not be Standard errors for the estimates presented in this report are available at httpncesedgovnationsreportcardnaepdata and on the 2008 arts results website at http nationsreportcardgovarts_2008
National School Lunch Program NAEP collects data on student eligibility for the National School Lunch Program (NSLP) as an indicator of poverty Under the guidelines of NSLP children from families with incomes below 130 percent of the poverty level are eligible for free meals Those from families with incomes between 130 and 185 percent of the poverty level are eligible for reduced-price meals (For the period July 1 2007 through June 30 2008 for a family of four 130 percent of the poverty level was an annual income of $27000 and 185 percent was $38000) For more information on NSLP visit httpwww fnsusdagovcndlunch
School Location Results of the 2008 NAEP arts assessment were reported for four mutually exclusive categories of school location These categories are based on standard definitions established by the Federal Office of Management and Budget using population and geographic information from the US Census Bureau The classification system is referred to as ldquourban-centric locale codesrdquo which classifies territory into four major types
city suburb town and rural More details on the classification system can be found at httpnces edgovccdrural_localesasp
The Creating Task Score Studentsrsquo performance on questions assessing the creating process in visual arts is presented as the average creating task score in this report The creating task score for each creating question (task) is the sum of the percentage of students receiving full credit and a fraction of the percentage of students receiving partial credit The individual scores are then averaged together to report an average creating task score for the entire set of the visual arts creating questions
An example of computing the creating task score is provided below for a sample question in this report that asks eighth-graders to draw a self-portrait Responses to this question were scored ldquoSufficientrdquo ldquoUnevenrdquo ldquoMinimalrdquo or ldquoInsufficientrdquo The percentages of students falling into these four scoring levels are 4 percent 25 percent 57 percent and 14 percent respectively (table A-2) Responses at these four levels receive
1score weights of 1 23 and 0 respectively The
3creating task score for this question is computed as 1 (4) + 2 (25) + 1 (57) + 0 (14) = 403 3
Table A-2 Example showing how the creating task score was computed for a sample question in NAEP visual arts at grade 8 2008
Percentage Percentage of of students times
Scoring level students Score weight score weight
Sufficient 4 1 4
Uneven 25 2 3 17
Minimal 57 1 3 19
Insufficient 14 0 0
Creating task score (4 + 17 + 19 + 0) = 40
SOURCE US Department of Education Institute of Education Sciences National Center for Education Statistics National Assessment of Educational Progress (NAEP) 2008 Arts Assessment
ARTS 2008 3535
Comparing Results Between the 1997 and 2008 Assessments Although the assessment questions adminshyistered in 2008 were selected from those used in the 1997 assessment due to changes in scoring procedures and materials the 2008 score results in music and visual arts could not be directly compared to the results in 1997
In the 2008 arts assessment the scoring guides for constructed-response questions the sample questions and student responses used to train scorers and the standardized training procedures were updated to refl ect changes in training and scoring procedures that have been adapted for use across all NAEP assessments since 1997 In addition because the student artwork used as training samples for visual arts in 1997 had degraded over time and because of differences in the availability of certain types of art supplies and tools between 1997 and 2008 new samples were developed for scoring studentsrsquo responses to the creating questions in 2008
However since the scoring method for multiple-choice questions was the same in 1997 and 2008 direct comparisons could be made between the two years on results for these questions in music and visual arts (tables A-3 and A-4) Because multiple-choice questions were only a portion of the assessment and only assessed certain types of topics in the responding process of music and visual arts the changes in studentsrsquo performance between 1997 and 2008 on these questions did not represent the performance changes for the constructed-response questions or the entire assessment
Table A-3 Percentage correct for multiple-choice questions in NAEP music at grade 8 1997 and 2008
Percent correct
Question description 1997 2008
Overall 53 51
Identify directional contour of part of melodic phrase 79 77
Identify form of vocal music in a recording (musical excerpt 1) 78 76
Identify the type of instrumental ensemble performing an excerpt 75 71
Identify form of musical examples as theme and variations 64 64
Identify a bass clef symbol 63 62
Identify pitch contour of melody in a recording 63 56
Identify saxophone as instrument playing melody 66 56
Identify a half note in printed music 52 56
Identify a correct time signature for a piece of printed music 55 52
Select a line drawing refl ective of the texture of an example of music 52 52
Identify the solo instrument beginning ldquoRhapsody in Bluerdquo 52 50
Identify form of vocal music in a recording (musical excerpt 2) 60 49
Identify an appropriate texture drawing for a homophonic excerpt 51 48
Identify term best describing the texture 47 47
Identify an appropriate description of the texture of a recorded excerpt 50 44
Identify correct time signature for recorded excerpt 42 43
Identify the name of a pitch shown in the treble clef 42 41
Identify an octave interval in a printed score 37 38
Identify the term for fermata symbol 38 33
Identify which voices enter fi rst in a choral excerpt 32 28
Identify the quality of a triad in a printed score 15 21 Significantly different (p lt 05) from 2008 SOURCE US Department of Education Institute of Education Sciences National Center for Education Statistics National Assessment of Educational Progress (NAEP) 1997 and 2008 Arts Assessments
Table A-4 Percentage correct for multiple-choice questions in NAEP visual arts at grade 8 1997 and 2008
Percent correct
Question description 1997 2008
Overall 42 42
Identify purpose of insulating package material 61 62
Identify an example of 20th-century western art 55 59
Infer from photograph advantages of shrink-wrap packaging 57 57
Identify an example of a Renaissance painting 48 50
Identify compositional emphasis in a Bearden collage 49 46
Identify genre of a Bearden collage 34 37
Identify a technical similarity between Schiele and Kollwitz self-portraits 36 37
Identify an important compositional aspect of a Kollwitz self-portrait 40 37
Identify a stylistic emphasis in a Bearden collage 29 35
Identify a compositional feature of a medieval artwork 39 32
Identify the style of an artwork as surrealism 27 31
Identify an artistic style that infl uenced cubism 25 23 Significantly different (p lt 05) from 2008 SOURCE US Department of Education Institute of Education Sciences National Center for Education Statistics National Assessment of Educational Progress (NAEP) 1997 and 2008 Arts Assessments
THE NATIONrsquoS REPORT CARD 36
Table A-5 Percentage of students in NAEP arts assessment at grade 8 by selected student and school characteristics 2008
Student characteristics Music Visual arts
SD andor ELL
Identified 17 17
Excluded 2 2
Assessed 15 16
Without accommodations 6 6
With accommodations 8 10
SD
Identified 12 12
Excluded 1 2
Assessed 10 11
Without accommodations 3 2
With accommodations 7 8
ELL
Identified 6 6
Excluded 1 1
Assessed 5 6
Without accommodations 4 4
With accommodations 2 2 NOTE Students identified as both SD and ELL were counted only once under the combined SD andor ELL category but were counted separately under the SD and ELL categories Detail may not sum to totals because of rounding SOURCE US Department of Education Institute of Education Sciences National Center for Education Statistics National Assessment of Educational Progress (NAEP) 2008 Arts Assessment
Table A-6 Percentage of students with disabilities (SD) andor English language learners (ELL) identified excluded and assessed in NAEP music and visual arts at grade 8 as a percentage of all students 2008
NOTE Black includes African American Hispanic includes Latino and Pacific Islander includes Native Hawaiian Race categories exclude Hispanic origin Detail may not sum to totals because of rounding SOURCE US Department of Education Institute of Education Sciences National Center for Education Statistics National Assessment of Educational Progress (NAEP) 2008 Arts Assessment
Student and school characteristics Music Visual arts
Raceethnicity
White 61 61
Black 15 14
Hispanic 18 17
AsianPacific Islander 5 5
American IndianAlaska Native 1 2
Unclassified 1 1
Gender
Male 50 51
Female 50 49
Eligibility for freereduced-price school lunch
Eligible 36 37
Not eligible 57 56
Information not available 7 8
Type of school
Public 93 92
Private 7 8
School location
City 29 29
Suburb 37 36
Town 12 13
Rural 22 22
37ARTS 2008 37
u S d e p A r t M e n t o f e d u C A t i o n The National Assessment of Educational Progress (NAEP) is a congressionally authorized project sponsored by the US Department of Education The National Center for Education Statistics a department within the Institute of Education Sciences administers NAEP The Commissioner of Education Statistics is responsible by law for carrying out the NAEP project Arne Duncan John Easton Stuart Kerachsky Secretary Director Acting Commissioner US Department Institute of National Center for of Education Education Sciences Education Statistics
t h e n A t i o n A l A S S e S S M e n t g o V e r n i n g b o A r d In 1988 Congress created the National Assessment Governing Board to set policy for the National Assessment of Educational Progress commonly known as The Nations Report Card TM The Governing Board is an independent bipartisan group whose members include governors state legislators local and state school officials educators business representatives and members of the general public
Darvin M Winick Chair President Winick amp Associates Austin Texas
Amanda P Avallone Vice Chair Assistant Principal and Eighth-Grade Teacher
Summit Middle School Boulder Colorado
David J Alukonis Former Chairman Hudson School Board Hudson New Hampshire
Gregory Cizek Professor of Educational Measurement
University of North Carolina Chapel Hill North Carolina
Carol A DrsquoAmico President and Chief Executive Officer
Conexus Indiana Indianapolis Indiana
Honorable David P Driscoll Former Commissioner of Education
Massachusetts Department of Education
Malden Massachusetts
Louis M Fabrizio Director of Accountability Policy and Communications
North Carolina Department of Public Instruction
Raleigh North Carolina
Honorable Anitere Flores Member Florida House of Representatives Miami Florida
Alan J Friedman Consultant Museum Development and Science Communication
New York New York
David W Gordon County Superintendent of Schools Sacramento County Office of Education
Sacramento California
Robin C Hall Principal Beecher Hills Elementary School Atlanta Georgia
Kathi M King Twelfth-Grade Teacher Messalonskee High School Oakland Maine
Kim Kozbial-Hess Educational Technology Trainer Hawkins Elementary School Toledo Ohio
Henry Kranendonk Mathematics Curriculum Specialist Milwaukee Public Schools Milwaukee Wisconsin
James S Lanich President California Business for Education Excellence
Sacramento California
Honorable Cynthia L Nava Senator New Mexico State Senate Las Cruces New Mexico
Honorable Steven L Paine State Superintendent of Schools West Virginia Department of Education
Charleston West Virginia
Honorable Sonny Perdue Governor of Georgia Atlanta Georgia
Susan Pimentel Educational Consultant Hanover New Hampshire
Andrew C Porter Dean Graduate School of Education University of Pennsylvania Philadelphia Pennsylvania
Warren T Smith Sr Vice President Washington State Board of Education
Olympia Washington
Mary Frances Taymans SND Executive Director Secondary Schools Department National Catholic Educational Association
Washington DC
Oscar A Troncoso Principal Anthony High School Anthony Texas
Eileen L Weiser General Public Representative Ann Arbor Michigan
John Easton (Ex officio) Director Institute of Education Sciences US Department of Education Washington DC
Mary Crovo Interim Executive Director National Assessment Governing Board
Washington DC
t h e n a t i o n rsquo s r e p o r t c a r d
A r t s 2 0 0 8
M u s i c amp V i s u a l A r t s June 2009
M o r e i n f o r M A t i o n The report release site is httpnationsreportcardgov The NCES web electronic catalog is httpncesedgov pubsearch
For ordering information write to US Department of Education ED Pubs PO Box 1398 Jessup MD 20794-1398
or call toll free 1-877-4ED-Pubs
or order online at httpwwwedpubs org
S u g g e S t e d C i t A t i o n Keiper S Sandene BA Persky HR and Kuang M (2009) The Nationrsquos Report Card Arts 2008 Music amp Visual Arts (NCES 2009ndash488) National Center for Education Statistics Institute of Education Sciences US Department of Education Washington DC
C o n t A C t Emmanuel Sikali 202-502-7419 emmanuelsikaliedgov
ldquo t h e d e p A r t M e n t o f e d u C A t i o n rsquo S M i S S i o n i S t o p r o M o t e S t u d e n t A C h i e V e M e n t A n d p r e p A r A t i o n f o r g l o b A l C o M p e t i t i V e n e S S b y f o S t e r i n g e d u C A t i o n A l e x C e l l e n C e A n d e n S u r i n g e q u A l A C C e S S rdquo
wwwedgov
- Contents
- Executive Summary
- Introduction
- Music
-
- Eighty-nine-point score gap between lowest- and highest-performing students in music
- Racialethnic gender and socioeconomic gaps in music scores
- Music scores vary by type and location of schools
- Context for Arts Education in Music
- What Eighth-Graders Know and Can Do in Music
- Sample Questions for Music
-
- Visual Arts
-
- Eighty-nine-point score gap between lowest- and highest-performing students in visual arts
- Responding and creating results related
- Patterns in score gaps by student characteristics similar for responding to and creating visual arts
- No significant difference in responding scores between public and private school students
- Context for Arts Education in Visual Arts
- What Eighth-Graders Know and Can Do in Visual Arts
- Sample Questions for Visual Arts
-
- Technical Notes and Data Appendix13
- More Information
-

174
Eighty-nine-point score gap between lowest- and highest- performing students in music While the overall average responding score in music was set at 150 in 2008 students at grade 8 exhibited a wide range of responding scores (figure 1) For example scores ranged from 105 for lower-performing students at the 10th percentile to 194 for higher-performing students at the 90th percentile Students at the 50th percentile had a score of 151
SOURCE US Department of Education Institute of Education Sciences National Center for Education Statistics National Assessment of Educational Progress (NAEP) 2008 Arts Assessment
Figure 1 Average responding scale score and percentile scores in NAEP music at grade 8 2008
Overall 10th 25th 50th 75th 90th average score Percentile score
150
194
128
105
0
300 200
190
180
170
160
150
140
130
120
110
100
Scale score
151
174
A constructed-response question that asked
students to write two measures of rhythmic
music notation was included in one of the four
music sections Due to budget constraints this
was the only question in the assessment that
asked students to create music therefore an
average creating task score for music could not
be reported However results for this question
and other released questions from the 2008 arts
assessment are available at httpncesedgov
nationsreportcarditmrls
Creating Music
9ARTS 2008
Racialethnic gender and socioeconomic gaps in music scores
In addition to the overall average responding score In general the same patterns in score gaps seen in in music results are also available based on student other NAEP subjects were also evident in the results for characteristics such as raceethnicity gender and music (figure 2) The percentages of students in each eligibility for the National School Lunch Program student group can be found in appendix table A-5
RaceEthnicity In 2008 average responding scores in music for White and AsianPacific Islander students were 29 to 32 points higher than the scores for Black and Hispanic students There were no signifi cant differences between the average responding scores of White and AsianPacific Islander students or between the scores of Black and Hispanic students
Figure 2 Average responding scale score in NAEP music at grade 8 by selected student characteristics 2008
Scale score 300
200
190
180
170
160
150
140
130
120
110
0 White Black Hispanic Asian Male Female Eligible Not
Pacific eligible Islander
Raceethnicity
161
130 129
159
Gender
145
155
Eligibility for freereduced-price
school lunch
132
161
NOTE Black includes African American Hispanic includes Latino and Pacific Islander includes Native Hawaiian Race categories exclude Hispanic origin Sample sizes were insuffishycient to permit reliable estimates for students whose raceethnicity was American IndianAlaska Native or unclassified For the eligibility for freereduced-price school lunch category results are not shown for students whose eligibility status was not available SOURCE US Department of Education Institute of Education Sciences National Center for Education Statistics National Assessment of Educational Progress (NAEP) 2008 Arts Assessshyment
10 THE NATIONrsquoS REPORT CARD
Gender On average female students had a higher respondshying score in music than their male counterparts There was a 10-point gap between the two groups in 2008
Eligibility for FreeReduced-Price School Lunch NAEP uses studentsrsquo eligibility for the National School Lunch Program as an indicator of poverty
2 The score-point difference is based on the difference between the unrounded scores as opposed to the rounded scores shown in the fi gure
Students from lower-income families are typically eligible for freereduced-price school lunch (see the Technical Notes at the end of this report for eligibility criteria) while students from higher-income families typically are not On average the responding score for students who were eligible was 28 points2 lower than the score for students who were not eligible
Music scores vary by type and location of schools
Results by selected school characteristics also show based on the type of school or its location Differences differences in average responding scores for music in access to arts instruction and quality curricula (fi gure 3) It is important to note that there may be many socioeconomic status and other factors not measured reasons students performed differently on average in NAEP may influence student achievement in the arts
Type of School Public school students made up 93 percent of eighth-graders in the nation in 2008 while the other 7 percent of students attended private schools The average responding score in music for eighth-graders in public schools was 14 points lower than the score for students in private schools
School Location Results are available for four school location categories city suburb town and rural Descriptions of how these school location categories are defi ned are included in the Technical Notes section of this report
In 2008 eighth-graders who attended city schools had a lower average responding score in music than students who attended suburban town and rural schools There were no significant differences in the average scores among students in suburban town and rural school locations
Figure 3 Average responding scale score in NAEP music at grade 8 by selected school characteristics 2008
Scale score 300
200
190
180
170
160
150
140
130
120
110
0
School location
142
155 156 150
Type of school
149
163
Public Private City Suburb Town Rural
SOURCE US Department of Education Institute of Education Sciences National Center for Education Statistics National Assessment of Educational Progress (NAEP) 2008 Arts Assessment
11ARTS 2008
Context for Arts Education in Music Information collected from school and student on the availability and nature of music education in questionnaires helps to provide the context in which their schools Students provided information on their arts learning takes place For the music portion of the participation in music activities assessment school administrators provided information
Frequency of music instruction remains steady School administrators were asked how often eighth-graders attending their schools might receive instruction in music Fifty-seven percent of eighth-graders attended schools where students could have received music instruction at least three or four times a week in 2008 (figure 4) This was higher than the percentages of students attending schools where music was offered less frequently or not at all
Although the data are not shown here access to music instruction as reported by school administrators did not differ significantly by raceethnicity gender or eligibility for freereduced-price school lunch For example the percentage of Black students attending schools where music was offered at least 3 or 4 times a week was not significantly different from the percentage of White students
The same question was asked of school administrators in 1997 making it possible to look for changes in the instruction patterns over time The apparent increase between 1997 and 2008 in the percentage of students attending schools where music was available at least three or four times a week was not statistically significant nor were there any significant changes in the percentages of students attending schools where music was offered once or twice a week less than once a week or not at all
Figure 4 Percentage of students at grade 8 by school-reported frequency with which instruction in music is available 1997 and 2008
1997
2008
Once or twice a week 27
38
At least 3 or 4 times a week 57
43
9Subject not offered 8
Less than once a week
10
8
0 10 20 30 40 50 60 70 80 90 100
Percent
NOTE Detail may not sum to totals because of rounding SOURCE US Department of Education Institute of Education Sciences National Center for Education Statistics National Assessment of Educational Progress (NAEP) 1997 and 2008 Arts Assessments
71 percent of eighth-graders attended schools where administrators reported that their state or district had a curriculum in music in 2008
77 percent of students attended schools where music was taught by a full-time specialist
12 THE NATIONrsquoS REPORT CARD
More students writing down music in music class Students responded to a series of questions about how often they did certain activities in music class For each activity listed in figure 5 students indicated if they were asked by their teacher to do it almost every day once or twice a week once or twice a month or never or hardly ever Students were also given the option of indicating that they did not have music in school The results summarized here show the combined percentages for all eighth-grade students who reported that they did various music-related activities at least once a month
For the most part students were as likely to be asked by their teachers to engage in these musical activities in 2008 as in 1997 There were no significant changes in the percentages of students who reported that teachers played music for them to listen to or asked them to sing play an instrument work on group assignments or make up their own music Only the percentage of students who reported being asked to write down music showed a statistically significant increase from 26 percent in 1997 to 33 percent in 2008
About one-third of students participate in musical performance activities at school Students were also asked several questions about their participation in musical performance activities at school These included whether or not they played in a band played in an orchestra or sang in a chorus or choir Overall 34 percent of eighth-graders reported participating in one or more of these musical activities at school in 2008 (fi gure 6) Although questions about participation in these musical activities were also asked in 1997 changes in the format of the questions prohibit comparing results from the two years
Figure 5 Percentage of students at grade 8 by student-reported in-school activities their teachers ask them to do in music class at least once a month 1997 and 2008
16
17
36
26
33
28
28
30
49
51
35
33
Listen to music
Sing
Play instruments
Write down music
Work on group assignments
Make up own music 1997
2008
0 10 20 30 40 50 60 70 80 90 100
Percent
Significantly different (p lt 05) from 2008
Figure 6 Percentage of students at grade 8 by student-reported participation in musical activities in school 2008
Play in a band
Play in an orchestra
Sing in a chorus or choir
One or more of the three activities
17
34
16
5
0 10 20 30 40 50 60 70 80 90 100
Percent
NOTE Students were permitted to select more than one musical activity The percentage for the category ldquoOne or more of the three activitiesrdquo was derived from studentsrsquo responses to each of the other three categories and was not a separate option by itself SOURCE US Department of Education Institute of Education Sciences National Center for Education Statistics National Assessment of Educational Progress (NAEP) 1997 and 2008 Arts Assessments
13ARTS 2008
What Eighth-Graders Know and Can Do in Music The item map below is useful for understanding studentsrsquo performance at different points on the responding scale The scale scores on the left represent the average scores for students who were likely to get the questions correct or partially correct Scores for the 25th and 75th percentiles are also noted The descriptions of selected assessment questions are listed on the right
For example the map shows that higher-performing eighth-graders in the upper range of the scale with an average score of 265 were likely to be able to identify one element of jazz present in ldquoRhapsody
Grade 8 NAEP Music Responding Item Map
Scale score Question description
in Bluerdquo Middle-performing students with an average score of 163 were likely to be able to describe one feature of a song that identifies it as a spiritual
Constructed-response questions for which students could earn partial credit may appear on the map multiple times once for each level of credit For example a question asking students to provide the name of a piano dynamic marking and to explain its meaning appears at the score of 192 for responses receiving full credit and at 183 for responses receiving partial credit
300
275 Identify piece of music as coming from twentieth century and provide limited justifi cation why 265 Identify one element of jazz present in ldquoRhapsody in Bluerdquo
239 Describe an emotion or mood created by a composition and describe two ways in which emotion or mood was created
237 Provide a partial identifi cation and description of the errors in pitch in an instrumental solo
230 Describe a similarity and a difference between two written vocal parts
228 Identify the solo instrument beginning ldquoRhapsody in Bluerdquo (page 17)
225 Provide a comparison between the tone color of two different singers
195 Select a line drawing refl ective of the texture of an example of music (page 15)
195 Identify the term for a fermata symbol
192 Identify the name of a piano dynamic marking and explain its meaning (page 16)
183 Either identify the name of a piano dynamic marking or explain its meaning (page 16)
182 Provide a limited explanation of why spirituals were important in peoplersquos lives
176 Identify a correct time signature for a piece of music
172 Identify region of origin of African musical excerpt and provide a description of a characteristic related to its style (page 18)
167 Identify a bass clef symbol
166 Identify the type of instrumental ensemble performing an excerpt
163 Describe one feature of a song that identifi es it as a spiritual
151 Identify the length of the introduction of ldquoShalom My Friendsrdquo
136 Identify directional contour of part of melodic phrase
124 Identify region of origin of African musical excerpt and provide partial explanation of its style characteristics (page 18)
84 Describe an emotion or mood created by a composition 49 Identify region of origin of African musical excerpt (page 18)
0
174 75th percentile
128 25th percentile
NOTE Regular type denotes a constructed-response question Italic type denotes a multiple-choice question The position of a question on the scale represents the average scale score attained by students who had a 65 percent probability of obtaining credit at a specific level of a constructed-response question or a 74 percent probability of correctly answering a four-option multiple-choice question SOURCE US Department of Education Institute of Education Sciences National Center for Education Statistics National Assessment of Educational Progress (NAEP) 2008 Arts Assessment
14 THE NATIONrsquoS REPORT CARD
A
SAMPLE QUESTION Identifying the Texture of a Musical Example The sample question below asked students to identify the texture of a musical example that was played (The term ldquotexturerdquo was defined for the students as the blend of various musical sounds and the ways in which the lines of music in a piece are related)
The music played for this question came from the beginning of ldquoContrapunctus 4rdquo from The Art of the Fugue by JS Bach In the recording the fugue was played by a brass quartet The fugue begins with one instrument entering and playing the subject (the initial melody) of the fugue followed by the other members of the quartet each playing the melody The audio for this question is available in the NAEP Questions Tool at httpncesedgov nationsreportcarditmrls
Each of the four diagrams below illustrates an example of a texture that could occur in a piece of music In 2008 fifty-two percent of eighth-graders selected the correct answer (choice A) which shows the general pattern of musical lines that occurred in the music that was played This was not found to be significantly different from the 52 percent who answered correctly in 1997 The other three choices are incorrect because they show patterns of musical lines that did not match the music that was played Choice B shows a group of three voices in alternation with a solo line choice C shows an alternation of two lines with no accompanying lines or voices and choice D shows a solo line with a block chord accompaniment
Percentage of students in each response category at grade 8 2008
Choice A Choice B Choice C Choice D Omitted
52 18 5 25 Rounds to zero NOTE Detail may not sum to totals because of rounding SOURCE US Department of Education Institute of Education Sciences National Center for Education Statistics National Assessment of Educational Progress (NAEP) 2008 Arts Assessment
Which diagram best illustrates the texture of the music
B
DC
AAAAAAAAAAAAAAAAAAAAAAAA
15ARTS 2008
SAMPLE QUESTION Reading Musical NotationThis two-part sample question was taken from a set of questions that asked students to demonstrate knowledge of standard musical notation In the question below students were asked to provide the name and meaning of the symbol indicated in circle 1 in the music shown here No recorded music was played for this question The question that pertains to the symbol indicated in circle 2 is not
shown here but is available in the NAEP Questions Tool at httpncesedgovnationsreportcarditmrls
Student responses for this two-part question were rated using three scoring levels Adequate Limited and Inadequate Examples of Adequate and Limited responses are shown here Inadequate responses failed to provide correct information for either part of the question
Adequate Limited Inadequate Omitted
20 9 62 Rounds to zero NOTE Detail may not sum to totals because the percentage of responses rated as ldquoOff-taskrdquo is not shown Off-task responses are those that do not provide any information related to the assessment taskSOURCE US Department of Education Institute of Education Sciences National Center for Education Statistics National Assessment of Educational Progress (NAEP) 2008 Arts Assess-ment
Percentage of students in each response category at grade 8 2008
1
2
What does the symbol in circle 1 tell the performer to do
What is the musical (Italian) name for the symbol in circle 1
This sample response was rated ldquoAdequaterdquo because it provided the symbolrsquos meaning (that the music should be performed softly) and the symbolrsquos correct name (piano) Twenty percent of eighth-graders received a rating of ldquoAdequaterdquo on this question
This sample response was rated ldquoLimitedrdquo because it provided the symbolrsquos meaning but not its correct name (Pianissimo refers to the symbol pp which indicates that music should be performed very softly) Nine percent of studentsrsquo responses to this question were rated ldquoLimitedrdquo
What does the symbol in circle 1 tell the performer to do
What is the musical (Italian) name for the symbol in circle 1
16 THE NATIONrsquoS REPORT CARD
D
At the beginning of the piece a solo is played on
a flute
an oboe
a saxophone
a clarinet
A
B
C
DDDDDDDDD
SAMPLE QUESTION Identifying the Sound of an Instrument The sample question below asked students to identify the sound of an instrument The music played for this question comes from the opening of ldquoRhapsody in Bluerdquo by American composer George Gershwin The audio is available in the NAEP Questions Tool at httpncesedgov nationsreportcarditmrls
In 2008 fifty percent of eighth-graders correctly identified the clarinet as the instrument on which the solo was played (choice D) This was not found to be significantly different from the 52 percent who answered correctly in 1997 Choices A B and C are also woodwind instruments like the clarinet but were not the instrument on which the solo at the beginning of the piece was played
Choice A Choice B Choice C Choice D Omitted
12 15 22 50 Rounds to zero NOTE Detail may not sum to totals because of rounding SOURCE US Department of Education Institute of Education Sciences National Center for Education Statistics National Assessment of Educational Progress (NAEP) 2008 Arts Assessshyment
Percentage of students in each response category at grade 8 2008
17ARTS 2008
D
D
SAMPLE QUESTION Identifying Origin of a Musical Style The two-part sample question below asked students to identify music from a particular culture and to describe the features that help to characterize its style The music played for this question came from an African song entitled ldquoDrodoperdquo The audio is available in the NAEP Questions Tool at httpncesedgovnationsreportcarditmrls
Student responses for this two-part question were rated using four scoring levels Developed Adequate Limited and Inadequate Examples of Developed and Adequate responses are shown here Responses rated as Limited only provided a correct response to the first part of the question Responses rated as Inadequate failed to provide a correct response for either part of the question
This sample response was rated ldquoDevelopedrdquo because it both indicated the correct region of origin of the music and cited the ldquocall and responserdquo feature of the music that is common among many types of African songs Mentioning the use of specific percussion instruments such as drums also contributed to this response receiving a rating of ldquoDevelopedrdquo Fifty-two percent of eighth-graders received a rating of ldquoDevelopedrdquo on this question
From where does the music come
North America
South America
Asia
Africa
Other than the language used in the song describe one feature of the music that helps to identify it as coming from the part of the world you selected Be specific in your description
A
B
C
DDDDDDDDDDDDDDDDDD
From where does the music come
North America
South America
Asia
Africa
Other than the language used in the song describe one feature of the music that helps to identify it as coming from the part of the world you selected Be specific in your description
A
B
C
This sample response was rated ldquoAdequaterdquo Although it indicated the correct region of origin of the music the description of a feature of the music was vague Twenty-four percent of studentsrsquo responses to this question were rated ldquoAdequaterdquo
DDDDDDDDDDDDDDDDDDDDDDDDDDDD
Percentage of students in each response category at grade 8 2008
Developed Adequate Limited Inadequate Omitted
52 24 19 5 Rounds to zero NOTE Detail may not sum to totals because the percentage of responses rated as ldquoOff-taskrdquo is not shown Off-task responses are those that do not provide any information related to the assessment task SOURCE US Department of Education Institute of Education Sciences National Center for Education Statistics National Assessment of Educational Progress (NAEP) 2008 Arts Assessshyment
18 THE NATIONrsquoS REPORT CARD
19ARTS 2008
The 2008 arts assessment included four sections in visual arts that measured studentsrsquo ability to respond to and create visual art Students were given two of the four sections each of which contained between 7 and 11 multiple-choice and constructed-response questions Many of the visual arts questions in the assessment contained multiple parts The amount of time provided for students to complete two visual arts sections ranged from 75 minutes to 104 minutes
Responding questions asked students to analyze and describe works of art and design thereby demonstrating their knowledge of media and techniques visual organization the cultural contexts of artworks how works of art convey meaning and the relationship between form and function in design Creating questions assessed studentsrsquo ability to communicate in works of art think of different solutions to visual problems and generate ideas for and then create works of art and design These creating questions represented approximately one-half of the total assessment time in visual arts Some examples of the different types of visual arts questions are presented later in this section
20 THE NATIONrsquoS REPORT CARD
Eighty-nine-point score gap between lowest- and highest- performing students in visual arts The overall average responding score for visual arts was set at 150 in 2008 (figure 7) In addition to the overall average responding score results are shown for students at selected percentiles on the responding scale There was an 89-point gap between the scores for students at the 10th and 90th percentiles
The assessment also included questions that asked students to create works of art and design Results for these questions are presented as the average creating task score which is expressed as the average percentage of the maximum possible score ranging from 0 to 100 (see the Technical Notes for an explanation of how the score was calculated) In 2008 the overall average creating task score for grade 8 students was 52 (fi gure 8)
Responding and creating results related Because the NAEP arts framework describes the integration among the arts processes it is useful to explore the relationship between studentsrsquo results on the responding and creating questions in visual arts On average students who performed well on the responding questions also performed well on the creating questions (figure 9) For example students performing above the 75th percentile on the responding scale also had the highest average creating task score (62) Lower-performing students at or below the 25th percentile on the responding scale had the lowest average creating task score (40)
Figure 7 Average responding scale score and percentile scores in NAEP visual arts at grade 8 2008
150
104
174
300 200
190
180
170
160
150
140
130
120
110
Scale score
193
152
128
Overall 10th 25th 50th 75th 90th average score Percentile score
100
0
Figure 8 Average creating task score in NAEP visual arts at grade 8 2008
Overall 52
0 10 20 30 40 50 60 70 80 90 100
Percent of maximum score
Figure 9 Average creating task score in NAEP visual arts at grade 8 by responding score level 2008
Responding score level
Lower (lt 25th percentile)
Lower-middle (25thndash50th percentiles)
Upper-middle (50thndash75th percentiles)
Upper (gt 75th percentile)
Average creating task score
50
40
62
55
0 10 20 30 40 50 60 70 80 90 100
Percent of maximum score
SOURCE US Department of Education Institute of Education Sciences National Center for Education Statisshytics National Assessment of Educational Progress (NAEP) 2008 Arts Assessment
21ARTS 2008
Race ethnicity
54
55
46
43
49
Black
Hispanic
AsianPacific Islander
Male
White
Gender
Eligibility for free
reduced-price school lunch
54
55
46 Eligible
Not eligible
Female
Patterns in score gaps by student characteristics similar for responding to and creating visual arts
In general patterns in score differences based on student characteristics were similar for results in both responding (fi gure 10) and creating (fi gure 11)
130
120
110
RaceEthnicity In 2008 average responding scores in visual arts were 22 to 31 points higher for White and AsianPacifi c Islander students than for Black and Hispanic students There were no signifi cant differences between the average responding scores of White and AsianPacific Islander students or between the scores of Black and Hispanic students
Similarly the average creating task scores of White and AsianPacific Islander students were higher than the scores of Black and Hispanic students but there were no significant differences between the scores of White and AsianPacific Islander students or between the scores of Black and Hispanic students
Gender On average female eighth-graders had a higher responding score in visual arts than their male counterparts There was an 11-point3 gap between the two groups in 2008 The average creating task score for female students was also 5 points higher than the score for male students
Eligibility for FreeReduced-Price School Lunch On average eighth-graders who were eligible for free reduced-price school lunch had a lower responding score in visual arts than those who were not eligible There was a 29-point gap between the two groups in 2008 Students who were eligible also had an average creating task score that was 9 points lower than the score for students who were not eligible
3 The score-point gap is based on the difference between the unrounded scores as opposed to the rounded scores shown in the fi gure
Figure 10 Average responding scale score in NAEP visual arts at
200
190
180
170
160
150
140
Raceethnicity
160
129 134
156
Gender
145
155
300 Scale score
Eligibility for freereduced-price
school lunch
132
161
grade 8 by selected student characteristics 2008
0 White Black Hispanic Asian Male Female Eligible Not
Pacific eligible Islander
Figure 11 Average creating task score in NAEP visual arts at grade 8 by selected student characteristics 2008
0 10 20 30 40 50 60 70 80 90 100
Percent of maximum score
NOTE Black includes African American Hispanic includes Latino and Pacifi c Islander includes Native Hawaiian Race categories exclude Hispanic origin Sample sizes were insufshyficient to permit reliable estimates for students whose raceethnicity was American Indian Alaska Native or unclassified For the eligibility for freereduced-price school lunch category results are not shown for students whose eligibility status was not available SOURCE US Department of Education Institute of Education Sciences National Center for Education Statistics National Assessment of Educational Progress (NAEP) 2008 Arts Assessment
22 THE NATIONrsquoS REPORT CARD
No signifi cant difference in responding scores between public and private school students
While the general patterns in results for responding not all the apparent differences were found to be to and creating visual arts by selected school statistically signifi cant characteristics were similar (fi gures 12 and 13)
Type of School The apparent difference in 2008 between the average responding scores in visual arts for eighth-graders in public and private schools was not found to be statistically significant However the average creating task score was lower for public school students than for private school students
School Location Students attending suburban schools in 2008 had a higher average responding score in visual arts than students in city schools There were no significant differences in the average responding scores between students from suburban schools and town or rural schools
In the creating process of visual arts students attending suburban schools had a higher average creating task score than students in both city and town schools The average creating task score of students in suburban schools was not signifi cantly different from the score of students in rural schools
Because responding results are presented as scale scores and creating results are presented as average percentages it is not possible to compare the magnitude of differences between these scores For example an 11-point difference on the 0ndash300 responding scale between students attending schools in city and suburban locations is not necessarily greater than a 5-point difference between the same two groups on the 0ndash100 creating task scale
Figure 12 Average responding scale score in NAEP visual arts at grade 8 by selected school characteristics 2008
140
130
120
110
0 Public Private
200
190
180
170
160
150
City Suburb Town Rural
School location
144
155 149 151
Type of school
149
159
300 Scale score
Figure 13 Average creating task score in NAEP visual arts at
City
Suburb
Town
Rural
School location
52
49
50
54
Public
Private
Type of school 60
51
grade 8 by selected school characteristics 2008
0 10 20 30 40 50 60 70 80 90 100
Percent of maximum score
SOURCE US Department of Education Institute of Education Sciences National Center for Education Statistics National Assessment of Educational Progress (NAEP) 2008 Arts Assessment
23ARTS 2008
Context for Arts Education in Visual Arts To provide the context in which arts learning takes and nature of visual arts education in their schools place results are presented here based on school and studentsrsquo responses about their participation in administratorsrsquo responses related to the availability visual arts activities
Frequency of visual arts instruction remains steady School administrators were asked how often eighth-graders attending their schools might receive instruction in visual arts Forty-seven percent of eighth-graders attended schools where students could possibly receive visual arts instruction at least three or four times a week in 2008 (fi gure 14) This was higher than the percentages of students attending schools where visual arts were offered less frequently or not at all
Although the data are not shown here access to visual arts instruction did not differ significantly by race ethnicity gender or eligibility for freereduced-price school lunch For example the percentage of students who were eligible for freereduced-price school lunch attending schools where visual arts were offered once or twice a week was not significantly different from the percentage of students who were not eligible
The same question was asked of school administrators in 1997 making it possible to look for changes in the instruction patterns over time The results showed no significant changes between 1997 and 2008 in the percentages of students who attended schools where visual arts were available at least three or four times a week once or twice a week less than once a week or not at all
Figure 14 Percentage of students at grade 8 by school-reported frequency with which instruction in visual arts is available 1997 and 2008
1997
2008 47
52At least 3 or 4 times a week
30
25Once or twice
a week
5
10
Less than once a week
17
14
Subject not offered
0 10 20 30 40 50 60 70 80 90 100
Percent
NOTE Detail may not sum to totals because of rounding SOURCE US Department of Education Institute of Education Sciences National Center for Education Statistics National Assessment of Educational Progress (NAEP) 1997 and 2008 Arts Assessments
77 percent of eighth-graders attended schools where administrators reported that visual arts were taught by a full-time specialist
69 percent of students attended schools that followed a state or district curriculum in visual arts
24 THE NATIONrsquoS REPORT CARD
More students writing about their artwork
Students responded to a series of questions about how often they did certain activities in visual arts class For each activity listed in figure 15 students indicated if their teacher had them do it every day once a week once a month or never or hardly ever The results summarized here show the combined percentages for students who reported that they did various art-related activities at least once a month
The percentage of students who reported that their teacher had them write about their artwork increased from 21 percent in 1997 to 27 percent in 2008 However the percentage of students whose teacher had them choose their own art project decreased from 47 percent in 1997 to 39 percent in 2008 There were no significant changes between 1997 and 2008 in the percentages of students who reported that their teachers had them paint or draw make things out of clay or other materials work in a pair or group on an art project talk with others about their own or othersrsquo artwork or look at videotapes filmstrips slides or television programs about art
Fewer students visit art museums with class in 2008 Exposure to art museums and exhibits outside of school may help students learn about and engage in visual arts Sixteen percent of students in 2008 reported that they had gone with their class to an art museum gallery or exhibit at least once in the last year which was smaller than the 22 percent in 1997 (fi gure 16)
Although not presented here graphically 54 percent of eighth-graders reported that they or their teacher saved their artwork in a portfolio in 2008 which was not signifi cantly different from the 50 percent in 1997
About half of students save artwork in a portfolio
Figure 15 Percentage of students at grade 8 by student-reported in-school activities their teachers have them do in art at least once a month 1997 and 2008
45
43
21
27
50
43
39
47
41
38
80
80
53
40
Paint or draw
Make things out of clay or
other materials
Choose own art project
Work in a pair or a group on an
art project
Talk with others about own artwork or
that of other students
Write about own artwork
Look at videotapes filmstrips slides
or television programs about art
1997
2008
0 10 20 30 40 50 60 70 80 90 100
Percent
Significantly different (p lt 05) from 2008
Figure 16 Percentage of students at grade 8 who reported visiting an art museum gallery or exhibit with their class at least once a year 1997 and 2008
1997
2008 16
22
0 10 20 30 40 50 60 70 80 90 100
Percent
Significantly different (p lt 05) from 2008 SOURCE US Department of Education Institute of Education Sciences National Center for Education Statistics National Assessment of Educational Progress (NAEP) 1997 and 2008 Arts Assessments
25ARTS 2008
What Eighth-Graders Know and Can Do in Visual Arts The item map below is useful for understanding studentsrsquo performance at different points on the responding scale The scale scores on the left represent the average scores for students who were likely to get the questions correct or partially correct Scores for the 25th and 75th percentiles are also noted The descriptions of selected assessment questions are listed on the right
For example the map shows that higher-performing eighth-graders in the upper range of the scale with an average score of 237 were likely to be able
Grade 8 NAEP Visual Arts Responding Item Map Scale score Question description
to identify the style of an artwork as surrealism Middle-performing students with an average score of 144 were likely to be able to analyze the subject of five motherchild portraits of different genres
Constructed-response questions for which students could earn partial credit may appear on the map multiple times once for each level of credit For example a question asking students to describe two characteristics of charcoal in a self-portrait appears at the score of 201 for responses receiving full credit and at 134 for responses receiving partial credit
300
285 Support plausible interpretation of Schiele self-portrait with observations about style line and color 280 Explain how an unusualunexpected feature of a Bearden collage contributes to the work as a whole 256 Analyze and support with references to the work the narrative conveyed by a Bearden collage 241 Describe at least three aspects of own self-portrait that communicate something about you 240 Explain materials and design of own package idea for transporting fi sh on bicycle 237 Identify the style of an artwork as surrealism 229 Label and specifi cally describe one or two features of a Bearden collage that the artist wants you to notice 224 Identify a technical similarity between Schiele and Kollwitz self-portraits (page 28) 221 Explain how artist used light and shadow to create realism in motherchild portrait 220 Explain three ways an artist made some things look near and some far in motherchild portrait 213 Support plausible interpretation of Schiele self-portrait with observations about style line or color 205 Explain how Bearden creates contrast between interior and exterior areas in collage 202 Describe two aspects of own self-portrait that communicate something about you 201 Describe two characteristics of charcoal in Kollwitz self-portrait (page 29) 197 Identify an example of Renaissance art 197 Identify compositional emphasis in a Bearden collage 189 Identify an example of 20th century western art 176 Compare in specifi c terms how Kollwitz has drawn different parts of her self-portrait and offer plausible
interpretation for differences (pages 30 and 31) 176 Explain where artist has used light and shadow to create realism in motherchild portrait
172 Describe and support how memory of place is shown in own collage 170 Explain how artist used light to create a lack of realism in motherchild portrait 144 Analyze subject of fi ve motherchild portraits of different genres 136 Describe one aspect of own self-portrait that communicates something about you 134 Describe one characteristic of charcoal in Kollwitz self-portrait (page 29)
128 Identify an unusualunexpected feature of the Bearden collage 62 Describe memory of place andor aspect(s) of own collage 61 Describe what Schiele self-portrait is communicating or describe an aspect of style line or color
0
174 75th percentile
128 25th percentile
NOTE Regular type denotes a constructed-response question Italic type denotes a multiple-choice question The position of a question on the scale represents the average scale score attained by students who had a 65 percent probability of obtaining credit at a specific level of a constructed-response question or a 74 percent probability of correctly answering a four-option multiple-choice question SOURCE US Department of Education Institute of Education Sciences National Center for Education Statistics National Assessment of Educational Progress (NAEP) 2008 Arts Assessment
26 THE NATIONrsquoS REPORT CARD
Self-portrait B Egon Schiele Crayon and watercolor on buff paper Galerie St Etienne
Self-portrait A Kathe Kollwitz Charcoal on brown laid paper National Gallery of Art
Sample Questions for Visual Arts Students were asked a series of questions related to two self-portraits shown here one by Kathe Kollwitz (A) and one by Egon Schiele (B) These questions required students to apply their knowledge of aesthetic properties to the two artworks and to consider the relationships between these properties and the expressive qualities of each work Students were then asked to create a self-portrait of their own
27ARTS 2008
B
SAMPLE QUESTION Recognizing a Technical Similarity Between Two Self-Portraits
The sample question below asked students to recognize a technical similarity between the Kollwitz and Schiele self-portraits In both works
In 2008 thirty-seven percent of students correctly identified this common feature of the two artworks (choice B) This was not found to be significantly
expressive loose lines are combined with precise different from the 36 percent who answered drawing correctly in 1997 Choices A C and D do not
accurately describe technical similarities between the two works
Which statement describes a technical similarity between self-portraits A and B
The figure in each work is seen from the same point of view
Both works combine loose gestural lines with careful drawing
The compositions in both works are symmetrical
Both works rely on light and shadow to emphasize depth
A
C
D
BBBBBBBBBBBBBBBBBBBBBBBB
Choice A Choice B Choice C Choice D Omitted
8 37 8 46
Percentage of students in each response category at grade 8 2008
Rounds to zero NOTE Detail may not sum to totals because of rounding SOURCE US Department of Education Institute of Education Sciences National Center for Education Statistics National Assessment of Educational Progress (NAEP) 2008 Arts Assessshyment
28 THE NATIONrsquoS REPORT CARD
SAMPLE QUESTION Characteristics of Charcoal The sample question below asked students to Unacceptable Examples of Acceptable and Partial describe characteristics of the medium of charcoal responses are shown here Responses rated as visible in the Kollwitz self-portrait Student Unacceptable did not describe characteristics of the responses for this question were rated using medium of charcoal evident in the self-portrait three scoring levels Acceptable Partial and
This sample response was rated ldquoAcceptablerdquo because it demonstrated the studentrsquos knowledge of charcoal as a medium The student expressed what Kollwitz was able to accomplish with charcoal in her self-portrait Thirty-four percent of eighth-graders received a rating of ldquoAcceptablerdquo on this question
Self-portrait A is a charcoal drawing Describe two characteristics of charcoal that you see in self-portrait A
1
2
Acceptable Partial Unacceptable Omitted
34 38 27 1 NOTE Detail may not sum to totals because the percentage of responses rated as ldquoOff-taskrdquo is not shown Off-task responses are those that do not provide any information related to the assessment task SOURCE US Department of Education Institute of Education Sciences National Center for Education Statistics National Assessment of Educational Progress (NAEP) 2008 Arts Assessshyment
Percentage of students in each response category at grade 8 2008
This sample response was rated ldquoPartialrdquo because it provided only one example of how charcoal was used in the self-portrait The student recognized that pressing harder on charcoal results in a darker mark as is evident in the Kollwitz self-portrait However the second part of the response did not describe another characteristic of charcoal as a medium Thirty-eight percent of studentsrsquo responses to this question were rated ldquoPartialrdquo
Self-portrait A is a charcoal drawing Describe two characteristics of charcoal that you see in self-portrait A
1
2
29ARTS 2008
a s
SAMPLE QUESTION Relationship Between Technical Approach and Meaning
Both parts of this sample response were rated ldquoAcceptablerdquo This response accurately described the differences between the parts of the drawing and then used thesss eeee oooo bbbbsssseeeeerrrr vvvvvaaaattttiiiiii oooooo nnnnnnnsssssss tttttt ooooooo ooooooooffffffffffffffffeeeeeeeerrrrrr aaaaaaaannnnnnnn iiiiiiiinnnnnnnnssssssssiiiiiiiigggggggghhhhhhhhttttttttffffffffuuuuuuuullllllll andddd pllausible interpretation of the reasons for those differences
Fifty-three percent of students received a rating of ldquoAcceptablerdquo for part A and 19 percent received an ldquoAcceptablerdquo rating for part B Students who received the ldquoAcceptablerdquo rating were able to both comprehend
pthe formal characteristics of the self-portrait and discuss the relationship between those characteristics and the artistrsquos possible expressive goals
Look at self-portrait A Compare how Kollwitz has drawn her head and hand with the way she has drawn her arm Be specific
A
Explain what you think Kollwitz may have been trying to communicate about herself by drawing these different parts of her self-portrait in different ways
B
THE NATIONrsquoS REPORT CARD
The two-part sample question below required students to analyze and interpret the Kollwitz self-portrait to explore relationships between technical approach and meaning Part A of the question asked students about the workrsquos formal characteristics while part B asked them to connect those characteristics with what the artist was attempting to communicate Student responses
to each of the two parts were rated separately using three scoring levels Acceptable Partial and Unacceptable Examples of Acceptable and Partial student responses for each part of this question are shown here Unacceptable responses for the question neither addressed differences in the way the parts of the self-portrait are drawn nor offered interpretations linked to observations
30
Both parts of this sample response received a ldquoPartialrdquo rating This response accurately described the way the arm is drawn but did not specifi cally address the ways in which the head and hand are drawn differently from the arm ldquoPartialrdquo credit was given for recognizing some characteristics of the artwork While a few plausible interpretations about what Kollwitz was trying to communicate are provided in the second part of the response none of these is clearly linked to the descriptions offered in the fi rst part
Look at self-portrait A Compare how Kollwitz has drawn her head and hand with the way she has drawn her arm Be specifi c
A
Explain what you think Kollwitz may have been trying to communicate about herself by drawing these different parts of her self-portrait in different ways
Fifteen percent of the student responses were rated B ldquoPartialrdquo for part A and 52 percent were rated ldquoPartialrdquo for part B
Percentage of students in each response category at grade 8 2008
Part A Part B
Acceptable Partial Unacceptable Omitted
53 15 31 2
Acceptable Partial Unacceptable Omitted
19 52 25 3
NOTE Detail may not sum to totals because the percentage of responses rated as ldquoOff-taskrdquo is not shown Off-task responses are those that do not provide any information related to the assessment task SOURCE US Department of Education Institute of Education Sciences National Center for Education Statistics National Assessment of Educational Progress (NAEP) 2008 Arts Assessment
31ARTS 2008
t t t t
a t
t t
s c
t
ldquoldquo
SAMPLE QUESTION Creating a Self-Portrait After students had observed the Kollwitz and Schiele self-portraits and studied relationships between the technical and expressive qualities of the two artworks they were asked to create a self-portrait of their own Students were given a set of
a mirror and a sheet of 12-inch by 18-inch white drawing paper and were asked to use these tools to create a self-portrait that would express something important about their personalities These self-portraits were rated using four scoring levels
12 Cray-pas (colored oil pastels) a charcoal pencil Sufficient Uneven Minimal and Insufficient
ChChCharararracacacteteteririristststicicic ooofff wowoworkrkksss rararateteteddd ldquoSldquoSSufufu ficficccieieientntntrdquordquordquo bbbototothhh ofoffo ttt hehehe stststudududu enenenen tststsrsquorsquorsquo rererere spspspoononon seseesessss prprpp essesenenene teteteddd heheherererr sssshohohowewew ddd clclc eaeaeae rr ananandddd spspspp ecifiifififi cccc obobobseseservrvrvatatatioioionsnsns ttthahahaa tt cococommmmmm unununiciccatatatededed sssomomommetetethihihi ngngg immmm poop rtrtrtananan ttt ababbouououo ttt ththth eeee ararartitit stststs ThThThTh eyeyy iiincncncn ororo popoorararaa teteteedddd ididdeenentititit fyfyfyininingg dedede tata ilii iinn tetett rmrmrm ss ofofoff pppererrersososos nananana ll fefefeeatata ururu eses aandndd ininn sstutuudededentntt rerere spsppppononon seseee 11 ananann aaa ctctivivi itiityyy (a(a(artrtt mmm akaka inining)g)g) ThThheee seses lflfflflf -p-p-pororortrtrtrt aiaiaitststss shshshowowowow edeeded pppururu popoposeses efufuffu lll usussu eee ofofof cccommompopoosisis tititt ononon alal eeelelemememme ntntntsss anann ddddd sososososso phphphphphp isssisstitttiticacacacateteteedddd usussuseee ofofof mmm atataterereriaiaiaalssl FoFoFo rr exexexe amamamm plplplpleee iinnn ststststudududeneneenttt rerereespspspp onononnsesese 111 hthththh eee smsmms udududu gigigigg ngngngn g ooofff CrCrCrCr ayayayy-p-p-pasasas cccrerereatatatatededed anananan aaaaffiffiffiffininininitytyty aaamomomoo ngngng tttt hehehehee hhhheaeaeaaee ddddd aaa rmrmrm ananana ddd hahahandndnddn ananana ddd lolooolo oosoososeee wewewewe lllll-p-p-p-pp lalalaacececece dddd lililiinenenenesssss adadadadd dedededdeddddd dededed fifinfinnfinitititioioionnn tototoo ttthehehee bbbb ododododo yyy
Percentage of students in each response category at grade 8 2008
BoBoBoBBothththth wwworororoorksksksk aaaaalslslslsooo shshhs howwowowedeede vvvererere yyyyy gogogoododod uuu sesese ooofff prprpropopo ororortititionnno n cocococoo lololorrr aaaaandndnd lll inininn eeee aaandndndd wwwererer eee fuufullllllyyy dededevevev lololopepep dd anananndd nininindididid vivividududualalalizizizizi ededededded FoFoFoF rrr exexexxamamamamplpleee iiinnn stststududdenene n ttt rerere spspps onononn seseee 222222 thhhhhhthhththhhhth e stststs udududd enenenntt skskkk liliii lfflflflf ululullylyly uuuseseseseedddd cocococo lolorrr tototo eempmpmmp hahhah sisisizezez aaa ndndndndn cccrerere atatat eeeeeee cococo ntntnttrarraaststs bbbetetetwewewewe eenenn sssspepepppecicicificficficfic pppp araara tstst s ooff heherrr seseselflfl -p-pp ororor trtrtraiaiaittt BoBoBoBothththh sss tututudededed nntntn rrresesespopoo nsnsnsn eses 11 aaandndndnd 222 aalslslsooo shsshshowowededed eeevivivvvidededeencnccccncncncccc e ofoffof ttttheheehh sss tututudededed ntntntntsss hahahah vivivingngng ssspepeepentntntnt tttimimimeee obobob seseservrvinini gggg thththeee KoKoKolllll wwiwwww tz anana ddd ScScScSchihihielele ee seses lflflf-p-p-porororortrtrrtrraiaiaitststs FoFoFoFooururr pppererercececentntnt ooo fff stststudududenenntstststsrsquorsquorsquorsquo sssesss lfshypopopoortrtrt rararaaitititsss wewewererere rrratatatededed ldquoldquoSuSuSuu ffiffifficicciennee ttrdquordquordquo
1
2
Sufficient Uneven Minimal Insufficient Omitted
4 25 57 14 Rounds to zero NOTE Detail may not sum to totals because the percentage of responses rated as ldquoOff-taskrdquo is not shown Off-task responses are those that do not provide any information related to the assessment task SOURCE US Department of Education Institute of Education Sciences National Center for Education Statistics National Assessment of Educational Progress (NAEP) 2008 Arts Assessshyment
32 THE NATIONrsquoS REPORT CARD
Works at the ldquoUnevenrdquo level made some specific observations They sometimes employed pertinent compositional elements gave attention to details such as facial features to convey expression andor effectively used materials to communicate However ldquoUnevenrdquo works were typically inconsistent or incomplete in parts
In the sample presented here the student gave her work individuality by vivid use of color facial expression and the symbols incorporated in her jewelry and the background However elements of her work seem inconsistent and lacking in deliberation such as the placement and rendering of the symbols and colors in the background Twenty-five percent of studentsrsquo self-portraits were rated ldquoUnevenrdquo
As with many works rated at the ldquoMinimalrdquo level in the sample self-portrait shown here efforts at specific observations were apparent but relatively minimal (the red lines in the eyes) Compositional successes may seem more accidental than deliberate and use of materials was unskilled For example while this student may have been attempting to convey some sense of an individual person by emphasizing only his eyes and mouth with color he lacked the skill to make this choice distinctive enough to convey his message Fifty-seven percent of studentsrsquo self-portraits were rated ldquoMinimalrdquo
Most self-portraits rated ldquoInsufficientrdquo were generally so schematic as to convey little or nothing about the student Like the sample self-portrait shown here they showed unspecific observation little awareness of composition and highly unskilled use of materials In contrast to the ldquoMinimalrdquo response there were no features in this self-portrait that conveyed anything specific about a person and it remained at a general level Fourteen percent of studentsrsquo self-portraits were rated ldquoInsufficientrdquo
33ARTS 2008
Sampling and Weighting The schools and students who participate in NAEP assessments are selected to form a representative sample of the nation The national sample of eighth-graders in the 2008 arts assessment was chosen using a multistage design that involved drawing students from the sampled public and private schools across the country The results from the assessed students were combined to provide accurate estimates of the overall performance of students in the nation
Each school that participated in the assessment and each student assessed represents a portion of the population of interest Results are weighted to make appropriate inferences between the student samples and the respective populations from which they are drawn Sampling weights are adjusted for the disproportionate representation of some groups in the selected sample This includes the oversampling of schools with high concentrations of students from certain racialethnic groups and the lower sampling rates of students who attend very small schools
School and Student Participation Rates The school and student participation rates for public and private schools in the 2008 arts assessment are provided in table A-1
NCES statistical standards require that a nonresponse bias analysis be conducted for any school or student group with a participation rate that falls below 85 percent The participation rates for the 2008 NAEP arts assessment indicated a need for a school nonresponse bias analysis for the private school sample The results showed that school substitution and nonresponse adjustments were not effective in reducing nonresponse bias for the percentage of Hispanic students enrolled and type of private schools (Catholic and other private schools) The disproportionate nonresponse resulted
in an overestimation of the percentage of Hispanic students an overestimation of the percentage of Catholic school students and an underestimation of the percentage of other private school students
Table A-1 School and student participation rates in NAEP arts at grade 8 by subject and type of school 2008
Subject and type of school
Music
Nation
Public
Private
Visual arts
Nation
Public
Private
School participation Student participation
Number of Number of schools Weighted students Weighted
participating percent assessed percent
260 97 4000 93
220 99 3400 93
30 76 500 97
260 97 3900 92
220 99 3400 92
30 76 500 94
NOTE The numbers of schools are rounded to the nearest ten and the numbers of students are rounded to the nearest hundred Detail may not sum to totals because of rounding SOURCE US Department of Education Institute of Education Sciences National Center for Education Statistics National Assessment of Educational Progress (NAEP) 2008 Arts Assessment
Interpreting Statistical Signifi cance Comparisons over time or between groups in this report are based on statistical significance at the 05 level using t-tests with appropriate adjustments for multiple comparisons (using the False Discovery Rate procedure) These statistical tests consider both the size of the differences and standard errors of the two statistics being compared Standard errors are margins of error and estimates based on smaller groups are likely to have larger margins of error relative to estimates based on larger groups Note for example that differences based on schoolshyadministrator-reported estimates have smaller sample sizes than differences based on student-reported estimates resulting in smaller signifi cant differences in the student-reported data than in the
THE NATIONrsquoS REPORT CARD 34
school-administrator-reported data The size of the standard errors may also be influenced by other factors such as how representative the students assessed are of the entire population
When an estimate has a large standard error a numerical difference that seems large may not be statistically significant Differences of the same magnitude may or may not be statistically significant depending upon the size of the standard errors of the estimates For example a 10-point difference between male and female students may be statistically significant while a 10-point difference between students attending public and private schools may not be Standard errors for the estimates presented in this report are available at httpncesedgovnationsreportcardnaepdata and on the 2008 arts results website at http nationsreportcardgovarts_2008
National School Lunch Program NAEP collects data on student eligibility for the National School Lunch Program (NSLP) as an indicator of poverty Under the guidelines of NSLP children from families with incomes below 130 percent of the poverty level are eligible for free meals Those from families with incomes between 130 and 185 percent of the poverty level are eligible for reduced-price meals (For the period July 1 2007 through June 30 2008 for a family of four 130 percent of the poverty level was an annual income of $27000 and 185 percent was $38000) For more information on NSLP visit httpwww fnsusdagovcndlunch
School Location Results of the 2008 NAEP arts assessment were reported for four mutually exclusive categories of school location These categories are based on standard definitions established by the Federal Office of Management and Budget using population and geographic information from the US Census Bureau The classification system is referred to as ldquourban-centric locale codesrdquo which classifies territory into four major types
city suburb town and rural More details on the classification system can be found at httpnces edgovccdrural_localesasp
The Creating Task Score Studentsrsquo performance on questions assessing the creating process in visual arts is presented as the average creating task score in this report The creating task score for each creating question (task) is the sum of the percentage of students receiving full credit and a fraction of the percentage of students receiving partial credit The individual scores are then averaged together to report an average creating task score for the entire set of the visual arts creating questions
An example of computing the creating task score is provided below for a sample question in this report that asks eighth-graders to draw a self-portrait Responses to this question were scored ldquoSufficientrdquo ldquoUnevenrdquo ldquoMinimalrdquo or ldquoInsufficientrdquo The percentages of students falling into these four scoring levels are 4 percent 25 percent 57 percent and 14 percent respectively (table A-2) Responses at these four levels receive
1score weights of 1 23 and 0 respectively The
3creating task score for this question is computed as 1 (4) + 2 (25) + 1 (57) + 0 (14) = 403 3
Table A-2 Example showing how the creating task score was computed for a sample question in NAEP visual arts at grade 8 2008
Percentage Percentage of of students times
Scoring level students Score weight score weight
Sufficient 4 1 4
Uneven 25 2 3 17
Minimal 57 1 3 19
Insufficient 14 0 0
Creating task score (4 + 17 + 19 + 0) = 40
SOURCE US Department of Education Institute of Education Sciences National Center for Education Statistics National Assessment of Educational Progress (NAEP) 2008 Arts Assessment
ARTS 2008 3535
Comparing Results Between the 1997 and 2008 Assessments Although the assessment questions adminshyistered in 2008 were selected from those used in the 1997 assessment due to changes in scoring procedures and materials the 2008 score results in music and visual arts could not be directly compared to the results in 1997
In the 2008 arts assessment the scoring guides for constructed-response questions the sample questions and student responses used to train scorers and the standardized training procedures were updated to refl ect changes in training and scoring procedures that have been adapted for use across all NAEP assessments since 1997 In addition because the student artwork used as training samples for visual arts in 1997 had degraded over time and because of differences in the availability of certain types of art supplies and tools between 1997 and 2008 new samples were developed for scoring studentsrsquo responses to the creating questions in 2008
However since the scoring method for multiple-choice questions was the same in 1997 and 2008 direct comparisons could be made between the two years on results for these questions in music and visual arts (tables A-3 and A-4) Because multiple-choice questions were only a portion of the assessment and only assessed certain types of topics in the responding process of music and visual arts the changes in studentsrsquo performance between 1997 and 2008 on these questions did not represent the performance changes for the constructed-response questions or the entire assessment
Table A-3 Percentage correct for multiple-choice questions in NAEP music at grade 8 1997 and 2008
Percent correct
Question description 1997 2008
Overall 53 51
Identify directional contour of part of melodic phrase 79 77
Identify form of vocal music in a recording (musical excerpt 1) 78 76
Identify the type of instrumental ensemble performing an excerpt 75 71
Identify form of musical examples as theme and variations 64 64
Identify a bass clef symbol 63 62
Identify pitch contour of melody in a recording 63 56
Identify saxophone as instrument playing melody 66 56
Identify a half note in printed music 52 56
Identify a correct time signature for a piece of printed music 55 52
Select a line drawing refl ective of the texture of an example of music 52 52
Identify the solo instrument beginning ldquoRhapsody in Bluerdquo 52 50
Identify form of vocal music in a recording (musical excerpt 2) 60 49
Identify an appropriate texture drawing for a homophonic excerpt 51 48
Identify term best describing the texture 47 47
Identify an appropriate description of the texture of a recorded excerpt 50 44
Identify correct time signature for recorded excerpt 42 43
Identify the name of a pitch shown in the treble clef 42 41
Identify an octave interval in a printed score 37 38
Identify the term for fermata symbol 38 33
Identify which voices enter fi rst in a choral excerpt 32 28
Identify the quality of a triad in a printed score 15 21 Significantly different (p lt 05) from 2008 SOURCE US Department of Education Institute of Education Sciences National Center for Education Statistics National Assessment of Educational Progress (NAEP) 1997 and 2008 Arts Assessments
Table A-4 Percentage correct for multiple-choice questions in NAEP visual arts at grade 8 1997 and 2008
Percent correct
Question description 1997 2008
Overall 42 42
Identify purpose of insulating package material 61 62
Identify an example of 20th-century western art 55 59
Infer from photograph advantages of shrink-wrap packaging 57 57
Identify an example of a Renaissance painting 48 50
Identify compositional emphasis in a Bearden collage 49 46
Identify genre of a Bearden collage 34 37
Identify a technical similarity between Schiele and Kollwitz self-portraits 36 37
Identify an important compositional aspect of a Kollwitz self-portrait 40 37
Identify a stylistic emphasis in a Bearden collage 29 35
Identify a compositional feature of a medieval artwork 39 32
Identify the style of an artwork as surrealism 27 31
Identify an artistic style that infl uenced cubism 25 23 Significantly different (p lt 05) from 2008 SOURCE US Department of Education Institute of Education Sciences National Center for Education Statistics National Assessment of Educational Progress (NAEP) 1997 and 2008 Arts Assessments
THE NATIONrsquoS REPORT CARD 36
Table A-5 Percentage of students in NAEP arts assessment at grade 8 by selected student and school characteristics 2008
Student characteristics Music Visual arts
SD andor ELL
Identified 17 17
Excluded 2 2
Assessed 15 16
Without accommodations 6 6
With accommodations 8 10
SD
Identified 12 12
Excluded 1 2
Assessed 10 11
Without accommodations 3 2
With accommodations 7 8
ELL
Identified 6 6
Excluded 1 1
Assessed 5 6
Without accommodations 4 4
With accommodations 2 2 NOTE Students identified as both SD and ELL were counted only once under the combined SD andor ELL category but were counted separately under the SD and ELL categories Detail may not sum to totals because of rounding SOURCE US Department of Education Institute of Education Sciences National Center for Education Statistics National Assessment of Educational Progress (NAEP) 2008 Arts Assessment
Table A-6 Percentage of students with disabilities (SD) andor English language learners (ELL) identified excluded and assessed in NAEP music and visual arts at grade 8 as a percentage of all students 2008
NOTE Black includes African American Hispanic includes Latino and Pacific Islander includes Native Hawaiian Race categories exclude Hispanic origin Detail may not sum to totals because of rounding SOURCE US Department of Education Institute of Education Sciences National Center for Education Statistics National Assessment of Educational Progress (NAEP) 2008 Arts Assessment
Student and school characteristics Music Visual arts
Raceethnicity
White 61 61
Black 15 14
Hispanic 18 17
AsianPacific Islander 5 5
American IndianAlaska Native 1 2
Unclassified 1 1
Gender
Male 50 51
Female 50 49
Eligibility for freereduced-price school lunch
Eligible 36 37
Not eligible 57 56
Information not available 7 8
Type of school
Public 93 92
Private 7 8
School location
City 29 29
Suburb 37 36
Town 12 13
Rural 22 22
37ARTS 2008 37
u S d e p A r t M e n t o f e d u C A t i o n The National Assessment of Educational Progress (NAEP) is a congressionally authorized project sponsored by the US Department of Education The National Center for Education Statistics a department within the Institute of Education Sciences administers NAEP The Commissioner of Education Statistics is responsible by law for carrying out the NAEP project Arne Duncan John Easton Stuart Kerachsky Secretary Director Acting Commissioner US Department Institute of National Center for of Education Education Sciences Education Statistics
t h e n A t i o n A l A S S e S S M e n t g o V e r n i n g b o A r d In 1988 Congress created the National Assessment Governing Board to set policy for the National Assessment of Educational Progress commonly known as The Nations Report Card TM The Governing Board is an independent bipartisan group whose members include governors state legislators local and state school officials educators business representatives and members of the general public
Darvin M Winick Chair President Winick amp Associates Austin Texas
Amanda P Avallone Vice Chair Assistant Principal and Eighth-Grade Teacher
Summit Middle School Boulder Colorado
David J Alukonis Former Chairman Hudson School Board Hudson New Hampshire
Gregory Cizek Professor of Educational Measurement
University of North Carolina Chapel Hill North Carolina
Carol A DrsquoAmico President and Chief Executive Officer
Conexus Indiana Indianapolis Indiana
Honorable David P Driscoll Former Commissioner of Education
Massachusetts Department of Education
Malden Massachusetts
Louis M Fabrizio Director of Accountability Policy and Communications
North Carolina Department of Public Instruction
Raleigh North Carolina
Honorable Anitere Flores Member Florida House of Representatives Miami Florida
Alan J Friedman Consultant Museum Development and Science Communication
New York New York
David W Gordon County Superintendent of Schools Sacramento County Office of Education
Sacramento California
Robin C Hall Principal Beecher Hills Elementary School Atlanta Georgia
Kathi M King Twelfth-Grade Teacher Messalonskee High School Oakland Maine
Kim Kozbial-Hess Educational Technology Trainer Hawkins Elementary School Toledo Ohio
Henry Kranendonk Mathematics Curriculum Specialist Milwaukee Public Schools Milwaukee Wisconsin
James S Lanich President California Business for Education Excellence
Sacramento California
Honorable Cynthia L Nava Senator New Mexico State Senate Las Cruces New Mexico
Honorable Steven L Paine State Superintendent of Schools West Virginia Department of Education
Charleston West Virginia
Honorable Sonny Perdue Governor of Georgia Atlanta Georgia
Susan Pimentel Educational Consultant Hanover New Hampshire
Andrew C Porter Dean Graduate School of Education University of Pennsylvania Philadelphia Pennsylvania
Warren T Smith Sr Vice President Washington State Board of Education
Olympia Washington
Mary Frances Taymans SND Executive Director Secondary Schools Department National Catholic Educational Association
Washington DC
Oscar A Troncoso Principal Anthony High School Anthony Texas
Eileen L Weiser General Public Representative Ann Arbor Michigan
John Easton (Ex officio) Director Institute of Education Sciences US Department of Education Washington DC
Mary Crovo Interim Executive Director National Assessment Governing Board
Washington DC
t h e n a t i o n rsquo s r e p o r t c a r d
A r t s 2 0 0 8
M u s i c amp V i s u a l A r t s June 2009
M o r e i n f o r M A t i o n The report release site is httpnationsreportcardgov The NCES web electronic catalog is httpncesedgov pubsearch
For ordering information write to US Department of Education ED Pubs PO Box 1398 Jessup MD 20794-1398
or call toll free 1-877-4ED-Pubs
or order online at httpwwwedpubs org
S u g g e S t e d C i t A t i o n Keiper S Sandene BA Persky HR and Kuang M (2009) The Nationrsquos Report Card Arts 2008 Music amp Visual Arts (NCES 2009ndash488) National Center for Education Statistics Institute of Education Sciences US Department of Education Washington DC
C o n t A C t Emmanuel Sikali 202-502-7419 emmanuelsikaliedgov
ldquo t h e d e p A r t M e n t o f e d u C A t i o n rsquo S M i S S i o n i S t o p r o M o t e S t u d e n t A C h i e V e M e n t A n d p r e p A r A t i o n f o r g l o b A l C o M p e t i t i V e n e S S b y f o S t e r i n g e d u C A t i o n A l e x C e l l e n C e A n d e n S u r i n g e q u A l A C C e S S rdquo
wwwedgov
- Contents
- Executive Summary
- Introduction
- Music
-
- Eighty-nine-point score gap between lowest- and highest-performing students in music
- Racialethnic gender and socioeconomic gaps in music scores
- Music scores vary by type and location of schools
- Context for Arts Education in Music
- What Eighth-Graders Know and Can Do in Music
- Sample Questions for Music
-
- Visual Arts
-
- Eighty-nine-point score gap between lowest- and highest-performing students in visual arts
- Responding and creating results related
- Patterns in score gaps by student characteristics similar for responding to and creating visual arts
- No significant difference in responding scores between public and private school students
- Context for Arts Education in Visual Arts
- What Eighth-Graders Know and Can Do in Visual Arts
- Sample Questions for Visual Arts
-
- Technical Notes and Data Appendix13
- More Information
-
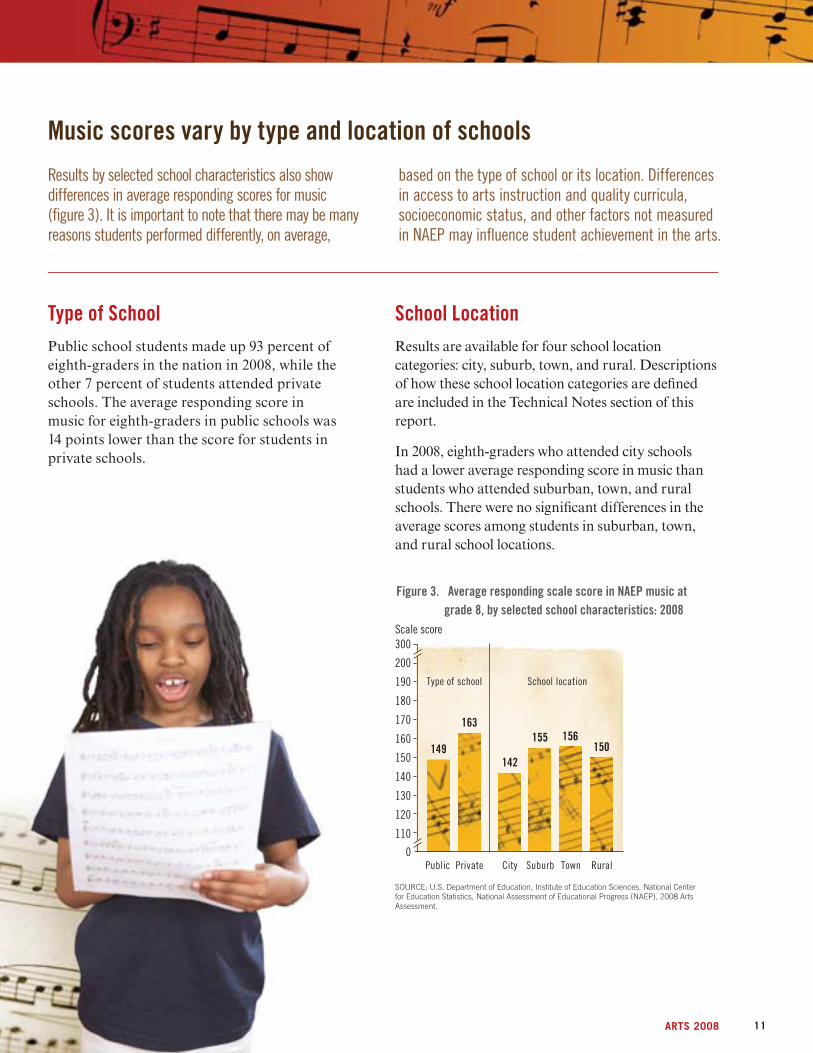
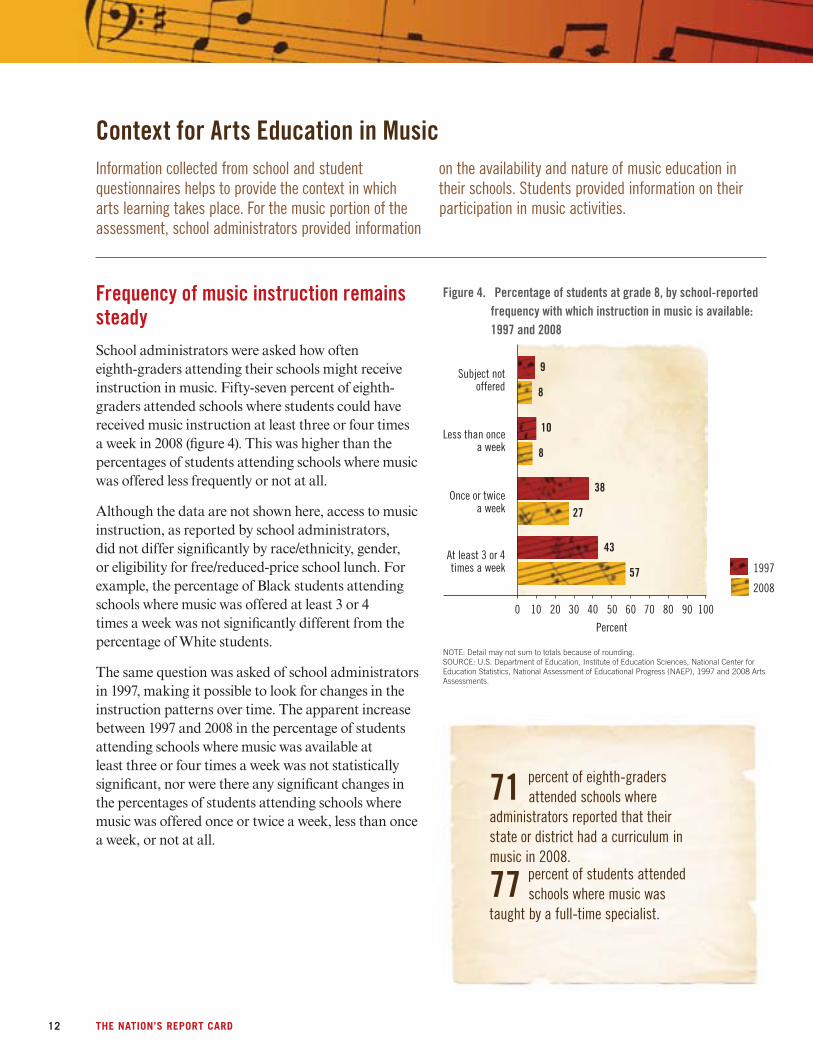
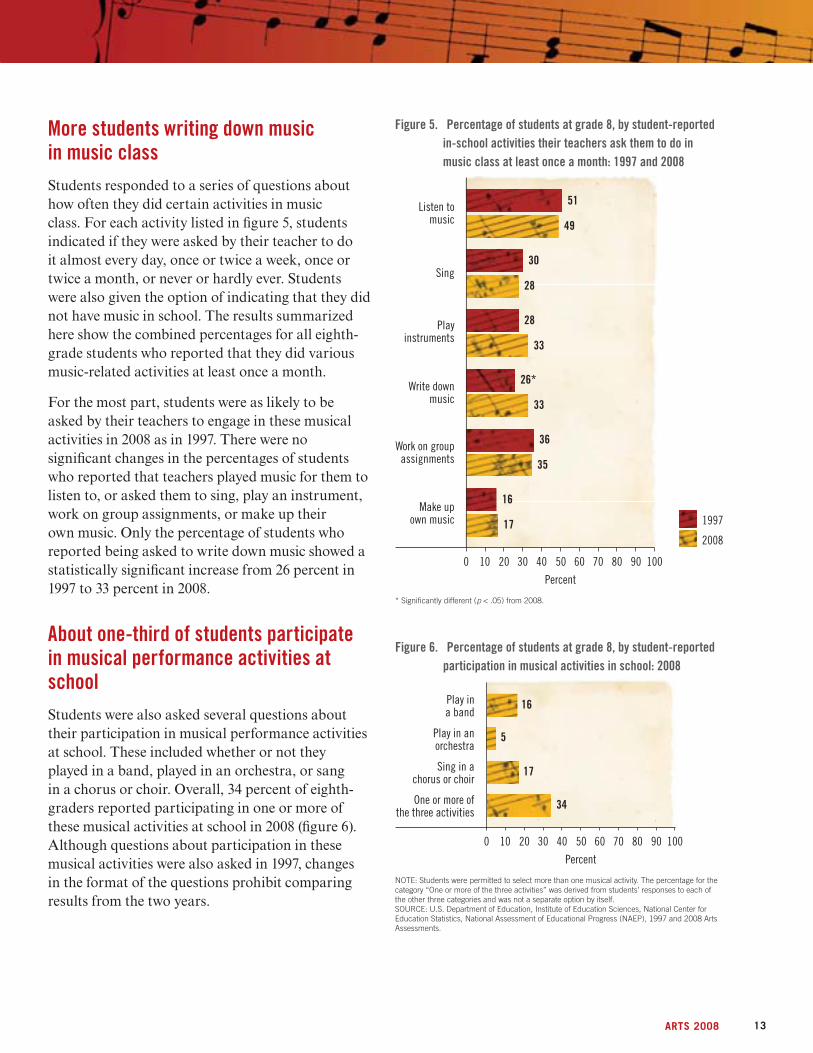
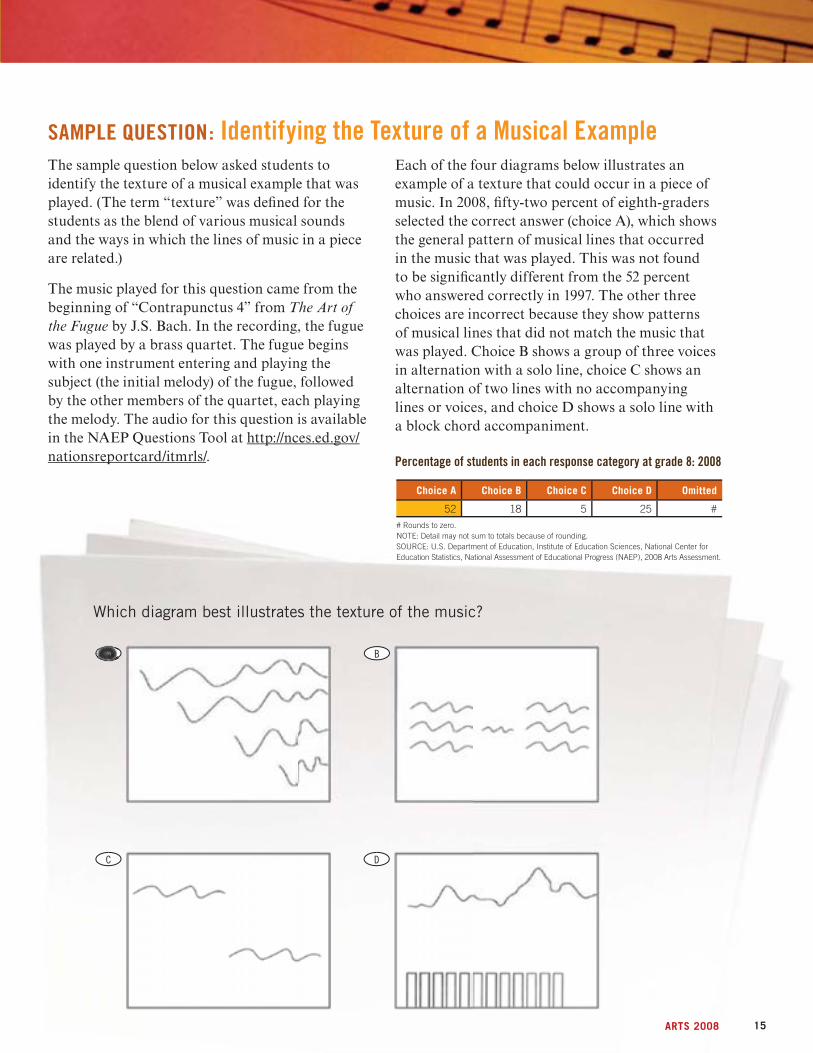
A
SAMPLE QUESTION Identifying the Texture of a Musical Example The sample question below asked students to identify the texture of a musical example that was played (The term ldquotexturerdquo was defined for the students as the blend of various musical sounds and the ways in which the lines of music in a piece are related)
The music played for this question came from the beginning of ldquoContrapunctus 4rdquo from The Art of the Fugue by JS Bach In the recording the fugue was played by a brass quartet The fugue begins with one instrument entering and playing the subject (the initial melody) of the fugue followed by the other members of the quartet each playing the melody The audio for this question is available in the NAEP Questions Tool at httpncesedgov nationsreportcarditmrls
Each of the four diagrams below illustrates an example of a texture that could occur in a piece of music In 2008 fifty-two percent of eighth-graders selected the correct answer (choice A) which shows the general pattern of musical lines that occurred in the music that was played This was not found to be significantly different from the 52 percent who answered correctly in 1997 The other three choices are incorrect because they show patterns of musical lines that did not match the music that was played Choice B shows a group of three voices in alternation with a solo line choice C shows an alternation of two lines with no accompanying lines or voices and choice D shows a solo line with a block chord accompaniment
Percentage of students in each response category at grade 8 2008
Choice A Choice B Choice C Choice D Omitted
52 18 5 25 Rounds to zero NOTE Detail may not sum to totals because of rounding SOURCE US Department of Education Institute of Education Sciences National Center for Education Statistics National Assessment of Educational Progress (NAEP) 2008 Arts Assessment
Which diagram best illustrates the texture of the music
B
DC
AAAAAAAAAAAAAAAAAAAAAAAA
15ARTS 2008
SAMPLE QUESTION Reading Musical NotationThis two-part sample question was taken from a set of questions that asked students to demonstrate knowledge of standard musical notation In the question below students were asked to provide the name and meaning of the symbol indicated in circle 1 in the music shown here No recorded music was played for this question The question that pertains to the symbol indicated in circle 2 is not
shown here but is available in the NAEP Questions Tool at httpncesedgovnationsreportcarditmrls
Student responses for this two-part question were rated using three scoring levels Adequate Limited and Inadequate Examples of Adequate and Limited responses are shown here Inadequate responses failed to provide correct information for either part of the question
Adequate Limited Inadequate Omitted
20 9 62 Rounds to zero NOTE Detail may not sum to totals because the percentage of responses rated as ldquoOff-taskrdquo is not shown Off-task responses are those that do not provide any information related to the assessment taskSOURCE US Department of Education Institute of Education Sciences National Center for Education Statistics National Assessment of Educational Progress (NAEP) 2008 Arts Assess-ment
Percentage of students in each response category at grade 8 2008
1
2
What does the symbol in circle 1 tell the performer to do
What is the musical (Italian) name for the symbol in circle 1
This sample response was rated ldquoAdequaterdquo because it provided the symbolrsquos meaning (that the music should be performed softly) and the symbolrsquos correct name (piano) Twenty percent of eighth-graders received a rating of ldquoAdequaterdquo on this question
This sample response was rated ldquoLimitedrdquo because it provided the symbolrsquos meaning but not its correct name (Pianissimo refers to the symbol pp which indicates that music should be performed very softly) Nine percent of studentsrsquo responses to this question were rated ldquoLimitedrdquo
What does the symbol in circle 1 tell the performer to do
What is the musical (Italian) name for the symbol in circle 1
16 THE NATIONrsquoS REPORT CARD
D
At the beginning of the piece a solo is played on
a flute
an oboe
a saxophone
a clarinet
A
B
C
DDDDDDDDD
SAMPLE QUESTION Identifying the Sound of an Instrument The sample question below asked students to identify the sound of an instrument The music played for this question comes from the opening of ldquoRhapsody in Bluerdquo by American composer George Gershwin The audio is available in the NAEP Questions Tool at httpncesedgov nationsreportcarditmrls
In 2008 fifty percent of eighth-graders correctly identified the clarinet as the instrument on which the solo was played (choice D) This was not found to be significantly different from the 52 percent who answered correctly in 1997 Choices A B and C are also woodwind instruments like the clarinet but were not the instrument on which the solo at the beginning of the piece was played
Choice A Choice B Choice C Choice D Omitted
12 15 22 50 Rounds to zero NOTE Detail may not sum to totals because of rounding SOURCE US Department of Education Institute of Education Sciences National Center for Education Statistics National Assessment of Educational Progress (NAEP) 2008 Arts Assessshyment
Percentage of students in each response category at grade 8 2008
17ARTS 2008
D
D
SAMPLE QUESTION Identifying Origin of a Musical Style The two-part sample question below asked students to identify music from a particular culture and to describe the features that help to characterize its style The music played for this question came from an African song entitled ldquoDrodoperdquo The audio is available in the NAEP Questions Tool at httpncesedgovnationsreportcarditmrls
Student responses for this two-part question were rated using four scoring levels Developed Adequate Limited and Inadequate Examples of Developed and Adequate responses are shown here Responses rated as Limited only provided a correct response to the first part of the question Responses rated as Inadequate failed to provide a correct response for either part of the question
This sample response was rated ldquoDevelopedrdquo because it both indicated the correct region of origin of the music and cited the ldquocall and responserdquo feature of the music that is common among many types of African songs Mentioning the use of specific percussion instruments such as drums also contributed to this response receiving a rating of ldquoDevelopedrdquo Fifty-two percent of eighth-graders received a rating of ldquoDevelopedrdquo on this question
From where does the music come
North America
South America
Asia
Africa
Other than the language used in the song describe one feature of the music that helps to identify it as coming from the part of the world you selected Be specific in your description
A
B
C
DDDDDDDDDDDDDDDDDD
From where does the music come
North America
South America
Asia
Africa
Other than the language used in the song describe one feature of the music that helps to identify it as coming from the part of the world you selected Be specific in your description
A
B
C
This sample response was rated ldquoAdequaterdquo Although it indicated the correct region of origin of the music the description of a feature of the music was vague Twenty-four percent of studentsrsquo responses to this question were rated ldquoAdequaterdquo
DDDDDDDDDDDDDDDDDDDDDDDDDDDD
Percentage of students in each response category at grade 8 2008
Developed Adequate Limited Inadequate Omitted
52 24 19 5 Rounds to zero NOTE Detail may not sum to totals because the percentage of responses rated as ldquoOff-taskrdquo is not shown Off-task responses are those that do not provide any information related to the assessment task SOURCE US Department of Education Institute of Education Sciences National Center for Education Statistics National Assessment of Educational Progress (NAEP) 2008 Arts Assessshyment
18 THE NATIONrsquoS REPORT CARD
19ARTS 2008
The 2008 arts assessment included four sections in visual arts that measured studentsrsquo ability to respond to and create visual art Students were given two of the four sections each of which contained between 7 and 11 multiple-choice and constructed-response questions Many of the visual arts questions in the assessment contained multiple parts The amount of time provided for students to complete two visual arts sections ranged from 75 minutes to 104 minutes
Responding questions asked students to analyze and describe works of art and design thereby demonstrating their knowledge of media and techniques visual organization the cultural contexts of artworks how works of art convey meaning and the relationship between form and function in design Creating questions assessed studentsrsquo ability to communicate in works of art think of different solutions to visual problems and generate ideas for and then create works of art and design These creating questions represented approximately one-half of the total assessment time in visual arts Some examples of the different types of visual arts questions are presented later in this section
20 THE NATIONrsquoS REPORT CARD
Eighty-nine-point score gap between lowest- and highest- performing students in visual arts The overall average responding score for visual arts was set at 150 in 2008 (figure 7) In addition to the overall average responding score results are shown for students at selected percentiles on the responding scale There was an 89-point gap between the scores for students at the 10th and 90th percentiles
The assessment also included questions that asked students to create works of art and design Results for these questions are presented as the average creating task score which is expressed as the average percentage of the maximum possible score ranging from 0 to 100 (see the Technical Notes for an explanation of how the score was calculated) In 2008 the overall average creating task score for grade 8 students was 52 (fi gure 8)
Responding and creating results related Because the NAEP arts framework describes the integration among the arts processes it is useful to explore the relationship between studentsrsquo results on the responding and creating questions in visual arts On average students who performed well on the responding questions also performed well on the creating questions (figure 9) For example students performing above the 75th percentile on the responding scale also had the highest average creating task score (62) Lower-performing students at or below the 25th percentile on the responding scale had the lowest average creating task score (40)
Figure 7 Average responding scale score and percentile scores in NAEP visual arts at grade 8 2008
150
104
174
300 200
190
180
170
160
150
140
130
120
110
Scale score
193
152
128
Overall 10th 25th 50th 75th 90th average score Percentile score
100
0
Figure 8 Average creating task score in NAEP visual arts at grade 8 2008
Overall 52
0 10 20 30 40 50 60 70 80 90 100
Percent of maximum score
Figure 9 Average creating task score in NAEP visual arts at grade 8 by responding score level 2008
Responding score level
Lower (lt 25th percentile)
Lower-middle (25thndash50th percentiles)
Upper-middle (50thndash75th percentiles)
Upper (gt 75th percentile)
Average creating task score
50
40
62
55
0 10 20 30 40 50 60 70 80 90 100
Percent of maximum score
SOURCE US Department of Education Institute of Education Sciences National Center for Education Statisshytics National Assessment of Educational Progress (NAEP) 2008 Arts Assessment
21ARTS 2008
Race ethnicity
54
55
46
43
49
Black
Hispanic
AsianPacific Islander
Male
White
Gender
Eligibility for free
reduced-price school lunch
54
55
46 Eligible
Not eligible
Female
Patterns in score gaps by student characteristics similar for responding to and creating visual arts
In general patterns in score differences based on student characteristics were similar for results in both responding (fi gure 10) and creating (fi gure 11)
130
120
110
RaceEthnicity In 2008 average responding scores in visual arts were 22 to 31 points higher for White and AsianPacifi c Islander students than for Black and Hispanic students There were no signifi cant differences between the average responding scores of White and AsianPacific Islander students or between the scores of Black and Hispanic students
Similarly the average creating task scores of White and AsianPacific Islander students were higher than the scores of Black and Hispanic students but there were no significant differences between the scores of White and AsianPacific Islander students or between the scores of Black and Hispanic students
Gender On average female eighth-graders had a higher responding score in visual arts than their male counterparts There was an 11-point3 gap between the two groups in 2008 The average creating task score for female students was also 5 points higher than the score for male students
Eligibility for FreeReduced-Price School Lunch On average eighth-graders who were eligible for free reduced-price school lunch had a lower responding score in visual arts than those who were not eligible There was a 29-point gap between the two groups in 2008 Students who were eligible also had an average creating task score that was 9 points lower than the score for students who were not eligible
3 The score-point gap is based on the difference between the unrounded scores as opposed to the rounded scores shown in the fi gure
Figure 10 Average responding scale score in NAEP visual arts at
200
190
180
170
160
150
140
Raceethnicity
160
129 134
156
Gender
145
155
300 Scale score
Eligibility for freereduced-price
school lunch
132
161
grade 8 by selected student characteristics 2008
0 White Black Hispanic Asian Male Female Eligible Not
Pacific eligible Islander
Figure 11 Average creating task score in NAEP visual arts at grade 8 by selected student characteristics 2008
0 10 20 30 40 50 60 70 80 90 100
Percent of maximum score
NOTE Black includes African American Hispanic includes Latino and Pacifi c Islander includes Native Hawaiian Race categories exclude Hispanic origin Sample sizes were insufshyficient to permit reliable estimates for students whose raceethnicity was American Indian Alaska Native or unclassified For the eligibility for freereduced-price school lunch category results are not shown for students whose eligibility status was not available SOURCE US Department of Education Institute of Education Sciences National Center for Education Statistics National Assessment of Educational Progress (NAEP) 2008 Arts Assessment
22 THE NATIONrsquoS REPORT CARD
No signifi cant difference in responding scores between public and private school students
While the general patterns in results for responding not all the apparent differences were found to be to and creating visual arts by selected school statistically signifi cant characteristics were similar (fi gures 12 and 13)
Type of School The apparent difference in 2008 between the average responding scores in visual arts for eighth-graders in public and private schools was not found to be statistically significant However the average creating task score was lower for public school students than for private school students
School Location Students attending suburban schools in 2008 had a higher average responding score in visual arts than students in city schools There were no significant differences in the average responding scores between students from suburban schools and town or rural schools
In the creating process of visual arts students attending suburban schools had a higher average creating task score than students in both city and town schools The average creating task score of students in suburban schools was not signifi cantly different from the score of students in rural schools
Because responding results are presented as scale scores and creating results are presented as average percentages it is not possible to compare the magnitude of differences between these scores For example an 11-point difference on the 0ndash300 responding scale between students attending schools in city and suburban locations is not necessarily greater than a 5-point difference between the same two groups on the 0ndash100 creating task scale
Figure 12 Average responding scale score in NAEP visual arts at grade 8 by selected school characteristics 2008
140
130
120
110
0 Public Private
200
190
180
170
160
150
City Suburb Town Rural
School location
144
155 149 151
Type of school
149
159
300 Scale score
Figure 13 Average creating task score in NAEP visual arts at
City
Suburb
Town
Rural
School location
52
49
50
54
Public
Private
Type of school 60
51
grade 8 by selected school characteristics 2008
0 10 20 30 40 50 60 70 80 90 100
Percent of maximum score
SOURCE US Department of Education Institute of Education Sciences National Center for Education Statistics National Assessment of Educational Progress (NAEP) 2008 Arts Assessment
23ARTS 2008
Context for Arts Education in Visual Arts To provide the context in which arts learning takes and nature of visual arts education in their schools place results are presented here based on school and studentsrsquo responses about their participation in administratorsrsquo responses related to the availability visual arts activities
Frequency of visual arts instruction remains steady School administrators were asked how often eighth-graders attending their schools might receive instruction in visual arts Forty-seven percent of eighth-graders attended schools where students could possibly receive visual arts instruction at least three or four times a week in 2008 (fi gure 14) This was higher than the percentages of students attending schools where visual arts were offered less frequently or not at all
Although the data are not shown here access to visual arts instruction did not differ significantly by race ethnicity gender or eligibility for freereduced-price school lunch For example the percentage of students who were eligible for freereduced-price school lunch attending schools where visual arts were offered once or twice a week was not significantly different from the percentage of students who were not eligible
The same question was asked of school administrators in 1997 making it possible to look for changes in the instruction patterns over time The results showed no significant changes between 1997 and 2008 in the percentages of students who attended schools where visual arts were available at least three or four times a week once or twice a week less than once a week or not at all
Figure 14 Percentage of students at grade 8 by school-reported frequency with which instruction in visual arts is available 1997 and 2008
1997
2008 47
52At least 3 or 4 times a week
30
25Once or twice
a week
5
10
Less than once a week
17
14
Subject not offered
0 10 20 30 40 50 60 70 80 90 100
Percent
NOTE Detail may not sum to totals because of rounding SOURCE US Department of Education Institute of Education Sciences National Center for Education Statistics National Assessment of Educational Progress (NAEP) 1997 and 2008 Arts Assessments
77 percent of eighth-graders attended schools where administrators reported that visual arts were taught by a full-time specialist
69 percent of students attended schools that followed a state or district curriculum in visual arts
24 THE NATIONrsquoS REPORT CARD
More students writing about their artwork
Students responded to a series of questions about how often they did certain activities in visual arts class For each activity listed in figure 15 students indicated if their teacher had them do it every day once a week once a month or never or hardly ever The results summarized here show the combined percentages for students who reported that they did various art-related activities at least once a month
The percentage of students who reported that their teacher had them write about their artwork increased from 21 percent in 1997 to 27 percent in 2008 However the percentage of students whose teacher had them choose their own art project decreased from 47 percent in 1997 to 39 percent in 2008 There were no significant changes between 1997 and 2008 in the percentages of students who reported that their teachers had them paint or draw make things out of clay or other materials work in a pair or group on an art project talk with others about their own or othersrsquo artwork or look at videotapes filmstrips slides or television programs about art
Fewer students visit art museums with class in 2008 Exposure to art museums and exhibits outside of school may help students learn about and engage in visual arts Sixteen percent of students in 2008 reported that they had gone with their class to an art museum gallery or exhibit at least once in the last year which was smaller than the 22 percent in 1997 (fi gure 16)
Although not presented here graphically 54 percent of eighth-graders reported that they or their teacher saved their artwork in a portfolio in 2008 which was not signifi cantly different from the 50 percent in 1997
About half of students save artwork in a portfolio
Figure 15 Percentage of students at grade 8 by student-reported in-school activities their teachers have them do in art at least once a month 1997 and 2008
45
43
21
27
50
43
39
47
41
38
80
80
53
40
Paint or draw
Make things out of clay or
other materials
Choose own art project
Work in a pair or a group on an
art project
Talk with others about own artwork or
that of other students
Write about own artwork
Look at videotapes filmstrips slides
or television programs about art
1997
2008
0 10 20 30 40 50 60 70 80 90 100
Percent
Significantly different (p lt 05) from 2008
Figure 16 Percentage of students at grade 8 who reported visiting an art museum gallery or exhibit with their class at least once a year 1997 and 2008
1997
2008 16
22
0 10 20 30 40 50 60 70 80 90 100
Percent
Significantly different (p lt 05) from 2008 SOURCE US Department of Education Institute of Education Sciences National Center for Education Statistics National Assessment of Educational Progress (NAEP) 1997 and 2008 Arts Assessments
25ARTS 2008
What Eighth-Graders Know and Can Do in Visual Arts The item map below is useful for understanding studentsrsquo performance at different points on the responding scale The scale scores on the left represent the average scores for students who were likely to get the questions correct or partially correct Scores for the 25th and 75th percentiles are also noted The descriptions of selected assessment questions are listed on the right
For example the map shows that higher-performing eighth-graders in the upper range of the scale with an average score of 237 were likely to be able
Grade 8 NAEP Visual Arts Responding Item Map Scale score Question description
to identify the style of an artwork as surrealism Middle-performing students with an average score of 144 were likely to be able to analyze the subject of five motherchild portraits of different genres
Constructed-response questions for which students could earn partial credit may appear on the map multiple times once for each level of credit For example a question asking students to describe two characteristics of charcoal in a self-portrait appears at the score of 201 for responses receiving full credit and at 134 for responses receiving partial credit
300
285 Support plausible interpretation of Schiele self-portrait with observations about style line and color 280 Explain how an unusualunexpected feature of a Bearden collage contributes to the work as a whole 256 Analyze and support with references to the work the narrative conveyed by a Bearden collage 241 Describe at least three aspects of own self-portrait that communicate something about you 240 Explain materials and design of own package idea for transporting fi sh on bicycle 237 Identify the style of an artwork as surrealism 229 Label and specifi cally describe one or two features of a Bearden collage that the artist wants you to notice 224 Identify a technical similarity between Schiele and Kollwitz self-portraits (page 28) 221 Explain how artist used light and shadow to create realism in motherchild portrait 220 Explain three ways an artist made some things look near and some far in motherchild portrait 213 Support plausible interpretation of Schiele self-portrait with observations about style line or color 205 Explain how Bearden creates contrast between interior and exterior areas in collage 202 Describe two aspects of own self-portrait that communicate something about you 201 Describe two characteristics of charcoal in Kollwitz self-portrait (page 29) 197 Identify an example of Renaissance art 197 Identify compositional emphasis in a Bearden collage 189 Identify an example of 20th century western art 176 Compare in specifi c terms how Kollwitz has drawn different parts of her self-portrait and offer plausible
interpretation for differences (pages 30 and 31) 176 Explain where artist has used light and shadow to create realism in motherchild portrait
172 Describe and support how memory of place is shown in own collage 170 Explain how artist used light to create a lack of realism in motherchild portrait 144 Analyze subject of fi ve motherchild portraits of different genres 136 Describe one aspect of own self-portrait that communicates something about you 134 Describe one characteristic of charcoal in Kollwitz self-portrait (page 29)
128 Identify an unusualunexpected feature of the Bearden collage 62 Describe memory of place andor aspect(s) of own collage 61 Describe what Schiele self-portrait is communicating or describe an aspect of style line or color
0
174 75th percentile
128 25th percentile
NOTE Regular type denotes a constructed-response question Italic type denotes a multiple-choice question The position of a question on the scale represents the average scale score attained by students who had a 65 percent probability of obtaining credit at a specific level of a constructed-response question or a 74 percent probability of correctly answering a four-option multiple-choice question SOURCE US Department of Education Institute of Education Sciences National Center for Education Statistics National Assessment of Educational Progress (NAEP) 2008 Arts Assessment
26 THE NATIONrsquoS REPORT CARD
Self-portrait B Egon Schiele Crayon and watercolor on buff paper Galerie St Etienne
Self-portrait A Kathe Kollwitz Charcoal on brown laid paper National Gallery of Art
Sample Questions for Visual Arts Students were asked a series of questions related to two self-portraits shown here one by Kathe Kollwitz (A) and one by Egon Schiele (B) These questions required students to apply their knowledge of aesthetic properties to the two artworks and to consider the relationships between these properties and the expressive qualities of each work Students were then asked to create a self-portrait of their own
27ARTS 2008
B
SAMPLE QUESTION Recognizing a Technical Similarity Between Two Self-Portraits
The sample question below asked students to recognize a technical similarity between the Kollwitz and Schiele self-portraits In both works
In 2008 thirty-seven percent of students correctly identified this common feature of the two artworks (choice B) This was not found to be significantly
expressive loose lines are combined with precise different from the 36 percent who answered drawing correctly in 1997 Choices A C and D do not
accurately describe technical similarities between the two works
Which statement describes a technical similarity between self-portraits A and B
The figure in each work is seen from the same point of view
Both works combine loose gestural lines with careful drawing
The compositions in both works are symmetrical
Both works rely on light and shadow to emphasize depth
A
C
D
BBBBBBBBBBBBBBBBBBBBBBBB
Choice A Choice B Choice C Choice D Omitted
8 37 8 46
Percentage of students in each response category at grade 8 2008
Rounds to zero NOTE Detail may not sum to totals because of rounding SOURCE US Department of Education Institute of Education Sciences National Center for Education Statistics National Assessment of Educational Progress (NAEP) 2008 Arts Assessshyment
28 THE NATIONrsquoS REPORT CARD
SAMPLE QUESTION Characteristics of Charcoal The sample question below asked students to Unacceptable Examples of Acceptable and Partial describe characteristics of the medium of charcoal responses are shown here Responses rated as visible in the Kollwitz self-portrait Student Unacceptable did not describe characteristics of the responses for this question were rated using medium of charcoal evident in the self-portrait three scoring levels Acceptable Partial and
This sample response was rated ldquoAcceptablerdquo because it demonstrated the studentrsquos knowledge of charcoal as a medium The student expressed what Kollwitz was able to accomplish with charcoal in her self-portrait Thirty-four percent of eighth-graders received a rating of ldquoAcceptablerdquo on this question
Self-portrait A is a charcoal drawing Describe two characteristics of charcoal that you see in self-portrait A
1
2
Acceptable Partial Unacceptable Omitted
34 38 27 1 NOTE Detail may not sum to totals because the percentage of responses rated as ldquoOff-taskrdquo is not shown Off-task responses are those that do not provide any information related to the assessment task SOURCE US Department of Education Institute of Education Sciences National Center for Education Statistics National Assessment of Educational Progress (NAEP) 2008 Arts Assessshyment
Percentage of students in each response category at grade 8 2008
This sample response was rated ldquoPartialrdquo because it provided only one example of how charcoal was used in the self-portrait The student recognized that pressing harder on charcoal results in a darker mark as is evident in the Kollwitz self-portrait However the second part of the response did not describe another characteristic of charcoal as a medium Thirty-eight percent of studentsrsquo responses to this question were rated ldquoPartialrdquo
Self-portrait A is a charcoal drawing Describe two characteristics of charcoal that you see in self-portrait A
1
2
29ARTS 2008
a s
SAMPLE QUESTION Relationship Between Technical Approach and Meaning
Both parts of this sample response were rated ldquoAcceptablerdquo This response accurately described the differences between the parts of the drawing and then used thesss eeee oooo bbbbsssseeeeerrrr vvvvvaaaattttiiiiii oooooo nnnnnnnsssssss tttttt ooooooo ooooooooffffffffffffffffeeeeeeeerrrrrr aaaaaaaannnnnnnn iiiiiiiinnnnnnnnssssssssiiiiiiiigggggggghhhhhhhhttttttttffffffffuuuuuuuullllllll andddd pllausible interpretation of the reasons for those differences
Fifty-three percent of students received a rating of ldquoAcceptablerdquo for part A and 19 percent received an ldquoAcceptablerdquo rating for part B Students who received the ldquoAcceptablerdquo rating were able to both comprehend
pthe formal characteristics of the self-portrait and discuss the relationship between those characteristics and the artistrsquos possible expressive goals
Look at self-portrait A Compare how Kollwitz has drawn her head and hand with the way she has drawn her arm Be specific
A
Explain what you think Kollwitz may have been trying to communicate about herself by drawing these different parts of her self-portrait in different ways
B
THE NATIONrsquoS REPORT CARD
The two-part sample question below required students to analyze and interpret the Kollwitz self-portrait to explore relationships between technical approach and meaning Part A of the question asked students about the workrsquos formal characteristics while part B asked them to connect those characteristics with what the artist was attempting to communicate Student responses
to each of the two parts were rated separately using three scoring levels Acceptable Partial and Unacceptable Examples of Acceptable and Partial student responses for each part of this question are shown here Unacceptable responses for the question neither addressed differences in the way the parts of the self-portrait are drawn nor offered interpretations linked to observations
30
Both parts of this sample response received a ldquoPartialrdquo rating This response accurately described the way the arm is drawn but did not specifi cally address the ways in which the head and hand are drawn differently from the arm ldquoPartialrdquo credit was given for recognizing some characteristics of the artwork While a few plausible interpretations about what Kollwitz was trying to communicate are provided in the second part of the response none of these is clearly linked to the descriptions offered in the fi rst part
Look at self-portrait A Compare how Kollwitz has drawn her head and hand with the way she has drawn her arm Be specifi c
A
Explain what you think Kollwitz may have been trying to communicate about herself by drawing these different parts of her self-portrait in different ways
Fifteen percent of the student responses were rated B ldquoPartialrdquo for part A and 52 percent were rated ldquoPartialrdquo for part B
Percentage of students in each response category at grade 8 2008
Part A Part B
Acceptable Partial Unacceptable Omitted
53 15 31 2
Acceptable Partial Unacceptable Omitted
19 52 25 3
NOTE Detail may not sum to totals because the percentage of responses rated as ldquoOff-taskrdquo is not shown Off-task responses are those that do not provide any information related to the assessment task SOURCE US Department of Education Institute of Education Sciences National Center for Education Statistics National Assessment of Educational Progress (NAEP) 2008 Arts Assessment
31ARTS 2008
t t t t
a t
t t
s c
t
ldquoldquo
SAMPLE QUESTION Creating a Self-Portrait After students had observed the Kollwitz and Schiele self-portraits and studied relationships between the technical and expressive qualities of the two artworks they were asked to create a self-portrait of their own Students were given a set of
a mirror and a sheet of 12-inch by 18-inch white drawing paper and were asked to use these tools to create a self-portrait that would express something important about their personalities These self-portraits were rated using four scoring levels
12 Cray-pas (colored oil pastels) a charcoal pencil Sufficient Uneven Minimal and Insufficient
ChChCharararracacacteteteririristststicicic ooofff wowoworkrkksss rararateteteddd ldquoSldquoSSufufu ficficccieieientntntrdquordquordquo bbbototothhh ofoffo ttt hehehe stststudududu enenenen tststsrsquorsquorsquo rererere spspspoononon seseesessss prprpp essesenenene teteteddd heheherererr sssshohohowewew ddd clclc eaeaeae rr ananandddd spspspp ecifiifififi cccc obobobseseservrvrvatatatioioionsnsns ttthahahaa tt cococommmmmm unununiciccatatatededed sssomomommetetethihihi ngngg immmm poop rtrtrtananan ttt ababbouououo ttt ththth eeee ararartitit stststs ThThThTh eyeyy iiincncncn ororo popoorararaa teteteedddd ididdeenentititit fyfyfyininingg dedede tata ilii iinn tetett rmrmrm ss ofofoff pppererrersososos nananana ll fefefeeatata ururu eses aandndd ininn sstutuudededentntt rerere spsppppononon seseee 11 ananann aaa ctctivivi itiityyy (a(a(artrtt mmm akaka inining)g)g) ThThheee seses lflfflflf -p-p-pororortrtrtrt aiaiaitststss shshshowowowow edeeded pppururu popoposeses efufuffu lll usussu eee ofofof cccommompopoosisis tititt ononon alal eeelelemememme ntntntsss anann ddddd sososososso phphphphphp isssisstitttiticacacacateteteedddd usussuseee ofofof mmm atataterereriaiaiaalssl FoFoFo rr exexexe amamamm plplplpleee iinnn ststststudududeneneenttt rerereespspspp onononnsesese 111 hthththh eee smsmms udududu gigigigg ngngngn g ooofff CrCrCrCr ayayayy-p-p-pasasas cccrerereatatatatededed anananan aaaaffiffiffiffininininitytyty aaamomomoo ngngng tttt hehehehee hhhheaeaeaaee ddddd aaa rmrmrm ananana ddd hahahandndnddn ananana ddd lolooolo oosoososeee wewewewe lllll-p-p-p-pp lalalaacececece dddd lililiinenenenesssss adadadadd dedededdeddddd dededed fifinfinnfinitititioioionnn tototoo ttthehehee bbbb ododododo yyy
Percentage of students in each response category at grade 8 2008
BoBoBoBBothththth wwworororoorksksksk aaaaalslslslsooo shshhs howwowowedeede vvvererere yyyyy gogogoododod uuu sesese ooofff prprpropopo ororortititionnno n cocococoo lololorrr aaaaandndnd lll inininn eeee aaandndndd wwwererer eee fuufullllllyyy dededevevev lololopepep dd anananndd nininindididid vivividududualalalizizizizi ededededded FoFoFoF rrr exexexxamamamamplpleee iiinnn stststududdenene n ttt rerere spspps onononn seseee 222222 thhhhhhthhththhhhth e stststs udududd enenenntt skskkk liliii lfflflflf ululullylyly uuuseseseseedddd cocococo lolorrr tototo eempmpmmp hahhah sisisizezez aaa ndndndndn cccrerere atatat eeeeeee cococo ntntnttrarraaststs bbbetetetwewewewe eenenn sssspepepppecicicificficficfic pppp araara tstst s ooff heherrr seseselflfl -p-pp ororor trtrtraiaiaittt BoBoBoBothththh sss tututudededed nntntn rrresesespopoo nsnsnsn eses 11 aaandndndnd 222 aalslslsooo shsshshowowededed eeevivivvvidededeencnccccncncncccc e ofoffof ttttheheehh sss tututudededed ntntntntsss hahahah vivivingngng ssspepeepentntntnt tttimimimeee obobob seseservrvinini gggg thththeee KoKoKolllll wwiwwww tz anana ddd ScScScSchihihielele ee seses lflflf-p-p-porororortrtrrtrraiaiaitststs FoFoFoFooururr pppererercececentntnt ooo fff stststudududenenntstststsrsquorsquorsquorsquo sssesss lfshypopopoortrtrt rararaaitititsss wewewererere rrratatatededed ldquoldquoSuSuSuu ffiffifficicciennee ttrdquordquordquo
1
2
Sufficient Uneven Minimal Insufficient Omitted
4 25 57 14 Rounds to zero NOTE Detail may not sum to totals because the percentage of responses rated as ldquoOff-taskrdquo is not shown Off-task responses are those that do not provide any information related to the assessment task SOURCE US Department of Education Institute of Education Sciences National Center for Education Statistics National Assessment of Educational Progress (NAEP) 2008 Arts Assessshyment
32 THE NATIONrsquoS REPORT CARD
Works at the ldquoUnevenrdquo level made some specific observations They sometimes employed pertinent compositional elements gave attention to details such as facial features to convey expression andor effectively used materials to communicate However ldquoUnevenrdquo works were typically inconsistent or incomplete in parts
In the sample presented here the student gave her work individuality by vivid use of color facial expression and the symbols incorporated in her jewelry and the background However elements of her work seem inconsistent and lacking in deliberation such as the placement and rendering of the symbols and colors in the background Twenty-five percent of studentsrsquo self-portraits were rated ldquoUnevenrdquo
As with many works rated at the ldquoMinimalrdquo level in the sample self-portrait shown here efforts at specific observations were apparent but relatively minimal (the red lines in the eyes) Compositional successes may seem more accidental than deliberate and use of materials was unskilled For example while this student may have been attempting to convey some sense of an individual person by emphasizing only his eyes and mouth with color he lacked the skill to make this choice distinctive enough to convey his message Fifty-seven percent of studentsrsquo self-portraits were rated ldquoMinimalrdquo
Most self-portraits rated ldquoInsufficientrdquo were generally so schematic as to convey little or nothing about the student Like the sample self-portrait shown here they showed unspecific observation little awareness of composition and highly unskilled use of materials In contrast to the ldquoMinimalrdquo response there were no features in this self-portrait that conveyed anything specific about a person and it remained at a general level Fourteen percent of studentsrsquo self-portraits were rated ldquoInsufficientrdquo
33ARTS 2008
Sampling and Weighting The schools and students who participate in NAEP assessments are selected to form a representative sample of the nation The national sample of eighth-graders in the 2008 arts assessment was chosen using a multistage design that involved drawing students from the sampled public and private schools across the country The results from the assessed students were combined to provide accurate estimates of the overall performance of students in the nation
Each school that participated in the assessment and each student assessed represents a portion of the population of interest Results are weighted to make appropriate inferences between the student samples and the respective populations from which they are drawn Sampling weights are adjusted for the disproportionate representation of some groups in the selected sample This includes the oversampling of schools with high concentrations of students from certain racialethnic groups and the lower sampling rates of students who attend very small schools
School and Student Participation Rates The school and student participation rates for public and private schools in the 2008 arts assessment are provided in table A-1
NCES statistical standards require that a nonresponse bias analysis be conducted for any school or student group with a participation rate that falls below 85 percent The participation rates for the 2008 NAEP arts assessment indicated a need for a school nonresponse bias analysis for the private school sample The results showed that school substitution and nonresponse adjustments were not effective in reducing nonresponse bias for the percentage of Hispanic students enrolled and type of private schools (Catholic and other private schools) The disproportionate nonresponse resulted
in an overestimation of the percentage of Hispanic students an overestimation of the percentage of Catholic school students and an underestimation of the percentage of other private school students
Table A-1 School and student participation rates in NAEP arts at grade 8 by subject and type of school 2008
Subject and type of school
Music
Nation
Public
Private
Visual arts
Nation
Public
Private
School participation Student participation
Number of Number of schools Weighted students Weighted
participating percent assessed percent
260 97 4000 93
220 99 3400 93
30 76 500 97
260 97 3900 92
220 99 3400 92
30 76 500 94
NOTE The numbers of schools are rounded to the nearest ten and the numbers of students are rounded to the nearest hundred Detail may not sum to totals because of rounding SOURCE US Department of Education Institute of Education Sciences National Center for Education Statistics National Assessment of Educational Progress (NAEP) 2008 Arts Assessment
Interpreting Statistical Signifi cance Comparisons over time or between groups in this report are based on statistical significance at the 05 level using t-tests with appropriate adjustments for multiple comparisons (using the False Discovery Rate procedure) These statistical tests consider both the size of the differences and standard errors of the two statistics being compared Standard errors are margins of error and estimates based on smaller groups are likely to have larger margins of error relative to estimates based on larger groups Note for example that differences based on schoolshyadministrator-reported estimates have smaller sample sizes than differences based on student-reported estimates resulting in smaller signifi cant differences in the student-reported data than in the
THE NATIONrsquoS REPORT CARD 34
school-administrator-reported data The size of the standard errors may also be influenced by other factors such as how representative the students assessed are of the entire population
When an estimate has a large standard error a numerical difference that seems large may not be statistically significant Differences of the same magnitude may or may not be statistically significant depending upon the size of the standard errors of the estimates For example a 10-point difference between male and female students may be statistically significant while a 10-point difference between students attending public and private schools may not be Standard errors for the estimates presented in this report are available at httpncesedgovnationsreportcardnaepdata and on the 2008 arts results website at http nationsreportcardgovarts_2008
National School Lunch Program NAEP collects data on student eligibility for the National School Lunch Program (NSLP) as an indicator of poverty Under the guidelines of NSLP children from families with incomes below 130 percent of the poverty level are eligible for free meals Those from families with incomes between 130 and 185 percent of the poverty level are eligible for reduced-price meals (For the period July 1 2007 through June 30 2008 for a family of four 130 percent of the poverty level was an annual income of $27000 and 185 percent was $38000) For more information on NSLP visit httpwww fnsusdagovcndlunch
School Location Results of the 2008 NAEP arts assessment were reported for four mutually exclusive categories of school location These categories are based on standard definitions established by the Federal Office of Management and Budget using population and geographic information from the US Census Bureau The classification system is referred to as ldquourban-centric locale codesrdquo which classifies territory into four major types
city suburb town and rural More details on the classification system can be found at httpnces edgovccdrural_localesasp
The Creating Task Score Studentsrsquo performance on questions assessing the creating process in visual arts is presented as the average creating task score in this report The creating task score for each creating question (task) is the sum of the percentage of students receiving full credit and a fraction of the percentage of students receiving partial credit The individual scores are then averaged together to report an average creating task score for the entire set of the visual arts creating questions
An example of computing the creating task score is provided below for a sample question in this report that asks eighth-graders to draw a self-portrait Responses to this question were scored ldquoSufficientrdquo ldquoUnevenrdquo ldquoMinimalrdquo or ldquoInsufficientrdquo The percentages of students falling into these four scoring levels are 4 percent 25 percent 57 percent and 14 percent respectively (table A-2) Responses at these four levels receive
1score weights of 1 23 and 0 respectively The
3creating task score for this question is computed as 1 (4) + 2 (25) + 1 (57) + 0 (14) = 403 3
Table A-2 Example showing how the creating task score was computed for a sample question in NAEP visual arts at grade 8 2008
Percentage Percentage of of students times
Scoring level students Score weight score weight
Sufficient 4 1 4
Uneven 25 2 3 17
Minimal 57 1 3 19
Insufficient 14 0 0
Creating task score (4 + 17 + 19 + 0) = 40
SOURCE US Department of Education Institute of Education Sciences National Center for Education Statistics National Assessment of Educational Progress (NAEP) 2008 Arts Assessment
ARTS 2008 3535
Comparing Results Between the 1997 and 2008 Assessments Although the assessment questions adminshyistered in 2008 were selected from those used in the 1997 assessment due to changes in scoring procedures and materials the 2008 score results in music and visual arts could not be directly compared to the results in 1997
In the 2008 arts assessment the scoring guides for constructed-response questions the sample questions and student responses used to train scorers and the standardized training procedures were updated to refl ect changes in training and scoring procedures that have been adapted for use across all NAEP assessments since 1997 In addition because the student artwork used as training samples for visual arts in 1997 had degraded over time and because of differences in the availability of certain types of art supplies and tools between 1997 and 2008 new samples were developed for scoring studentsrsquo responses to the creating questions in 2008
However since the scoring method for multiple-choice questions was the same in 1997 and 2008 direct comparisons could be made between the two years on results for these questions in music and visual arts (tables A-3 and A-4) Because multiple-choice questions were only a portion of the assessment and only assessed certain types of topics in the responding process of music and visual arts the changes in studentsrsquo performance between 1997 and 2008 on these questions did not represent the performance changes for the constructed-response questions or the entire assessment
Table A-3 Percentage correct for multiple-choice questions in NAEP music at grade 8 1997 and 2008
Percent correct
Question description 1997 2008
Overall 53 51
Identify directional contour of part of melodic phrase 79 77
Identify form of vocal music in a recording (musical excerpt 1) 78 76
Identify the type of instrumental ensemble performing an excerpt 75 71
Identify form of musical examples as theme and variations 64 64
Identify a bass clef symbol 63 62
Identify pitch contour of melody in a recording 63 56
Identify saxophone as instrument playing melody 66 56
Identify a half note in printed music 52 56
Identify a correct time signature for a piece of printed music 55 52
Select a line drawing refl ective of the texture of an example of music 52 52
Identify the solo instrument beginning ldquoRhapsody in Bluerdquo 52 50
Identify form of vocal music in a recording (musical excerpt 2) 60 49
Identify an appropriate texture drawing for a homophonic excerpt 51 48
Identify term best describing the texture 47 47
Identify an appropriate description of the texture of a recorded excerpt 50 44
Identify correct time signature for recorded excerpt 42 43
Identify the name of a pitch shown in the treble clef 42 41
Identify an octave interval in a printed score 37 38
Identify the term for fermata symbol 38 33
Identify which voices enter fi rst in a choral excerpt 32 28
Identify the quality of a triad in a printed score 15 21 Significantly different (p lt 05) from 2008 SOURCE US Department of Education Institute of Education Sciences National Center for Education Statistics National Assessment of Educational Progress (NAEP) 1997 and 2008 Arts Assessments
Table A-4 Percentage correct for multiple-choice questions in NAEP visual arts at grade 8 1997 and 2008
Percent correct
Question description 1997 2008
Overall 42 42
Identify purpose of insulating package material 61 62
Identify an example of 20th-century western art 55 59
Infer from photograph advantages of shrink-wrap packaging 57 57
Identify an example of a Renaissance painting 48 50
Identify compositional emphasis in a Bearden collage 49 46
Identify genre of a Bearden collage 34 37
Identify a technical similarity between Schiele and Kollwitz self-portraits 36 37
Identify an important compositional aspect of a Kollwitz self-portrait 40 37
Identify a stylistic emphasis in a Bearden collage 29 35
Identify a compositional feature of a medieval artwork 39 32
Identify the style of an artwork as surrealism 27 31
Identify an artistic style that infl uenced cubism 25 23 Significantly different (p lt 05) from 2008 SOURCE US Department of Education Institute of Education Sciences National Center for Education Statistics National Assessment of Educational Progress (NAEP) 1997 and 2008 Arts Assessments
THE NATIONrsquoS REPORT CARD 36
Table A-5 Percentage of students in NAEP arts assessment at grade 8 by selected student and school characteristics 2008
Student characteristics Music Visual arts
SD andor ELL
Identified 17 17
Excluded 2 2
Assessed 15 16
Without accommodations 6 6
With accommodations 8 10
SD
Identified 12 12
Excluded 1 2
Assessed 10 11
Without accommodations 3 2
With accommodations 7 8
ELL
Identified 6 6
Excluded 1 1
Assessed 5 6
Without accommodations 4 4
With accommodations 2 2 NOTE Students identified as both SD and ELL were counted only once under the combined SD andor ELL category but were counted separately under the SD and ELL categories Detail may not sum to totals because of rounding SOURCE US Department of Education Institute of Education Sciences National Center for Education Statistics National Assessment of Educational Progress (NAEP) 2008 Arts Assessment
Table A-6 Percentage of students with disabilities (SD) andor English language learners (ELL) identified excluded and assessed in NAEP music and visual arts at grade 8 as a percentage of all students 2008
NOTE Black includes African American Hispanic includes Latino and Pacific Islander includes Native Hawaiian Race categories exclude Hispanic origin Detail may not sum to totals because of rounding SOURCE US Department of Education Institute of Education Sciences National Center for Education Statistics National Assessment of Educational Progress (NAEP) 2008 Arts Assessment
Student and school characteristics Music Visual arts
Raceethnicity
White 61 61
Black 15 14
Hispanic 18 17
AsianPacific Islander 5 5
American IndianAlaska Native 1 2
Unclassified 1 1
Gender
Male 50 51
Female 50 49
Eligibility for freereduced-price school lunch
Eligible 36 37
Not eligible 57 56
Information not available 7 8
Type of school
Public 93 92
Private 7 8
School location
City 29 29
Suburb 37 36
Town 12 13
Rural 22 22
37ARTS 2008 37
u S d e p A r t M e n t o f e d u C A t i o n The National Assessment of Educational Progress (NAEP) is a congressionally authorized project sponsored by the US Department of Education The National Center for Education Statistics a department within the Institute of Education Sciences administers NAEP The Commissioner of Education Statistics is responsible by law for carrying out the NAEP project Arne Duncan John Easton Stuart Kerachsky Secretary Director Acting Commissioner US Department Institute of National Center for of Education Education Sciences Education Statistics
t h e n A t i o n A l A S S e S S M e n t g o V e r n i n g b o A r d In 1988 Congress created the National Assessment Governing Board to set policy for the National Assessment of Educational Progress commonly known as The Nations Report Card TM The Governing Board is an independent bipartisan group whose members include governors state legislators local and state school officials educators business representatives and members of the general public
Darvin M Winick Chair President Winick amp Associates Austin Texas
Amanda P Avallone Vice Chair Assistant Principal and Eighth-Grade Teacher
Summit Middle School Boulder Colorado
David J Alukonis Former Chairman Hudson School Board Hudson New Hampshire
Gregory Cizek Professor of Educational Measurement
University of North Carolina Chapel Hill North Carolina
Carol A DrsquoAmico President and Chief Executive Officer
Conexus Indiana Indianapolis Indiana
Honorable David P Driscoll Former Commissioner of Education
Massachusetts Department of Education
Malden Massachusetts
Louis M Fabrizio Director of Accountability Policy and Communications
North Carolina Department of Public Instruction
Raleigh North Carolina
Honorable Anitere Flores Member Florida House of Representatives Miami Florida
Alan J Friedman Consultant Museum Development and Science Communication
New York New York
David W Gordon County Superintendent of Schools Sacramento County Office of Education
Sacramento California
Robin C Hall Principal Beecher Hills Elementary School Atlanta Georgia
Kathi M King Twelfth-Grade Teacher Messalonskee High School Oakland Maine
Kim Kozbial-Hess Educational Technology Trainer Hawkins Elementary School Toledo Ohio
Henry Kranendonk Mathematics Curriculum Specialist Milwaukee Public Schools Milwaukee Wisconsin
James S Lanich President California Business for Education Excellence
Sacramento California
Honorable Cynthia L Nava Senator New Mexico State Senate Las Cruces New Mexico
Honorable Steven L Paine State Superintendent of Schools West Virginia Department of Education
Charleston West Virginia
Honorable Sonny Perdue Governor of Georgia Atlanta Georgia
Susan Pimentel Educational Consultant Hanover New Hampshire
Andrew C Porter Dean Graduate School of Education University of Pennsylvania Philadelphia Pennsylvania
Warren T Smith Sr Vice President Washington State Board of Education
Olympia Washington
Mary Frances Taymans SND Executive Director Secondary Schools Department National Catholic Educational Association
Washington DC
Oscar A Troncoso Principal Anthony High School Anthony Texas
Eileen L Weiser General Public Representative Ann Arbor Michigan
John Easton (Ex officio) Director Institute of Education Sciences US Department of Education Washington DC
Mary Crovo Interim Executive Director National Assessment Governing Board
Washington DC
t h e n a t i o n rsquo s r e p o r t c a r d
A r t s 2 0 0 8
M u s i c amp V i s u a l A r t s June 2009
M o r e i n f o r M A t i o n The report release site is httpnationsreportcardgov The NCES web electronic catalog is httpncesedgov pubsearch
For ordering information write to US Department of Education ED Pubs PO Box 1398 Jessup MD 20794-1398
or call toll free 1-877-4ED-Pubs
or order online at httpwwwedpubs org
S u g g e S t e d C i t A t i o n Keiper S Sandene BA Persky HR and Kuang M (2009) The Nationrsquos Report Card Arts 2008 Music amp Visual Arts (NCES 2009ndash488) National Center for Education Statistics Institute of Education Sciences US Department of Education Washington DC
C o n t A C t Emmanuel Sikali 202-502-7419 emmanuelsikaliedgov
ldquo t h e d e p A r t M e n t o f e d u C A t i o n rsquo S M i S S i o n i S t o p r o M o t e S t u d e n t A C h i e V e M e n t A n d p r e p A r A t i o n f o r g l o b A l C o M p e t i t i V e n e S S b y f o S t e r i n g e d u C A t i o n A l e x C e l l e n C e A n d e n S u r i n g e q u A l A C C e S S rdquo
wwwedgov
- Contents
- Executive Summary
- Introduction
- Music
-
- Eighty-nine-point score gap between lowest- and highest-performing students in music
- Racialethnic gender and socioeconomic gaps in music scores
- Music scores vary by type and location of schools
- Context for Arts Education in Music
- What Eighth-Graders Know and Can Do in Music
- Sample Questions for Music
-
- Visual Arts
-
- Eighty-nine-point score gap between lowest- and highest-performing students in visual arts
- Responding and creating results related
- Patterns in score gaps by student characteristics similar for responding to and creating visual arts
- No significant difference in responding scores between public and private school students
- Context for Arts Education in Visual Arts
- What Eighth-Graders Know and Can Do in Visual Arts
- Sample Questions for Visual Arts
-
- Technical Notes and Data Appendix13
- More Information
-
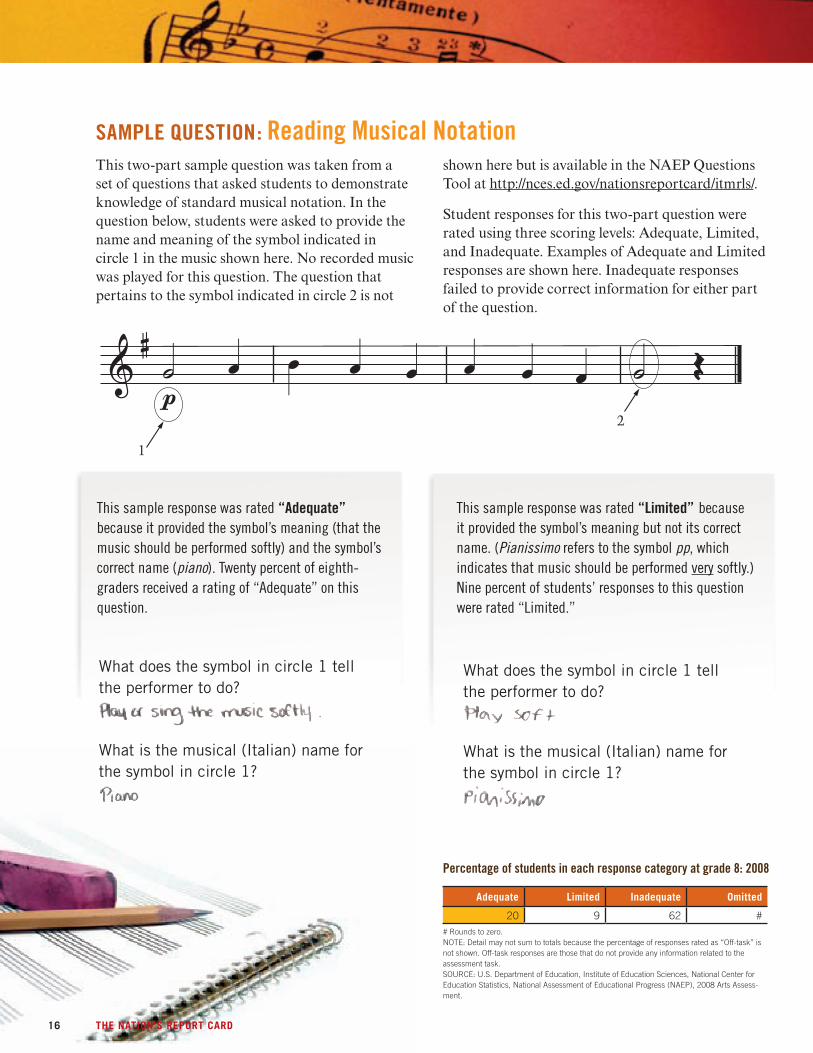
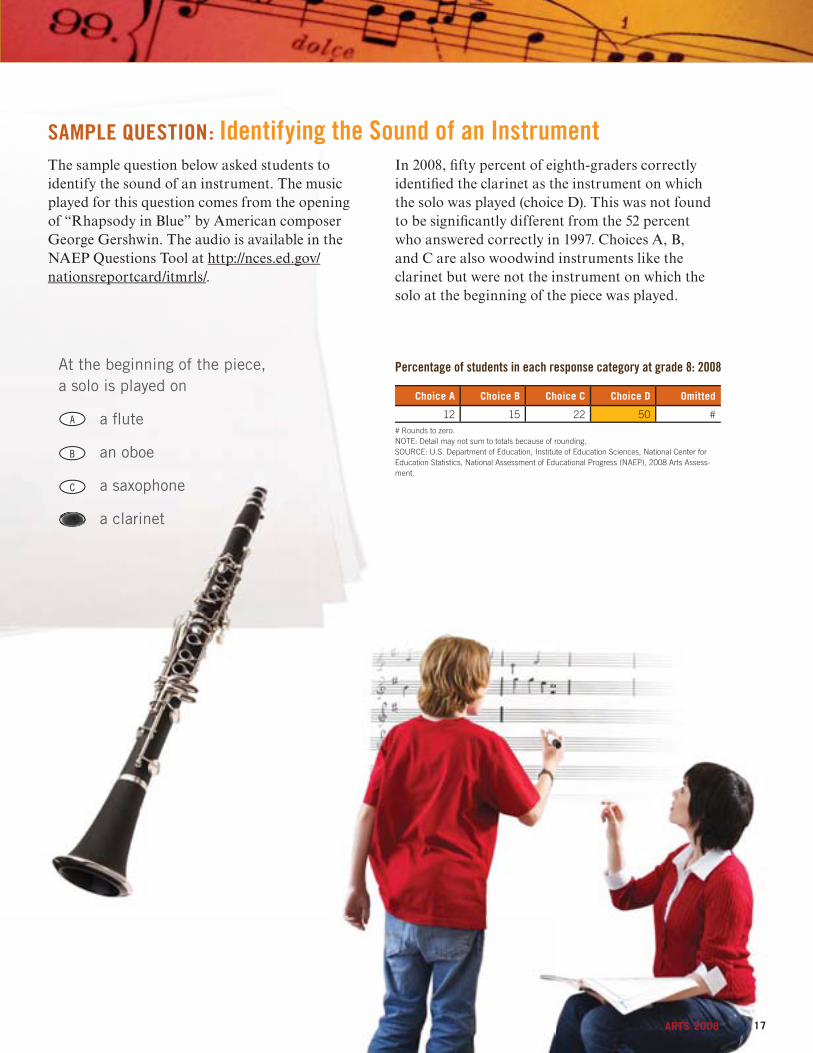
D
At the beginning of the piece a solo is played on
a flute
an oboe
a saxophone
a clarinet
A
B
C
DDDDDDDDD
SAMPLE QUESTION Identifying the Sound of an Instrument The sample question below asked students to identify the sound of an instrument The music played for this question comes from the opening of ldquoRhapsody in Bluerdquo by American composer George Gershwin The audio is available in the NAEP Questions Tool at httpncesedgov nationsreportcarditmrls
In 2008 fifty percent of eighth-graders correctly identified the clarinet as the instrument on which the solo was played (choice D) This was not found to be significantly different from the 52 percent who answered correctly in 1997 Choices A B and C are also woodwind instruments like the clarinet but were not the instrument on which the solo at the beginning of the piece was played
Choice A Choice B Choice C Choice D Omitted
12 15 22 50 Rounds to zero NOTE Detail may not sum to totals because of rounding SOURCE US Department of Education Institute of Education Sciences National Center for Education Statistics National Assessment of Educational Progress (NAEP) 2008 Arts Assessshyment
Percentage of students in each response category at grade 8 2008
17ARTS 2008
D
D
SAMPLE QUESTION Identifying Origin of a Musical Style The two-part sample question below asked students to identify music from a particular culture and to describe the features that help to characterize its style The music played for this question came from an African song entitled ldquoDrodoperdquo The audio is available in the NAEP Questions Tool at httpncesedgovnationsreportcarditmrls
Student responses for this two-part question were rated using four scoring levels Developed Adequate Limited and Inadequate Examples of Developed and Adequate responses are shown here Responses rated as Limited only provided a correct response to the first part of the question Responses rated as Inadequate failed to provide a correct response for either part of the question
This sample response was rated ldquoDevelopedrdquo because it both indicated the correct region of origin of the music and cited the ldquocall and responserdquo feature of the music that is common among many types of African songs Mentioning the use of specific percussion instruments such as drums also contributed to this response receiving a rating of ldquoDevelopedrdquo Fifty-two percent of eighth-graders received a rating of ldquoDevelopedrdquo on this question
From where does the music come
North America
South America
Asia
Africa
Other than the language used in the song describe one feature of the music that helps to identify it as coming from the part of the world you selected Be specific in your description
A
B
C
DDDDDDDDDDDDDDDDDD
From where does the music come
North America
South America
Asia
Africa
Other than the language used in the song describe one feature of the music that helps to identify it as coming from the part of the world you selected Be specific in your description
A
B
C
This sample response was rated ldquoAdequaterdquo Although it indicated the correct region of origin of the music the description of a feature of the music was vague Twenty-four percent of studentsrsquo responses to this question were rated ldquoAdequaterdquo
DDDDDDDDDDDDDDDDDDDDDDDDDDDD
Percentage of students in each response category at grade 8 2008
Developed Adequate Limited Inadequate Omitted
52 24 19 5 Rounds to zero NOTE Detail may not sum to totals because the percentage of responses rated as ldquoOff-taskrdquo is not shown Off-task responses are those that do not provide any information related to the assessment task SOURCE US Department of Education Institute of Education Sciences National Center for Education Statistics National Assessment of Educational Progress (NAEP) 2008 Arts Assessshyment
18 THE NATIONrsquoS REPORT CARD
19ARTS 2008
The 2008 arts assessment included four sections in visual arts that measured studentsrsquo ability to respond to and create visual art Students were given two of the four sections each of which contained between 7 and 11 multiple-choice and constructed-response questions Many of the visual arts questions in the assessment contained multiple parts The amount of time provided for students to complete two visual arts sections ranged from 75 minutes to 104 minutes
Responding questions asked students to analyze and describe works of art and design thereby demonstrating their knowledge of media and techniques visual organization the cultural contexts of artworks how works of art convey meaning and the relationship between form and function in design Creating questions assessed studentsrsquo ability to communicate in works of art think of different solutions to visual problems and generate ideas for and then create works of art and design These creating questions represented approximately one-half of the total assessment time in visual arts Some examples of the different types of visual arts questions are presented later in this section
20 THE NATIONrsquoS REPORT CARD
Eighty-nine-point score gap between lowest- and highest- performing students in visual arts The overall average responding score for visual arts was set at 150 in 2008 (figure 7) In addition to the overall average responding score results are shown for students at selected percentiles on the responding scale There was an 89-point gap between the scores for students at the 10th and 90th percentiles
The assessment also included questions that asked students to create works of art and design Results for these questions are presented as the average creating task score which is expressed as the average percentage of the maximum possible score ranging from 0 to 100 (see the Technical Notes for an explanation of how the score was calculated) In 2008 the overall average creating task score for grade 8 students was 52 (fi gure 8)
Responding and creating results related Because the NAEP arts framework describes the integration among the arts processes it is useful to explore the relationship between studentsrsquo results on the responding and creating questions in visual arts On average students who performed well on the responding questions also performed well on the creating questions (figure 9) For example students performing above the 75th percentile on the responding scale also had the highest average creating task score (62) Lower-performing students at or below the 25th percentile on the responding scale had the lowest average creating task score (40)
Figure 7 Average responding scale score and percentile scores in NAEP visual arts at grade 8 2008
150
104
174
300 200
190
180
170
160
150
140
130
120
110
Scale score
193
152
128
Overall 10th 25th 50th 75th 90th average score Percentile score
100
0
Figure 8 Average creating task score in NAEP visual arts at grade 8 2008
Overall 52
0 10 20 30 40 50 60 70 80 90 100
Percent of maximum score
Figure 9 Average creating task score in NAEP visual arts at grade 8 by responding score level 2008
Responding score level
Lower (lt 25th percentile)
Lower-middle (25thndash50th percentiles)
Upper-middle (50thndash75th percentiles)
Upper (gt 75th percentile)
Average creating task score
50
40
62
55
0 10 20 30 40 50 60 70 80 90 100
Percent of maximum score
SOURCE US Department of Education Institute of Education Sciences National Center for Education Statisshytics National Assessment of Educational Progress (NAEP) 2008 Arts Assessment
21ARTS 2008
Race ethnicity
54
55
46
43
49
Black
Hispanic
AsianPacific Islander
Male
White
Gender
Eligibility for free
reduced-price school lunch
54
55
46 Eligible
Not eligible
Female
Patterns in score gaps by student characteristics similar for responding to and creating visual arts
In general patterns in score differences based on student characteristics were similar for results in both responding (fi gure 10) and creating (fi gure 11)
130
120
110
RaceEthnicity In 2008 average responding scores in visual arts were 22 to 31 points higher for White and AsianPacifi c Islander students than for Black and Hispanic students There were no signifi cant differences between the average responding scores of White and AsianPacific Islander students or between the scores of Black and Hispanic students
Similarly the average creating task scores of White and AsianPacific Islander students were higher than the scores of Black and Hispanic students but there were no significant differences between the scores of White and AsianPacific Islander students or between the scores of Black and Hispanic students
Gender On average female eighth-graders had a higher responding score in visual arts than their male counterparts There was an 11-point3 gap between the two groups in 2008 The average creating task score for female students was also 5 points higher than the score for male students
Eligibility for FreeReduced-Price School Lunch On average eighth-graders who were eligible for free reduced-price school lunch had a lower responding score in visual arts than those who were not eligible There was a 29-point gap between the two groups in 2008 Students who were eligible also had an average creating task score that was 9 points lower than the score for students who were not eligible
3 The score-point gap is based on the difference between the unrounded scores as opposed to the rounded scores shown in the fi gure
Figure 10 Average responding scale score in NAEP visual arts at
200
190
180
170
160
150
140
Raceethnicity
160
129 134
156
Gender
145
155
300 Scale score
Eligibility for freereduced-price
school lunch
132
161
grade 8 by selected student characteristics 2008
0 White Black Hispanic Asian Male Female Eligible Not
Pacific eligible Islander
Figure 11 Average creating task score in NAEP visual arts at grade 8 by selected student characteristics 2008
0 10 20 30 40 50 60 70 80 90 100
Percent of maximum score
NOTE Black includes African American Hispanic includes Latino and Pacifi c Islander includes Native Hawaiian Race categories exclude Hispanic origin Sample sizes were insufshyficient to permit reliable estimates for students whose raceethnicity was American Indian Alaska Native or unclassified For the eligibility for freereduced-price school lunch category results are not shown for students whose eligibility status was not available SOURCE US Department of Education Institute of Education Sciences National Center for Education Statistics National Assessment of Educational Progress (NAEP) 2008 Arts Assessment
22 THE NATIONrsquoS REPORT CARD
No signifi cant difference in responding scores between public and private school students
While the general patterns in results for responding not all the apparent differences were found to be to and creating visual arts by selected school statistically signifi cant characteristics were similar (fi gures 12 and 13)
Type of School The apparent difference in 2008 between the average responding scores in visual arts for eighth-graders in public and private schools was not found to be statistically significant However the average creating task score was lower for public school students than for private school students
School Location Students attending suburban schools in 2008 had a higher average responding score in visual arts than students in city schools There were no significant differences in the average responding scores between students from suburban schools and town or rural schools
In the creating process of visual arts students attending suburban schools had a higher average creating task score than students in both city and town schools The average creating task score of students in suburban schools was not signifi cantly different from the score of students in rural schools
Because responding results are presented as scale scores and creating results are presented as average percentages it is not possible to compare the magnitude of differences between these scores For example an 11-point difference on the 0ndash300 responding scale between students attending schools in city and suburban locations is not necessarily greater than a 5-point difference between the same two groups on the 0ndash100 creating task scale
Figure 12 Average responding scale score in NAEP visual arts at grade 8 by selected school characteristics 2008
140
130
120
110
0 Public Private
200
190
180
170
160
150
City Suburb Town Rural
School location
144
155 149 151
Type of school
149
159
300 Scale score
Figure 13 Average creating task score in NAEP visual arts at
City
Suburb
Town
Rural
School location
52
49
50
54
Public
Private
Type of school 60
51
grade 8 by selected school characteristics 2008
0 10 20 30 40 50 60 70 80 90 100
Percent of maximum score
SOURCE US Department of Education Institute of Education Sciences National Center for Education Statistics National Assessment of Educational Progress (NAEP) 2008 Arts Assessment
23ARTS 2008
Context for Arts Education in Visual Arts To provide the context in which arts learning takes and nature of visual arts education in their schools place results are presented here based on school and studentsrsquo responses about their participation in administratorsrsquo responses related to the availability visual arts activities
Frequency of visual arts instruction remains steady School administrators were asked how often eighth-graders attending their schools might receive instruction in visual arts Forty-seven percent of eighth-graders attended schools where students could possibly receive visual arts instruction at least three or four times a week in 2008 (fi gure 14) This was higher than the percentages of students attending schools where visual arts were offered less frequently or not at all
Although the data are not shown here access to visual arts instruction did not differ significantly by race ethnicity gender or eligibility for freereduced-price school lunch For example the percentage of students who were eligible for freereduced-price school lunch attending schools where visual arts were offered once or twice a week was not significantly different from the percentage of students who were not eligible
The same question was asked of school administrators in 1997 making it possible to look for changes in the instruction patterns over time The results showed no significant changes between 1997 and 2008 in the percentages of students who attended schools where visual arts were available at least three or four times a week once or twice a week less than once a week or not at all
Figure 14 Percentage of students at grade 8 by school-reported frequency with which instruction in visual arts is available 1997 and 2008
1997
2008 47
52At least 3 or 4 times a week
30
25Once or twice
a week
5
10
Less than once a week
17
14
Subject not offered
0 10 20 30 40 50 60 70 80 90 100
Percent
NOTE Detail may not sum to totals because of rounding SOURCE US Department of Education Institute of Education Sciences National Center for Education Statistics National Assessment of Educational Progress (NAEP) 1997 and 2008 Arts Assessments
77 percent of eighth-graders attended schools where administrators reported that visual arts were taught by a full-time specialist
69 percent of students attended schools that followed a state or district curriculum in visual arts
24 THE NATIONrsquoS REPORT CARD
More students writing about their artwork
Students responded to a series of questions about how often they did certain activities in visual arts class For each activity listed in figure 15 students indicated if their teacher had them do it every day once a week once a month or never or hardly ever The results summarized here show the combined percentages for students who reported that they did various art-related activities at least once a month
The percentage of students who reported that their teacher had them write about their artwork increased from 21 percent in 1997 to 27 percent in 2008 However the percentage of students whose teacher had them choose their own art project decreased from 47 percent in 1997 to 39 percent in 2008 There were no significant changes between 1997 and 2008 in the percentages of students who reported that their teachers had them paint or draw make things out of clay or other materials work in a pair or group on an art project talk with others about their own or othersrsquo artwork or look at videotapes filmstrips slides or television programs about art
Fewer students visit art museums with class in 2008 Exposure to art museums and exhibits outside of school may help students learn about and engage in visual arts Sixteen percent of students in 2008 reported that they had gone with their class to an art museum gallery or exhibit at least once in the last year which was smaller than the 22 percent in 1997 (fi gure 16)
Although not presented here graphically 54 percent of eighth-graders reported that they or their teacher saved their artwork in a portfolio in 2008 which was not signifi cantly different from the 50 percent in 1997
About half of students save artwork in a portfolio
Figure 15 Percentage of students at grade 8 by student-reported in-school activities their teachers have them do in art at least once a month 1997 and 2008
45
43
21
27
50
43
39
47
41
38
80
80
53
40
Paint or draw
Make things out of clay or
other materials
Choose own art project
Work in a pair or a group on an
art project
Talk with others about own artwork or
that of other students
Write about own artwork
Look at videotapes filmstrips slides
or television programs about art
1997
2008
0 10 20 30 40 50 60 70 80 90 100
Percent
Significantly different (p lt 05) from 2008
Figure 16 Percentage of students at grade 8 who reported visiting an art museum gallery or exhibit with their class at least once a year 1997 and 2008
1997
2008 16
22
0 10 20 30 40 50 60 70 80 90 100
Percent
Significantly different (p lt 05) from 2008 SOURCE US Department of Education Institute of Education Sciences National Center for Education Statistics National Assessment of Educational Progress (NAEP) 1997 and 2008 Arts Assessments
25ARTS 2008
What Eighth-Graders Know and Can Do in Visual Arts The item map below is useful for understanding studentsrsquo performance at different points on the responding scale The scale scores on the left represent the average scores for students who were likely to get the questions correct or partially correct Scores for the 25th and 75th percentiles are also noted The descriptions of selected assessment questions are listed on the right
For example the map shows that higher-performing eighth-graders in the upper range of the scale with an average score of 237 were likely to be able
Grade 8 NAEP Visual Arts Responding Item Map Scale score Question description
to identify the style of an artwork as surrealism Middle-performing students with an average score of 144 were likely to be able to analyze the subject of five motherchild portraits of different genres
Constructed-response questions for which students could earn partial credit may appear on the map multiple times once for each level of credit For example a question asking students to describe two characteristics of charcoal in a self-portrait appears at the score of 201 for responses receiving full credit and at 134 for responses receiving partial credit
300
285 Support plausible interpretation of Schiele self-portrait with observations about style line and color 280 Explain how an unusualunexpected feature of a Bearden collage contributes to the work as a whole 256 Analyze and support with references to the work the narrative conveyed by a Bearden collage 241 Describe at least three aspects of own self-portrait that communicate something about you 240 Explain materials and design of own package idea for transporting fi sh on bicycle 237 Identify the style of an artwork as surrealism 229 Label and specifi cally describe one or two features of a Bearden collage that the artist wants you to notice 224 Identify a technical similarity between Schiele and Kollwitz self-portraits (page 28) 221 Explain how artist used light and shadow to create realism in motherchild portrait 220 Explain three ways an artist made some things look near and some far in motherchild portrait 213 Support plausible interpretation of Schiele self-portrait with observations about style line or color 205 Explain how Bearden creates contrast between interior and exterior areas in collage 202 Describe two aspects of own self-portrait that communicate something about you 201 Describe two characteristics of charcoal in Kollwitz self-portrait (page 29) 197 Identify an example of Renaissance art 197 Identify compositional emphasis in a Bearden collage 189 Identify an example of 20th century western art 176 Compare in specifi c terms how Kollwitz has drawn different parts of her self-portrait and offer plausible
interpretation for differences (pages 30 and 31) 176 Explain where artist has used light and shadow to create realism in motherchild portrait
172 Describe and support how memory of place is shown in own collage 170 Explain how artist used light to create a lack of realism in motherchild portrait 144 Analyze subject of fi ve motherchild portraits of different genres 136 Describe one aspect of own self-portrait that communicates something about you 134 Describe one characteristic of charcoal in Kollwitz self-portrait (page 29)
128 Identify an unusualunexpected feature of the Bearden collage 62 Describe memory of place andor aspect(s) of own collage 61 Describe what Schiele self-portrait is communicating or describe an aspect of style line or color
0
174 75th percentile
128 25th percentile
NOTE Regular type denotes a constructed-response question Italic type denotes a multiple-choice question The position of a question on the scale represents the average scale score attained by students who had a 65 percent probability of obtaining credit at a specific level of a constructed-response question or a 74 percent probability of correctly answering a four-option multiple-choice question SOURCE US Department of Education Institute of Education Sciences National Center for Education Statistics National Assessment of Educational Progress (NAEP) 2008 Arts Assessment
26 THE NATIONrsquoS REPORT CARD
Self-portrait B Egon Schiele Crayon and watercolor on buff paper Galerie St Etienne
Self-portrait A Kathe Kollwitz Charcoal on brown laid paper National Gallery of Art
Sample Questions for Visual Arts Students were asked a series of questions related to two self-portraits shown here one by Kathe Kollwitz (A) and one by Egon Schiele (B) These questions required students to apply their knowledge of aesthetic properties to the two artworks and to consider the relationships between these properties and the expressive qualities of each work Students were then asked to create a self-portrait of their own
27ARTS 2008
B
SAMPLE QUESTION Recognizing a Technical Similarity Between Two Self-Portraits
The sample question below asked students to recognize a technical similarity between the Kollwitz and Schiele self-portraits In both works
In 2008 thirty-seven percent of students correctly identified this common feature of the two artworks (choice B) This was not found to be significantly
expressive loose lines are combined with precise different from the 36 percent who answered drawing correctly in 1997 Choices A C and D do not
accurately describe technical similarities between the two works
Which statement describes a technical similarity between self-portraits A and B
The figure in each work is seen from the same point of view
Both works combine loose gestural lines with careful drawing
The compositions in both works are symmetrical
Both works rely on light and shadow to emphasize depth
A
C
D
BBBBBBBBBBBBBBBBBBBBBBBB
Choice A Choice B Choice C Choice D Omitted
8 37 8 46
Percentage of students in each response category at grade 8 2008
Rounds to zero NOTE Detail may not sum to totals because of rounding SOURCE US Department of Education Institute of Education Sciences National Center for Education Statistics National Assessment of Educational Progress (NAEP) 2008 Arts Assessshyment
28 THE NATIONrsquoS REPORT CARD
SAMPLE QUESTION Characteristics of Charcoal The sample question below asked students to Unacceptable Examples of Acceptable and Partial describe characteristics of the medium of charcoal responses are shown here Responses rated as visible in the Kollwitz self-portrait Student Unacceptable did not describe characteristics of the responses for this question were rated using medium of charcoal evident in the self-portrait three scoring levels Acceptable Partial and
This sample response was rated ldquoAcceptablerdquo because it demonstrated the studentrsquos knowledge of charcoal as a medium The student expressed what Kollwitz was able to accomplish with charcoal in her self-portrait Thirty-four percent of eighth-graders received a rating of ldquoAcceptablerdquo on this question
Self-portrait A is a charcoal drawing Describe two characteristics of charcoal that you see in self-portrait A
1
2
Acceptable Partial Unacceptable Omitted
34 38 27 1 NOTE Detail may not sum to totals because the percentage of responses rated as ldquoOff-taskrdquo is not shown Off-task responses are those that do not provide any information related to the assessment task SOURCE US Department of Education Institute of Education Sciences National Center for Education Statistics National Assessment of Educational Progress (NAEP) 2008 Arts Assessshyment
Percentage of students in each response category at grade 8 2008
This sample response was rated ldquoPartialrdquo because it provided only one example of how charcoal was used in the self-portrait The student recognized that pressing harder on charcoal results in a darker mark as is evident in the Kollwitz self-portrait However the second part of the response did not describe another characteristic of charcoal as a medium Thirty-eight percent of studentsrsquo responses to this question were rated ldquoPartialrdquo
Self-portrait A is a charcoal drawing Describe two characteristics of charcoal that you see in self-portrait A
1
2
29ARTS 2008
a s
SAMPLE QUESTION Relationship Between Technical Approach and Meaning
Both parts of this sample response were rated ldquoAcceptablerdquo This response accurately described the differences between the parts of the drawing and then used thesss eeee oooo bbbbsssseeeeerrrr vvvvvaaaattttiiiiii oooooo nnnnnnnsssssss tttttt ooooooo ooooooooffffffffffffffffeeeeeeeerrrrrr aaaaaaaannnnnnnn iiiiiiiinnnnnnnnssssssssiiiiiiiigggggggghhhhhhhhttttttttffffffffuuuuuuuullllllll andddd pllausible interpretation of the reasons for those differences
Fifty-three percent of students received a rating of ldquoAcceptablerdquo for part A and 19 percent received an ldquoAcceptablerdquo rating for part B Students who received the ldquoAcceptablerdquo rating were able to both comprehend
pthe formal characteristics of the self-portrait and discuss the relationship between those characteristics and the artistrsquos possible expressive goals
Look at self-portrait A Compare how Kollwitz has drawn her head and hand with the way she has drawn her arm Be specific
A
Explain what you think Kollwitz may have been trying to communicate about herself by drawing these different parts of her self-portrait in different ways
B
THE NATIONrsquoS REPORT CARD
The two-part sample question below required students to analyze and interpret the Kollwitz self-portrait to explore relationships between technical approach and meaning Part A of the question asked students about the workrsquos formal characteristics while part B asked them to connect those characteristics with what the artist was attempting to communicate Student responses
to each of the two parts were rated separately using three scoring levels Acceptable Partial and Unacceptable Examples of Acceptable and Partial student responses for each part of this question are shown here Unacceptable responses for the question neither addressed differences in the way the parts of the self-portrait are drawn nor offered interpretations linked to observations
30
Both parts of this sample response received a ldquoPartialrdquo rating This response accurately described the way the arm is drawn but did not specifi cally address the ways in which the head and hand are drawn differently from the arm ldquoPartialrdquo credit was given for recognizing some characteristics of the artwork While a few plausible interpretations about what Kollwitz was trying to communicate are provided in the second part of the response none of these is clearly linked to the descriptions offered in the fi rst part
Look at self-portrait A Compare how Kollwitz has drawn her head and hand with the way she has drawn her arm Be specifi c
A
Explain what you think Kollwitz may have been trying to communicate about herself by drawing these different parts of her self-portrait in different ways
Fifteen percent of the student responses were rated B ldquoPartialrdquo for part A and 52 percent were rated ldquoPartialrdquo for part B
Percentage of students in each response category at grade 8 2008
Part A Part B
Acceptable Partial Unacceptable Omitted
53 15 31 2
Acceptable Partial Unacceptable Omitted
19 52 25 3
NOTE Detail may not sum to totals because the percentage of responses rated as ldquoOff-taskrdquo is not shown Off-task responses are those that do not provide any information related to the assessment task SOURCE US Department of Education Institute of Education Sciences National Center for Education Statistics National Assessment of Educational Progress (NAEP) 2008 Arts Assessment
31ARTS 2008
t t t t
a t
t t
s c
t
ldquoldquo
SAMPLE QUESTION Creating a Self-Portrait After students had observed the Kollwitz and Schiele self-portraits and studied relationships between the technical and expressive qualities of the two artworks they were asked to create a self-portrait of their own Students were given a set of
a mirror and a sheet of 12-inch by 18-inch white drawing paper and were asked to use these tools to create a self-portrait that would express something important about their personalities These self-portraits were rated using four scoring levels
12 Cray-pas (colored oil pastels) a charcoal pencil Sufficient Uneven Minimal and Insufficient
ChChCharararracacacteteteririristststicicic ooofff wowoworkrkksss rararateteteddd ldquoSldquoSSufufu ficficccieieientntntrdquordquordquo bbbototothhh ofoffo ttt hehehe stststudududu enenenen tststsrsquorsquorsquo rererere spspspoononon seseesessss prprpp essesenenene teteteddd heheherererr sssshohohowewew ddd clclc eaeaeae rr ananandddd spspspp ecifiifififi cccc obobobseseservrvrvatatatioioionsnsns ttthahahaa tt cococommmmmm unununiciccatatatededed sssomomommetetethihihi ngngg immmm poop rtrtrtananan ttt ababbouououo ttt ththth eeee ararartitit stststs ThThThTh eyeyy iiincncncn ororo popoorararaa teteteedddd ididdeenentititit fyfyfyininingg dedede tata ilii iinn tetett rmrmrm ss ofofoff pppererrersososos nananana ll fefefeeatata ururu eses aandndd ininn sstutuudededentntt rerere spsppppononon seseee 11 ananann aaa ctctivivi itiityyy (a(a(artrtt mmm akaka inining)g)g) ThThheee seses lflfflflf -p-p-pororortrtrtrt aiaiaitststss shshshowowowow edeeded pppururu popoposeses efufuffu lll usussu eee ofofof cccommompopoosisis tititt ononon alal eeelelemememme ntntntsss anann ddddd sososososso phphphphphp isssisstitttiticacacacateteteedddd usussuseee ofofof mmm atataterereriaiaiaalssl FoFoFo rr exexexe amamamm plplplpleee iinnn ststststudududeneneenttt rerereespspspp onononnsesese 111 hthththh eee smsmms udududu gigigigg ngngngn g ooofff CrCrCrCr ayayayy-p-p-pasasas cccrerereatatatatededed anananan aaaaffiffiffiffininininitytyty aaamomomoo ngngng tttt hehehehee hhhheaeaeaaee ddddd aaa rmrmrm ananana ddd hahahandndnddn ananana ddd lolooolo oosoososeee wewewewe lllll-p-p-p-pp lalalaacececece dddd lililiinenenenesssss adadadadd dedededdeddddd dededed fifinfinnfinitititioioionnn tototoo ttthehehee bbbb ododododo yyy
Percentage of students in each response category at grade 8 2008
BoBoBoBBothththth wwworororoorksksksk aaaaalslslslsooo shshhs howwowowedeede vvvererere yyyyy gogogoododod uuu sesese ooofff prprpropopo ororortititionnno n cocococoo lololorrr aaaaandndnd lll inininn eeee aaandndndd wwwererer eee fuufullllllyyy dededevevev lololopepep dd anananndd nininindididid vivividududualalalizizizizi ededededded FoFoFoF rrr exexexxamamamamplpleee iiinnn stststududdenene n ttt rerere spspps onononn seseee 222222 thhhhhhthhththhhhth e stststs udududd enenenntt skskkk liliii lfflflflf ululullylyly uuuseseseseedddd cocococo lolorrr tototo eempmpmmp hahhah sisisizezez aaa ndndndndn cccrerere atatat eeeeeee cococo ntntnttrarraaststs bbbetetetwewewewe eenenn sssspepepppecicicificficficfic pppp araara tstst s ooff heherrr seseselflfl -p-pp ororor trtrtraiaiaittt BoBoBoBothththh sss tututudededed nntntn rrresesespopoo nsnsnsn eses 11 aaandndndnd 222 aalslslsooo shsshshowowededed eeevivivvvidededeencnccccncncncccc e ofoffof ttttheheehh sss tututudededed ntntntntsss hahahah vivivingngng ssspepeepentntntnt tttimimimeee obobob seseservrvinini gggg thththeee KoKoKolllll wwiwwww tz anana ddd ScScScSchihihielele ee seses lflflf-p-p-porororortrtrrtrraiaiaitststs FoFoFoFooururr pppererercececentntnt ooo fff stststudududenenntstststsrsquorsquorsquorsquo sssesss lfshypopopoortrtrt rararaaitititsss wewewererere rrratatatededed ldquoldquoSuSuSuu ffiffifficicciennee ttrdquordquordquo
1
2
Sufficient Uneven Minimal Insufficient Omitted
4 25 57 14 Rounds to zero NOTE Detail may not sum to totals because the percentage of responses rated as ldquoOff-taskrdquo is not shown Off-task responses are those that do not provide any information related to the assessment task SOURCE US Department of Education Institute of Education Sciences National Center for Education Statistics National Assessment of Educational Progress (NAEP) 2008 Arts Assessshyment
32 THE NATIONrsquoS REPORT CARD
Works at the ldquoUnevenrdquo level made some specific observations They sometimes employed pertinent compositional elements gave attention to details such as facial features to convey expression andor effectively used materials to communicate However ldquoUnevenrdquo works were typically inconsistent or incomplete in parts
In the sample presented here the student gave her work individuality by vivid use of color facial expression and the symbols incorporated in her jewelry and the background However elements of her work seem inconsistent and lacking in deliberation such as the placement and rendering of the symbols and colors in the background Twenty-five percent of studentsrsquo self-portraits were rated ldquoUnevenrdquo
As with many works rated at the ldquoMinimalrdquo level in the sample self-portrait shown here efforts at specific observations were apparent but relatively minimal (the red lines in the eyes) Compositional successes may seem more accidental than deliberate and use of materials was unskilled For example while this student may have been attempting to convey some sense of an individual person by emphasizing only his eyes and mouth with color he lacked the skill to make this choice distinctive enough to convey his message Fifty-seven percent of studentsrsquo self-portraits were rated ldquoMinimalrdquo
Most self-portraits rated ldquoInsufficientrdquo were generally so schematic as to convey little or nothing about the student Like the sample self-portrait shown here they showed unspecific observation little awareness of composition and highly unskilled use of materials In contrast to the ldquoMinimalrdquo response there were no features in this self-portrait that conveyed anything specific about a person and it remained at a general level Fourteen percent of studentsrsquo self-portraits were rated ldquoInsufficientrdquo
33ARTS 2008
Sampling and Weighting The schools and students who participate in NAEP assessments are selected to form a representative sample of the nation The national sample of eighth-graders in the 2008 arts assessment was chosen using a multistage design that involved drawing students from the sampled public and private schools across the country The results from the assessed students were combined to provide accurate estimates of the overall performance of students in the nation
Each school that participated in the assessment and each student assessed represents a portion of the population of interest Results are weighted to make appropriate inferences between the student samples and the respective populations from which they are drawn Sampling weights are adjusted for the disproportionate representation of some groups in the selected sample This includes the oversampling of schools with high concentrations of students from certain racialethnic groups and the lower sampling rates of students who attend very small schools
School and Student Participation Rates The school and student participation rates for public and private schools in the 2008 arts assessment are provided in table A-1
NCES statistical standards require that a nonresponse bias analysis be conducted for any school or student group with a participation rate that falls below 85 percent The participation rates for the 2008 NAEP arts assessment indicated a need for a school nonresponse bias analysis for the private school sample The results showed that school substitution and nonresponse adjustments were not effective in reducing nonresponse bias for the percentage of Hispanic students enrolled and type of private schools (Catholic and other private schools) The disproportionate nonresponse resulted
in an overestimation of the percentage of Hispanic students an overestimation of the percentage of Catholic school students and an underestimation of the percentage of other private school students
Table A-1 School and student participation rates in NAEP arts at grade 8 by subject and type of school 2008
Subject and type of school
Music
Nation
Public
Private
Visual arts
Nation
Public
Private
School participation Student participation
Number of Number of schools Weighted students Weighted
participating percent assessed percent
260 97 4000 93
220 99 3400 93
30 76 500 97
260 97 3900 92
220 99 3400 92
30 76 500 94
NOTE The numbers of schools are rounded to the nearest ten and the numbers of students are rounded to the nearest hundred Detail may not sum to totals because of rounding SOURCE US Department of Education Institute of Education Sciences National Center for Education Statistics National Assessment of Educational Progress (NAEP) 2008 Arts Assessment
Interpreting Statistical Signifi cance Comparisons over time or between groups in this report are based on statistical significance at the 05 level using t-tests with appropriate adjustments for multiple comparisons (using the False Discovery Rate procedure) These statistical tests consider both the size of the differences and standard errors of the two statistics being compared Standard errors are margins of error and estimates based on smaller groups are likely to have larger margins of error relative to estimates based on larger groups Note for example that differences based on schoolshyadministrator-reported estimates have smaller sample sizes than differences based on student-reported estimates resulting in smaller signifi cant differences in the student-reported data than in the
THE NATIONrsquoS REPORT CARD 34
school-administrator-reported data The size of the standard errors may also be influenced by other factors such as how representative the students assessed are of the entire population
When an estimate has a large standard error a numerical difference that seems large may not be statistically significant Differences of the same magnitude may or may not be statistically significant depending upon the size of the standard errors of the estimates For example a 10-point difference between male and female students may be statistically significant while a 10-point difference between students attending public and private schools may not be Standard errors for the estimates presented in this report are available at httpncesedgovnationsreportcardnaepdata and on the 2008 arts results website at http nationsreportcardgovarts_2008
National School Lunch Program NAEP collects data on student eligibility for the National School Lunch Program (NSLP) as an indicator of poverty Under the guidelines of NSLP children from families with incomes below 130 percent of the poverty level are eligible for free meals Those from families with incomes between 130 and 185 percent of the poverty level are eligible for reduced-price meals (For the period July 1 2007 through June 30 2008 for a family of four 130 percent of the poverty level was an annual income of $27000 and 185 percent was $38000) For more information on NSLP visit httpwww fnsusdagovcndlunch
School Location Results of the 2008 NAEP arts assessment were reported for four mutually exclusive categories of school location These categories are based on standard definitions established by the Federal Office of Management and Budget using population and geographic information from the US Census Bureau The classification system is referred to as ldquourban-centric locale codesrdquo which classifies territory into four major types
city suburb town and rural More details on the classification system can be found at httpnces edgovccdrural_localesasp
The Creating Task Score Studentsrsquo performance on questions assessing the creating process in visual arts is presented as the average creating task score in this report The creating task score for each creating question (task) is the sum of the percentage of students receiving full credit and a fraction of the percentage of students receiving partial credit The individual scores are then averaged together to report an average creating task score for the entire set of the visual arts creating questions
An example of computing the creating task score is provided below for a sample question in this report that asks eighth-graders to draw a self-portrait Responses to this question were scored ldquoSufficientrdquo ldquoUnevenrdquo ldquoMinimalrdquo or ldquoInsufficientrdquo The percentages of students falling into these four scoring levels are 4 percent 25 percent 57 percent and 14 percent respectively (table A-2) Responses at these four levels receive
1score weights of 1 23 and 0 respectively The
3creating task score for this question is computed as 1 (4) + 2 (25) + 1 (57) + 0 (14) = 403 3
Table A-2 Example showing how the creating task score was computed for a sample question in NAEP visual arts at grade 8 2008
Percentage Percentage of of students times
Scoring level students Score weight score weight
Sufficient 4 1 4
Uneven 25 2 3 17
Minimal 57 1 3 19
Insufficient 14 0 0
Creating task score (4 + 17 + 19 + 0) = 40
SOURCE US Department of Education Institute of Education Sciences National Center for Education Statistics National Assessment of Educational Progress (NAEP) 2008 Arts Assessment
ARTS 2008 3535
Comparing Results Between the 1997 and 2008 Assessments Although the assessment questions adminshyistered in 2008 were selected from those used in the 1997 assessment due to changes in scoring procedures and materials the 2008 score results in music and visual arts could not be directly compared to the results in 1997
In the 2008 arts assessment the scoring guides for constructed-response questions the sample questions and student responses used to train scorers and the standardized training procedures were updated to refl ect changes in training and scoring procedures that have been adapted for use across all NAEP assessments since 1997 In addition because the student artwork used as training samples for visual arts in 1997 had degraded over time and because of differences in the availability of certain types of art supplies and tools between 1997 and 2008 new samples were developed for scoring studentsrsquo responses to the creating questions in 2008
However since the scoring method for multiple-choice questions was the same in 1997 and 2008 direct comparisons could be made between the two years on results for these questions in music and visual arts (tables A-3 and A-4) Because multiple-choice questions were only a portion of the assessment and only assessed certain types of topics in the responding process of music and visual arts the changes in studentsrsquo performance between 1997 and 2008 on these questions did not represent the performance changes for the constructed-response questions or the entire assessment
Table A-3 Percentage correct for multiple-choice questions in NAEP music at grade 8 1997 and 2008
Percent correct
Question description 1997 2008
Overall 53 51
Identify directional contour of part of melodic phrase 79 77
Identify form of vocal music in a recording (musical excerpt 1) 78 76
Identify the type of instrumental ensemble performing an excerpt 75 71
Identify form of musical examples as theme and variations 64 64
Identify a bass clef symbol 63 62
Identify pitch contour of melody in a recording 63 56
Identify saxophone as instrument playing melody 66 56
Identify a half note in printed music 52 56
Identify a correct time signature for a piece of printed music 55 52
Select a line drawing refl ective of the texture of an example of music 52 52
Identify the solo instrument beginning ldquoRhapsody in Bluerdquo 52 50
Identify form of vocal music in a recording (musical excerpt 2) 60 49
Identify an appropriate texture drawing for a homophonic excerpt 51 48
Identify term best describing the texture 47 47
Identify an appropriate description of the texture of a recorded excerpt 50 44
Identify correct time signature for recorded excerpt 42 43
Identify the name of a pitch shown in the treble clef 42 41
Identify an octave interval in a printed score 37 38
Identify the term for fermata symbol 38 33
Identify which voices enter fi rst in a choral excerpt 32 28
Identify the quality of a triad in a printed score 15 21 Significantly different (p lt 05) from 2008 SOURCE US Department of Education Institute of Education Sciences National Center for Education Statistics National Assessment of Educational Progress (NAEP) 1997 and 2008 Arts Assessments
Table A-4 Percentage correct for multiple-choice questions in NAEP visual arts at grade 8 1997 and 2008
Percent correct
Question description 1997 2008
Overall 42 42
Identify purpose of insulating package material 61 62
Identify an example of 20th-century western art 55 59
Infer from photograph advantages of shrink-wrap packaging 57 57
Identify an example of a Renaissance painting 48 50
Identify compositional emphasis in a Bearden collage 49 46
Identify genre of a Bearden collage 34 37
Identify a technical similarity between Schiele and Kollwitz self-portraits 36 37
Identify an important compositional aspect of a Kollwitz self-portrait 40 37
Identify a stylistic emphasis in a Bearden collage 29 35
Identify a compositional feature of a medieval artwork 39 32
Identify the style of an artwork as surrealism 27 31
Identify an artistic style that infl uenced cubism 25 23 Significantly different (p lt 05) from 2008 SOURCE US Department of Education Institute of Education Sciences National Center for Education Statistics National Assessment of Educational Progress (NAEP) 1997 and 2008 Arts Assessments
THE NATIONrsquoS REPORT CARD 36
Table A-5 Percentage of students in NAEP arts assessment at grade 8 by selected student and school characteristics 2008
Student characteristics Music Visual arts
SD andor ELL
Identified 17 17
Excluded 2 2
Assessed 15 16
Without accommodations 6 6
With accommodations 8 10
SD
Identified 12 12
Excluded 1 2
Assessed 10 11
Without accommodations 3 2
With accommodations 7 8
ELL
Identified 6 6
Excluded 1 1
Assessed 5 6
Without accommodations 4 4
With accommodations 2 2 NOTE Students identified as both SD and ELL were counted only once under the combined SD andor ELL category but were counted separately under the SD and ELL categories Detail may not sum to totals because of rounding SOURCE US Department of Education Institute of Education Sciences National Center for Education Statistics National Assessment of Educational Progress (NAEP) 2008 Arts Assessment
Table A-6 Percentage of students with disabilities (SD) andor English language learners (ELL) identified excluded and assessed in NAEP music and visual arts at grade 8 as a percentage of all students 2008
NOTE Black includes African American Hispanic includes Latino and Pacific Islander includes Native Hawaiian Race categories exclude Hispanic origin Detail may not sum to totals because of rounding SOURCE US Department of Education Institute of Education Sciences National Center for Education Statistics National Assessment of Educational Progress (NAEP) 2008 Arts Assessment
Student and school characteristics Music Visual arts
Raceethnicity
White 61 61
Black 15 14
Hispanic 18 17
AsianPacific Islander 5 5
American IndianAlaska Native 1 2
Unclassified 1 1
Gender
Male 50 51
Female 50 49
Eligibility for freereduced-price school lunch
Eligible 36 37
Not eligible 57 56
Information not available 7 8
Type of school
Public 93 92
Private 7 8
School location
City 29 29
Suburb 37 36
Town 12 13
Rural 22 22
37ARTS 2008 37
u S d e p A r t M e n t o f e d u C A t i o n The National Assessment of Educational Progress (NAEP) is a congressionally authorized project sponsored by the US Department of Education The National Center for Education Statistics a department within the Institute of Education Sciences administers NAEP The Commissioner of Education Statistics is responsible by law for carrying out the NAEP project Arne Duncan John Easton Stuart Kerachsky Secretary Director Acting Commissioner US Department Institute of National Center for of Education Education Sciences Education Statistics
t h e n A t i o n A l A S S e S S M e n t g o V e r n i n g b o A r d In 1988 Congress created the National Assessment Governing Board to set policy for the National Assessment of Educational Progress commonly known as The Nations Report Card TM The Governing Board is an independent bipartisan group whose members include governors state legislators local and state school officials educators business representatives and members of the general public
Darvin M Winick Chair President Winick amp Associates Austin Texas
Amanda P Avallone Vice Chair Assistant Principal and Eighth-Grade Teacher
Summit Middle School Boulder Colorado
David J Alukonis Former Chairman Hudson School Board Hudson New Hampshire
Gregory Cizek Professor of Educational Measurement
University of North Carolina Chapel Hill North Carolina
Carol A DrsquoAmico President and Chief Executive Officer
Conexus Indiana Indianapolis Indiana
Honorable David P Driscoll Former Commissioner of Education
Massachusetts Department of Education
Malden Massachusetts
Louis M Fabrizio Director of Accountability Policy and Communications
North Carolina Department of Public Instruction
Raleigh North Carolina
Honorable Anitere Flores Member Florida House of Representatives Miami Florida
Alan J Friedman Consultant Museum Development and Science Communication
New York New York
David W Gordon County Superintendent of Schools Sacramento County Office of Education
Sacramento California
Robin C Hall Principal Beecher Hills Elementary School Atlanta Georgia
Kathi M King Twelfth-Grade Teacher Messalonskee High School Oakland Maine
Kim Kozbial-Hess Educational Technology Trainer Hawkins Elementary School Toledo Ohio
Henry Kranendonk Mathematics Curriculum Specialist Milwaukee Public Schools Milwaukee Wisconsin
James S Lanich President California Business for Education Excellence
Sacramento California
Honorable Cynthia L Nava Senator New Mexico State Senate Las Cruces New Mexico
Honorable Steven L Paine State Superintendent of Schools West Virginia Department of Education
Charleston West Virginia
Honorable Sonny Perdue Governor of Georgia Atlanta Georgia
Susan Pimentel Educational Consultant Hanover New Hampshire
Andrew C Porter Dean Graduate School of Education University of Pennsylvania Philadelphia Pennsylvania
Warren T Smith Sr Vice President Washington State Board of Education
Olympia Washington
Mary Frances Taymans SND Executive Director Secondary Schools Department National Catholic Educational Association
Washington DC
Oscar A Troncoso Principal Anthony High School Anthony Texas
Eileen L Weiser General Public Representative Ann Arbor Michigan
John Easton (Ex officio) Director Institute of Education Sciences US Department of Education Washington DC
Mary Crovo Interim Executive Director National Assessment Governing Board
Washington DC
t h e n a t i o n rsquo s r e p o r t c a r d
A r t s 2 0 0 8
M u s i c amp V i s u a l A r t s June 2009
M o r e i n f o r M A t i o n The report release site is httpnationsreportcardgov The NCES web electronic catalog is httpncesedgov pubsearch
For ordering information write to US Department of Education ED Pubs PO Box 1398 Jessup MD 20794-1398
or call toll free 1-877-4ED-Pubs
or order online at httpwwwedpubs org
S u g g e S t e d C i t A t i o n Keiper S Sandene BA Persky HR and Kuang M (2009) The Nationrsquos Report Card Arts 2008 Music amp Visual Arts (NCES 2009ndash488) National Center for Education Statistics Institute of Education Sciences US Department of Education Washington DC
C o n t A C t Emmanuel Sikali 202-502-7419 emmanuelsikaliedgov
ldquo t h e d e p A r t M e n t o f e d u C A t i o n rsquo S M i S S i o n i S t o p r o M o t e S t u d e n t A C h i e V e M e n t A n d p r e p A r A t i o n f o r g l o b A l C o M p e t i t i V e n e S S b y f o S t e r i n g e d u C A t i o n A l e x C e l l e n C e A n d e n S u r i n g e q u A l A C C e S S rdquo
wwwedgov
- Contents
- Executive Summary
- Introduction
- Music
-
- Eighty-nine-point score gap between lowest- and highest-performing students in music
- Racialethnic gender and socioeconomic gaps in music scores
- Music scores vary by type and location of schools
- Context for Arts Education in Music
- What Eighth-Graders Know and Can Do in Music
- Sample Questions for Music
-
- Visual Arts
-
- Eighty-nine-point score gap between lowest- and highest-performing students in visual arts
- Responding and creating results related
- Patterns in score gaps by student characteristics similar for responding to and creating visual arts
- No significant difference in responding scores between public and private school students
- Context for Arts Education in Visual Arts
- What Eighth-Graders Know and Can Do in Visual Arts
- Sample Questions for Visual Arts
-
- Technical Notes and Data Appendix13
- More Information
-
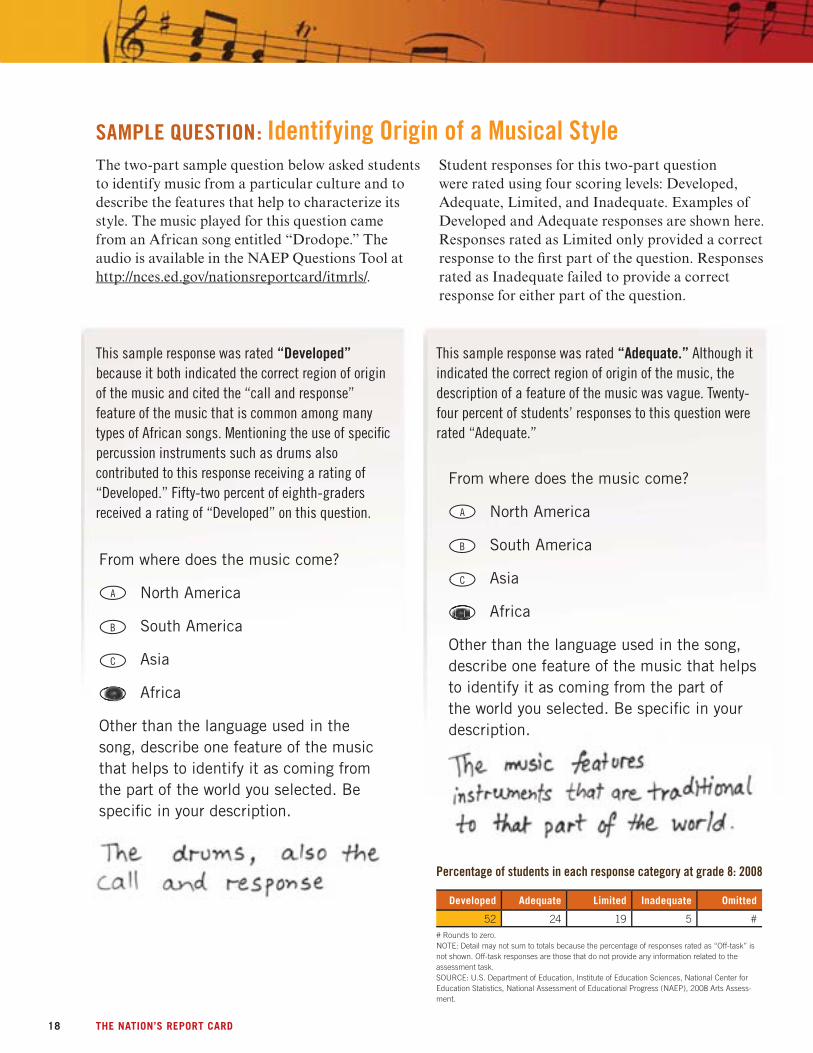
D
D
SAMPLE QUESTION Identifying Origin of a Musical Style The two-part sample question below asked students to identify music from a particular culture and to describe the features that help to characterize its style The music played for this question came from an African song entitled ldquoDrodoperdquo The audio is available in the NAEP Questions Tool at httpncesedgovnationsreportcarditmrls
Student responses for this two-part question were rated using four scoring levels Developed Adequate Limited and Inadequate Examples of Developed and Adequate responses are shown here Responses rated as Limited only provided a correct response to the first part of the question Responses rated as Inadequate failed to provide a correct response for either part of the question
This sample response was rated ldquoDevelopedrdquo because it both indicated the correct region of origin of the music and cited the ldquocall and responserdquo feature of the music that is common among many types of African songs Mentioning the use of specific percussion instruments such as drums also contributed to this response receiving a rating of ldquoDevelopedrdquo Fifty-two percent of eighth-graders received a rating of ldquoDevelopedrdquo on this question
From where does the music come
North America
South America
Asia
Africa
Other than the language used in the song describe one feature of the music that helps to identify it as coming from the part of the world you selected Be specific in your description
A
B
C
DDDDDDDDDDDDDDDDDD
From where does the music come
North America
South America
Asia
Africa
Other than the language used in the song describe one feature of the music that helps to identify it as coming from the part of the world you selected Be specific in your description
A
B
C
This sample response was rated ldquoAdequaterdquo Although it indicated the correct region of origin of the music the description of a feature of the music was vague Twenty-four percent of studentsrsquo responses to this question were rated ldquoAdequaterdquo
DDDDDDDDDDDDDDDDDDDDDDDDDDDD
Percentage of students in each response category at grade 8 2008
Developed Adequate Limited Inadequate Omitted
52 24 19 5 Rounds to zero NOTE Detail may not sum to totals because the percentage of responses rated as ldquoOff-taskrdquo is not shown Off-task responses are those that do not provide any information related to the assessment task SOURCE US Department of Education Institute of Education Sciences National Center for Education Statistics National Assessment of Educational Progress (NAEP) 2008 Arts Assessshyment
18 THE NATIONrsquoS REPORT CARD
19ARTS 2008
The 2008 arts assessment included four sections in visual arts that measured studentsrsquo ability to respond to and create visual art Students were given two of the four sections each of which contained between 7 and 11 multiple-choice and constructed-response questions Many of the visual arts questions in the assessment contained multiple parts The amount of time provided for students to complete two visual arts sections ranged from 75 minutes to 104 minutes
Responding questions asked students to analyze and describe works of art and design thereby demonstrating their knowledge of media and techniques visual organization the cultural contexts of artworks how works of art convey meaning and the relationship between form and function in design Creating questions assessed studentsrsquo ability to communicate in works of art think of different solutions to visual problems and generate ideas for and then create works of art and design These creating questions represented approximately one-half of the total assessment time in visual arts Some examples of the different types of visual arts questions are presented later in this section
20 THE NATIONrsquoS REPORT CARD
Eighty-nine-point score gap between lowest- and highest- performing students in visual arts The overall average responding score for visual arts was set at 150 in 2008 (figure 7) In addition to the overall average responding score results are shown for students at selected percentiles on the responding scale There was an 89-point gap between the scores for students at the 10th and 90th percentiles
The assessment also included questions that asked students to create works of art and design Results for these questions are presented as the average creating task score which is expressed as the average percentage of the maximum possible score ranging from 0 to 100 (see the Technical Notes for an explanation of how the score was calculated) In 2008 the overall average creating task score for grade 8 students was 52 (fi gure 8)
Responding and creating results related Because the NAEP arts framework describes the integration among the arts processes it is useful to explore the relationship between studentsrsquo results on the responding and creating questions in visual arts On average students who performed well on the responding questions also performed well on the creating questions (figure 9) For example students performing above the 75th percentile on the responding scale also had the highest average creating task score (62) Lower-performing students at or below the 25th percentile on the responding scale had the lowest average creating task score (40)
Figure 7 Average responding scale score and percentile scores in NAEP visual arts at grade 8 2008
150
104
174
300 200
190
180
170
160
150
140
130
120
110
Scale score
193
152
128
Overall 10th 25th 50th 75th 90th average score Percentile score
100
0
Figure 8 Average creating task score in NAEP visual arts at grade 8 2008
Overall 52
0 10 20 30 40 50 60 70 80 90 100
Percent of maximum score
Figure 9 Average creating task score in NAEP visual arts at grade 8 by responding score level 2008
Responding score level
Lower (lt 25th percentile)
Lower-middle (25thndash50th percentiles)
Upper-middle (50thndash75th percentiles)
Upper (gt 75th percentile)
Average creating task score
50
40
62
55
0 10 20 30 40 50 60 70 80 90 100
Percent of maximum score
SOURCE US Department of Education Institute of Education Sciences National Center for Education Statisshytics National Assessment of Educational Progress (NAEP) 2008 Arts Assessment
21ARTS 2008
Race ethnicity
54
55
46
43
49
Black
Hispanic
AsianPacific Islander
Male
White
Gender
Eligibility for free
reduced-price school lunch
54
55
46 Eligible
Not eligible
Female
Patterns in score gaps by student characteristics similar for responding to and creating visual arts
In general patterns in score differences based on student characteristics were similar for results in both responding (fi gure 10) and creating (fi gure 11)
130
120
110
RaceEthnicity In 2008 average responding scores in visual arts were 22 to 31 points higher for White and AsianPacifi c Islander students than for Black and Hispanic students There were no signifi cant differences between the average responding scores of White and AsianPacific Islander students or between the scores of Black and Hispanic students
Similarly the average creating task scores of White and AsianPacific Islander students were higher than the scores of Black and Hispanic students but there were no significant differences between the scores of White and AsianPacific Islander students or between the scores of Black and Hispanic students
Gender On average female eighth-graders had a higher responding score in visual arts than their male counterparts There was an 11-point3 gap between the two groups in 2008 The average creating task score for female students was also 5 points higher than the score for male students
Eligibility for FreeReduced-Price School Lunch On average eighth-graders who were eligible for free reduced-price school lunch had a lower responding score in visual arts than those who were not eligible There was a 29-point gap between the two groups in 2008 Students who were eligible also had an average creating task score that was 9 points lower than the score for students who were not eligible
3 The score-point gap is based on the difference between the unrounded scores as opposed to the rounded scores shown in the fi gure
Figure 10 Average responding scale score in NAEP visual arts at
200
190
180
170
160
150
140
Raceethnicity
160
129 134
156
Gender
145
155
300 Scale score
Eligibility for freereduced-price
school lunch
132
161
grade 8 by selected student characteristics 2008
0 White Black Hispanic Asian Male Female Eligible Not
Pacific eligible Islander
Figure 11 Average creating task score in NAEP visual arts at grade 8 by selected student characteristics 2008
0 10 20 30 40 50 60 70 80 90 100
Percent of maximum score
NOTE Black includes African American Hispanic includes Latino and Pacifi c Islander includes Native Hawaiian Race categories exclude Hispanic origin Sample sizes were insufshyficient to permit reliable estimates for students whose raceethnicity was American Indian Alaska Native or unclassified For the eligibility for freereduced-price school lunch category results are not shown for students whose eligibility status was not available SOURCE US Department of Education Institute of Education Sciences National Center for Education Statistics National Assessment of Educational Progress (NAEP) 2008 Arts Assessment
22 THE NATIONrsquoS REPORT CARD
No signifi cant difference in responding scores between public and private school students
While the general patterns in results for responding not all the apparent differences were found to be to and creating visual arts by selected school statistically signifi cant characteristics were similar (fi gures 12 and 13)
Type of School The apparent difference in 2008 between the average responding scores in visual arts for eighth-graders in public and private schools was not found to be statistically significant However the average creating task score was lower for public school students than for private school students
School Location Students attending suburban schools in 2008 had a higher average responding score in visual arts than students in city schools There were no significant differences in the average responding scores between students from suburban schools and town or rural schools
In the creating process of visual arts students attending suburban schools had a higher average creating task score than students in both city and town schools The average creating task score of students in suburban schools was not signifi cantly different from the score of students in rural schools
Because responding results are presented as scale scores and creating results are presented as average percentages it is not possible to compare the magnitude of differences between these scores For example an 11-point difference on the 0ndash300 responding scale between students attending schools in city and suburban locations is not necessarily greater than a 5-point difference between the same two groups on the 0ndash100 creating task scale
Figure 12 Average responding scale score in NAEP visual arts at grade 8 by selected school characteristics 2008
140
130
120
110
0 Public Private
200
190
180
170
160
150
City Suburb Town Rural
School location
144
155 149 151
Type of school
149
159
300 Scale score
Figure 13 Average creating task score in NAEP visual arts at
City
Suburb
Town
Rural
School location
52
49
50
54
Public
Private
Type of school 60
51
grade 8 by selected school characteristics 2008
0 10 20 30 40 50 60 70 80 90 100
Percent of maximum score
SOURCE US Department of Education Institute of Education Sciences National Center for Education Statistics National Assessment of Educational Progress (NAEP) 2008 Arts Assessment
23ARTS 2008
Context for Arts Education in Visual Arts To provide the context in which arts learning takes and nature of visual arts education in their schools place results are presented here based on school and studentsrsquo responses about their participation in administratorsrsquo responses related to the availability visual arts activities
Frequency of visual arts instruction remains steady School administrators were asked how often eighth-graders attending their schools might receive instruction in visual arts Forty-seven percent of eighth-graders attended schools where students could possibly receive visual arts instruction at least three or four times a week in 2008 (fi gure 14) This was higher than the percentages of students attending schools where visual arts were offered less frequently or not at all
Although the data are not shown here access to visual arts instruction did not differ significantly by race ethnicity gender or eligibility for freereduced-price school lunch For example the percentage of students who were eligible for freereduced-price school lunch attending schools where visual arts were offered once or twice a week was not significantly different from the percentage of students who were not eligible
The same question was asked of school administrators in 1997 making it possible to look for changes in the instruction patterns over time The results showed no significant changes between 1997 and 2008 in the percentages of students who attended schools where visual arts were available at least three or four times a week once or twice a week less than once a week or not at all
Figure 14 Percentage of students at grade 8 by school-reported frequency with which instruction in visual arts is available 1997 and 2008
1997
2008 47
52At least 3 or 4 times a week
30
25Once or twice
a week
5
10
Less than once a week
17
14
Subject not offered
0 10 20 30 40 50 60 70 80 90 100
Percent
NOTE Detail may not sum to totals because of rounding SOURCE US Department of Education Institute of Education Sciences National Center for Education Statistics National Assessment of Educational Progress (NAEP) 1997 and 2008 Arts Assessments
77 percent of eighth-graders attended schools where administrators reported that visual arts were taught by a full-time specialist
69 percent of students attended schools that followed a state or district curriculum in visual arts
24 THE NATIONrsquoS REPORT CARD
More students writing about their artwork
Students responded to a series of questions about how often they did certain activities in visual arts class For each activity listed in figure 15 students indicated if their teacher had them do it every day once a week once a month or never or hardly ever The results summarized here show the combined percentages for students who reported that they did various art-related activities at least once a month
The percentage of students who reported that their teacher had them write about their artwork increased from 21 percent in 1997 to 27 percent in 2008 However the percentage of students whose teacher had them choose their own art project decreased from 47 percent in 1997 to 39 percent in 2008 There were no significant changes between 1997 and 2008 in the percentages of students who reported that their teachers had them paint or draw make things out of clay or other materials work in a pair or group on an art project talk with others about their own or othersrsquo artwork or look at videotapes filmstrips slides or television programs about art
Fewer students visit art museums with class in 2008 Exposure to art museums and exhibits outside of school may help students learn about and engage in visual arts Sixteen percent of students in 2008 reported that they had gone with their class to an art museum gallery or exhibit at least once in the last year which was smaller than the 22 percent in 1997 (fi gure 16)
Although not presented here graphically 54 percent of eighth-graders reported that they or their teacher saved their artwork in a portfolio in 2008 which was not signifi cantly different from the 50 percent in 1997
About half of students save artwork in a portfolio
Figure 15 Percentage of students at grade 8 by student-reported in-school activities their teachers have them do in art at least once a month 1997 and 2008
45
43
21
27
50
43
39
47
41
38
80
80
53
40
Paint or draw
Make things out of clay or
other materials
Choose own art project
Work in a pair or a group on an
art project
Talk with others about own artwork or
that of other students
Write about own artwork
Look at videotapes filmstrips slides
or television programs about art
1997
2008
0 10 20 30 40 50 60 70 80 90 100
Percent
Significantly different (p lt 05) from 2008
Figure 16 Percentage of students at grade 8 who reported visiting an art museum gallery or exhibit with their class at least once a year 1997 and 2008
1997
2008 16
22
0 10 20 30 40 50 60 70 80 90 100
Percent
Significantly different (p lt 05) from 2008 SOURCE US Department of Education Institute of Education Sciences National Center for Education Statistics National Assessment of Educational Progress (NAEP) 1997 and 2008 Arts Assessments
25ARTS 2008
What Eighth-Graders Know and Can Do in Visual Arts The item map below is useful for understanding studentsrsquo performance at different points on the responding scale The scale scores on the left represent the average scores for students who were likely to get the questions correct or partially correct Scores for the 25th and 75th percentiles are also noted The descriptions of selected assessment questions are listed on the right
For example the map shows that higher-performing eighth-graders in the upper range of the scale with an average score of 237 were likely to be able
Grade 8 NAEP Visual Arts Responding Item Map Scale score Question description
to identify the style of an artwork as surrealism Middle-performing students with an average score of 144 were likely to be able to analyze the subject of five motherchild portraits of different genres
Constructed-response questions for which students could earn partial credit may appear on the map multiple times once for each level of credit For example a question asking students to describe two characteristics of charcoal in a self-portrait appears at the score of 201 for responses receiving full credit and at 134 for responses receiving partial credit
300
285 Support plausible interpretation of Schiele self-portrait with observations about style line and color 280 Explain how an unusualunexpected feature of a Bearden collage contributes to the work as a whole 256 Analyze and support with references to the work the narrative conveyed by a Bearden collage 241 Describe at least three aspects of own self-portrait that communicate something about you 240 Explain materials and design of own package idea for transporting fi sh on bicycle 237 Identify the style of an artwork as surrealism 229 Label and specifi cally describe one or two features of a Bearden collage that the artist wants you to notice 224 Identify a technical similarity between Schiele and Kollwitz self-portraits (page 28) 221 Explain how artist used light and shadow to create realism in motherchild portrait 220 Explain three ways an artist made some things look near and some far in motherchild portrait 213 Support plausible interpretation of Schiele self-portrait with observations about style line or color 205 Explain how Bearden creates contrast between interior and exterior areas in collage 202 Describe two aspects of own self-portrait that communicate something about you 201 Describe two characteristics of charcoal in Kollwitz self-portrait (page 29) 197 Identify an example of Renaissance art 197 Identify compositional emphasis in a Bearden collage 189 Identify an example of 20th century western art 176 Compare in specifi c terms how Kollwitz has drawn different parts of her self-portrait and offer plausible
interpretation for differences (pages 30 and 31) 176 Explain where artist has used light and shadow to create realism in motherchild portrait
172 Describe and support how memory of place is shown in own collage 170 Explain how artist used light to create a lack of realism in motherchild portrait 144 Analyze subject of fi ve motherchild portraits of different genres 136 Describe one aspect of own self-portrait that communicates something about you 134 Describe one characteristic of charcoal in Kollwitz self-portrait (page 29)
128 Identify an unusualunexpected feature of the Bearden collage 62 Describe memory of place andor aspect(s) of own collage 61 Describe what Schiele self-portrait is communicating or describe an aspect of style line or color
0
174 75th percentile
128 25th percentile
NOTE Regular type denotes a constructed-response question Italic type denotes a multiple-choice question The position of a question on the scale represents the average scale score attained by students who had a 65 percent probability of obtaining credit at a specific level of a constructed-response question or a 74 percent probability of correctly answering a four-option multiple-choice question SOURCE US Department of Education Institute of Education Sciences National Center for Education Statistics National Assessment of Educational Progress (NAEP) 2008 Arts Assessment
26 THE NATIONrsquoS REPORT CARD
Self-portrait B Egon Schiele Crayon and watercolor on buff paper Galerie St Etienne
Self-portrait A Kathe Kollwitz Charcoal on brown laid paper National Gallery of Art
Sample Questions for Visual Arts Students were asked a series of questions related to two self-portraits shown here one by Kathe Kollwitz (A) and one by Egon Schiele (B) These questions required students to apply their knowledge of aesthetic properties to the two artworks and to consider the relationships between these properties and the expressive qualities of each work Students were then asked to create a self-portrait of their own
27ARTS 2008
B
SAMPLE QUESTION Recognizing a Technical Similarity Between Two Self-Portraits
The sample question below asked students to recognize a technical similarity between the Kollwitz and Schiele self-portraits In both works
In 2008 thirty-seven percent of students correctly identified this common feature of the two artworks (choice B) This was not found to be significantly
expressive loose lines are combined with precise different from the 36 percent who answered drawing correctly in 1997 Choices A C and D do not
accurately describe technical similarities between the two works
Which statement describes a technical similarity between self-portraits A and B
The figure in each work is seen from the same point of view
Both works combine loose gestural lines with careful drawing
The compositions in both works are symmetrical
Both works rely on light and shadow to emphasize depth
A
C
D
BBBBBBBBBBBBBBBBBBBBBBBB
Choice A Choice B Choice C Choice D Omitted
8 37 8 46
Percentage of students in each response category at grade 8 2008
Rounds to zero NOTE Detail may not sum to totals because of rounding SOURCE US Department of Education Institute of Education Sciences National Center for Education Statistics National Assessment of Educational Progress (NAEP) 2008 Arts Assessshyment
28 THE NATIONrsquoS REPORT CARD
SAMPLE QUESTION Characteristics of Charcoal The sample question below asked students to Unacceptable Examples of Acceptable and Partial describe characteristics of the medium of charcoal responses are shown here Responses rated as visible in the Kollwitz self-portrait Student Unacceptable did not describe characteristics of the responses for this question were rated using medium of charcoal evident in the self-portrait three scoring levels Acceptable Partial and
This sample response was rated ldquoAcceptablerdquo because it demonstrated the studentrsquos knowledge of charcoal as a medium The student expressed what Kollwitz was able to accomplish with charcoal in her self-portrait Thirty-four percent of eighth-graders received a rating of ldquoAcceptablerdquo on this question
Self-portrait A is a charcoal drawing Describe two characteristics of charcoal that you see in self-portrait A
1
2
Acceptable Partial Unacceptable Omitted
34 38 27 1 NOTE Detail may not sum to totals because the percentage of responses rated as ldquoOff-taskrdquo is not shown Off-task responses are those that do not provide any information related to the assessment task SOURCE US Department of Education Institute of Education Sciences National Center for Education Statistics National Assessment of Educational Progress (NAEP) 2008 Arts Assessshyment
Percentage of students in each response category at grade 8 2008
This sample response was rated ldquoPartialrdquo because it provided only one example of how charcoal was used in the self-portrait The student recognized that pressing harder on charcoal results in a darker mark as is evident in the Kollwitz self-portrait However the second part of the response did not describe another characteristic of charcoal as a medium Thirty-eight percent of studentsrsquo responses to this question were rated ldquoPartialrdquo
Self-portrait A is a charcoal drawing Describe two characteristics of charcoal that you see in self-portrait A
1
2
29ARTS 2008
a s
SAMPLE QUESTION Relationship Between Technical Approach and Meaning
Both parts of this sample response were rated ldquoAcceptablerdquo This response accurately described the differences between the parts of the drawing and then used thesss eeee oooo bbbbsssseeeeerrrr vvvvvaaaattttiiiiii oooooo nnnnnnnsssssss tttttt ooooooo ooooooooffffffffffffffffeeeeeeeerrrrrr aaaaaaaannnnnnnn iiiiiiiinnnnnnnnssssssssiiiiiiiigggggggghhhhhhhhttttttttffffffffuuuuuuuullllllll andddd pllausible interpretation of the reasons for those differences
Fifty-three percent of students received a rating of ldquoAcceptablerdquo for part A and 19 percent received an ldquoAcceptablerdquo rating for part B Students who received the ldquoAcceptablerdquo rating were able to both comprehend
pthe formal characteristics of the self-portrait and discuss the relationship between those characteristics and the artistrsquos possible expressive goals
Look at self-portrait A Compare how Kollwitz has drawn her head and hand with the way she has drawn her arm Be specific
A
Explain what you think Kollwitz may have been trying to communicate about herself by drawing these different parts of her self-portrait in different ways
B
THE NATIONrsquoS REPORT CARD
The two-part sample question below required students to analyze and interpret the Kollwitz self-portrait to explore relationships between technical approach and meaning Part A of the question asked students about the workrsquos formal characteristics while part B asked them to connect those characteristics with what the artist was attempting to communicate Student responses
to each of the two parts were rated separately using three scoring levels Acceptable Partial and Unacceptable Examples of Acceptable and Partial student responses for each part of this question are shown here Unacceptable responses for the question neither addressed differences in the way the parts of the self-portrait are drawn nor offered interpretations linked to observations
30
Both parts of this sample response received a ldquoPartialrdquo rating This response accurately described the way the arm is drawn but did not specifi cally address the ways in which the head and hand are drawn differently from the arm ldquoPartialrdquo credit was given for recognizing some characteristics of the artwork While a few plausible interpretations about what Kollwitz was trying to communicate are provided in the second part of the response none of these is clearly linked to the descriptions offered in the fi rst part
Look at self-portrait A Compare how Kollwitz has drawn her head and hand with the way she has drawn her arm Be specifi c
A
Explain what you think Kollwitz may have been trying to communicate about herself by drawing these different parts of her self-portrait in different ways
Fifteen percent of the student responses were rated B ldquoPartialrdquo for part A and 52 percent were rated ldquoPartialrdquo for part B
Percentage of students in each response category at grade 8 2008
Part A Part B
Acceptable Partial Unacceptable Omitted
53 15 31 2
Acceptable Partial Unacceptable Omitted
19 52 25 3
NOTE Detail may not sum to totals because the percentage of responses rated as ldquoOff-taskrdquo is not shown Off-task responses are those that do not provide any information related to the assessment task SOURCE US Department of Education Institute of Education Sciences National Center for Education Statistics National Assessment of Educational Progress (NAEP) 2008 Arts Assessment
31ARTS 2008
t t t t
a t
t t
s c
t
ldquoldquo
SAMPLE QUESTION Creating a Self-Portrait After students had observed the Kollwitz and Schiele self-portraits and studied relationships between the technical and expressive qualities of the two artworks they were asked to create a self-portrait of their own Students were given a set of
a mirror and a sheet of 12-inch by 18-inch white drawing paper and were asked to use these tools to create a self-portrait that would express something important about their personalities These self-portraits were rated using four scoring levels
12 Cray-pas (colored oil pastels) a charcoal pencil Sufficient Uneven Minimal and Insufficient
ChChCharararracacacteteteririristststicicic ooofff wowoworkrkksss rararateteteddd ldquoSldquoSSufufu ficficccieieientntntrdquordquordquo bbbototothhh ofoffo ttt hehehe stststudududu enenenen tststsrsquorsquorsquo rererere spspspoononon seseesessss prprpp essesenenene teteteddd heheherererr sssshohohowewew ddd clclc eaeaeae rr ananandddd spspspp ecifiifififi cccc obobobseseservrvrvatatatioioionsnsns ttthahahaa tt cococommmmmm unununiciccatatatededed sssomomommetetethihihi ngngg immmm poop rtrtrtananan ttt ababbouououo ttt ththth eeee ararartitit stststs ThThThTh eyeyy iiincncncn ororo popoorararaa teteteedddd ididdeenentititit fyfyfyininingg dedede tata ilii iinn tetett rmrmrm ss ofofoff pppererrersososos nananana ll fefefeeatata ururu eses aandndd ininn sstutuudededentntt rerere spsppppononon seseee 11 ananann aaa ctctivivi itiityyy (a(a(artrtt mmm akaka inining)g)g) ThThheee seses lflfflflf -p-p-pororortrtrtrt aiaiaitststss shshshowowowow edeeded pppururu popoposeses efufuffu lll usussu eee ofofof cccommompopoosisis tititt ononon alal eeelelemememme ntntntsss anann ddddd sososososso phphphphphp isssisstitttiticacacacateteteedddd usussuseee ofofof mmm atataterereriaiaiaalssl FoFoFo rr exexexe amamamm plplplpleee iinnn ststststudududeneneenttt rerereespspspp onononnsesese 111 hthththh eee smsmms udududu gigigigg ngngngn g ooofff CrCrCrCr ayayayy-p-p-pasasas cccrerereatatatatededed anananan aaaaffiffiffiffininininitytyty aaamomomoo ngngng tttt hehehehee hhhheaeaeaaee ddddd aaa rmrmrm ananana ddd hahahandndnddn ananana ddd lolooolo oosoososeee wewewewe lllll-p-p-p-pp lalalaacececece dddd lililiinenenenesssss adadadadd dedededdeddddd dededed fifinfinnfinitititioioionnn tototoo ttthehehee bbbb ododododo yyy
Percentage of students in each response category at grade 8 2008
BoBoBoBBothththth wwworororoorksksksk aaaaalslslslsooo shshhs howwowowedeede vvvererere yyyyy gogogoododod uuu sesese ooofff prprpropopo ororortititionnno n cocococoo lololorrr aaaaandndnd lll inininn eeee aaandndndd wwwererer eee fuufullllllyyy dededevevev lololopepep dd anananndd nininindididid vivividududualalalizizizizi ededededded FoFoFoF rrr exexexxamamamamplpleee iiinnn stststududdenene n ttt rerere spspps onononn seseee 222222 thhhhhhthhththhhhth e stststs udududd enenenntt skskkk liliii lfflflflf ululullylyly uuuseseseseedddd cocococo lolorrr tototo eempmpmmp hahhah sisisizezez aaa ndndndndn cccrerere atatat eeeeeee cococo ntntnttrarraaststs bbbetetetwewewewe eenenn sssspepepppecicicificficficfic pppp araara tstst s ooff heherrr seseselflfl -p-pp ororor trtrtraiaiaittt BoBoBoBothththh sss tututudededed nntntn rrresesespopoo nsnsnsn eses 11 aaandndndnd 222 aalslslsooo shsshshowowededed eeevivivvvidededeencnccccncncncccc e ofoffof ttttheheehh sss tututudededed ntntntntsss hahahah vivivingngng ssspepeepentntntnt tttimimimeee obobob seseservrvinini gggg thththeee KoKoKolllll wwiwwww tz anana ddd ScScScSchihihielele ee seses lflflf-p-p-porororortrtrrtrraiaiaitststs FoFoFoFooururr pppererercececentntnt ooo fff stststudududenenntstststsrsquorsquorsquorsquo sssesss lfshypopopoortrtrt rararaaitititsss wewewererere rrratatatededed ldquoldquoSuSuSuu ffiffifficicciennee ttrdquordquordquo
1
2
Sufficient Uneven Minimal Insufficient Omitted
4 25 57 14 Rounds to zero NOTE Detail may not sum to totals because the percentage of responses rated as ldquoOff-taskrdquo is not shown Off-task responses are those that do not provide any information related to the assessment task SOURCE US Department of Education Institute of Education Sciences National Center for Education Statistics National Assessment of Educational Progress (NAEP) 2008 Arts Assessshyment
32 THE NATIONrsquoS REPORT CARD
Works at the ldquoUnevenrdquo level made some specific observations They sometimes employed pertinent compositional elements gave attention to details such as facial features to convey expression andor effectively used materials to communicate However ldquoUnevenrdquo works were typically inconsistent or incomplete in parts
In the sample presented here the student gave her work individuality by vivid use of color facial expression and the symbols incorporated in her jewelry and the background However elements of her work seem inconsistent and lacking in deliberation such as the placement and rendering of the symbols and colors in the background Twenty-five percent of studentsrsquo self-portraits were rated ldquoUnevenrdquo
As with many works rated at the ldquoMinimalrdquo level in the sample self-portrait shown here efforts at specific observations were apparent but relatively minimal (the red lines in the eyes) Compositional successes may seem more accidental than deliberate and use of materials was unskilled For example while this student may have been attempting to convey some sense of an individual person by emphasizing only his eyes and mouth with color he lacked the skill to make this choice distinctive enough to convey his message Fifty-seven percent of studentsrsquo self-portraits were rated ldquoMinimalrdquo
Most self-portraits rated ldquoInsufficientrdquo were generally so schematic as to convey little or nothing about the student Like the sample self-portrait shown here they showed unspecific observation little awareness of composition and highly unskilled use of materials In contrast to the ldquoMinimalrdquo response there were no features in this self-portrait that conveyed anything specific about a person and it remained at a general level Fourteen percent of studentsrsquo self-portraits were rated ldquoInsufficientrdquo
33ARTS 2008
Sampling and Weighting The schools and students who participate in NAEP assessments are selected to form a representative sample of the nation The national sample of eighth-graders in the 2008 arts assessment was chosen using a multistage design that involved drawing students from the sampled public and private schools across the country The results from the assessed students were combined to provide accurate estimates of the overall performance of students in the nation
Each school that participated in the assessment and each student assessed represents a portion of the population of interest Results are weighted to make appropriate inferences between the student samples and the respective populations from which they are drawn Sampling weights are adjusted for the disproportionate representation of some groups in the selected sample This includes the oversampling of schools with high concentrations of students from certain racialethnic groups and the lower sampling rates of students who attend very small schools
School and Student Participation Rates The school and student participation rates for public and private schools in the 2008 arts assessment are provided in table A-1
NCES statistical standards require that a nonresponse bias analysis be conducted for any school or student group with a participation rate that falls below 85 percent The participation rates for the 2008 NAEP arts assessment indicated a need for a school nonresponse bias analysis for the private school sample The results showed that school substitution and nonresponse adjustments were not effective in reducing nonresponse bias for the percentage of Hispanic students enrolled and type of private schools (Catholic and other private schools) The disproportionate nonresponse resulted
in an overestimation of the percentage of Hispanic students an overestimation of the percentage of Catholic school students and an underestimation of the percentage of other private school students
Table A-1 School and student participation rates in NAEP arts at grade 8 by subject and type of school 2008
Subject and type of school
Music
Nation
Public
Private
Visual arts
Nation
Public
Private
School participation Student participation
Number of Number of schools Weighted students Weighted
participating percent assessed percent
260 97 4000 93
220 99 3400 93
30 76 500 97
260 97 3900 92
220 99 3400 92
30 76 500 94
NOTE The numbers of schools are rounded to the nearest ten and the numbers of students are rounded to the nearest hundred Detail may not sum to totals because of rounding SOURCE US Department of Education Institute of Education Sciences National Center for Education Statistics National Assessment of Educational Progress (NAEP) 2008 Arts Assessment
Interpreting Statistical Signifi cance Comparisons over time or between groups in this report are based on statistical significance at the 05 level using t-tests with appropriate adjustments for multiple comparisons (using the False Discovery Rate procedure) These statistical tests consider both the size of the differences and standard errors of the two statistics being compared Standard errors are margins of error and estimates based on smaller groups are likely to have larger margins of error relative to estimates based on larger groups Note for example that differences based on schoolshyadministrator-reported estimates have smaller sample sizes than differences based on student-reported estimates resulting in smaller signifi cant differences in the student-reported data than in the
THE NATIONrsquoS REPORT CARD 34
school-administrator-reported data The size of the standard errors may also be influenced by other factors such as how representative the students assessed are of the entire population
When an estimate has a large standard error a numerical difference that seems large may not be statistically significant Differences of the same magnitude may or may not be statistically significant depending upon the size of the standard errors of the estimates For example a 10-point difference between male and female students may be statistically significant while a 10-point difference between students attending public and private schools may not be Standard errors for the estimates presented in this report are available at httpncesedgovnationsreportcardnaepdata and on the 2008 arts results website at http nationsreportcardgovarts_2008
National School Lunch Program NAEP collects data on student eligibility for the National School Lunch Program (NSLP) as an indicator of poverty Under the guidelines of NSLP children from families with incomes below 130 percent of the poverty level are eligible for free meals Those from families with incomes between 130 and 185 percent of the poverty level are eligible for reduced-price meals (For the period July 1 2007 through June 30 2008 for a family of four 130 percent of the poverty level was an annual income of $27000 and 185 percent was $38000) For more information on NSLP visit httpwww fnsusdagovcndlunch
School Location Results of the 2008 NAEP arts assessment were reported for four mutually exclusive categories of school location These categories are based on standard definitions established by the Federal Office of Management and Budget using population and geographic information from the US Census Bureau The classification system is referred to as ldquourban-centric locale codesrdquo which classifies territory into four major types
city suburb town and rural More details on the classification system can be found at httpnces edgovccdrural_localesasp
The Creating Task Score Studentsrsquo performance on questions assessing the creating process in visual arts is presented as the average creating task score in this report The creating task score for each creating question (task) is the sum of the percentage of students receiving full credit and a fraction of the percentage of students receiving partial credit The individual scores are then averaged together to report an average creating task score for the entire set of the visual arts creating questions
An example of computing the creating task score is provided below for a sample question in this report that asks eighth-graders to draw a self-portrait Responses to this question were scored ldquoSufficientrdquo ldquoUnevenrdquo ldquoMinimalrdquo or ldquoInsufficientrdquo The percentages of students falling into these four scoring levels are 4 percent 25 percent 57 percent and 14 percent respectively (table A-2) Responses at these four levels receive
1score weights of 1 23 and 0 respectively The
3creating task score for this question is computed as 1 (4) + 2 (25) + 1 (57) + 0 (14) = 403 3
Table A-2 Example showing how the creating task score was computed for a sample question in NAEP visual arts at grade 8 2008
Percentage Percentage of of students times
Scoring level students Score weight score weight
Sufficient 4 1 4
Uneven 25 2 3 17
Minimal 57 1 3 19
Insufficient 14 0 0
Creating task score (4 + 17 + 19 + 0) = 40
SOURCE US Department of Education Institute of Education Sciences National Center for Education Statistics National Assessment of Educational Progress (NAEP) 2008 Arts Assessment
ARTS 2008 3535
Comparing Results Between the 1997 and 2008 Assessments Although the assessment questions adminshyistered in 2008 were selected from those used in the 1997 assessment due to changes in scoring procedures and materials the 2008 score results in music and visual arts could not be directly compared to the results in 1997
In the 2008 arts assessment the scoring guides for constructed-response questions the sample questions and student responses used to train scorers and the standardized training procedures were updated to refl ect changes in training and scoring procedures that have been adapted for use across all NAEP assessments since 1997 In addition because the student artwork used as training samples for visual arts in 1997 had degraded over time and because of differences in the availability of certain types of art supplies and tools between 1997 and 2008 new samples were developed for scoring studentsrsquo responses to the creating questions in 2008
However since the scoring method for multiple-choice questions was the same in 1997 and 2008 direct comparisons could be made between the two years on results for these questions in music and visual arts (tables A-3 and A-4) Because multiple-choice questions were only a portion of the assessment and only assessed certain types of topics in the responding process of music and visual arts the changes in studentsrsquo performance between 1997 and 2008 on these questions did not represent the performance changes for the constructed-response questions or the entire assessment
Table A-3 Percentage correct for multiple-choice questions in NAEP music at grade 8 1997 and 2008
Percent correct
Question description 1997 2008
Overall 53 51
Identify directional contour of part of melodic phrase 79 77
Identify form of vocal music in a recording (musical excerpt 1) 78 76
Identify the type of instrumental ensemble performing an excerpt 75 71
Identify form of musical examples as theme and variations 64 64
Identify a bass clef symbol 63 62
Identify pitch contour of melody in a recording 63 56
Identify saxophone as instrument playing melody 66 56
Identify a half note in printed music 52 56
Identify a correct time signature for a piece of printed music 55 52
Select a line drawing refl ective of the texture of an example of music 52 52
Identify the solo instrument beginning ldquoRhapsody in Bluerdquo 52 50
Identify form of vocal music in a recording (musical excerpt 2) 60 49
Identify an appropriate texture drawing for a homophonic excerpt 51 48
Identify term best describing the texture 47 47
Identify an appropriate description of the texture of a recorded excerpt 50 44
Identify correct time signature for recorded excerpt 42 43
Identify the name of a pitch shown in the treble clef 42 41
Identify an octave interval in a printed score 37 38
Identify the term for fermata symbol 38 33
Identify which voices enter fi rst in a choral excerpt 32 28
Identify the quality of a triad in a printed score 15 21 Significantly different (p lt 05) from 2008 SOURCE US Department of Education Institute of Education Sciences National Center for Education Statistics National Assessment of Educational Progress (NAEP) 1997 and 2008 Arts Assessments
Table A-4 Percentage correct for multiple-choice questions in NAEP visual arts at grade 8 1997 and 2008
Percent correct
Question description 1997 2008
Overall 42 42
Identify purpose of insulating package material 61 62
Identify an example of 20th-century western art 55 59
Infer from photograph advantages of shrink-wrap packaging 57 57
Identify an example of a Renaissance painting 48 50
Identify compositional emphasis in a Bearden collage 49 46
Identify genre of a Bearden collage 34 37
Identify a technical similarity between Schiele and Kollwitz self-portraits 36 37
Identify an important compositional aspect of a Kollwitz self-portrait 40 37
Identify a stylistic emphasis in a Bearden collage 29 35
Identify a compositional feature of a medieval artwork 39 32
Identify the style of an artwork as surrealism 27 31
Identify an artistic style that infl uenced cubism 25 23 Significantly different (p lt 05) from 2008 SOURCE US Department of Education Institute of Education Sciences National Center for Education Statistics National Assessment of Educational Progress (NAEP) 1997 and 2008 Arts Assessments
THE NATIONrsquoS REPORT CARD 36
Table A-5 Percentage of students in NAEP arts assessment at grade 8 by selected student and school characteristics 2008
Student characteristics Music Visual arts
SD andor ELL
Identified 17 17
Excluded 2 2
Assessed 15 16
Without accommodations 6 6
With accommodations 8 10
SD
Identified 12 12
Excluded 1 2
Assessed 10 11
Without accommodations 3 2
With accommodations 7 8
ELL
Identified 6 6
Excluded 1 1
Assessed 5 6
Without accommodations 4 4
With accommodations 2 2 NOTE Students identified as both SD and ELL were counted only once under the combined SD andor ELL category but were counted separately under the SD and ELL categories Detail may not sum to totals because of rounding SOURCE US Department of Education Institute of Education Sciences National Center for Education Statistics National Assessment of Educational Progress (NAEP) 2008 Arts Assessment
Table A-6 Percentage of students with disabilities (SD) andor English language learners (ELL) identified excluded and assessed in NAEP music and visual arts at grade 8 as a percentage of all students 2008
NOTE Black includes African American Hispanic includes Latino and Pacific Islander includes Native Hawaiian Race categories exclude Hispanic origin Detail may not sum to totals because of rounding SOURCE US Department of Education Institute of Education Sciences National Center for Education Statistics National Assessment of Educational Progress (NAEP) 2008 Arts Assessment
Student and school characteristics Music Visual arts
Raceethnicity
White 61 61
Black 15 14
Hispanic 18 17
AsianPacific Islander 5 5
American IndianAlaska Native 1 2
Unclassified 1 1
Gender
Male 50 51
Female 50 49
Eligibility for freereduced-price school lunch
Eligible 36 37
Not eligible 57 56
Information not available 7 8
Type of school
Public 93 92
Private 7 8
School location
City 29 29
Suburb 37 36
Town 12 13
Rural 22 22
37ARTS 2008 37
u S d e p A r t M e n t o f e d u C A t i o n The National Assessment of Educational Progress (NAEP) is a congressionally authorized project sponsored by the US Department of Education The National Center for Education Statistics a department within the Institute of Education Sciences administers NAEP The Commissioner of Education Statistics is responsible by law for carrying out the NAEP project Arne Duncan John Easton Stuart Kerachsky Secretary Director Acting Commissioner US Department Institute of National Center for of Education Education Sciences Education Statistics
t h e n A t i o n A l A S S e S S M e n t g o V e r n i n g b o A r d In 1988 Congress created the National Assessment Governing Board to set policy for the National Assessment of Educational Progress commonly known as The Nations Report Card TM The Governing Board is an independent bipartisan group whose members include governors state legislators local and state school officials educators business representatives and members of the general public
Darvin M Winick Chair President Winick amp Associates Austin Texas
Amanda P Avallone Vice Chair Assistant Principal and Eighth-Grade Teacher
Summit Middle School Boulder Colorado
David J Alukonis Former Chairman Hudson School Board Hudson New Hampshire
Gregory Cizek Professor of Educational Measurement
University of North Carolina Chapel Hill North Carolina
Carol A DrsquoAmico President and Chief Executive Officer
Conexus Indiana Indianapolis Indiana
Honorable David P Driscoll Former Commissioner of Education
Massachusetts Department of Education
Malden Massachusetts
Louis M Fabrizio Director of Accountability Policy and Communications
North Carolina Department of Public Instruction
Raleigh North Carolina
Honorable Anitere Flores Member Florida House of Representatives Miami Florida
Alan J Friedman Consultant Museum Development and Science Communication
New York New York
David W Gordon County Superintendent of Schools Sacramento County Office of Education
Sacramento California
Robin C Hall Principal Beecher Hills Elementary School Atlanta Georgia
Kathi M King Twelfth-Grade Teacher Messalonskee High School Oakland Maine
Kim Kozbial-Hess Educational Technology Trainer Hawkins Elementary School Toledo Ohio
Henry Kranendonk Mathematics Curriculum Specialist Milwaukee Public Schools Milwaukee Wisconsin
James S Lanich President California Business for Education Excellence
Sacramento California
Honorable Cynthia L Nava Senator New Mexico State Senate Las Cruces New Mexico
Honorable Steven L Paine State Superintendent of Schools West Virginia Department of Education
Charleston West Virginia
Honorable Sonny Perdue Governor of Georgia Atlanta Georgia
Susan Pimentel Educational Consultant Hanover New Hampshire
Andrew C Porter Dean Graduate School of Education University of Pennsylvania Philadelphia Pennsylvania
Warren T Smith Sr Vice President Washington State Board of Education
Olympia Washington
Mary Frances Taymans SND Executive Director Secondary Schools Department National Catholic Educational Association
Washington DC
Oscar A Troncoso Principal Anthony High School Anthony Texas
Eileen L Weiser General Public Representative Ann Arbor Michigan
John Easton (Ex officio) Director Institute of Education Sciences US Department of Education Washington DC
Mary Crovo Interim Executive Director National Assessment Governing Board
Washington DC
t h e n a t i o n rsquo s r e p o r t c a r d
A r t s 2 0 0 8
M u s i c amp V i s u a l A r t s June 2009
M o r e i n f o r M A t i o n The report release site is httpnationsreportcardgov The NCES web electronic catalog is httpncesedgov pubsearch
For ordering information write to US Department of Education ED Pubs PO Box 1398 Jessup MD 20794-1398
or call toll free 1-877-4ED-Pubs
or order online at httpwwwedpubs org
S u g g e S t e d C i t A t i o n Keiper S Sandene BA Persky HR and Kuang M (2009) The Nationrsquos Report Card Arts 2008 Music amp Visual Arts (NCES 2009ndash488) National Center for Education Statistics Institute of Education Sciences US Department of Education Washington DC
C o n t A C t Emmanuel Sikali 202-502-7419 emmanuelsikaliedgov
ldquo t h e d e p A r t M e n t o f e d u C A t i o n rsquo S M i S S i o n i S t o p r o M o t e S t u d e n t A C h i e V e M e n t A n d p r e p A r A t i o n f o r g l o b A l C o M p e t i t i V e n e S S b y f o S t e r i n g e d u C A t i o n A l e x C e l l e n C e A n d e n S u r i n g e q u A l A C C e S S rdquo
wwwedgov
- Contents
- Executive Summary
- Introduction
- Music
-
- Eighty-nine-point score gap between lowest- and highest-performing students in music
- Racialethnic gender and socioeconomic gaps in music scores
- Music scores vary by type and location of schools
- Context for Arts Education in Music
- What Eighth-Graders Know and Can Do in Music
- Sample Questions for Music
-
- Visual Arts
-
- Eighty-nine-point score gap between lowest- and highest-performing students in visual arts
- Responding and creating results related
- Patterns in score gaps by student characteristics similar for responding to and creating visual arts
- No significant difference in responding scores between public and private school students
- Context for Arts Education in Visual Arts
- What Eighth-Graders Know and Can Do in Visual Arts
- Sample Questions for Visual Arts
-
- Technical Notes and Data Appendix13
- More Information
-
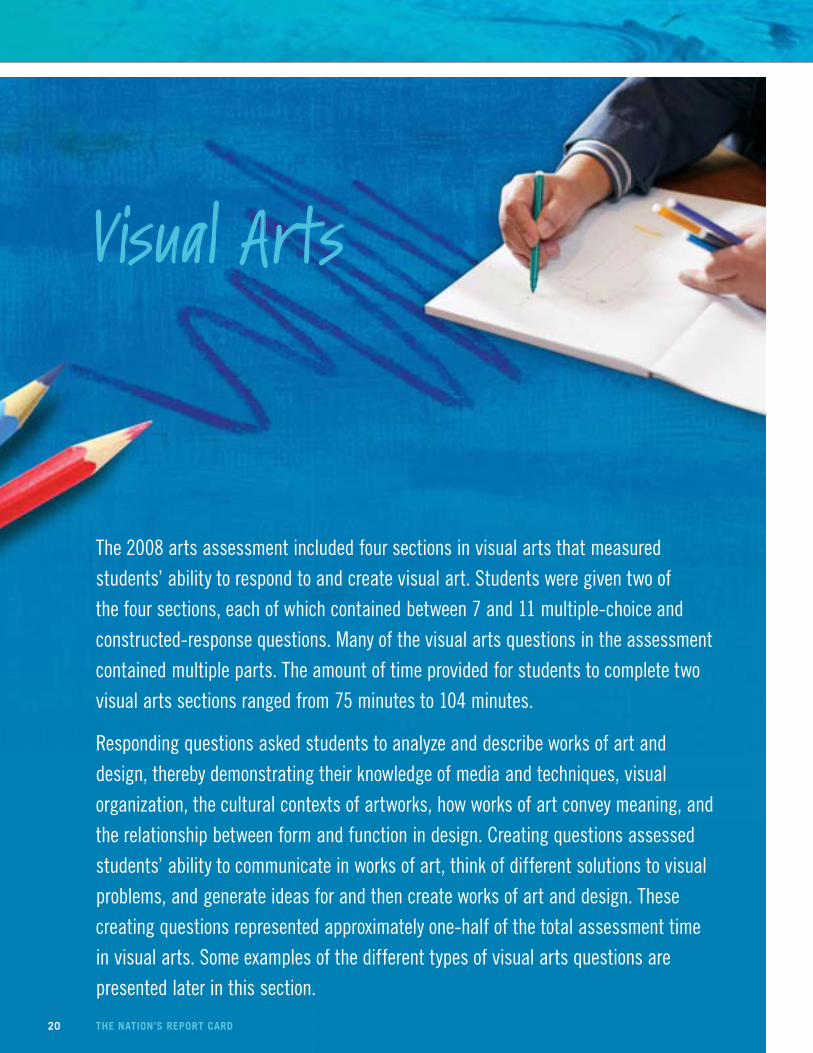
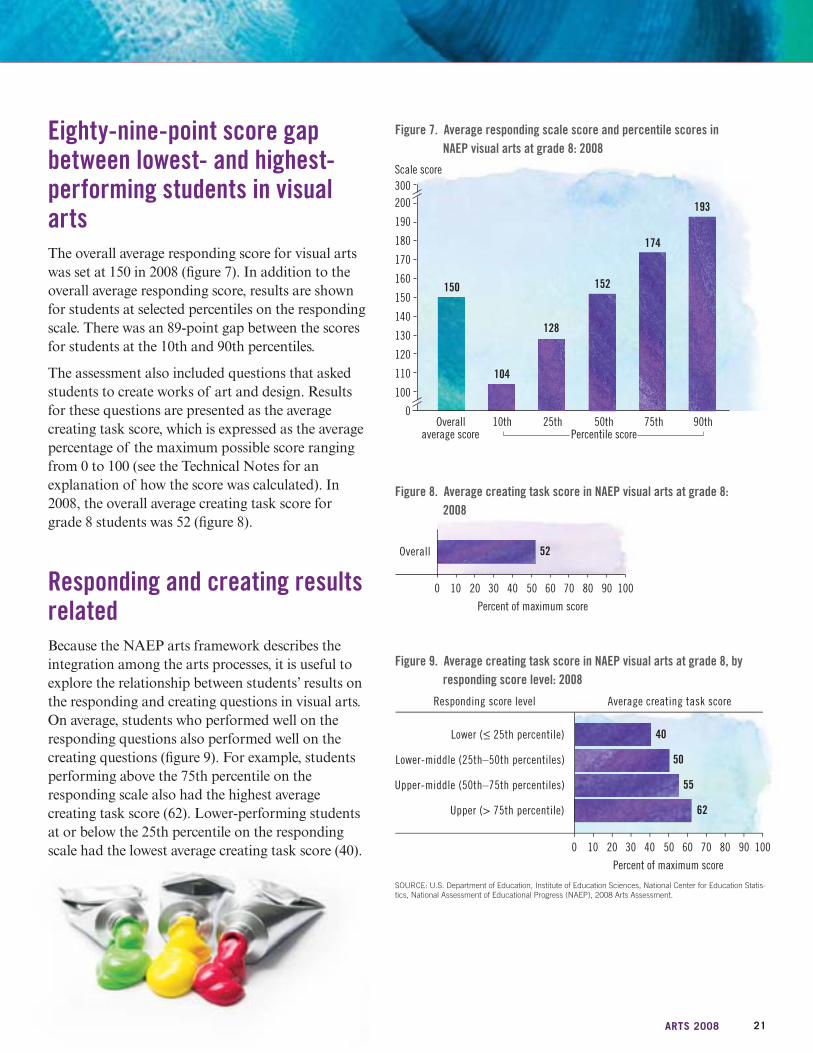
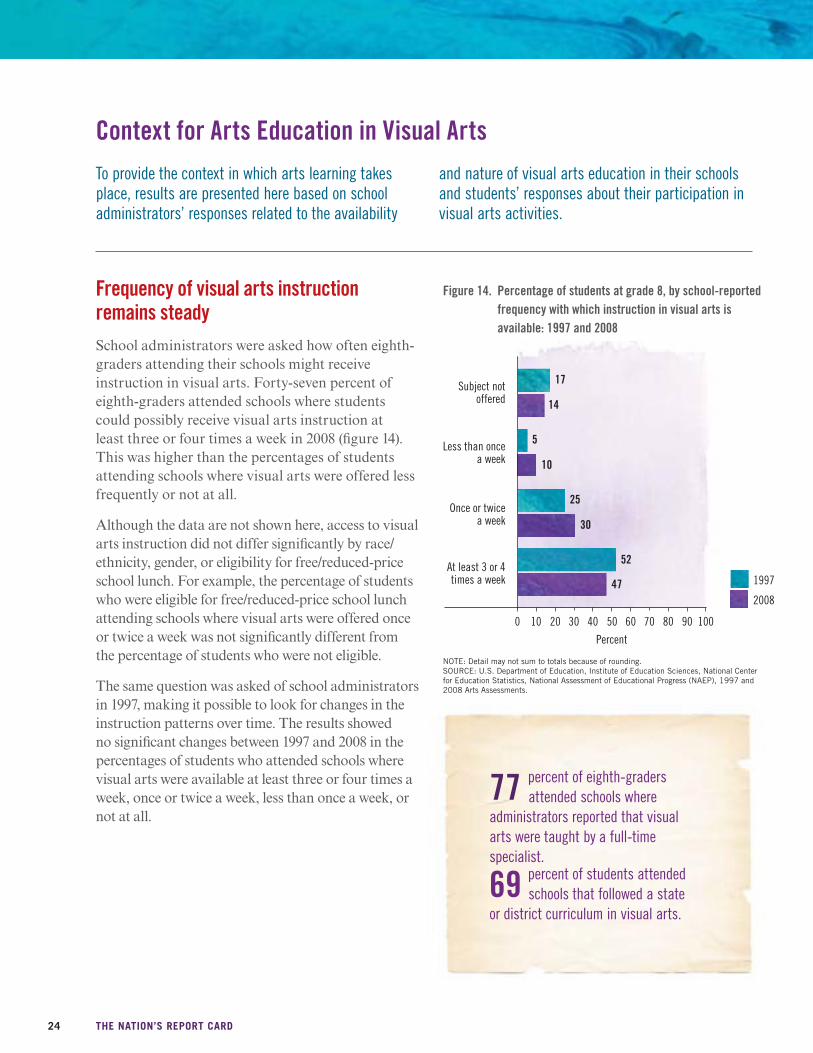
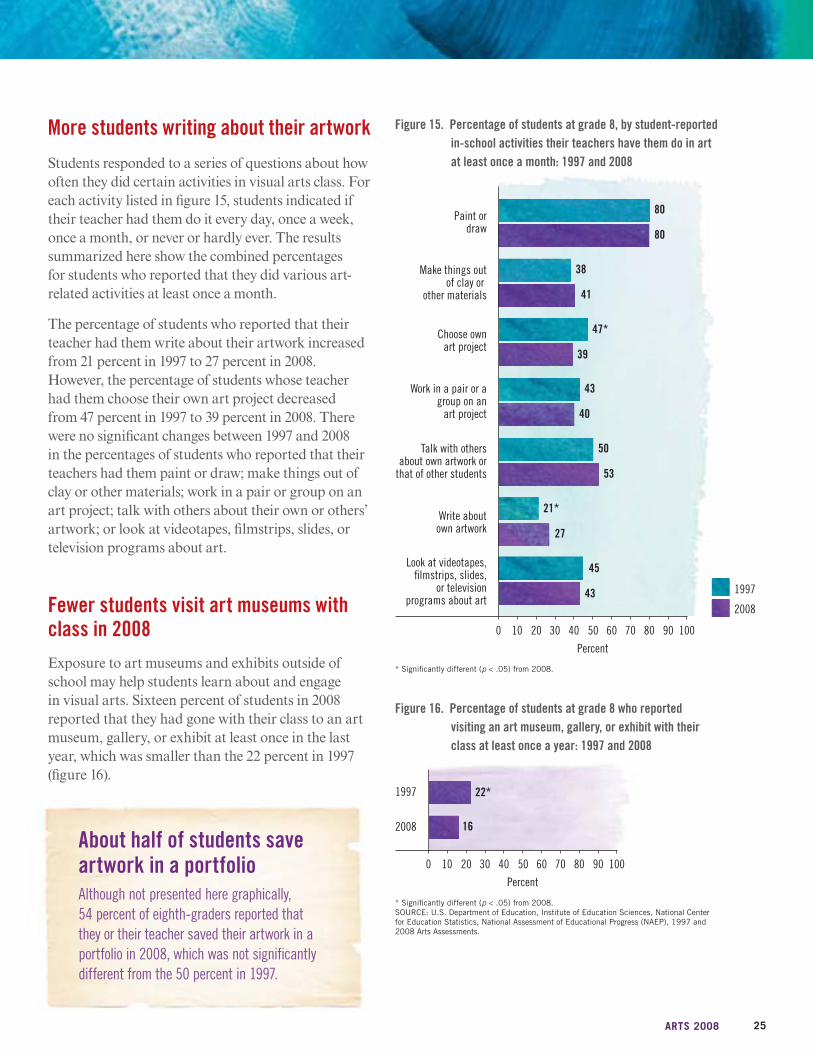
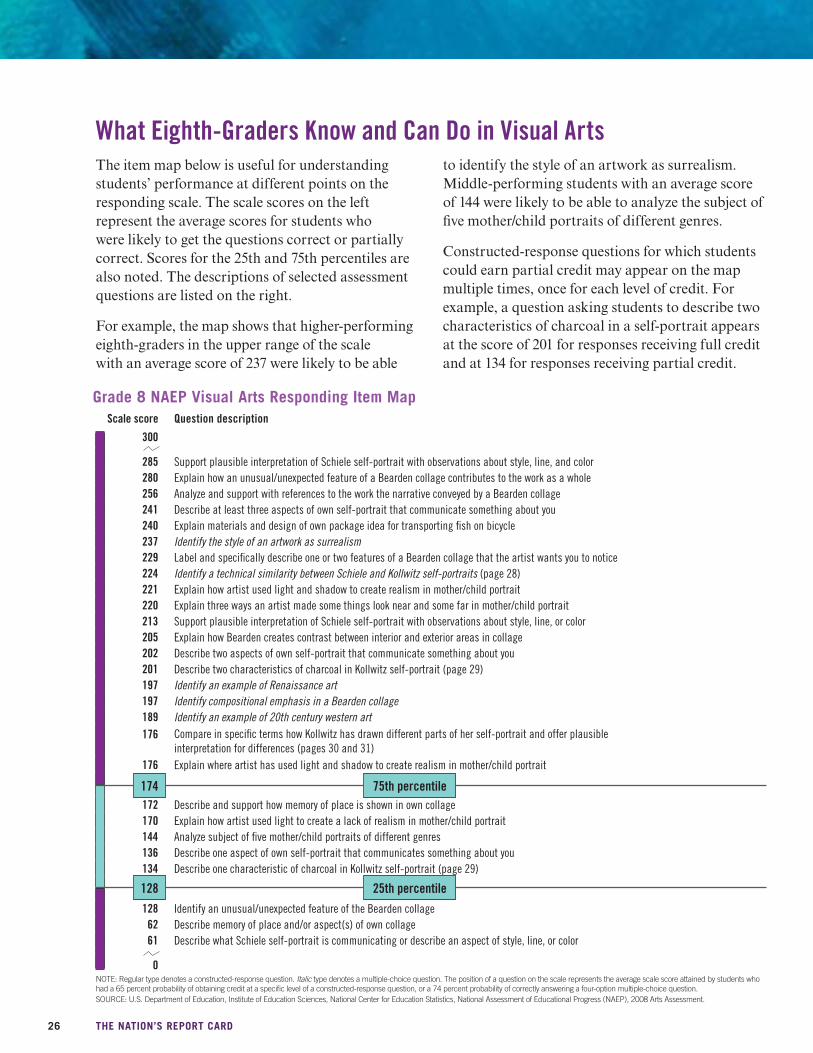
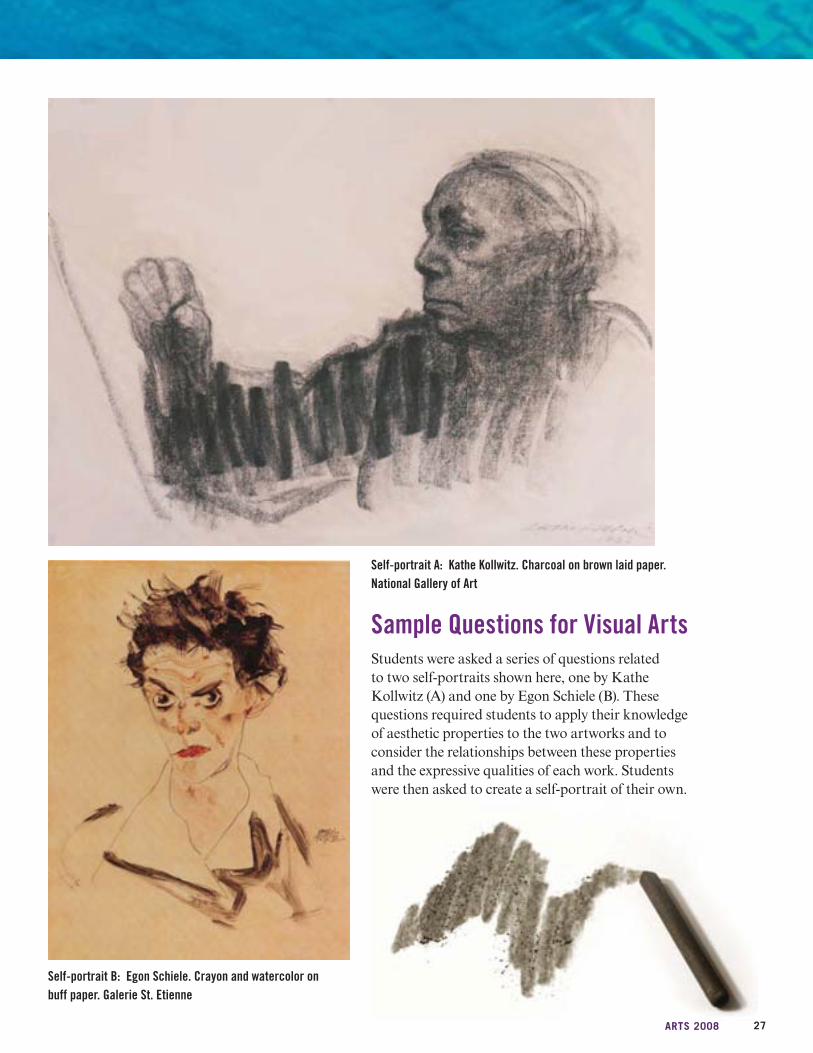

B
SAMPLE QUESTION Recognizing a Technical Similarity Between Two Self-Portraits
The sample question below asked students to recognize a technical similarity between the Kollwitz and Schiele self-portraits In both works
In 2008 thirty-seven percent of students correctly identified this common feature of the two artworks (choice B) This was not found to be significantly
expressive loose lines are combined with precise different from the 36 percent who answered drawing correctly in 1997 Choices A C and D do not
accurately describe technical similarities between the two works
Which statement describes a technical similarity between self-portraits A and B
The figure in each work is seen from the same point of view
Both works combine loose gestural lines with careful drawing
The compositions in both works are symmetrical
Both works rely on light and shadow to emphasize depth
A
C
D
BBBBBBBBBBBBBBBBBBBBBBBB
Choice A Choice B Choice C Choice D Omitted
8 37 8 46
Percentage of students in each response category at grade 8 2008
Rounds to zero NOTE Detail may not sum to totals because of rounding SOURCE US Department of Education Institute of Education Sciences National Center for Education Statistics National Assessment of Educational Progress (NAEP) 2008 Arts Assessshyment
28 THE NATIONrsquoS REPORT CARD
SAMPLE QUESTION Characteristics of Charcoal The sample question below asked students to Unacceptable Examples of Acceptable and Partial describe characteristics of the medium of charcoal responses are shown here Responses rated as visible in the Kollwitz self-portrait Student Unacceptable did not describe characteristics of the responses for this question were rated using medium of charcoal evident in the self-portrait three scoring levels Acceptable Partial and
This sample response was rated ldquoAcceptablerdquo because it demonstrated the studentrsquos knowledge of charcoal as a medium The student expressed what Kollwitz was able to accomplish with charcoal in her self-portrait Thirty-four percent of eighth-graders received a rating of ldquoAcceptablerdquo on this question
Self-portrait A is a charcoal drawing Describe two characteristics of charcoal that you see in self-portrait A
1
2
Acceptable Partial Unacceptable Omitted
34 38 27 1 NOTE Detail may not sum to totals because the percentage of responses rated as ldquoOff-taskrdquo is not shown Off-task responses are those that do not provide any information related to the assessment task SOURCE US Department of Education Institute of Education Sciences National Center for Education Statistics National Assessment of Educational Progress (NAEP) 2008 Arts Assessshyment
Percentage of students in each response category at grade 8 2008
This sample response was rated ldquoPartialrdquo because it provided only one example of how charcoal was used in the self-portrait The student recognized that pressing harder on charcoal results in a darker mark as is evident in the Kollwitz self-portrait However the second part of the response did not describe another characteristic of charcoal as a medium Thirty-eight percent of studentsrsquo responses to this question were rated ldquoPartialrdquo
Self-portrait A is a charcoal drawing Describe two characteristics of charcoal that you see in self-portrait A
1
2
29ARTS 2008
a s
SAMPLE QUESTION Relationship Between Technical Approach and Meaning
Both parts of this sample response were rated ldquoAcceptablerdquo This response accurately described the differences between the parts of the drawing and then used thesss eeee oooo bbbbsssseeeeerrrr vvvvvaaaattttiiiiii oooooo nnnnnnnsssssss tttttt ooooooo ooooooooffffffffffffffffeeeeeeeerrrrrr aaaaaaaannnnnnnn iiiiiiiinnnnnnnnssssssssiiiiiiiigggggggghhhhhhhhttttttttffffffffuuuuuuuullllllll andddd pllausible interpretation of the reasons for those differences
Fifty-three percent of students received a rating of ldquoAcceptablerdquo for part A and 19 percent received an ldquoAcceptablerdquo rating for part B Students who received the ldquoAcceptablerdquo rating were able to both comprehend
pthe formal characteristics of the self-portrait and discuss the relationship between those characteristics and the artistrsquos possible expressive goals
Look at self-portrait A Compare how Kollwitz has drawn her head and hand with the way she has drawn her arm Be specific
A
Explain what you think Kollwitz may have been trying to communicate about herself by drawing these different parts of her self-portrait in different ways
B
THE NATIONrsquoS REPORT CARD
The two-part sample question below required students to analyze and interpret the Kollwitz self-portrait to explore relationships between technical approach and meaning Part A of the question asked students about the workrsquos formal characteristics while part B asked them to connect those characteristics with what the artist was attempting to communicate Student responses
to each of the two parts were rated separately using three scoring levels Acceptable Partial and Unacceptable Examples of Acceptable and Partial student responses for each part of this question are shown here Unacceptable responses for the question neither addressed differences in the way the parts of the self-portrait are drawn nor offered interpretations linked to observations
30
Both parts of this sample response received a ldquoPartialrdquo rating This response accurately described the way the arm is drawn but did not specifi cally address the ways in which the head and hand are drawn differently from the arm ldquoPartialrdquo credit was given for recognizing some characteristics of the artwork While a few plausible interpretations about what Kollwitz was trying to communicate are provided in the second part of the response none of these is clearly linked to the descriptions offered in the fi rst part
Look at self-portrait A Compare how Kollwitz has drawn her head and hand with the way she has drawn her arm Be specifi c
A
Explain what you think Kollwitz may have been trying to communicate about herself by drawing these different parts of her self-portrait in different ways
Fifteen percent of the student responses were rated B ldquoPartialrdquo for part A and 52 percent were rated ldquoPartialrdquo for part B
Percentage of students in each response category at grade 8 2008
Part A Part B
Acceptable Partial Unacceptable Omitted
53 15 31 2
Acceptable Partial Unacceptable Omitted
19 52 25 3
NOTE Detail may not sum to totals because the percentage of responses rated as ldquoOff-taskrdquo is not shown Off-task responses are those that do not provide any information related to the assessment task SOURCE US Department of Education Institute of Education Sciences National Center for Education Statistics National Assessment of Educational Progress (NAEP) 2008 Arts Assessment
31ARTS 2008
t t t t
a t
t t
s c
t
ldquoldquo
SAMPLE QUESTION Creating a Self-Portrait After students had observed the Kollwitz and Schiele self-portraits and studied relationships between the technical and expressive qualities of the two artworks they were asked to create a self-portrait of their own Students were given a set of
a mirror and a sheet of 12-inch by 18-inch white drawing paper and were asked to use these tools to create a self-portrait that would express something important about their personalities These self-portraits were rated using four scoring levels
12 Cray-pas (colored oil pastels) a charcoal pencil Sufficient Uneven Minimal and Insufficient
ChChCharararracacacteteteririristststicicic ooofff wowoworkrkksss rararateteteddd ldquoSldquoSSufufu ficficccieieientntntrdquordquordquo bbbototothhh ofoffo ttt hehehe stststudududu enenenen tststsrsquorsquorsquo rererere spspspoononon seseesessss prprpp essesenenene teteteddd heheherererr sssshohohowewew ddd clclc eaeaeae rr ananandddd spspspp ecifiifififi cccc obobobseseservrvrvatatatioioionsnsns ttthahahaa tt cococommmmmm unununiciccatatatededed sssomomommetetethihihi ngngg immmm poop rtrtrtananan ttt ababbouououo ttt ththth eeee ararartitit stststs ThThThTh eyeyy iiincncncn ororo popoorararaa teteteedddd ididdeenentititit fyfyfyininingg dedede tata ilii iinn tetett rmrmrm ss ofofoff pppererrersososos nananana ll fefefeeatata ururu eses aandndd ininn sstutuudededentntt rerere spsppppononon seseee 11 ananann aaa ctctivivi itiityyy (a(a(artrtt mmm akaka inining)g)g) ThThheee seses lflfflflf -p-p-pororortrtrtrt aiaiaitststss shshshowowowow edeeded pppururu popoposeses efufuffu lll usussu eee ofofof cccommompopoosisis tititt ononon alal eeelelemememme ntntntsss anann ddddd sososososso phphphphphp isssisstitttiticacacacateteteedddd usussuseee ofofof mmm atataterereriaiaiaalssl FoFoFo rr exexexe amamamm plplplpleee iinnn ststststudududeneneenttt rerereespspspp onononnsesese 111 hthththh eee smsmms udududu gigigigg ngngngn g ooofff CrCrCrCr ayayayy-p-p-pasasas cccrerereatatatatededed anananan aaaaffiffiffiffininininitytyty aaamomomoo ngngng tttt hehehehee hhhheaeaeaaee ddddd aaa rmrmrm ananana ddd hahahandndnddn ananana ddd lolooolo oosoososeee wewewewe lllll-p-p-p-pp lalalaacececece dddd lililiinenenenesssss adadadadd dedededdeddddd dededed fifinfinnfinitititioioionnn tototoo ttthehehee bbbb ododododo yyy
Percentage of students in each response category at grade 8 2008
BoBoBoBBothththth wwworororoorksksksk aaaaalslslslsooo shshhs howwowowedeede vvvererere yyyyy gogogoododod uuu sesese ooofff prprpropopo ororortititionnno n cocococoo lololorrr aaaaandndnd lll inininn eeee aaandndndd wwwererer eee fuufullllllyyy dededevevev lololopepep dd anananndd nininindididid vivividududualalalizizizizi ededededded FoFoFoF rrr exexexxamamamamplpleee iiinnn stststududdenene n ttt rerere spspps onononn seseee 222222 thhhhhhthhththhhhth e stststs udududd enenenntt skskkk liliii lfflflflf ululullylyly uuuseseseseedddd cocococo lolorrr tototo eempmpmmp hahhah sisisizezez aaa ndndndndn cccrerere atatat eeeeeee cococo ntntnttrarraaststs bbbetetetwewewewe eenenn sssspepepppecicicificficficfic pppp araara tstst s ooff heherrr seseselflfl -p-pp ororor trtrtraiaiaittt BoBoBoBothththh sss tututudededed nntntn rrresesespopoo nsnsnsn eses 11 aaandndndnd 222 aalslslsooo shsshshowowededed eeevivivvvidededeencnccccncncncccc e ofoffof ttttheheehh sss tututudededed ntntntntsss hahahah vivivingngng ssspepeepentntntnt tttimimimeee obobob seseservrvinini gggg thththeee KoKoKolllll wwiwwww tz anana ddd ScScScSchihihielele ee seses lflflf-p-p-porororortrtrrtrraiaiaitststs FoFoFoFooururr pppererercececentntnt ooo fff stststudududenenntstststsrsquorsquorsquorsquo sssesss lfshypopopoortrtrt rararaaitititsss wewewererere rrratatatededed ldquoldquoSuSuSuu ffiffifficicciennee ttrdquordquordquo
1
2
Sufficient Uneven Minimal Insufficient Omitted
4 25 57 14 Rounds to zero NOTE Detail may not sum to totals because the percentage of responses rated as ldquoOff-taskrdquo is not shown Off-task responses are those that do not provide any information related to the assessment task SOURCE US Department of Education Institute of Education Sciences National Center for Education Statistics National Assessment of Educational Progress (NAEP) 2008 Arts Assessshyment
32 THE NATIONrsquoS REPORT CARD
Works at the ldquoUnevenrdquo level made some specific observations They sometimes employed pertinent compositional elements gave attention to details such as facial features to convey expression andor effectively used materials to communicate However ldquoUnevenrdquo works were typically inconsistent or incomplete in parts
In the sample presented here the student gave her work individuality by vivid use of color facial expression and the symbols incorporated in her jewelry and the background However elements of her work seem inconsistent and lacking in deliberation such as the placement and rendering of the symbols and colors in the background Twenty-five percent of studentsrsquo self-portraits were rated ldquoUnevenrdquo
As with many works rated at the ldquoMinimalrdquo level in the sample self-portrait shown here efforts at specific observations were apparent but relatively minimal (the red lines in the eyes) Compositional successes may seem more accidental than deliberate and use of materials was unskilled For example while this student may have been attempting to convey some sense of an individual person by emphasizing only his eyes and mouth with color he lacked the skill to make this choice distinctive enough to convey his message Fifty-seven percent of studentsrsquo self-portraits were rated ldquoMinimalrdquo
Most self-portraits rated ldquoInsufficientrdquo were generally so schematic as to convey little or nothing about the student Like the sample self-portrait shown here they showed unspecific observation little awareness of composition and highly unskilled use of materials In contrast to the ldquoMinimalrdquo response there were no features in this self-portrait that conveyed anything specific about a person and it remained at a general level Fourteen percent of studentsrsquo self-portraits were rated ldquoInsufficientrdquo
33ARTS 2008
Sampling and Weighting The schools and students who participate in NAEP assessments are selected to form a representative sample of the nation The national sample of eighth-graders in the 2008 arts assessment was chosen using a multistage design that involved drawing students from the sampled public and private schools across the country The results from the assessed students were combined to provide accurate estimates of the overall performance of students in the nation
Each school that participated in the assessment and each student assessed represents a portion of the population of interest Results are weighted to make appropriate inferences between the student samples and the respective populations from which they are drawn Sampling weights are adjusted for the disproportionate representation of some groups in the selected sample This includes the oversampling of schools with high concentrations of students from certain racialethnic groups and the lower sampling rates of students who attend very small schools
School and Student Participation Rates The school and student participation rates for public and private schools in the 2008 arts assessment are provided in table A-1
NCES statistical standards require that a nonresponse bias analysis be conducted for any school or student group with a participation rate that falls below 85 percent The participation rates for the 2008 NAEP arts assessment indicated a need for a school nonresponse bias analysis for the private school sample The results showed that school substitution and nonresponse adjustments were not effective in reducing nonresponse bias for the percentage of Hispanic students enrolled and type of private schools (Catholic and other private schools) The disproportionate nonresponse resulted
in an overestimation of the percentage of Hispanic students an overestimation of the percentage of Catholic school students and an underestimation of the percentage of other private school students
Table A-1 School and student participation rates in NAEP arts at grade 8 by subject and type of school 2008
Subject and type of school
Music
Nation
Public
Private
Visual arts
Nation
Public
Private
School participation Student participation
Number of Number of schools Weighted students Weighted
participating percent assessed percent
260 97 4000 93
220 99 3400 93
30 76 500 97
260 97 3900 92
220 99 3400 92
30 76 500 94
NOTE The numbers of schools are rounded to the nearest ten and the numbers of students are rounded to the nearest hundred Detail may not sum to totals because of rounding SOURCE US Department of Education Institute of Education Sciences National Center for Education Statistics National Assessment of Educational Progress (NAEP) 2008 Arts Assessment
Interpreting Statistical Signifi cance Comparisons over time or between groups in this report are based on statistical significance at the 05 level using t-tests with appropriate adjustments for multiple comparisons (using the False Discovery Rate procedure) These statistical tests consider both the size of the differences and standard errors of the two statistics being compared Standard errors are margins of error and estimates based on smaller groups are likely to have larger margins of error relative to estimates based on larger groups Note for example that differences based on schoolshyadministrator-reported estimates have smaller sample sizes than differences based on student-reported estimates resulting in smaller signifi cant differences in the student-reported data than in the
THE NATIONrsquoS REPORT CARD 34
school-administrator-reported data The size of the standard errors may also be influenced by other factors such as how representative the students assessed are of the entire population
When an estimate has a large standard error a numerical difference that seems large may not be statistically significant Differences of the same magnitude may or may not be statistically significant depending upon the size of the standard errors of the estimates For example a 10-point difference between male and female students may be statistically significant while a 10-point difference between students attending public and private schools may not be Standard errors for the estimates presented in this report are available at httpncesedgovnationsreportcardnaepdata and on the 2008 arts results website at http nationsreportcardgovarts_2008
National School Lunch Program NAEP collects data on student eligibility for the National School Lunch Program (NSLP) as an indicator of poverty Under the guidelines of NSLP children from families with incomes below 130 percent of the poverty level are eligible for free meals Those from families with incomes between 130 and 185 percent of the poverty level are eligible for reduced-price meals (For the period July 1 2007 through June 30 2008 for a family of four 130 percent of the poverty level was an annual income of $27000 and 185 percent was $38000) For more information on NSLP visit httpwww fnsusdagovcndlunch
School Location Results of the 2008 NAEP arts assessment were reported for four mutually exclusive categories of school location These categories are based on standard definitions established by the Federal Office of Management and Budget using population and geographic information from the US Census Bureau The classification system is referred to as ldquourban-centric locale codesrdquo which classifies territory into four major types
city suburb town and rural More details on the classification system can be found at httpnces edgovccdrural_localesasp
The Creating Task Score Studentsrsquo performance on questions assessing the creating process in visual arts is presented as the average creating task score in this report The creating task score for each creating question (task) is the sum of the percentage of students receiving full credit and a fraction of the percentage of students receiving partial credit The individual scores are then averaged together to report an average creating task score for the entire set of the visual arts creating questions
An example of computing the creating task score is provided below for a sample question in this report that asks eighth-graders to draw a self-portrait Responses to this question were scored ldquoSufficientrdquo ldquoUnevenrdquo ldquoMinimalrdquo or ldquoInsufficientrdquo The percentages of students falling into these four scoring levels are 4 percent 25 percent 57 percent and 14 percent respectively (table A-2) Responses at these four levels receive
1score weights of 1 23 and 0 respectively The
3creating task score for this question is computed as 1 (4) + 2 (25) + 1 (57) + 0 (14) = 403 3
Table A-2 Example showing how the creating task score was computed for a sample question in NAEP visual arts at grade 8 2008
Percentage Percentage of of students times
Scoring level students Score weight score weight
Sufficient 4 1 4
Uneven 25 2 3 17
Minimal 57 1 3 19
Insufficient 14 0 0
Creating task score (4 + 17 + 19 + 0) = 40
SOURCE US Department of Education Institute of Education Sciences National Center for Education Statistics National Assessment of Educational Progress (NAEP) 2008 Arts Assessment
ARTS 2008 3535
Comparing Results Between the 1997 and 2008 Assessments Although the assessment questions adminshyistered in 2008 were selected from those used in the 1997 assessment due to changes in scoring procedures and materials the 2008 score results in music and visual arts could not be directly compared to the results in 1997
In the 2008 arts assessment the scoring guides for constructed-response questions the sample questions and student responses used to train scorers and the standardized training procedures were updated to refl ect changes in training and scoring procedures that have been adapted for use across all NAEP assessments since 1997 In addition because the student artwork used as training samples for visual arts in 1997 had degraded over time and because of differences in the availability of certain types of art supplies and tools between 1997 and 2008 new samples were developed for scoring studentsrsquo responses to the creating questions in 2008
However since the scoring method for multiple-choice questions was the same in 1997 and 2008 direct comparisons could be made between the two years on results for these questions in music and visual arts (tables A-3 and A-4) Because multiple-choice questions were only a portion of the assessment and only assessed certain types of topics in the responding process of music and visual arts the changes in studentsrsquo performance between 1997 and 2008 on these questions did not represent the performance changes for the constructed-response questions or the entire assessment
Table A-3 Percentage correct for multiple-choice questions in NAEP music at grade 8 1997 and 2008
Percent correct
Question description 1997 2008
Overall 53 51
Identify directional contour of part of melodic phrase 79 77
Identify form of vocal music in a recording (musical excerpt 1) 78 76
Identify the type of instrumental ensemble performing an excerpt 75 71
Identify form of musical examples as theme and variations 64 64
Identify a bass clef symbol 63 62
Identify pitch contour of melody in a recording 63 56
Identify saxophone as instrument playing melody 66 56
Identify a half note in printed music 52 56
Identify a correct time signature for a piece of printed music 55 52
Select a line drawing refl ective of the texture of an example of music 52 52
Identify the solo instrument beginning ldquoRhapsody in Bluerdquo 52 50
Identify form of vocal music in a recording (musical excerpt 2) 60 49
Identify an appropriate texture drawing for a homophonic excerpt 51 48
Identify term best describing the texture 47 47
Identify an appropriate description of the texture of a recorded excerpt 50 44
Identify correct time signature for recorded excerpt 42 43
Identify the name of a pitch shown in the treble clef 42 41
Identify an octave interval in a printed score 37 38
Identify the term for fermata symbol 38 33
Identify which voices enter fi rst in a choral excerpt 32 28
Identify the quality of a triad in a printed score 15 21 Significantly different (p lt 05) from 2008 SOURCE US Department of Education Institute of Education Sciences National Center for Education Statistics National Assessment of Educational Progress (NAEP) 1997 and 2008 Arts Assessments
Table A-4 Percentage correct for multiple-choice questions in NAEP visual arts at grade 8 1997 and 2008
Percent correct
Question description 1997 2008
Overall 42 42
Identify purpose of insulating package material 61 62
Identify an example of 20th-century western art 55 59
Infer from photograph advantages of shrink-wrap packaging 57 57
Identify an example of a Renaissance painting 48 50
Identify compositional emphasis in a Bearden collage 49 46
Identify genre of a Bearden collage 34 37
Identify a technical similarity between Schiele and Kollwitz self-portraits 36 37
Identify an important compositional aspect of a Kollwitz self-portrait 40 37
Identify a stylistic emphasis in a Bearden collage 29 35
Identify a compositional feature of a medieval artwork 39 32
Identify the style of an artwork as surrealism 27 31
Identify an artistic style that infl uenced cubism 25 23 Significantly different (p lt 05) from 2008 SOURCE US Department of Education Institute of Education Sciences National Center for Education Statistics National Assessment of Educational Progress (NAEP) 1997 and 2008 Arts Assessments
THE NATIONrsquoS REPORT CARD 36
Table A-5 Percentage of students in NAEP arts assessment at grade 8 by selected student and school characteristics 2008
Student characteristics Music Visual arts
SD andor ELL
Identified 17 17
Excluded 2 2
Assessed 15 16
Without accommodations 6 6
With accommodations 8 10
SD
Identified 12 12
Excluded 1 2
Assessed 10 11
Without accommodations 3 2
With accommodations 7 8
ELL
Identified 6 6
Excluded 1 1
Assessed 5 6
Without accommodations 4 4
With accommodations 2 2 NOTE Students identified as both SD and ELL were counted only once under the combined SD andor ELL category but were counted separately under the SD and ELL categories Detail may not sum to totals because of rounding SOURCE US Department of Education Institute of Education Sciences National Center for Education Statistics National Assessment of Educational Progress (NAEP) 2008 Arts Assessment
Table A-6 Percentage of students with disabilities (SD) andor English language learners (ELL) identified excluded and assessed in NAEP music and visual arts at grade 8 as a percentage of all students 2008
NOTE Black includes African American Hispanic includes Latino and Pacific Islander includes Native Hawaiian Race categories exclude Hispanic origin Detail may not sum to totals because of rounding SOURCE US Department of Education Institute of Education Sciences National Center for Education Statistics National Assessment of Educational Progress (NAEP) 2008 Arts Assessment
Student and school characteristics Music Visual arts
Raceethnicity
White 61 61
Black 15 14
Hispanic 18 17
AsianPacific Islander 5 5
American IndianAlaska Native 1 2
Unclassified 1 1
Gender
Male 50 51
Female 50 49
Eligibility for freereduced-price school lunch
Eligible 36 37
Not eligible 57 56
Information not available 7 8
Type of school
Public 93 92
Private 7 8
School location
City 29 29
Suburb 37 36
Town 12 13
Rural 22 22
37ARTS 2008 37
u S d e p A r t M e n t o f e d u C A t i o n The National Assessment of Educational Progress (NAEP) is a congressionally authorized project sponsored by the US Department of Education The National Center for Education Statistics a department within the Institute of Education Sciences administers NAEP The Commissioner of Education Statistics is responsible by law for carrying out the NAEP project Arne Duncan John Easton Stuart Kerachsky Secretary Director Acting Commissioner US Department Institute of National Center for of Education Education Sciences Education Statistics
t h e n A t i o n A l A S S e S S M e n t g o V e r n i n g b o A r d In 1988 Congress created the National Assessment Governing Board to set policy for the National Assessment of Educational Progress commonly known as The Nations Report Card TM The Governing Board is an independent bipartisan group whose members include governors state legislators local and state school officials educators business representatives and members of the general public
Darvin M Winick Chair President Winick amp Associates Austin Texas
Amanda P Avallone Vice Chair Assistant Principal and Eighth-Grade Teacher
Summit Middle School Boulder Colorado
David J Alukonis Former Chairman Hudson School Board Hudson New Hampshire
Gregory Cizek Professor of Educational Measurement
University of North Carolina Chapel Hill North Carolina
Carol A DrsquoAmico President and Chief Executive Officer
Conexus Indiana Indianapolis Indiana
Honorable David P Driscoll Former Commissioner of Education
Massachusetts Department of Education
Malden Massachusetts
Louis M Fabrizio Director of Accountability Policy and Communications
North Carolina Department of Public Instruction
Raleigh North Carolina
Honorable Anitere Flores Member Florida House of Representatives Miami Florida
Alan J Friedman Consultant Museum Development and Science Communication
New York New York
David W Gordon County Superintendent of Schools Sacramento County Office of Education
Sacramento California
Robin C Hall Principal Beecher Hills Elementary School Atlanta Georgia
Kathi M King Twelfth-Grade Teacher Messalonskee High School Oakland Maine
Kim Kozbial-Hess Educational Technology Trainer Hawkins Elementary School Toledo Ohio
Henry Kranendonk Mathematics Curriculum Specialist Milwaukee Public Schools Milwaukee Wisconsin
James S Lanich President California Business for Education Excellence
Sacramento California
Honorable Cynthia L Nava Senator New Mexico State Senate Las Cruces New Mexico
Honorable Steven L Paine State Superintendent of Schools West Virginia Department of Education
Charleston West Virginia
Honorable Sonny Perdue Governor of Georgia Atlanta Georgia
Susan Pimentel Educational Consultant Hanover New Hampshire
Andrew C Porter Dean Graduate School of Education University of Pennsylvania Philadelphia Pennsylvania
Warren T Smith Sr Vice President Washington State Board of Education
Olympia Washington
Mary Frances Taymans SND Executive Director Secondary Schools Department National Catholic Educational Association
Washington DC
Oscar A Troncoso Principal Anthony High School Anthony Texas
Eileen L Weiser General Public Representative Ann Arbor Michigan
John Easton (Ex officio) Director Institute of Education Sciences US Department of Education Washington DC
Mary Crovo Interim Executive Director National Assessment Governing Board
Washington DC
t h e n a t i o n rsquo s r e p o r t c a r d
A r t s 2 0 0 8
M u s i c amp V i s u a l A r t s June 2009
M o r e i n f o r M A t i o n The report release site is httpnationsreportcardgov The NCES web electronic catalog is httpncesedgov pubsearch
For ordering information write to US Department of Education ED Pubs PO Box 1398 Jessup MD 20794-1398
or call toll free 1-877-4ED-Pubs
or order online at httpwwwedpubs org
S u g g e S t e d C i t A t i o n Keiper S Sandene BA Persky HR and Kuang M (2009) The Nationrsquos Report Card Arts 2008 Music amp Visual Arts (NCES 2009ndash488) National Center for Education Statistics Institute of Education Sciences US Department of Education Washington DC
C o n t A C t Emmanuel Sikali 202-502-7419 emmanuelsikaliedgov
ldquo t h e d e p A r t M e n t o f e d u C A t i o n rsquo S M i S S i o n i S t o p r o M o t e S t u d e n t A C h i e V e M e n t A n d p r e p A r A t i o n f o r g l o b A l C o M p e t i t i V e n e S S b y f o S t e r i n g e d u C A t i o n A l e x C e l l e n C e A n d e n S u r i n g e q u A l A C C e S S rdquo
wwwedgov
- Contents
- Executive Summary
- Introduction
- Music
-
- Eighty-nine-point score gap between lowest- and highest-performing students in music
- Racialethnic gender and socioeconomic gaps in music scores
- Music scores vary by type and location of schools
- Context for Arts Education in Music
- What Eighth-Graders Know and Can Do in Music
- Sample Questions for Music
-
- Visual Arts
-
- Eighty-nine-point score gap between lowest- and highest-performing students in visual arts
- Responding and creating results related
- Patterns in score gaps by student characteristics similar for responding to and creating visual arts
- No significant difference in responding scores between public and private school students
- Context for Arts Education in Visual Arts
- What Eighth-Graders Know and Can Do in Visual Arts
- Sample Questions for Visual Arts
-
- Technical Notes and Data Appendix13
- More Information
-
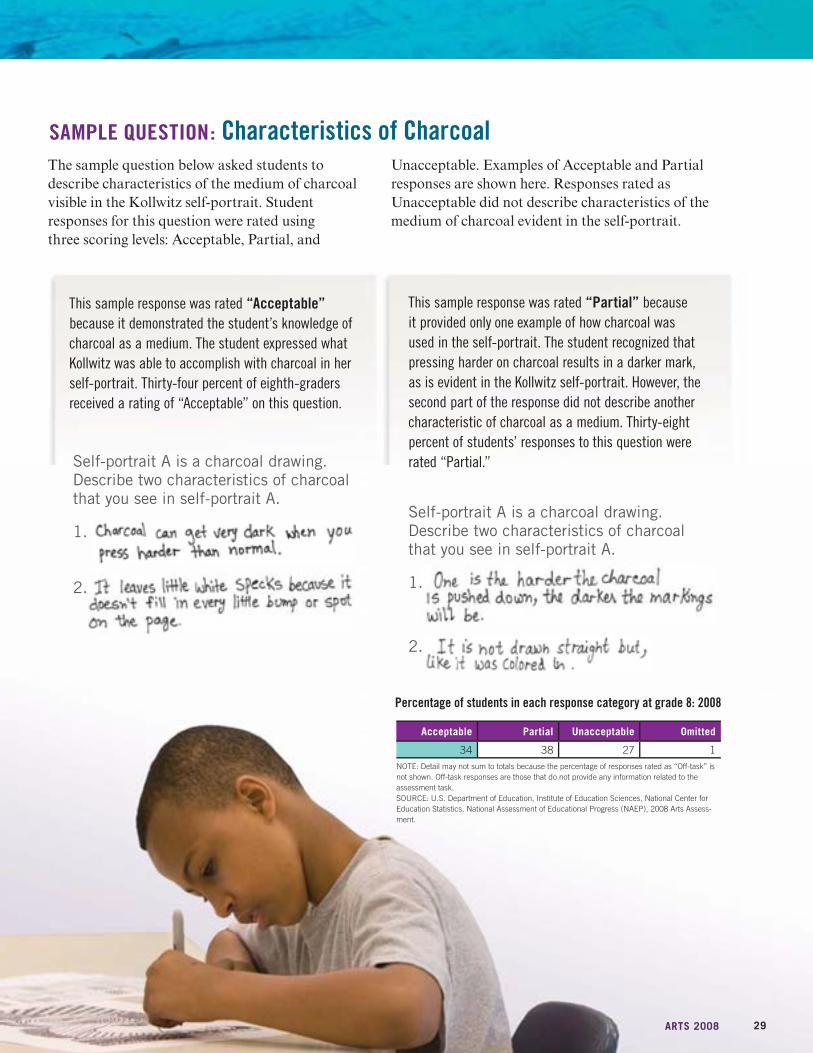
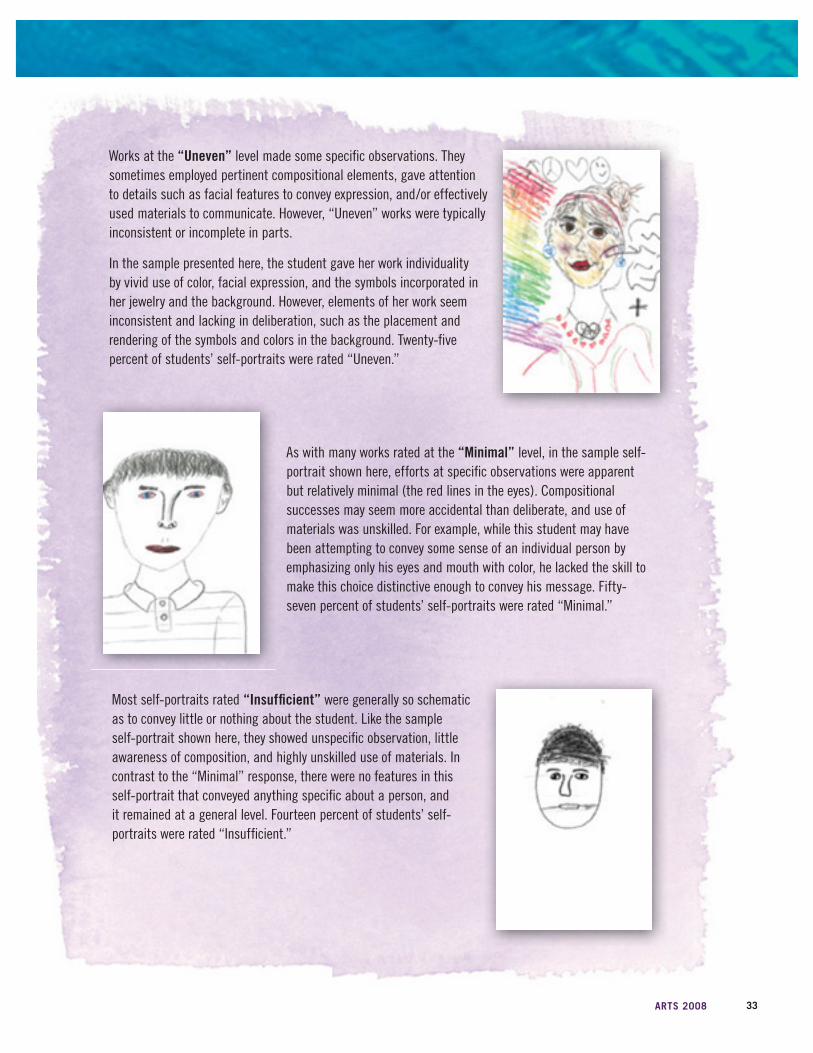
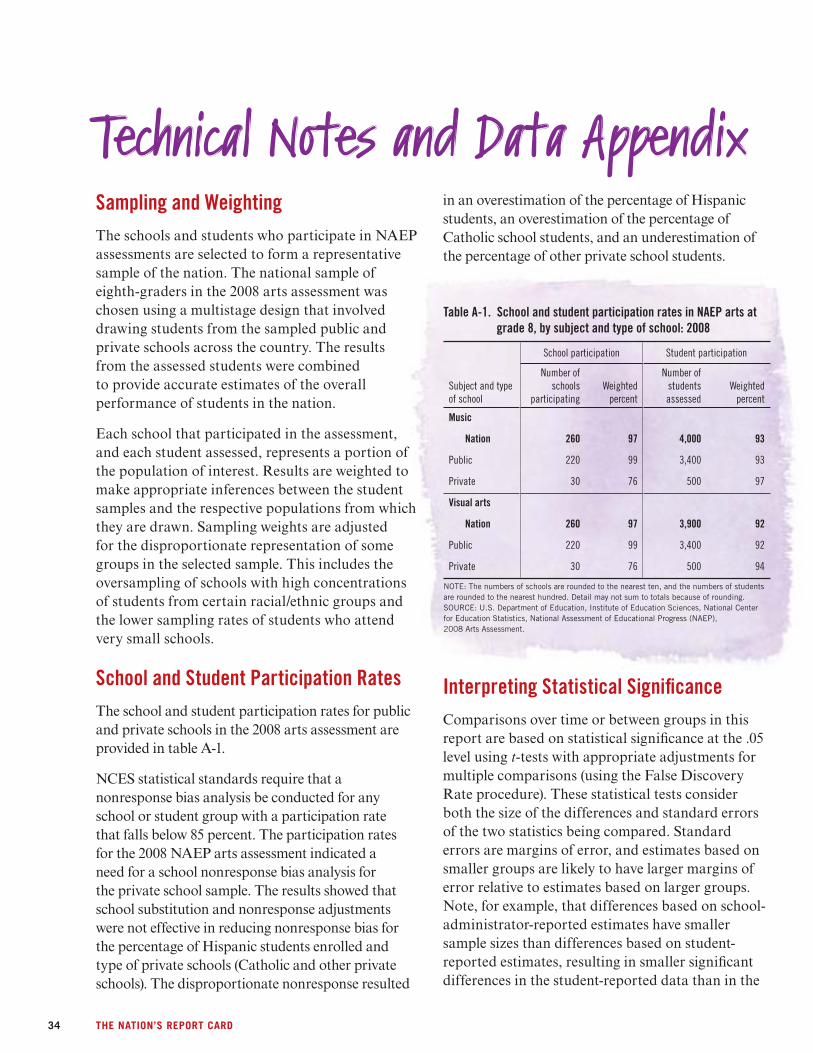
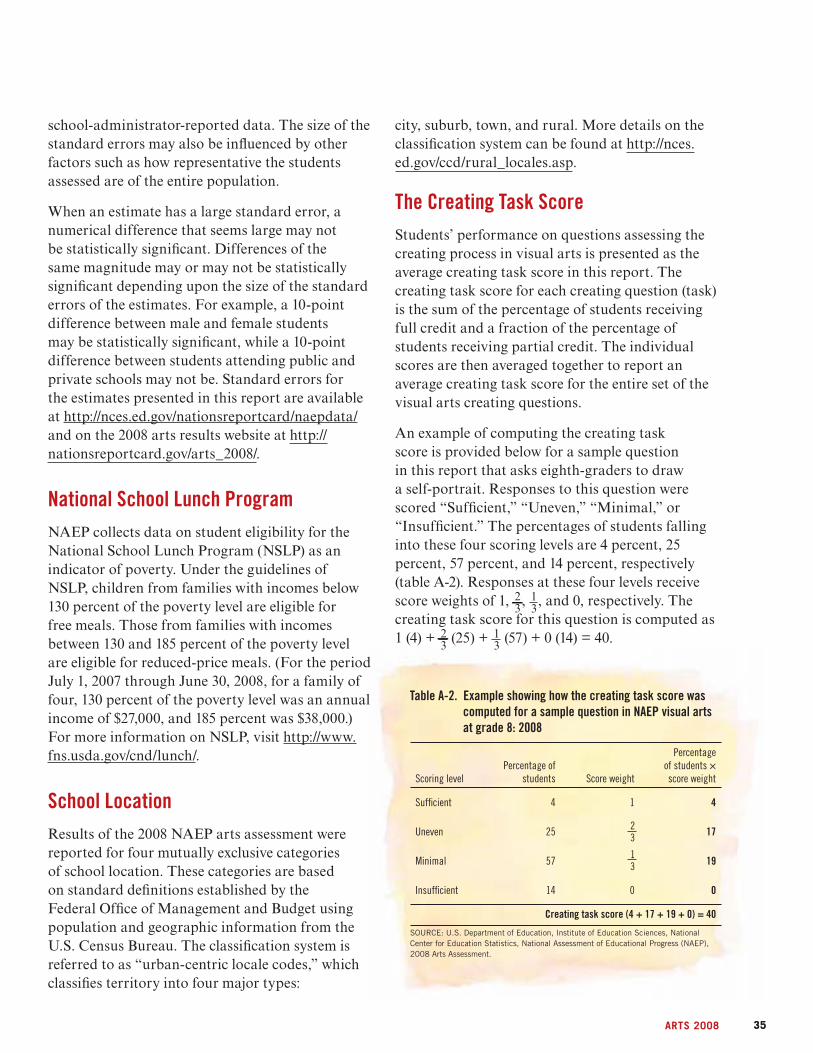
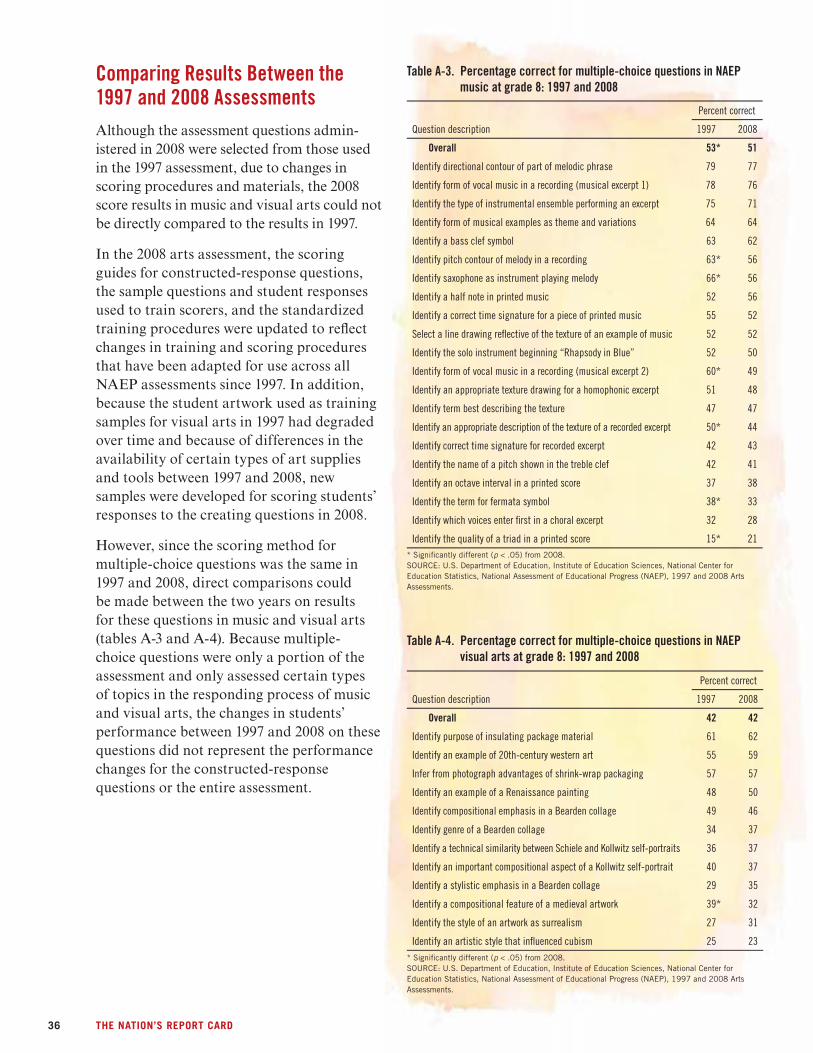