muthoot finance limited · 2018-05-18 · • neft/rtgs/imps mode of bank transfer • less cash...
TRANSCRIPT
Financial Results Q4 FY 2018
March 2018
MUTHOOT FINANCE LIMITED

SAFE HARBOUR STATEMENT
This presentation may include statements, which may constitute forward-looking statements. All statements that address
expectations or projections about the future, including, but not limited to, statements about the strategy for growth, business
development, market position, expenditures, and financial results, are forward looking statements. Forward-looking statements
are based on certain assumptions and expectations of future events. The company cannot guarantee that these assumptions
and expectations are accurate or will be realised. The actual results, performance or achievements, could thus differ materially
from those projected in any such forward-looking statements.
The company assumes no responsibility to publicly amend, modify or revise any forward-looking statements, on the basis of
any subsequent developments, information or events, or otherwise. While every effort is made to ensure that this presentation
conforms with all applicable legal requirements, the company does not warrant that it is complete, comprehensive or accurate,
or commit to its being updated. No part of the information provided herein is to be construed as a solicitation to make any
financial investment and is provided for information only.
Any person/ party intending to provide finance / invest in the shares/businesses of the Company shall do so after seeking their
own professional advice and after carrying out their own due diligence procedure to ensure that they are making an informed
decision. In no event shall the company be liable for any damages whatsoever, whether direct, incidental, indirect,
consequential or special damages of any kind or including, without limitation, those resulting from loss of profit, loss of
contracts, goodwill, data, information, income, expected savings or business relationships arising out of or in connection with
the use of this presentation.
1

2
FY 2018 FY 2017
YoY
Growth
(%)
Consolidated Loan Assets of the Group * 321,537 286,605 12
Contribution of Subsidiaries in the Consolidated
Gross Loan Assets of the Group* (%)10 5 -
CONSOLIDATED LOAN ASSETS *
Diversified Business of the Group * (` in million)
* Muthoot Finance Ltd and its subsidiaries.
FY 2018 FY 2017 YoY
Growth
(%)
Consolidated Profit of the Group* 17,841 11,998 49
Group* Branch Network4,596 4,488 2

Particulars FY 2018 FY 2017 FY 2018 FY 2017
Total Revenue 62,432 57,467 67,049 59,384
Employee Benefit Expenses 7,715 7,638 8,335 7,604
Finance Cost 19,399 22,938 21,333 23,688
Depreciation and Amortisation 439 483 500 519
Provisions and write offs 2,397 2,816 2,712 2,863
Other Expenditure 4,911 4,382 5,446 5,124
Total Expenses 34,861 38,257 38,326 39,798
Profit before tax 27,571 19,210 28,723 19,586
Tax expense (including
deferred tax)10,368 7,412 10,736 7,513
Profit for the period 17,203 11,798 17,987 12,073
Minority Interest - - 146 75
Net Profit after taxes and
Minority Interest17,203 11,798 17,841 11,998
3
STATEMENT OF FINANCIAL RESULTS (` in millions)
STANDALONE CONSOLIDATED

Particulars FY 2018 FY 2017 FY 2018 FY 2017
Share Capital 4,000 3,995 4,000 3,995
Reserves and Surplus 73,604 61,170 74,423 61,386
Minority Interest 1,061 719
Borrowings 186,994 169,861 201,505 176,110
Other Liabilities and Provisions 49,219 72,105 62,062 79,632
Total-Equities and Liabilities 313,817 307,131 343,051 321,842
Fixed Assets 2,062 2,182 2,378 2,462
Goodwill on Consolidation - - 482 212
Investments 3,838 2,091 1,656 965
Loans and Advances 293,082 274,242 313,656 287,950
Other Assets 9,967 13273 17,642 13,806
Cash and Bank Balances 4,868 15,343 7,237 16,447
Total- Assets 313,817 307,131 343,051 321,8424
STATEMENT OF ASSETS AND LIABILITIES (` in millions)
STANDALONE CONSOLIDATED

MUTHOOT FINANCE: DRIVING INCLUSIVE GROWTH
5
o India’s largest gold financing company (by loan portfolio)
o Trusted pan-India brand in the gold loans sector; revolutionised India’s gold banking
o Our intervention has empowered millions of people across the social pyramid
Gold Loans Money Transfer Services
White Label ATM
National Pension Scheme
CORE
SERVICE
OTHER
SERVICES
Collection Services
Wind Mill Power Generation
Multiple service offerings
Personal Loans

MFIN - A GLIMPSE
6
29States/Union territory presence
4,300+
Pan-India branches
23,000+
Team members
155 tonnesGold jewellery kept as security
150,000+
Retail investor base across debenture and
subordinated debt portfolio
130,000+
Customers served every day
`291,384 mnLoan Assets Under Management (As of March 31, 2018)

SHAREHOLDING PATTERN
7
NSE Ticker
MUTHOOTFIN
BSE Ticker
533398
Market Capitalisation (as on March 31, 2018)
` 162,997 million
Strong promoter interest in business with 74% stake
(%) Shareholding as on
March 31, 2018
73.78
23.113.11
Promoters & Relatives
FII, FC, MF & Others
Public
DIVIDEND PAYOUT
8
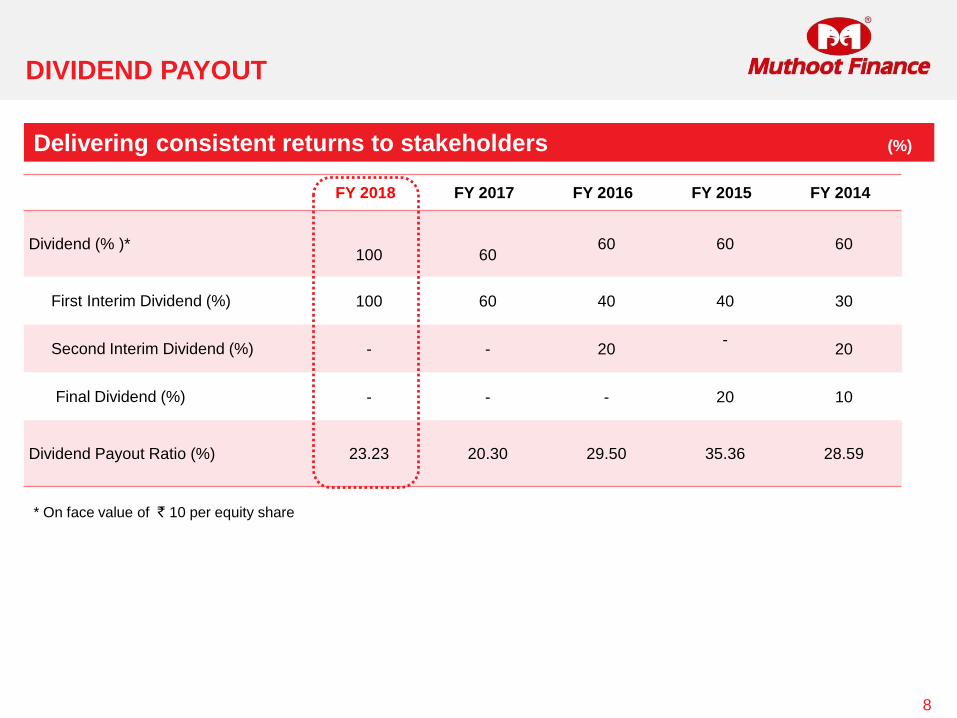
Delivering consistent returns to stakeholders (%)
FY 2018 FY 2017 FY 2016 FY 2015 FY 2014
Dividend (% )*100 60
60 60 60
First Interim Dividend (%) 100 60 40 40 30
Second Interim Dividend (%) - - 20-
20
Final Dividend (%) - - - 20 10
Dividend Payout Ratio (%) 23.23 20.30 29.50 35.36 28.59
* On face value of ` 10 per equity share
GEOGRAPHICAL PRESENCE
9
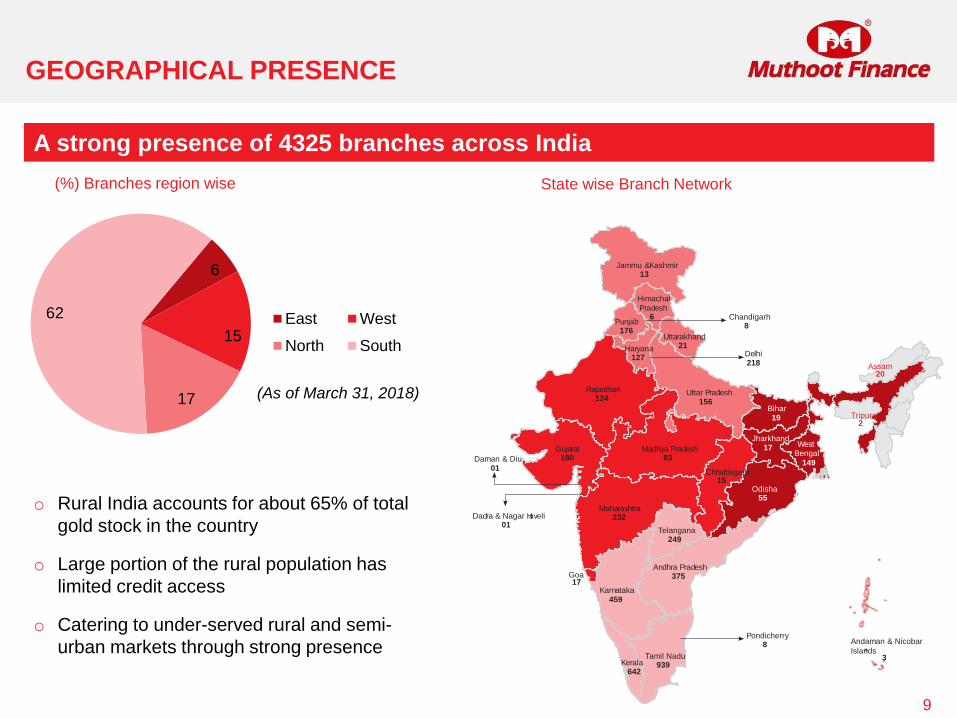
A strong presence of 4325 branches across India
(%) Branches region wise State wise Branch Network
6
15
17
62 East West
North South
(As of March 31, 2018)
o Rural India accounts for about 65% of total
gold stock in the country
o Large portion of the rural population has
limited credit access
o Catering to under-served rural and semi-
urban markets through strong presence
Jammu &Kashmir13
HimachalPradesh
6Punjab
176
Chandigarh8
Delhi218
Rajasthan134
Gujarat180Daman & Diu
01
Dadra & Nagar Haveli01
Madhya Pradesh83
Uttar Pradesh156
Bihar19
Uttarakhand21Haryana
127
Maharashtra232
Karnataka459
Goa17
Tamil Nadu939
Pondicherry8
Andhra Pradesh375
Telangana249
Chhattisgarh15
Odisha55
Jharkhand17 West
Bengal
149
Kerala642
Assam20
Tripura2
3
Andaman & Nicobar
Islands

DIGITAL INITIATIVES
10
Digital convenience for new gen & Millennium Customer acquisition
Aadhaar based Electronic KYC
• Biometric KYC verification - Convenience
• No further KYC documents –Paperless
• Aadhar
• Almost whole branches covered now
• 28% of New KYCs through e-KYC in Mar’18
• e-Sign facility has been introduced in
October’17.
Direct Credit Facility
• Loan proceeds credited to bank
account
• NEFT/RTGS/IMPS mode of bank
transfer
• Less cash handling at branch
• Instant credit to customer bank
account
Gold Cash Card (GCC) - DCB VISA
• Gold Loan amount loaded in card
• Use in ATMs & Shopping (online & offline)
• Accepted at all VISA enabled PoS
• Bank account not required for issuance
• Only Gold Loan NBFC to provide this
service
PoS Terminals
• Enables swiping of Debit
cards issued by banks
• Swiping charges for
Interest payments
waived off
DIGITAL INITIATIVES
11
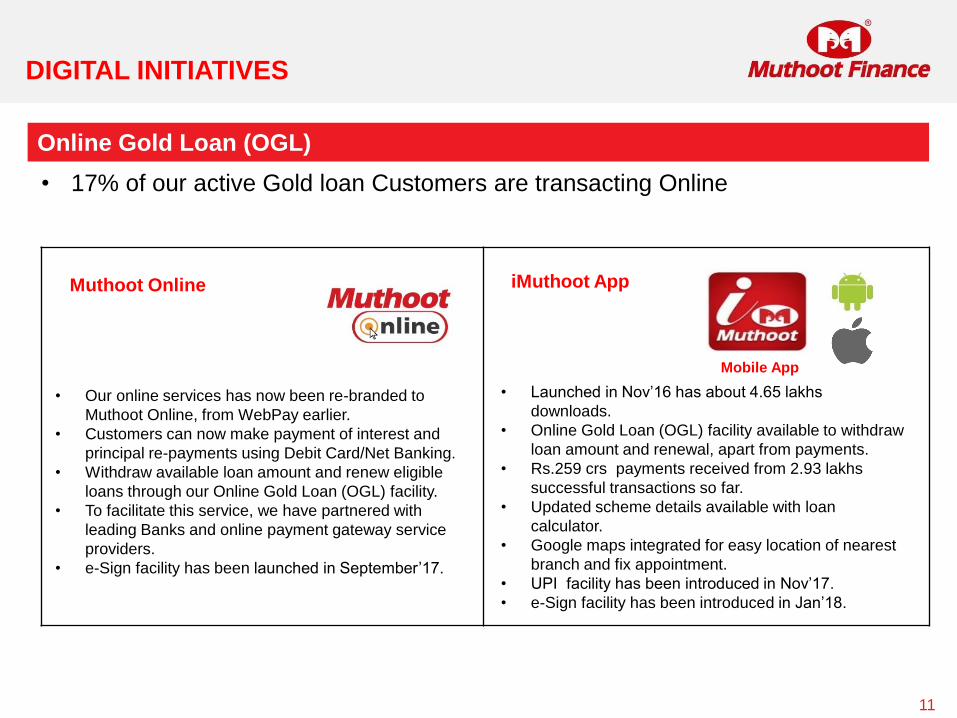
Online Gold Loan (OGL)
• 17% of our active Gold loan Customers are transacting Online
Muthoot Online iMuthoot App
Mobile App
• Our online services has now been re-branded to
Muthoot Online, from WebPay earlier.
• Customers can now make payment of interest and
principal re-payments using Debit Card/Net Banking.
• Withdraw available loan amount and renew eligible
loans through our Online Gold Loan (OGL) facility.
• To facilitate this service, we have partnered with
leading Banks and online payment gateway service
providers.
• e-Sign facility has been launched in September’17.
• Launched in Nov’16 has about 4.65 lakhs
downloads.
• Online Gold Loan (OGL) facility available to withdraw
loan amount and renewal, apart from payments.
• Rs.259 crs payments received from 2.93 lakhs
successful transactions so far.
• Updated scheme details available with loan
calculator.
• Google maps integrated for easy location of nearest
branch and fix appointment.
• UPI facility has been introduced in Nov’17.
• e-Sign facility has been introduced in Jan’18.

SHAREHOLDER’S FUNDS
12
Mar-18 Dec-17 Sep-17 Jun-17 Mar-17 Growth Growth
(` in million) (` in million) (` in million) (` in million) (` in million) YoY (%) QoQ (%)
Share Capital 4,000 3,999 3,996 3,995 3,995 0 0
Reserves & Surplus 73,604 73,898 69,248 64,688 61,169 20 0
Total 77,604 77,897 73,244 68,683 65,164 19 0
Networth
Strong Capital Base

ASSETS
13
Mar- 18 Dec-17 Sep-17 Jun-17 Mar-17 Growth Growth
(` in million) (` in million) (` in million) (` in million) (` in million) YoY (%) QoQ (%)
Gross loan assets
under management 291,384 282,648 276,080 278,517 272,785 7 3
Break-up of Gross Loan Assets under management
Gold Loans under
management 288,484 280,974 275,338 277,750 272,199 6 3
Other loans 2,900 1,674 742 767 586 395 73
Gross Loan Assets under management
Core focus continues to be gold loan

LIABILITIES
Mar-18 Dec-17 Sep-17 Jun-17 Mar-17 Growth Growth
(` in million) (` in million) (` in million) (` in million) (` in million) YoY (%) QoQ (%)
Secured Non-Convertible
Debentures (Muthoot Gold
Bonds)8,769 11,419 16,288 21,058 25,190 (65) (23)
Secured Non-Convertible
Debentures- Listed43,842 45,158 49,909 55,359 37,098 18 (3)
Borrowings from Banks/FIs 111,836 120,421 103,695 93,049 92,019 22 (7)
Subordinated Debt 7,388 9,389 11,026 13,423 15,458 (52) (21)
Subordinated Debt -Listed 3,849 3,849 3,849 3,849 3,662 5 0
Commercial Paper 28,181 14,505 33,056 28,268 31,548 (11) 94
Other Loans 8,815 6,221 5,644 5,838 5,984 47 42
Total 212,680 210,962 223,467 220,844 210,959 1 1
Stable sources of funding
14

REVENUE & PROFIT
15
FY 2018 FY 2017
YoY
Growth
(%)
Q4 FY 2018 Q3 FY 2018 Q2 FY 2018 Q1 FY 2018
INCOME
Interest Income 60,593 56,546 7 15,223 15,227 16,385 13,758
Other Income 1,839 921 100 857 440 314 228
Total 62,432 57,467 9 16,080 15,667 16,699 13,986
EXPENDITURE
Interest Expense 19,399 22,938 (15) 4,495 4,689 4,889 5,326
Personnel Expenses 7,288 7,280 0 1,841 1,790 1,884 1,773
Administrative & Other
expenses4,940 4,401 12 1,461 1,259 1,074 1,146
Provisions & Write Offs 2,397 2,816 (15) 597 565 1,169 66
Directors Remuneration 431 362 19 258 58 57 58
Depreciation 405 460 (12) 103 104 100 99
Total 34,860 38,257 (9) 8,755 8,465 9,173 8,468
PROFIT
Profit Before Tax 27,571 19,210 44 7,325 7,201 7,527 5,518
Profit After Tax 17,203 11,798 46 4,514 4,637 4,541 3,511
Profit & Loss Statement (` in million)

Gold Loan Assets Under Management (` in billion)
GOLD LOAN PORTFOLIO
16
Gaining scale over the years
73
157
244
260
216 233243
272278 275 281
288
0
30
60
90
120
150
180
210
240
270
300
Mar-10 Mar-11 Mar-12 Mar-13 Mar-14 Mar-15 Mar-16 Mar-17 Jun-17 Sep-17 Dec-17 Mar-18

GOLD HOLDING
17
Carrying the trust of millions of our customers
Gold jewellery kept as security (In tonnes)
66
112
137134
118
131 142
149 152 152153 155
0
20
40
60
80
100
120
140
160
180
Mar-10 Mar-11 Mar-12 Mar-13 Mar-14 Mar-15 Mar-16 Mar-17 Jun-17 Sep-17 Dec-17 Mar-18

Diversified gold loan portfolio across India (%)
GEOGRAPHICAL SPREAD OF GOLD LOAN PORTFOLIO
18
Mar-10 Mar-11 Mar-12 Mar-13 Mar-14 Mar-15 Mar-16 Mar-17 Jun-17 Sep-17 Dec-17 Mar-18
73 157 244 260 216 233 243 272 278 275 281 288
Gold Loan Assets Under Management (` in billion)
Mar-10 Mar-11 Mar-12 Mar-13 Mar-14 Mar-15 Mar-16 Mar-17 Jun-17 Sep-17 Dec-17 Mar-18
East 2 3 4 5 6 6 7 7 7 8 8 8
West 8 8 10 11 13 15 17 18 19 19 19 19
North 15 15 17 19 22 22 22 23 23 23 23 23
South 75 74 69 65 59 57 54 52 51 50 50 50
0
20
40
60
80
100

PRODUCTIVITY
19
Average Gold Loan Per Branch (` in million)
45.74
57.55
66.39
63.69
50.63
55.01 56.93
63.264.82 64.23 65.29 66.70
15
25
35
45
55
65
75
Mar-10 Mar-11 Mar-12 Mar-13 Mar-14 Mar-15 Mar-16 Mar-17 Jun-17 Sep-17 Dec-17 Mar-18
Widening presence with increasing gold loan business per branch

YIELD ON LOAN ASSETS AND NIM
20
19.94
19.72
22.34
21.66
20.27
19.31 19.72 21.43
21.70
6.00
8.00
10.00
12.00
14.00
16.00
18.00
20.00
22.00
24.00
26.00
Mar-10 Mar-11 Mar-12 Mar-13 Mar-14 Mar-15 Mar-16 Mar-17 Mar-18
8.77
10.81 10.47
10.659.42 9.52
11.17
10.278.91
11.69 11.38 10.84
9.79
8.69
12.74
6.95
14.75
21.3321.80
23.59
20.06
6.00
8.00
10.00
12.00
14.00
16.00
18.00
20.00
22.00
24.00
26.00
Q4 FY 2018 Q3 FY 2018 Q2 FY 2018 Q1 FY 2018
6.3
0
15
.03
7.7
7
6.7
1
12
.30
15
.09
7.0
4
16.5
5
Yearly (%) Quarterly (%)
Interest Income on Average Loan Assets
Interest Expense on Average Loan Assets
Net Interest Margin
9.25

INTEREST SPREAD
21
19.94 19.72
22.34
21.6620.27
19.3119.72
21.43 21.70
6.00
8.00
10.00
12.00
14.00
16.00
18.00
20.00
22.00
24.00
26.00
Mar-10 Mar-11 Mar-12 Mar-13 Mar-14 Mar-15 Mar-16 Mar-17 Mar-18
12.90
11.5310.85
10.149.24
8.39 8.80
8.41 8.87
12.2012.42
11.88
10.80
8.92 10.53
10.90
21.3321.8
23.59
20.06
6.00
8.00
10.00
12.00
14.00
16.00
18.00
20.00
22.00
24.00
26.00
Q4 FY 2018 Q3 FY 2018 Q2 FY 2018 Q1 FY 2018
8.2
5
13
.2
8.7
1
8..6
0
14.8
8
9.3
3
13
.08
10
.73
Yearly (%) Quarterly (%)
Interest Income on Average Loan Assets
Interest Expenses on Average Outside Liabilities
Interest Spread
8.38
10.93

RETURN ON AVERAGE LOAN ASSETS
22
Yearly (%) Quarterly (%)
Attractive returns over the years
4.214.24 4.40
4.05
3.223.03
3.32
4.47
6.16
2.50
3.00
3.50
4.00
4.50
5.00
5.50
6.00
6.50
7.00
Mar-10 Mar-11 Mar-12 Mar-13 Mar-14 Mar-15 Mar-16 Mar-17 Mar-18
6.32
6.646.54
5.12
2.50
3.00
3.50
4.00
4.50
5.00
5.50
6.00
6.50
7.00
Q4 FY 2018 Q3 FY 2018 Q2 FY 2018 Q1 FY 2018

NON-PERFORMING ASSETS
23
LOAN TO VALUE OF NON PERFORMING ASSETS- GOLD LOAN* Mar-18
Rs in
million
Loan to value ratio including interest
receivable till March 31,2018 at gold
price(22ct) of Rs 2824 per gram
Primary NPA Gold Loans-(Based on 3 months from due date) 12,748 94%
Secondary NPA (Other standard loan accounts of a borrower whose any
other loan account is classified as Primary NPA) 7,424 76%
Total Non Performing Assets-Gold Loan 20,172 87%
Primary Non Performing Assets-Other Loans 157
Gross Non Performing Assets 20,329
Non-Performing Assets (` in million)
Mar-18 Dec-17 Sep-17 Jun-17 Mar-17
Gross Non-Performing Assets 20,329* 15,897 12,593 6,279 5,621
Provision For Non-Performing Assets 2,378 1,975 1,571 1,019 1,019
Net Non-Performing Assets 17,951 13,922 11,021 5,260 4,602
% of Gross NPA on Gross Loan Assets 6.98 5.62 4.56 2.25 2.06
% of Net NPA on Gross Loan Assets 6.16 4.93 3.99 1.89 1.69
Generally NPA will not result into bad debts as collateral can be auctioned

BAD DEBTS & STANDARD ASSET PROVISION
24
Bad Debts (` in million)
FY 2018 FY 2017 Q4 FY 2018 Q3 FY 2018 Q2 FY 2018 Q1 FY 2018
Bad Debts Written Off 316 165 189 55 63 9
Mar-18 Dec-17 Sep-17 Jun-17 Mar-17
Provision (` in million) 3,388 3,334 3,295 2,722 2,685
% of Provision to Standard Assets * 1.25 1.25 1.25 1.00 1.01
Provision for Gold Price fluctuation risk (` in million) ** 2,330 2,330 2,330 2,330 2,330
% of Provision to Standard Assets 0.86 0.87 0.88 0.86 0.87
Total Standard Assets Provision (` in million) 5,718 5,664 5,625 5,052 5,015
Standard Asset Provision
* Maintaining a higher standard asset provision of 1.25% as against the regulatory requirement of 0.40%
** Maintaining additional standard asset provision of 0.86% for gold price fluctuation

LIABILITY MIX
25
Maintaining a diversified funding profile
(%)
(As of March 31, 2018)
21
4Secured Non-Convertible Debentures (Muthoot Gold Bonds) – 8,769 mn (4%)
Secured Non-Convertible Debentures – Listed – 43,842 mn (21%)
Borrowings from Banks/Fis - 111,836 mn (53%)
Subordinated Debt – 7,388 mn (3%)
Subordinated Debt – Listed - 3,849 mn (2%)
Commercial Paper – 28,181 mn (13%)
Other Loans – 8,815 mn (4%)
53
4
23
`
`
`
`
`
`
`
13

CREDIT RATINGS
26
Amt of rating Rating Indicates
(` in million)
COMMERCIAL PAPER
CRISIL 40,000 CRISIL A1+
Very strong degree of safety with regard to timely
payment of financial obligation and carry lowest credit
risk
ICRA 40,000 ICRA A1+ Very strong degree of safety and lowest credit risk
BANK LOANS
ICRA* 132,130 ICRA A1+ Very strong degree of safety and lowest credit risk
Long-term Rating
Amt of rating Rating Indicates
(` in million)
SUBORDINATED DEBT
CRISIL 1,000 CRISIL AA/(Stable)High Degree of safety with regard to timely servicing of
financial obligations and carry very low credit risk
ICRA 1,000 ICRA AA(Stable)High Degree of safety with regard to timely servicing of
financial obligations and carry very low credit risk
NON CONVERTIBLE DEBENTURE
CRISIL 5,000 CRISIL AA/(Stable)High Degree of safety with regard to timely servicing of
financial obligations and carry very low credit risk
ICRA 5,000 ICRA AA(Stable)High Degree of safety with regard to timely servicing of
financial obligations and carry very low credit risk
BANK LOANS
ICRA* 100,370 ICRA AA(Stable)High Degree of safety with regard to timely servicing of
financial obligations and carry very low credit risk
Short-term Rating
Highest Rating among gold loan companies
*Within the overall rating of `141,150 millions

Interest Income (` in million)
BREAK-UP OF GROSS INCOME
27
Other Income (` in million)
15,223 15,227 16,385 13,758
0
10,000
20,000
30,000
40,000
50,000
60,000
70,000
Q4 FY 2018 Q3 FY 2018 Q2 FY 2018 Q1 FY 2018
10,775
22,983
45,280
53,64149,077
42,703
48,130
56,546 60,593
0
10,000
20,000
30,000
40,000
50,000
60,000
70,000
Mar-10 Mar-11 Mar-12 Mar-13 Mar-14 Mar-15 Mar-16 Mar-17 Mar-18
119 175 210 230397
543 620921
1,839
0
500
1000
1500
2000
Mar-10 Mar-11 Mar-12 Mar-13 Mar-14 Mar-15 Mar-16 Mar-17 Mar-18
857
440
314228
0
200
400
600
800
1,000
Q4 FY 2018 Q3 FY 2018 Q2 FY 2018 Q1 FY 2018
Yearly Quarterly
Yearly Quarterly

OPERATING EXPENSES TO AVERAGE LOAN ASSETS
28
4.72
4.284.02 4.08
4.46
5.01 5.1
5.63 5.39
3.50
4.00
4.50
5.00
5.50
6.00
6.50
7.00
7.50
8.00
8.50
Mar-10 Mar-11 Mar-12 Mar-13 Mar-14 Mar-15 Mar-16 Mar-17 Mar-18
5.83
5.26
6.02
4.44
3.50
4.00
4.50
5.00
5.50
6.00
6.50
7.00
7.50
8.00
8.50
Q4 FY 2018 Q3 FY 2018 Q2 FY 2018 Q1 FY 2018
Operational efficiency over the years
Yearly (%) Quarterly (%)
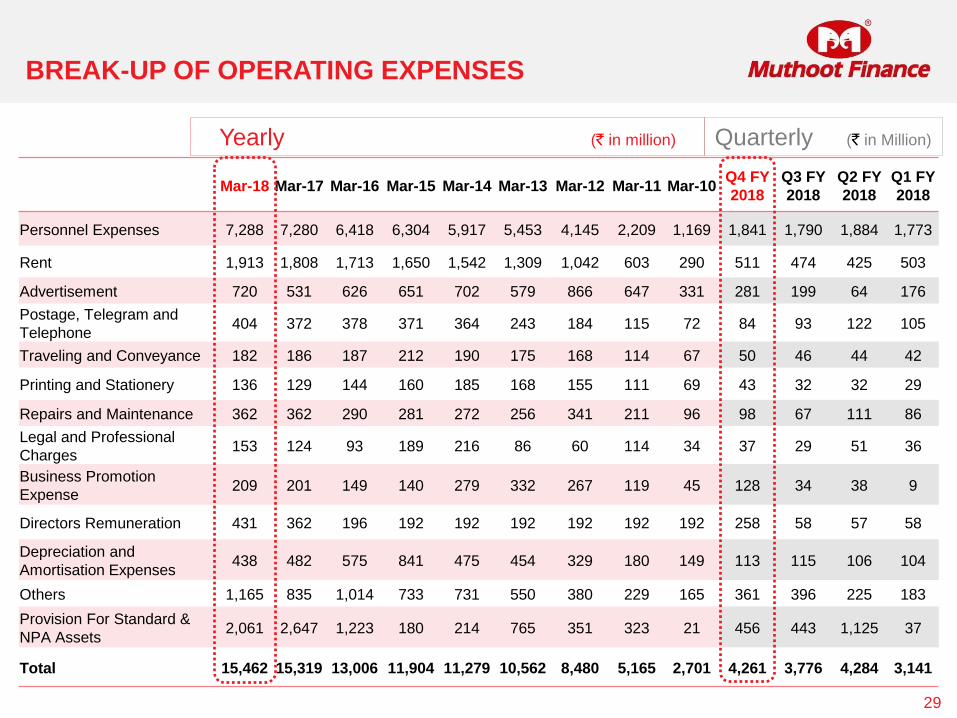
BREAK-UP OF OPERATING EXPENSES
Mar-18 Mar-17 Mar-16 Mar-15 Mar-14 Mar-13 Mar-12 Mar-11 Mar-10Q4 FY
2018
Q3 FY
2018
Q2 FY
2018
Q1 FY
2018
Personnel Expenses 7,288 7,280 6,418 6,304 5,917 5,453 4,145 2,209 1,169 1,841 1,790 1,884 1,773
Rent 1,913 1,808 1,713 1,650 1,542 1,309 1,042 603 290 511 474 425 503
Advertisement 720 531 626 651 702 579 866 647 331 281 199 64 176
Postage, Telegram and
Telephone404 372 378 371 364 243 184 115 72 84 93 122 105
Traveling and Conveyance 182 186 187 212 190 175 168 114 67 50 46 44 42
Printing and Stationery 136 129 144 160 185 168 155 111 69 43 32 32 29
Repairs and Maintenance 362 362 290 281 272 256 341 211 96 98 67 111 86
Legal and Professional
Charges153 124 93 189 216 86 60 114 34 37 29 51 36
Business Promotion
Expense209 201 149 140 279 332 267 119 45 128 34 38 9
Directors Remuneration 431 362 196 192 192 192 192 192 192 258 58 57 58
Depreciation and
Amortisation Expenses438 482 575 841 475 454 329 180 149 113 115 106 104
Others 1,165 835 1,014 733 731 550 380 229 165 361 396 225 183
Provision For Standard &
NPA Assets2,061 2,647 1,223 180 214 765 351 323 21 456 443 1,125 37
Total 15,462 15,319 13,006 11,904 11,279 10,562 8,480 5,165 2,701 4,261 3,776 4,284 3,141
Yearly (` in million) Quarterly (` in Million)
29

BREAK-UP OF OPERATING EXPENSES
Mar-18 Mar-17 Mar-16 Mar-15 Mar-14 Mar-13 Mar-12 Mar-11 Mar-10Q4 FY
2018
Q3 FY
2018
Q2 FY
2018
Q1 FY
2018
Personnel Expenses 47 48 49 53 52 52 49 43 43 43 47 44 56
Rent 12 12 13 14 14 12 12 12 11 12 13 10 16
Advertisement 5 3 5 5 6 5 10 13 12 7 5 1 6
Postage, Telegram and
Telephone3 2 3 3 3 2 2 2 3 2 2 3 3
Traveling and
Conveyance1 1 1 2 2 2 2 2 2 1 1 1 1
Printing and Stationery 1 1 1 1 2 2 2 2 3 1 1 1 1
Repairs and Maintenance 2 2 2 2 2 2 4 4 4 2 2 3 3
Legal and Professional
Charges1 1 1 2 2 1 1 2 1 1 1 1 1
Business Promotion
Expense1 1 1 1 2 3 3 2 2 3 1 1 0
Directors Remuneration 3 2 2 2 2 2 2 4 7 6 2 1 2
Depreciation and
Amortisation Expenses3 3 4 7 4 4 4 3 6 3 3 2 3
Others 8 5 8 6 6 5 4 4 6 8 12 4 6
Provision For Standard &
NPA Assets13 17 9 2 2 7 4 6 1 11 10 28 1
Total 100 100 100 100 100 100 100 100 100 100 100 100 100
Yearly (%) Quarterly (%)
30

PROFITABILITY RATIOS
(Based on
Income)Mar-18 Mar-17 Mar-16 Mar-15 Mar-14 Mar-13 Mar-12 Mar-11 Mar-10
Q4 FY
2018
Q3 FY
2018
Q2 FY
2018
Q1 FY
2018
Interest expense to
Gross Income31.07 39.92 46.31 48.71 53.08 52.34 52.10 44.83 43.49 27.95 29.93 29.28 38.08
Selling, general and
administrative
expenses to Net
Income
29.42 34.88 41.36 48.26 44.66 35.89 35.48 36.32 41.00 30.73 28.29 25.53 34.38
Provisions & Write
Offs to Net Income5.57 8.16 6.20 1.67 1.89 3.49 1.93 2.68 0.44 5.15 4.73 9.90 0.76
Operational expenses
to Net Income34.99 43.03 47.56 49.93 46.55 39.37 37.41 38.99 41.44 35.88 33.02 35.43 35.14
OPBDT / Net Income 65.01 56.97 52.44 50.06 53.45 60.62 62.59 61.00 58.56 64.12 66.54 64.58 64.85
Depreciation to Net
Income0.94 1.33 2.13 3.72 2.03 1.76 1.50 1.42 2.42 0.89 0.95 0.85 1.13
OPBT / Net Income 64.07 55.63 50.31 46.34 51.42 58.86 61.09 59.58 56.14 63.23 65.59 63.73 63.72
PBT / Net Income 64.07 55.63 50.31 46.34 51.42 58.86 61.09 59.58 56.14 63.23 65.59 63.73 63.72
PAT / Net Income 39.98 34.17 30.93 30.23 33.60 39.11 40.93 38.68 36.97 38.96 42.24 38.45 40.54
Yearly (%) Quarterly (%)
31

(Based on Average
Loan Assets)Mar-18 Mar-17 Mar-16 Mar-15 Mar-14 Mar-13 Mar-12 Mar-11 Mar-10
Q4 FY
2018
Q3 FY
2018
Q2 FY
2018
Q1 FY
2018
Interest income to avg.
loan assets21.70 21.43 19.72 19.30 20.27 21.66 22.34 19.72 19.94 21.33 21.80 23.59 20.06
Interest expense to avg.
loan assets6.95 8.69 9.25 9.52 10.84 11.38 11.69 8.91 8.77 6.30 6.71 7.04 7.77
Net Interest Margin 14.75 12.74 10.47 9.78 9.42 10.27 10.65 10.81 11.17 15.03 15.09 16.55 12.29
Other income to avg.
Loan assets0.66 0.35 0.25 0.25 0.16 0.09 0.10 0.15 0.22 1.20 0.63 0.45 0.33
Net Income Including
Other Income15.41 13.09 10.72 10.03 9.59 10.37 10.75 10.96 11.39 16.23 15.72 17.00 12.62
Selling, general and
administrative expenses
to avg. loan assets
4.53 4.56 4.43 4.84 4.28 3.72 3.81 3.98 4.66 4.99 4.45 4.34 4.34
Provisions and write offs
to avg. loan assets0.86 1.07 0.67 0.17 0.18 0.36 0.21 0.29 0.05 0.84 0.81 1.68 0.10
PBDT to avg. loan
assets10.02 7.45 5.62 5.02 5.12 6.28 6.73 6.69 6.67 10.41 10.46 10.98 8.18
Depreciation to avg. loan
assets0.15 0.17 0.23 0.37 0.20 0.18 0.16 0.16 0.28 0.14 0.15 0.14 0.14
PBT to avg. loan assets 9.87 7.28 5.39 4.65 4.93 6.10 6.57 6.53 6.39 10.26 10.31 10.84 8.04
Tax to avg. loan assets 3.71 2.81 2.08 1.62 1.71 2.05 2.17 2.29 2.18 3.94 3.67 4.30 2.92
PAT to avg. loan assets 6.16 4.47 3.32 3.03 3.22 4.05 4.40 4.24 4.21 6.32 6.64 6.54 5.12
Cash Profit to avg. loan
assets6.30 4.65 3.54 3.40 3.42 4.24 4.56 4.40 4.49 6.47 6.79 6.68 5.26
Yearly (%) Quarterly (%)
32
PROFITABILITY RATIOS

PROFITABILITY
33
Profitability at a glance (` in million)
Efforts getting rewarded
3456
7612
7,612
13,312
27,571
13,168
11,936
10,279
2,276
4,942
8,920 10,042 7801
67058096
11,798
17,203
0
2,000
4,000
6,000
8,000
10,000
12,000
14,000
16,000
18,000
20,000
22,000
24,000
26,000
28,000
Mar-10 Mar-11 Mar-12 Mar-13 Mar-14 Mar-15 Mar-16 Mar-17 Mar-18
19,210
73257,201
7,527
5,5184514
4,637 4,541
3,511
0
2,000
4,000
6,000
8,000
10,000
12,000
14,000
16,000
18,000
20,000
22,000
Q4 FY 2018 Q3 FY 2018 Q2 FY 2018 Q1 FY 2018
Yearly QuarterlyPBT PAT PATPBT

NET WORTH
34
Share Capital and Reserves & Surplus (` in million)
Steady capital position
5,845
13,344
29,257
37,356
42,646
50,835
56,192
65,164
68,683
73,244
7760477897
0
10,000
20,000
30,000
40,000
50,000
60,000
70,000
80,000
Mar 10 Mar 11 Mar 12 Mar 13 Mar-14 Mar- 15 Mar-16 Mar-17 Jun-17 Sep-17 Dec-17 Mar-18

RETURN ON EQUITY
35
Return on Average Equity
Stable shareholder value creation
48.10
51.52
41.90
30.15
19.50
14.35
15.13
19.44
24.10
10
15
20
25
30
35
40
45
50
55
Mar 10 Mar 11 Mar 12 Mar 13 Mar 14 Mar 15 Mar 16 Mar 17 Mar 18
23.2224.54
25.60
20.98
0
5
10
15
20
25
30
Q4 FY 2018 Q3 FY 2018 Q2 FY 2018 Q1 FY 2018
Yearly (%) Quarterly (%)

CAPITAL RATIO
36
Mar-18 Dec-17 Sep-17 Jun-17 Mar-17
Capital Adequacy Ratio 26.59 27.65 26.49 25.61 24.88
Tier-I 24.75 25.52 23.64 22.65 21.78
Tier-II 1.84 2.13 2.85 2.96 3.10
Maintaining capital well above the statutory requirement
Capital Adequacy Ratio (%)
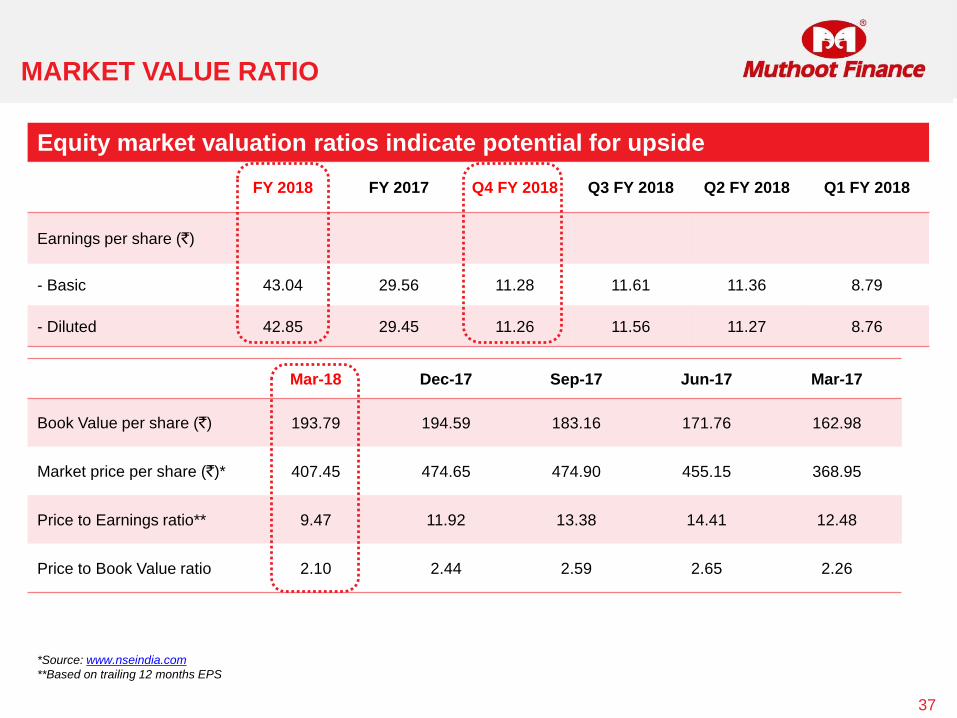
MARKET VALUE RATIO
37
FY 2018 FY 2017 Q4 FY 2018 Q3 FY 2018 Q2 FY 2018 Q1 FY 2018
Earnings per share (`)
- Basic 43.04 29.56 11.28 11.61 11.36 8.79
- Diluted 42.85 29.45 11.26 11.56 11.27 8.76
*Source: www.nseindia.com
**Based on trailing 12 months EPS
Equity market valuation ratios indicate potential for upside
Mar-18 Dec-17 Sep-17 Jun-17 Mar-17
Book Value per share (`) 193.79 194.59 183.16 171.76 162.98
Market price per share (`)* 407.45 474.65 474.90 455.15 368.95
Price to Earnings ratio** 9.47 11.92 13.38 14.41 12.48
Price to Book Value ratio 2.10 2.44 2.59 2.65 2.26

CAPITALISATION RATIOS
38
Mar-18 Dec-17 Sep-17 Jun-17 Mar-17
Outside Liabilities 2,36,212 236,707 251,228 249,141 241,966
Cash & Bank Balances 4,870 13,960 19,649 21,063 15,343
Tangible Networth 77,522 77,820 73,243 68,626 65,104
Capital Gearing 2.98 2.86 3.16 3.32 3.48
(` In million)
Headroom for further leveraging
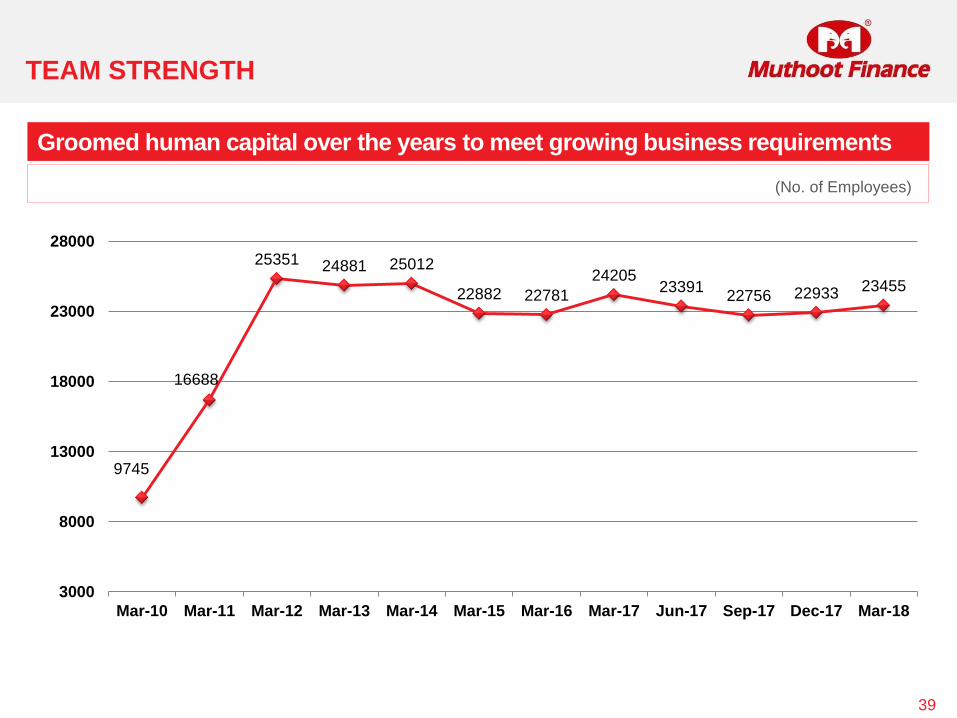
TEAM STRENGTH
39
9745
16688
25351 24881 25012
22882 22781
2420523391
22756 22933 23455
3000
8000
13000
18000
23000
28000
Mar-10 Mar-11 Mar-12 Mar-13 Mar-14 Mar-15 Mar-16 Mar-17 Jun-17 Sep-17 Dec-17 Mar-18
Groomed human capital over the years to meet growing business requirements
(No. of Employees)

OUR SUBSIDIARY
40
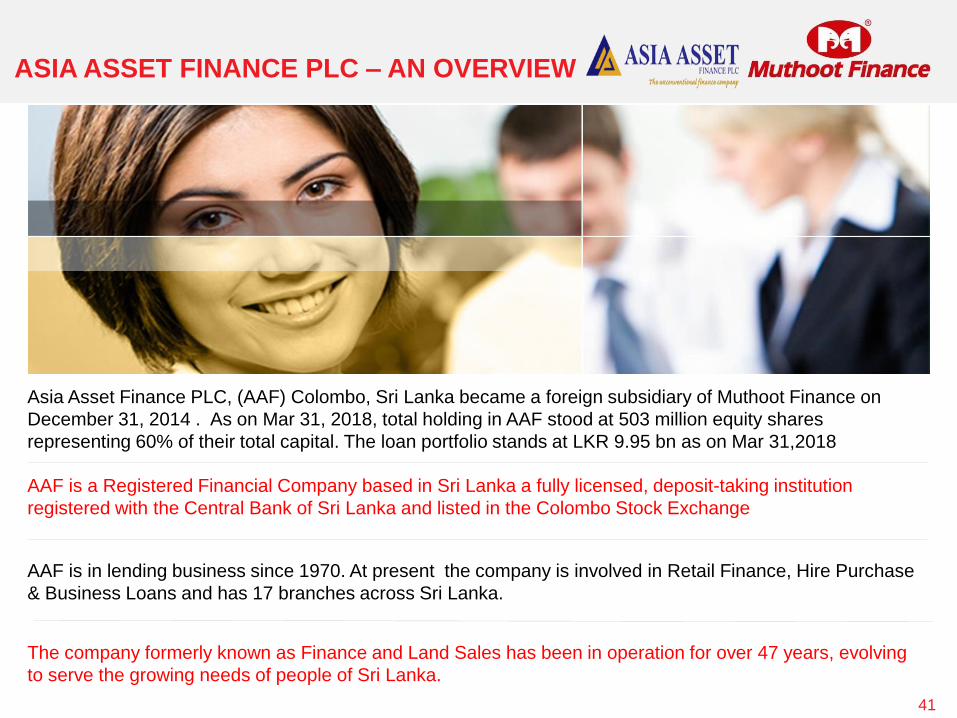
ASIA ASSET FINANCE PLC – AN OVERVIEW
41
Asia Asset Finance PLC, (AAF) Colombo, Sri Lanka became a foreign subsidiary of Muthoot Finance on
December 31, 2014 . As on Mar 31, 2018, total holding in AAF stood at 503 million equity shares
representing 60% of their total capital. The loan portfolio stands at LKR 9.95 bn as on Mar 31,2018
AAF is a Registered Financial Company based in Sri Lanka a fully licensed, deposit-taking institution
registered with the Central Bank of Sri Lanka and listed in the Colombo Stock Exchange
AAF is in lending business since 1970. At present the company is involved in Retail Finance, Hire Purchase
& Business Loans and has 17 branches across Sri Lanka.
The company formerly known as Finance and Land Sales has been in operation for over 47 years, evolving
to serve the growing needs of people of Sri Lanka.
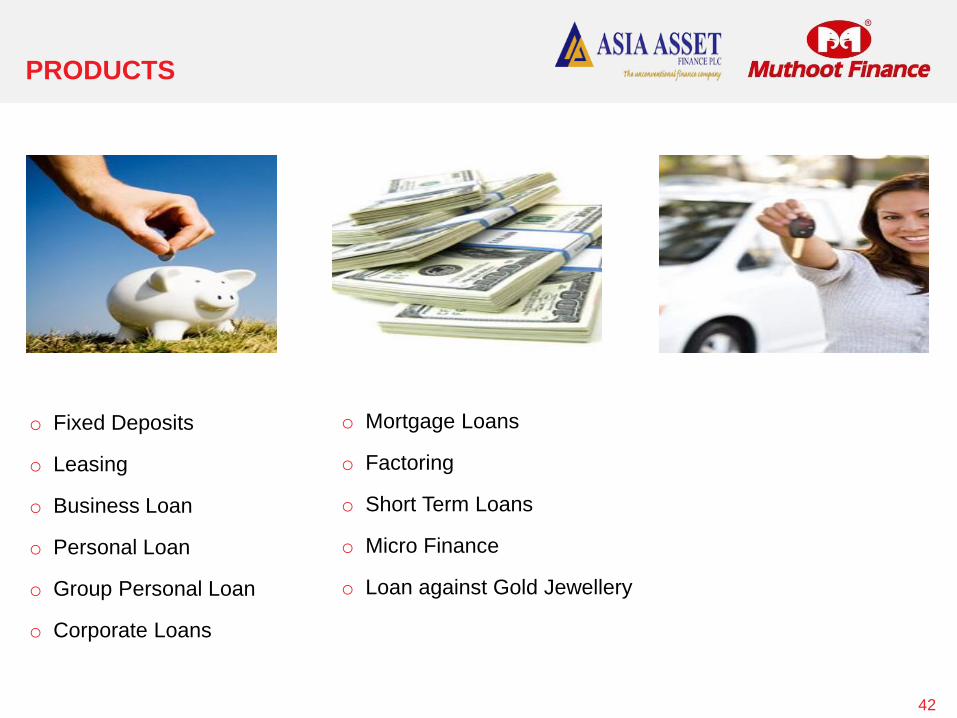
PRODUCTS
42
o Fixed Deposits
o Leasing
o Business Loan
o Personal Loan
o Group Personal Loan
o Corporate Loans
o Mortgage Loans
o Factoring
o Short Term Loans
o Micro Finance
o Loan against Gold Jewellery

BRANCH NETWORK
43
AAF has operations in various parts of Sri Lanka providing the best services and
easy access to clients

Particulars FY 2018 FY 2017Q4 FY
2018Q3 FY 2018 Q2 FY 2018 Q1 FY 2018
LKR / INR 0.41551 0.42113 0.41551 0.41374 0.42313 0.41706
Number of branches 17 17 17 17 17 17
Number of Employees 489 448 489 490 481 449
Loan AUM (LKR) 9,950 8,662 9,950 9,746 9,494 9,082
Capital Adequacy Ratio (%) 20 19 20 20 20 21
Total Revenue (LKR) 2,559 2,131 683 645 638 593
Total Expense (LKR) 2,304 1,815 618 585 582 520
Profit Before Tax (LKR) 256 316 65 60 57 73
Profit After Tax (LKR) 198 278 58 47 40 57
Share Holders Funds (LKR) 1,879 1,737 1,879 1,821 1,775 1,735
Total Outside Liabilities (LKR) 9,882 8,290 9,882 9,515 9,396 8,828
Total Assets (LKR) 11,761 10,027 11,761 11,336 11,170 10,56344
Key Financial Parameters (LKR in millions)
OUR SUBSIDIARY
45
MUTHOOT HOMEFIN – AN OVERVIEW
Muthoot Homefin (India) Limited is a Housing Finance Company registered with The National Housing Bank
(NHB). It became a wholly owned subsidiary of Muthoot Finance Ltd in Aug’17.
MHIL focuses on extending affordable housing finance and targets customers in Economically Weaker
Sections (EWS) and Lower Income Groups (LIG) in Tier II & Tier III locations.
It operates on a ‘Hub and Spoke’ model, with the centralised processing at Corporate Office at Mumbai.
MHIL has operations in Kerala, Maharashtra, Gujarat, Rajasthan, Madhya Pradesh, Chandigarh, Andhra
Pradesh , Telangana , Karnataka, Uttar Pradesh and Haryana.
As on Mar 31, 2018, it has a loan portfolio of Rs.15 bn.
46
ICRA assigned Long Term Debt Rating of ICRA AA-(Stable) for its Bank limits in Q2 FY 17 .ICRA assigned
Short Term Debt Rating of ICRA A1+ for its Commercial Paper.

Particulars FY 2018 FY 2017 Q4 FY 2018 Q3 FY 2018 Q2 FY 2018 Q1 FY 2018
Number of branches 19 9 19 17 14 11
Number of Sales Offices 121 110 121 121 110 110
Number of Employees 221 111 221 194 167 135
Loan AUM (`) 14,648 4,408 14,648 10,999 8,296 5,957
Capital Adequacy Ratio (%) 26 36 26 26 44 27
Total Revenue (`) 1259 242 452 358 256 192
Total Expense (`) 840 189 299 229 180 131
Profit Before Tax (`) 419 53 153 129 76 61
Profit After Tax (`) 278 29 116 80 45 37
Share Holders Funds (`) 2,160 882 2,160 2,044 1,963 918
Total Outside Liabilities (`) 13,700 3,624 13,700 10,326 7,594 5,954
Total Assets (`) 15,860 4,506 15,860 12,370 9,557 6,872
Business Performance (` in millions)
47

Business Performance
Particulars FY 2018 FY 2017 Q4 FY 2018 Q3 FY 2018 Q2 FY 2018 Q1 FY 2018
Disbursement (`) 10,814 4,158 3,878 2,890 2,461 1,584
Borrowings (`) 11,115 2,178 11,115 8,608 6,346 4,850
Debt Equity Ratio (%) 5.15 2.47 5.15 4.21 3.23 5.27
Yield on Advances (%) 12.27 12.74 12.16 12.19 12.23 12.67
Interest Spread (%) 3.51 3.31 3.58 3.48 3.70 3.55
NIM (%) 6.01 9.34 5.85 6.26 5.62 6.38
Cost to Income Ratio (%) 26.23 61 25.39 24 28 29
Return on Assets (ROA) (%) 3.42 2.42 3.97 3.37 2.72 3.08
Return on Equity (ROE) (%) 17.26 3.64 22.10 16.03 12.44 16.36
GNPA (%) 0.42 - 0.42 0.43 0.50 0.11
NNPA (%) 0.36 - 0.36 0.37 0.43 0.09
Number of Customers 15,908 4,024 15,908 11,571 8,406 5,680
48

Financial
Highlights
Growth
Drivers
Profitability
Opportunities
• Disbursements in FY 2018: Rs 10,841 mn. Loan Book as on Mar 31, 2018: Rs 14,647 mn
• Average Ticket Size in FY 2018: Rs.1.08 mn
• Business Presence: Maharashtra, Gujarat, Rajasthan, Madhya Pradesh , Kerala, Andhra Pradesh,Telangana,Karnataka, Uttar Pradesh, Haryana and Chandigarh, Presence in 66 locations
• ROA for FY 2018: 3.42%, ROE for FY 2018: 17.26%
• Average cost of borrowings of 8.76% for FY 2018. Capital Adequacy Ratio: 25.55%, Debt Equity Ratio: 5.15• Average Yield: 12.27%, Interest Spread: 3.51%• Received PMAY subsidy of Rs 37.80 mn for 162 cases in FY 2018 and further claimed Rs 90 mn for 400 cases.
• Received sanction for NHB Refinance for Rs 250 mn.
• Deepening our network further in existing states & expanding into Karnataka, Telengana, AP and Haryana state
• Increasing the leverage from 5.15x currently will help to improve the ROE
• Strong liquidity in Group’s balance sheet, along with its free cash flows to fund the capital requirements
• Established corporate brand name among borrower segment, superior customer servicing capabilities and effective loan recovery mechanisms
• Tier II / III cities focused distribution network with a in-house sales team along with cross-sale to the existing gold loans customers of the group
• Long Term Rating from ICRA of AA- (stable)/ CRISIL AA-(stable) which indicates low risk will help in lower cost of funds. Short Term Rating : ICRA A1+ / CARE A1+
• Debt/Equity ratio at 5.15 times as on Mar 31, 2018, indicates ample scope for financial leverage to increase ROE• Infrastructure sharing with the parent (Muthoot Finance) helps reduce overall Opex
• Our focus segment, “affordable housing finance” is the centered around the Government initiative of "Housing for All" by 2022
• Government promoted schemes such as PMAY-CLSS will benefit the end consumers.
• Huge shortfall for housing units in EWS / LIG segment in India
• Attraction of builders to the construction of affordable housing due to Infrastructure status given in Union Budget• Increase in affordability driven by sustained GDP growth rate and stable property prices.• Decrease in average members per household and emergence of nuclear families• Increase in workforce to be driven by expected bulge in working age population• Increasing urbanization led by rural-urban migration and reclassification of rural towns
49
OUR SUBSIDIARY
50

MUTHOOT INSURANCE – AN OVERVIEW
MIBPL became a wholly owned subsidiary of Muthoot Finance Ltd in Sep 2016. MIBPL is an unlisted private
limited company holding a licence to act as Direct Broker from IRDA since 2013.
It is actively distributing both life and non-life insurance products of various insurance companies.
During FY 18, it has insured more than 8,41,000 lives with a First year premium collection of Rs.101 Crs.
During FY 17, it has insured more than 566,000 lives with a First year premium collection of Rs. 70 Crs
under Traditional ,Term and Health products..
The same was 459,000 lives with a First year premium collection of Rs.49 Crs in FY16.
51

52
Particulars FY 2018 FY 2017 Q4 FY 2018 Q3 FY 2018 Q2 FY 2018 Q1 FY 2018
Premium Collection (` ) 1,006 697 415 217 216 157
Number of Policies 8,41,476 566,282 205,070 203,677 216,428 216,301
Key Business Parameters (` in millions)
FY 2018 FY 2017 Q4 FY 2018 Q3 FY 2018 Q2 FY 2018 Q1 FY 2018
Total Revenue (`) 181 116 72 46 38 25
Total Expense (`) 32 28 9 9 9 6
Profit Before Tax (`) 149 88 63 37 30 19
Profit After Tax (`) 105 60 44 25 20 12
Share Holders Funds (`) 276 171 276 228 203 183
Earnings per share (`) 211 120 96 50 41 25
Key Financial Parameters (` in millions)

OUR SUBSIDIARY
53

BELSTAR INVESTMENT AND FINANCE – AN OVERVIEW
As of Mar 2018 , Muthoot Finance holds 66.61% in BIFPL . BIFPL was incorporated on January 1988 at Bangalore and the Company
was registered with the RBI in March 2001 as a Non- Banking Finance Company. The Company was reclassified as “NBFC-MFI” by
RBI effective from 11th December 2013.
BIFPL was acquired by the ‘Hand in Hand’ group in September 2008 to provide scalable microfinance services to entrepreneurs
nurtured by ‘Hand in Hand’s’ Self Help Group (SHG) program. The Company commenced its first lending operations at Haveri District
of Karnataka in March 2009 to 3 SHGs, 22 members for INR 0.20 mn.
In the last eight years of its operations, BIFPL primarily relied on taking over the existing groups formed by Hand in Hand India . BIFPL
predominantly follows the SHG model of lending. Effective January 2015, BIFPL started working in JLG model of lending in Pune
district, Maharashtra.
As of Mar 31, 2018, BIFPL operations are spread over seven states and 1 UT (Tamil Nadu, Karnataka, Madhya Pradesh, Maharashtra,
Kerala, Odisha ,Pondicherry and Chattisgarh). It has 235 branches, with 44 controlling regional offices and employs 1783 staff. Its
gross loan portfolio has grown from INR 0.20 mn in March 2009 to INR 11,371 mn in March 2018
54
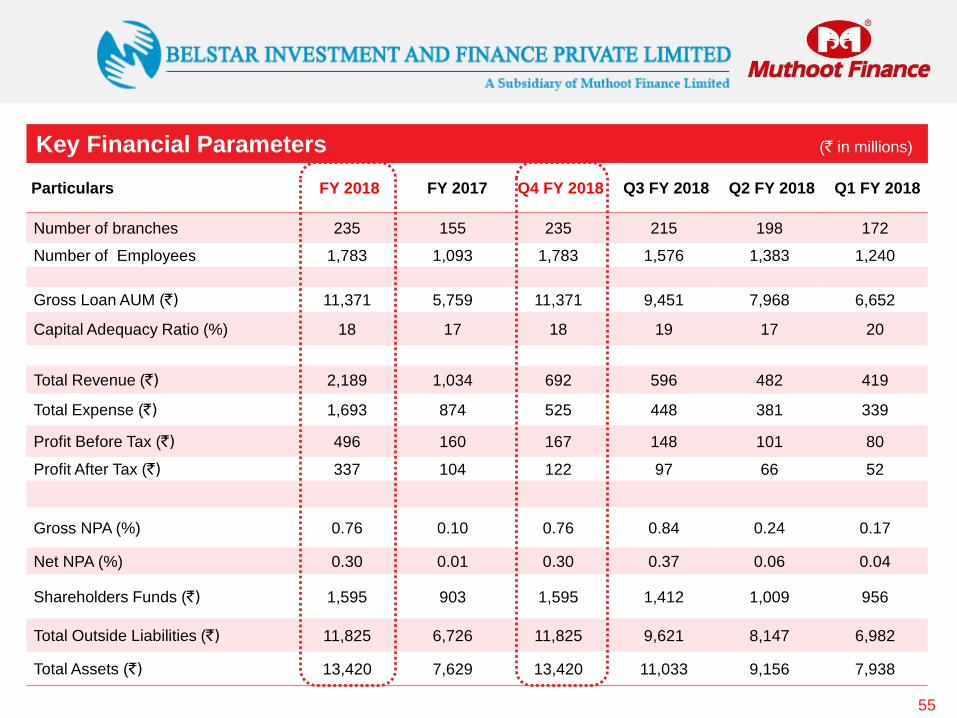
Particulars FY 2018 FY 2017 Q4 FY 2018 Q3 FY 2018 Q2 FY 2018 Q1 FY 2018
Number of branches 235 155 235 215 198 172
Number of Employees 1,783 1,093 1,783 1,576 1,383 1,240
Gross Loan AUM (`) 11,371 5,759 11,371 9,451 7,968 6,652
Capital Adequacy Ratio (%) 18 17 18 19 17 20
Total Revenue (`) 2,189 1,034 692 596 482 419
Total Expense (`) 1,693 874 525 448 381 339
Profit Before Tax (`) 496 160 167 148 101 80
Profit After Tax (`) 337 104 122 97 66 52
Gross NPA (%) 0.76 0.10 0.76 0.84 0.24 0.17
Net NPA (%) 0.30 0.01 0.30 0.37 0.06 0.04
Shareholders Funds (`) 1,595 903 1,595 1,412 1,009 956
Total Outside Liabilities (`) 11,825 6,726 11,825 9,621 8,147 6,982
Total Assets (`) 13,420 7,629 13,420 11,033 9,156 7,938
55
Key Financial Parameters (` in millions)
(Individual & Corporate Investors)
(Institutional Investors)
REGISTERED OFFICE
2nd Floor, Muthoot Chambers
Opposite Saritha Theatre Complex
Banerji Road, Kochi
Kerala – 682 018. India
Tel: (91484) 2394712
Fax: (91484) 2396506
www.muthootfinance.com
CIN: L65910KL1997PLC011300
RBI Reg No: N 16.00167