mutual of america 2011 annual report -...
TRANSCRIPT

3
Mu
tu
AL
of
AM
er
ICA
2011 a
nn
ua
l repo
rt MutuAL of AMerICA 2 01 1 a n n ua l r eport

Table of Contents
Letter from the Chairman,
President and Chief Executive Officer 2
Featured Clients 6
Board of Directors 26
Financial and Corporate Information 29
*While these ratings do not apply to the safety or investment performance of the Separate Account investment alternatives available under Mutual of
America’s products, they do reflect Mutual of America’s ability to fulfill its General Account obligations, which include its obligations under the Interest
Accumulation Account, annuity purchase rate guarantees and annuity benefit payouts, as well as life insurance and disability income payments. Third-
party ratings are subject to change. For the complete reports, please visit mutualofamerica.com/ratings.
A+ (Superior) A.M. BeSt (as of February 2011)*“The rating reflects Mutual of America Life Insurance Company’s prominent market position in the small to medium-size not-for-profit annuity and pension sectors, conservative investment management approach, strong absolute and risk-adjusted capitalization, and strong asset/liability management.”
AA– (Very Strong) StAndArd & Poor’S® (as of October 2011)*“Mutual of America’s salaried sales force, based in regional field offices strategically located in major cities across the country, focuses on building long-term relationships with its customer base. ... We believe cultivating and maintaining these strong relationships, while requiring higher levels of investment, continues to differentiate Mutual of America through high-touch customer service.”
AA– (Very Strong) fitch (as of November 2011)* “Mutual of America’s rating continues to be based on the company’s extremely strong balance sheet fundamentals.”

2011 Selected Financial Data
December 31 ($ in Millions) 2011 2010 % Change
Premiums* 1,552.8 1,674.9 (7.3)%
Net Income 46.5 16.8 176.8
General Account Assets 7,604.6 7,190.4 5.8
Separate Account Assets 5,899.9 6,471.4 (8.8)
Total Assets 13,504.5 13,661.8 (1.2)
Total Surplus (including Asset Valuation Reserve) 895.5 872.9 2.6
Surplus Ratio** 11.8% 12.1%
mutual oF america
* Decline primarily due to 2010’s results including approximately $100 million from the one-time successful
acquisition of five very large Thrift plans.
** Total Surplus as a percentage of General Account Assets

Here and around the world, 2011 was a year of tremendous economic uncertainty and market volatility. The global economy is still grappling with the aftereffects of the investment and lending practices that led to the financial crisis of 2008. While there have been hints recently of a slow economic recovery at home, the future remains uncertain for the millions of Americans who have lost their jobs and their homes over the last three years.
Mutual of America has served the retirement savings needs of Americans for over 65 years during all kinds of economic markets and cycles. Our prudent, long-term approach to investing and managing our Company has prepared us to weather the recent economic turbulence successfully. When global markets experienced extreme volatility following Standard & Poor’s® downgrade of the United
Letter from Thomas J. Moran
Chairman, President and
Chief Executive Officer
States’ long-term credit rating in August, Mutual of America was once again well served by our high quality portfolio and very strong surplus position. At the close of 2011, our total surplus stands at $895.5 million, and our surplus ratio is over 11%—clear measures of our ongoing ability to meet our obligations to our customers.
The strong ratings we again received from the major independent rating agencies in 2011 reflect the financial strength of Mutual of America’s General Account and the Company’s prudent General Account investment policies.1 Our General Account investment strategy of maintaining high quality assets with excellent liquidity, strong capital adequacy and a proper matching of assets and liabilities places Mutual of America among the strongest of all life insurance companies in the United States today. Both Standard & Poor’s® and Fitch Ratings affirmed

Mutual of America’s AA- (Very Strong) rating and have a stable outlook on the Company. In addition, A.M. Best affirmed our financial strength rating of A+.
Our financial strength allows us to invest in enhancements to our products and services that offer real value to our customers. Many companies make online service the principal way they do business, cutting staff to improve their bottom line. While we continue to enhance and expand our online capabilities, we have also invested in our onsite services, adding staff in all of our Regional Offices, including Participant Account Representatives to help participants become better informed about saving for retirement.
When markets are as volatile as they have been, it is not uncommon for individuals to respond by
making short-term decisions that can become long-term investment mistakes. Participant Account Representatives meet with employees in groups and one-on-one to help them understand the saving and investment choices available under the retirement plan. These educational efforts, supported by the extensive educational materials we make available online and in print, help our customers understand how to create a retirement savings strategy that reflects their goals and time horizon, rather than simply reacting to short-term market fluctuations.
As you will read in this Annual Report, our customers are extraordinarily pleased with the onsite, individual service our representatives provide at both the plan administrator and participant level. Employers understand that it’s not enough to provide a retirement plan; their
M u T u A l o f A M e R I C A 2 0 1 1 A N N u A l R e P o R T • P A G e 3

Total Assets (In Billions)
General Account Separate Account
2010
$7.191 $6.471 $13.662
2011
$7.605 $5.899 $13.504

good of society. These are Mutual of America’s founding values—the spirit of America that we celebrate and embrace.
Each of us is responsible for helping to create a better future. I have complete confidence in America’s values and strength—not just to set right our economy, but to keep our commitment to future generations. At Mutual of America, we will continue to do our part to help ensure that Americans are financially prepared for the future.
Thomas J. MoranChairman, President and
Chief Executive Officer
employees need sound investment choices and investment education to make well-informed decisions for their financial future. Employers and employees alike continue to put their trust in us, confident in our long history of stability, prudence and commitment to their well-being.
This year has been a time for reflection as we marked the 10th anniversary of the 9/11 attack. We will always remember September 11, 2001, as a time of sorrow overcome by the love we have for our country. 2011 has also been a year of great challenges. While some have focused on the divisions within our society, I see much that unites us. This country remains unique in the hope and opportunity it offers its people and for the values we share—service, strength, leadership and innovation, trust and a willingness to care and work for the greater
“Individuals need sound investment choices and investment education to make well-informed decisions for their financial future.”
M u T u A l o f A M e R I C A 2 0 1 1 A N N u A l R e P o R T • P A G e 5

Brian Severin
Senior Field Vice President
Mutual of America
Los Angeles Regional Office
Gus Valdespino
President and CEO
Valley Presbyterian Hospital
Van Nuys, California
“Mutual of America has been a phenomenal partner for us.”

In these challenging economic times, employers who can help their employees’ efforts to achieve a more secure financial footing and to build towards a solid retirement will see greater job satisfaction, dedication and loyalty—the building blocks of successful organizations.
“Mutual of America has been a phenomenal partner for us—it’s almost as if their representatives have become an extension of our human resource department,” says Gus Valdespino, President and CEO of Valley Presbyterian Hospital in Van Nuys, C.A. “They’ve met with every employee—not just in groups, but individually—to explain the features of the retirement plan and the importance of contributing. As a result of their efforts, there’s a lot more confidence in the retirement plan and in the administration; participation has spiked; morale is through the roof. From a satisfied, confident group of employees, I get a more satisfied patient at the hospital.”
Mutual of America’s teams of trained, salaried representatives work within reach of all of our customers, providing the personal, one-on-one service that distinguishes our Company. Our Participant Account Representatives,
serviceGus Valdespino and Brian Severin
M u T u A l o f A M e R I C A 2 0 1 1 A N N u A l R e P o R T • P A G e 7

working from each of our 36 Regional Offices, educate individuals about the importance of financial preparedness and help them take steps to achieve it. They meet with employees in groups and individually to answer their questions, walk them through the enrollment process and provide the information that will help them devise a savings strategy tailored to their particular goals and circumstances. And when those goals and circumstances change, we’re there to educate them on how to best achieve their future financial security.
Our onsite approach to education provides opportunities for learning for employees from all levels and backgrounds within an organization— from younger workers who are looking to become more financially literate, to individuals who are ready to make decisions about their life in retirement.
Our representatives help employees make lasting changes in the way they manage their finances, giving rise to a greater sense of personal and financial well-being. By offering our quality retirement products, with their carefully chosen and competitive investment alternatives, online financial tools and individual support, organizations demonstrate their commitment to their employees’ future, helping to build and retain a dedicated, energized group of employees.
“ They’ve met with every employee—not just in groups, but individually.”
M u T u A l o f A M e R I C A 2 0 1 1 A N N u A l R e P o R T • P A G e 8

“Brian always has a good story to put everyone at ease.” —Gus

James Fergusson
Senior Field Vice President
Mutual of America
Southfield Regional Office
Karen Schrock, M.S.
President and CEO
Adult Well-Being Services
Detroit, Michigan
“These are challenging times to run a nonprofit.”

Many Americans wouldn’t be saving at all if it weren’t for their workplace retirement plans. Yet when individuals are focused on meeting daily expenses, they often neglect to plan for their future. Mutual of America works closely with employers to ensure they have a plan in place that meets the needs of their organization and their employees.
“These are challenging times to run a nonprofit,” says Karen Schrock, executive director of Adult Well-Being Services (AWBS) in Detroit, Michigan. “Detroit has been hit hard by the collapse of both the auto industry and the housing market. Cutbacks in government spending have had a big effect. I’m constantly on the road negotiating contracts for our organization. I rely on Mutual of America’s remarkable service to help me improve our employees’ chances to achieve financial security in these insecure times.”
AWBS relied on Mutual of America to help increase enrollment in its plan and encourage employees to save. Our team of local representatives met with AWBS employees at their ten locations
leadershipKaren Schrock and James Fergusson
M u t u a l o f a M e r i c a 2 0 1 1 a n n u a l r e p o r t • p a g e 1 1

throughout Detroit to explain the provisions of the plan, the advantages of tax-deferred investing and the interest and investment options available to them. As a result, participation rose from 50% to 90%.
In addition to helping with employee enrollment, our representatives provide comprehensive administrative support to help employers meet their fiduciary responsibilities and keep their plans in compliance with ever-changing government regulations. Our comprehensive plan services eliminate the need for third-party administrators and include the preparation of plan documents, online recordkeeping, communications and educational materials, and an online Form 5500 and nondiscrimination testing platform for certain plans. We also work extensively with 403(b) clients to provide them with information they need to successfully comply with new audit requirements.
The plans we offer are competitively priced. And, unlike many of our competitors, we don’t charge start-up fees, conversion fees, commissions or any surrender or withdrawal fees.2 For small and mid-size organizations, our exceptional personal service and competitive fees are invaluable, allowing employers to focus on their mission while doing all they can to help their employees save for retirement.
“ I rely on Mutual of America’s remarkable service to help me improve our employees’ chances to achieve financial security in these insecure times.”
M u T u A l o f A M e R I C A 2 0 1 1 A N N u A l R e P o R T • P A G e 1 2

“I really enjoy my time with Jay. He cares about our people.” —Karen

Melisa Beauchesne
Participant Account Representative
Mutual of America
Rochester Regional Office
Chris Greene
Eastern Market Manager
Ray Sands Glass
Rochester, New York
“I worry about losing money in the market.”

The market volatility of the last few years has scared many individuals away from investing—particularly younger employees, who are building careers in one of the rockiest economic environments our country has ever known. “I have family members delaying retirement because of the hit their retirement savings took recently,” says Chris Greene, sales manager at Ray Sands Glass in Rochester, N.Y. “I worry about losing money in the market. I don’t want to work till I’m 70.”
Chris’s fears are understandable. But at 35, shying away from equity investments may be as risky in the long term as investing too aggressively may be for someone nearing retirement.
From our prudent investment philosophy to our dedication to personal service, our mission is to help individuals like Chris devise a strategy to build and preserve assets for a financially secure future. Our group annuity contracts make available an Interest Accumulation Account, as well as 35 Separate Account investment funds that offer suitable choices for individuals of every age and risk tolerance level—whether they prefer to actively manage their retirement plan portfolio or to take a less active role by choosing investment alternatives managed by an investment professional.
We favor funds that offer consistent performance over the long term as the most appropriate way for individuals to build their retirement savings.
trustChris Greene and Melisa Beauchesne
M u T u A l o f A M e R I C A 2 0 1 1 A N N u A l R e P o R T • P A G e 1 5

Each of our investment funds is carefully screened and consistently monitored to ensure that it does not bear such a high degree of risk that it is unsuitable for retirement investing.
Participants who prefer not to construct their own mix of investments can select our target-date Retirement Funds, Allocation Funds and several other balanced funds. Those who wish to avoid market risk entirely can opt for the Interest Accumulation Account of our General Account, which credits a specified, competitive rate of interest along with a guarantee of principal.3
The range and quality of our investment offerings and our emphasis on personal service go hand in hand. All of the investment options available through our products offer opportunities for growth, but there is no one-size-fits-all approach to financing one’s future. That’s why it’s so valuable to have a trusted Mutual of America representative to help explain these options, particularly when markets are volatile.
Luckily, Chris can turn to Melisa Beauchesne, our Participant Account Representative in Rochester, New York, who is helping him become a more confident, secure and disciplined investor. “It’s good to know I can ask Melisa for the five-minute rundown—‘What’s happening now? Am I still on track?’ I have another account I’m rolling into Mutual of America. The other company sends me material, but I never read it. With Melisa, I have someone I can go to and get answers to my questions.”
“ I don’t know much about investing, so it’s good to know I can ask Melisa for the five-minute rundown.”
M u T u A l o f A M e R I C A 2 0 1 1 A N N u A l R e P o R T • P A G e 1 6

“I have a lot of confidence in Mutual of America.” —Chris

Lea Starr
Associate Account Executive
Mutual of America
Dallas Regional Office
Kelley Kim
Senior Accountant
The Gibraltar Group, Inc.
Dallas, Texas
“I love Mutual’s website.”

With individuals increasingly responsible for making their own investment decisions for retirement, financial literacy is critical. Our website gives individuals the tools to learn about investing and effortlessly manage their retirement accounts whenever they find the time. For busy parents with full-time jobs, like Kelley Kim, that might be at midnight.
“I like to do research on my own,” says Kelley Kim, an accountant at Gibraltar Group. “I love Mutual’s website; I can go online anytime and check how the market is doing, how my investments are doing and change my investments if I want to. And when I have questions, I can call Lea and get answers.”
Our customers appreciate the clearly displayed account information and easy navigation that mutualofamerica.com affords. They can go online to transfer assets and change their allocations; learn about the objectives of the funds available through our annuity contracts; track fund performance over 1-, 3-, 5- and 10-year periods; check their personal rate of return and year-to-date contributions as well as estimate their future financial needs with our online calculators.
innovationKelley Kim and Lea Starr
M u T u A l o f A M e R I C A 2 0 1 1 A N N u A l R e P o R T • P A G e 1 9

For plans that permit their participants to take loans, participants can apply for a loan online and monitor payment activity at their convenience. Those who wish to save more, or transfer or roll over assets from another plan, can apply online for a Mutual of America IRA, including our new Inherited IRA. Also new this year, participants can schedule automatic contributions to an IRA or FPA from external accounts.
Studies show that financial literacy has an important effect on financial preparedness in retirement.4 Our website is one part of our comprehensive approach to education, which takes into account individual preferences in the ways people want their information and frame their choices. We’re helping individuals take control of their personal finances to ensure they’re prepared for retirement.
“I’ve seen from my parents what it means to retire without any savings, so I make saving for retirement my first priority,” says Kelley. “I’m very far from having enough saved. But I know what to do and how to do it. With Mutual of America, I have a plan and a way to get there.”
“ I can go online anytime and check how the market is doing, how my investments are doing and change my investments if I want to.”
M u T u A l o f A M e R I C A 2 0 1 1 A N N u A l R e P o R T • P A G e 2 0

“With Mutual of America, I have a plan and a way to get there.” —Kelley

the nation

al 9.11 f lag

Mutual of America’s founding mission to provide retirement plan services to nonprofit organizations has always been a source of pride for us. In helping people who dedicate their lives to helping others, we see ourselves as part of a tradition of service, responsibility and caring that makes our country strong.
Our commitment to nonprofits goes beyond providing quality retirement plans. In 2011, virtually every Mutual of America employee participated in charitable events and voluntary giving, both individually and with coworkers in bike-a-thons, marathons, bake sales and toy drives. The Company supports their efforts through matching contributions, grants and gifts to hundreds of charitable organizations.
Since 1996, the Mutual of America Community Partnership Award has honored the contributions that nonprofit organizations, in partnership with public, private and other social sector organizations, make to society. In 2011 and hereafter, the award bestowed on the national award winner will be named the Governor Hugh L. Carey Award, in honor of the late governor of New York, a long-standing member of the Mutual of America Foundation Community Partnership Award Selection Committee, who helped guide the selection of Community Partnership Award recipients.
caringCommunity Building

The winner of the 2011 Governor Hugh L. Carey Award is College Possible, a highly successful partnership in Minnesota that helps economically disadvantaged high school students navigate the college admissions process and continues to work with them in college. In addition, nine other remarkable partnerships were honored for their outstanding service to their communities.
A strong democracy is built on the open exchange of ideas. To that end, we continue to support the award-winning weekly Public Broadcasting System (PBS) series Religion and Ethics Newsweekly, as well as the PBS newsmagazine Need to Know.
Service to our customers and to the larger community in which we live are the values that have kept our Company strong since our founding in 1945 and continue to guide us going forward. Mutual of America’s advertising campaign, The Spirit of America, reflects our country’s proud heritage and our commitment to do our utmost to help Americans achieve a financially secure future.
Destroyed in the
aftermath of the World
Trade Center attacks
on September 11, The
National 9/11 flag is a
testament to service,
sacrifice and our
country’s ability to
overcome historic
challenges by working
together. With the
support of Mutual of
America and other
companies and
individuals, The
National 9/11 flag has
travelled across
America, where local
service heroes stitched
it back to its original
13-stripe format, using
pieces of retired
American flags from all
50 states. At each stop
on its journey, the
flag has brought
communities together
to pay tribute to our
military veterans, first
responders, educators,
volunteer service
leaders and those who
lost loved ones on 9/11.
The National 9/11 flag
will become a part of
the permanent
collection of the
National September 11
Memorial Museum
being built at the
World Trade Center.
M u T u A l o f A M e R I C A 2 0 1 1 A N N u A l R e P o R T • P A G e 2 5

thomas J. moranChairman, President and Chief Executive Officer Mutual of AmericaNew York, New York
elie WieselAndrew W. Mellon Professor in the Humanities Boston University Boston, Massachusetts
Founder, The Elie Wiesel Foundation for Humanity; Nobel Laureate New York, New York
roselyn P. epps, m.D.Medical and Public Health Consultant Washington, D.C.
robert J. mcGuire,
esq.CounselNew York, New York
roger B. Porter,
Ph.D.IBM Professor of Business and Government Harvard UniversityCambridge, Massachusetts
General
Dennis J. reimerU.S. Army (Retired);National Security ConsultantArlington, Virginia
Peter J. PowersChairman and Chief Executive Officer Powers Global Strategies, LLCNew York, New York
Senator
connie mackPartner Liberty Partners Group Washington, D.C.
Chairman Emeritus H. Lee Moffitt Cancer Center & Research InstituteTampa, Florida
earle H. Harbison, Jr.Chairman Harbison Corporation St. Louis, Missouri
Kimberly casianoPresident Kimberly Casiano & Associates Inc.San Juan, Puerto Rico
clifford l.
alexander, Jr.President Alexander & Associates, Inc. Washington, D.C.
John r. GreedSenior Executive Vice President and Chief Financial OfficerMutual of AmericaNew York, New York
Mutual of AmericaBoard of Directors

laSalle D. leffall,
Jr., m.D.Charles R. Drew Professor of Surgery Howard University College of Medicine Washington, D.C.
Frances r. HesselbeinPresident and Chief Executive Officer The Frances Hesselbein Leadership Institute New York, New York
maurine a. HaverPresident Haver Analytics, Inc.New York, New York
Patrick a. BurnsConsultant to the Board of Mutual of AmericaBronxville, New York
Election of Directors
Mutual of America policyholders and contract holders are entitled to participate in the election of Directors. The election is held each year on a designated working day in April. In 2012 the election of Directors is scheduled for Thursday, April 26, 2012, between 10:00 a.m. and 4:00 p.m., at the Home Office, 320 Park Avenue, New York, NY 10022. At each election, approximately one-third of the Directors are elected for terms of three years.
Each policyholder and contract holder whose policy or contract has been in force for one year prior to the date of election is entitled to one vote per person to be cast in person, by mail or by proxy. Pursuant to Section 4210 of the New York Insurance Law, groups of policyholders or contract holders have the right to nominate one or more independent tickets not less than five months prior to the date of each election. Mail ballots may be obtained by writing to the Corporate Secretary at Mutual of America’s Home Office address, no later than 60 days prior to the date of election.
M u T u A l o f A M e R I C A 2 0 1 1 A N N u A l R e P o R T • P A G e 2 7

mutual oF america caPital manaGement
corPoration
Mutual of AmericaBoards of Directors
amir learChairman and Chief Executive Officer Mutual of America Capital Management Corp. New York, New York
theresa a. BischoffChief Executive Officer (Past) American Red Cross in Greater New York New York, New York
noreen culhaneExecutive Vice President (Past) New York Stock Exchange New York, New York
robert X. chandlerDevelopment Director (Past) Archdiocese of Boston Boston, Massachusetts
nathaniel a. DavisManaging Director RANND Advisors Oakton, Virginia
robert c. GoldenExecutive Vice President of Corporate Operations (Past)Prudential Financial, Inc.Newark, New Jersey
christopher c. QuickVice Chairman, Global Wealth and Investment Management (Past) Bank of America New York, New York
James e. QuinnPresident (Past) Tiffany & CompanyNew York, New York
alfred e. Smith iVChairman of the Board (Past) Saint Vincent Catholic Medical CentersNew York, New York
John J. StackChairman and Chief Executive Officer (Past) Ceska Sporitelna Prague, Czech Republic
John r. GreedChairman of the Board President and Chief Executive Officer Mutual of America Investment Corporation and Mutual of America Institutional Funds, Inc.New York, New York
carolyn n. DolanFounding principal and Portfolio ManagerSamson Capital Advisors, Inc. New York, New York
Kevin m. KearneyPartner Wingate, Kearney & Cullen Brooklyn, New York
laSalle D. leffall iiiPresident and Founder, LDL Financial, LLC Washington, D.C.
John W. SibalPresident and Chief Executive Officer Eustis Commercial Mortgage Corporation New Orleans, Louisiana
margaret m. SmythVice President, Finance and Chief Financial Officer (Past) Hamilton Sundstrand Windsor Locks, Connecticut
William e. WhistonChief Financial Officer, Archdiocese of New YorkNew York, New York
Patrick J. Waide, Jr.President (Past), Drucker Foundation New York, New York
mutual oF america inVeStment corPoration
mutual oF america inStitutional FunDS, inc.

Statement by Management 30
Consolidated Statutory Statements of Financial Condition 3 1
Consolidated Statutory Statements of Operations and Surplus 32
Consolidated Statutory Statements of Cash Flows 33
Notes to Consolidated Statutory Financial Statements 34
Report of Independent Registered Public Accounting Firm 54
Officers 55
Regional Offices 57
Financial anD corPorate inFormation
M u T u A l o f A M e R I C A 2 0 1 1 A N N u A l R e P o R T • P A G e 2 9

Statement by management
Management is responsible for the integrity of the accompanying consolidated statutory financial statements. In meeting this responsibility, management maintains systems of internal controls designed to provide reasonable assurance that assets are safeguarded and that transactions are executed in accordance with appropriate authorization and are properly recorded. These systems include an organizational structure that appropriately provides for delegation of authority and division of responsibility, the communication and enforcement of accounting and business policies and procedures and the utilization of an internal audit program that requires responsive action to audit findings.
The accompanying consolidated financial statements have been prepared by management in conformity with statutory accounting principles prescribed or permitted by the New York State Department of Financial Ser-vices. Such practices differ from U.S. generally accepted accounting principles (GAAP).
Since the New York State Department of Financial Services recognizes only statutory accounting practices for determining and reporting financial condition and results of operations of insurance companies, and no consideration is given to GAAP financial information, the accompanying consolidated statutory financial state-ments present the Company’s consolidated financial position and results of operations in conformity with statu-tory accounting practices prescribed or permitted by the New York State Department of Financial Services. The significant variances between such practices and GAAP are described in Note 9 to the consolidated statutory financial statements, which is included on pages 52-53.
The accompanying consolidated statutory financial statements for the years ending December 31, 2011 and 2010 have been audited by KPMG LLP, and their opinion, which states that the accompanying consolidated statutory financial statements are fairly presented in conformity with accounting practices prescribed or permitted by the New York State Department of Financial Services, is included on page 54. Their audits were performed in accor-dance with the standards of the Public Company Accounting Oversight Board (United States).
The Board of Directors has appointed an Audit Committee composed solely of directors who are not officers or employees. The committee meets regularly with management, the Executive Vice President and Internal Au-ditor and the independent registered public accounting firm to review audit scope and results, the adequacy of internal controls and accounting and financial reporting matters. The Audit Committee also reviews the services performed by the independent registered public accounting firm and related fee arrangements and recommends their appointment to the Board of Directors. The independent registered public accounting firm and the Execu-tive Vice President and Internal Auditor have direct access to the Committee.

M u t u a l o f a M e r i c a 2 0 1 1 a n n u a l r e p o r t • p a g e 3 1
2011 2010
ASSETSGeneral Account assets Bonds and notes $ 6,997,640,298 $ 6,572,702,783 Common stocks 44,784,304 41,444,347 Cash and short-term investments 7,127,969 18,104,455 Guaranteed funds transferable 30,338,989 35,970,904 Mortgage loans 1,262,625 1,773,231 Real estate 253,146,871 255,071,606 Policy loans 101,251,111 96,584,804 Investment income accrued 86,554,296 87,714,814 Deferred federal income taxes 64,330,201 61,500,402 Other assets 18,175,759 19,474,812
Total General Account assets 7,604,612,423 7,190,342,158
Separate Account assets 5,899,846,871 6,471,430,662
TOTAL ASSETS $13,504,459,294 $13,661,772,820
LIABILITIES AND SURPLUSGeneral Account liabilities Insurance and annuity reserves $ 6,434,183,841 $ 6,088,492,384 Other contract holders liabilities and reserves 11,705,941 10,669,244 Interest maintenance reserve 121,021,902 109,488,765 Other liabilities 142,160,266 108,749,682
Total General Account liabilities before asset valuation reserve 6,709,071,950 6,317,400,075
Separate Account reserves and other liabilities 5,899,846,871 6,471,430,662
Total liabilities before asset valuation reserve 12,608,918,821 12,788,830,737
Asset valuation reserve 49,398,157 38,294,357
Total liabilities 12,658,316,978 12,827,125,094
SURPLUS Assigned surplus 1,150,000 1,150,000 Unassigned surplus 844,992,316 833,497,726
Total surplus 846,142,316 834,647,726
TOTAL LIABILITIES AND SURPLUS $13,504,459,294 $13,661,772,820
See accompanying notes to consolidated statutory financial statements.
COnSOLIDateD StatUtORy StatementS OF FInanCIaL COnDItIOn
December 31, 2011 and 2010

COnSOLIDateD StatUtORy StatementS OF OPeRatIOnS anD SURPLUS
For the years ended December 31, 2011 and 2010
2011 2010
INCOME Premium and annuity considerations $1,538,892,743 $1,661,747,896 Life and disability insurance premiums 13,886,053 13,146,574
Total considerations and premiums 1,552,778,796 1,674,894,470
Separate Account investment and administrative fees 65,094,291 53,150,823 Net investment income 377,268,689 375,784,317 Other, net 6,246,114 7,275,271
Total income 2,001,387,890 2,111,104,881
DEDUCTIONS Change in insurance annuity reserves (89,458,988) 399,572,896 Annuity and surrender benefits 1,800,587,572 1,448,781,003 Death and disability benefits 10,712,145 12,315,225 Operating expenses 233,615,612 233,793,473
Total deductions 1,955,456,341 2,094,462,597
Net gain before dividends 45,931,549 16,642,284
Dividends to contract holders and policyholders (63,478) (143,091)
Net gain from operations 45,868,071 16,499,193
Federal income tax (expense) (3,588,525) (623,249)
Net realized capital gains 4,180,014 876,550
Net income 46,459,560 16,752,494
Surplus Transactions Change in: Asset valuation reserve (11,103,800) 1,701,164 Unrealized capital (losses), net (6,332,697) (4,890,964) Non-admitted assets and other, net 14,903,373 11,859,376 Minimum pension liability (38,169,000) 4,601,000 Net deferred income tax asset 2,348,842 2,954,915 Incremental increase in net deferred income tax asset 3,388,312 4,764,918
Net change in surplus 11,494,590 37,742,903 Surplus Beginning of year 834,647,726 796,904,823
End of year $ 846,142,316 $ 834,647,726
See accompanying notes to consolidated statutory financial statements.

M u t u a l o f a M e r i c a 2 0 1 1 a n n u a l r e p o r t • p a g e 3 3
COnSOLIDateD StatUtORy StatementS OF CaSH FLOWS
For the years ended December 31, 2011 and 2010
2011 2010
CASH FLOWS FROM OPERATIONS Premium and other income collected $ 1,552,787,943 $ 1,674,909,131 Net investment income 370,030,699 353,598,789 Separate Account investment and administrative fees 70,195,255 53,150,823 Benefit payments (1,814,145,531) (1,469,601,467) Net transfers (to) from separate accounts 462,476,673 (74,254,959) Investment and operating expenses paid (192,926,103) (222,272,452) Other, net — 7,466,620 Dividends paid to policyholders (152,837) (308,858)
Net cash from operations 448,266,099 322,687,627
CASH FLOWS FROM INVESTMENTSProceeds from investments sold, matured or repaid: Bonds 1,887,900,195 2,359,564,118 Common stock 5,974,389 48,843,683 Mortgage loans 510,606 470,320 Real estate 8,643,974 8,481,638 Other invested assets 5,631,915 5,652,805 Other 2,033,693 2,014,554
Total 1,910,694,772 2,425,027,118
Costs of investment acquired: Bonds (2,314,295,326) (2,638,243,543) Common stock (6,468,153) (1,876,746) Real estate (6,719,237) (3,990,940) Other - (2,591,494)
Total (2,327,482,716) (2,646,702,723)
Net change in policy loans (4,669,206) (5,177,650)
Net cash used in investment activity (421,457,150) (226,853,255)
CASH FLOW FROM FINANCING AND OTHER SOURCES Net withdrawals on deposit-type contracts (41,144,669) (101,428,940) Other cash applied 3,359,234 8,294,304
Net cash applied from financing and others sources (37,785,435) (93,134,636)
Net change in cash, cash equivalents and short-term investments (10,976,486) 2,699,736
Cash, cash equivalents and short-term investments: Beginning of year 18,104,455 15,404,719
End of year $ 7,127,969 $ 18,104,455
See accompanying notes to consolidated statutory financial statements.

nOteS tO COnSOLIDateD StatUtORy FInanCIaL StatementS
December 31, 2011 and 2010
1. SUMMARY OF SIGNIFICANT ACCOUNTING POLICIES
PrinciPles of consolidation
The accompanying financial statements include the consolidated accounts of Mutual of America Life Insurance Company (“Mutual of America”) and its wholly owned subsidiaries (collectively referred to as the “Company”), as permitted by the New York State Department of Financial Services (formerly known as the State of New York Insurance Department). Significant intercompany balances and transactions have been eliminated in consolidation.
nature of oPerations
Mutual of America provides retirement and employee benefit plans in the small to medium-size company mar-ket, principally to employees in the not-for-profit social health and welfare field. In recent years, the Company has expanded to include for-profit organizations in the small to medium-size company market. The insurance company in the group is licensed in all 50 states and the District of Columbia. Sales operations are conducted primarily through a network of regional offices staffed by salaried consultants.
Basis of Presentation
The accompanying financial statements are presented in conformity with statutory accounting practices pre-scribed or permitted by the New York State Department of Financial Services (“New York Department”). Such practices differ from U.S. generally accepted accounting principles (“GAAP”). The significant variances between such practices and GAAP are described in Note 9. The ability of the Company to fulfill its obligations to contract holders and policyholders is of primary concern to insurance regulatory authorities.
The National Association of Insurance Commissioners (“NAIC”) has codified statutory accounting principles (“Codification”). The New York Department issued Regulation No. 172 (“Regulation No. 172”), which adopted Codification, with certain significant modifications, as the prescribed basis of accounting for its domestic insur-ers. Periodically, the New York Department amends Regulation No. 172 for revisions in the prescribed basis of accounting. All changes required by New York Regulation No. 172, as amended through December 31, 2011, are reflected in the accompanying consolidated statutory financial statements.
During 2010, Regulation No. 172 was amended to adopt the accounting change and new disclosure require-ments set forth in Statement of Statutory Accounting Principles No. 100 titled “Fair Value Measurements” (“SSAP No. 100”) under which the criteria used to determine the fair value of certain types of investment securities was changed. As a result of this change, the Company recorded an $11.7 million unrealized loss to adjust the carrying value of four loan-backed securities in its portfolio to their estimated current fair value. These bonds had an adjusted book value of $27.5 million prior to the recognition of this unrealized loss. SSAP No. 100 also established the valuation hierarchy for measuring fair value and established disclosure require-ments about fair value. At December 31, 2011 and 2010, the Company elected to disclose the inputs used to determine fair value for all of its assets that are considered financial instruments and not just those financial instruments required to be reported at fair value in the Statement of Financial Condition as required under SSAP No. 100.
M u t u a l o f a M e r i c a 2 0 1 1 a n n u a l r e p o r t • p a g e 3 5
The preparation of financial statements requires management to make estimates and assumptions that affect the reported amounts of assets and liabilities and the disclosure of contingent liabilities at the date of the finan-cial statements, and the reported amounts of income and deductions during the reporting period. Actual results could differ from these estimates.
asset Valuations
Bonds, Notes and Short-Term Investments — Investment valuations are prescribed by the NAIC. Bonds, which include asset-backed and mortgage-backed investments qualifying for amortization, and notes, are stated at amortized cost. Amortization of bond premium or discount is calculated using the constant yield interest method taking into consideration specified interest and principal provisions over the life of the bond. Short-term investments are stated at cost, which approximates fair value, and consist of highly liquid investments purchased with maturities of one year or less. Bond, note and short-term investment transactions are recorded on a trade date basis. The fair value of bonds and notes is based upon quoted market prices provided by an in-dependent pricing organization. If quoted market prices are unavailable or an inactive market for the security currently exists, fair value is estimated using internal valuation models and techniques or based upon quoted market prices for comparable investments. At December 31, 2011, there were five securities with a fair value of $26.9 million for which no quoted market prices were available. As such, the Company used internal valuation models and techniques to determine the fair value of these securities. The Company recorded an unrealized loss of $5.1 million during 2011 to adjust the carrying value of these five securities, which were required to be reported at the lower of amortized cost or fair value, to their current fair value at December 31, 2011. At December 31, 2010, there were several securities with a fair value of $38.2 million that were valued using this methodology. Bonds, where the NAIC rating has fallen to class six and the fair value is below amortized cost, are carried at the lower of amortized cost or fair value.
On December 31, 2011, the rating of one asset-backed security with a book value of $12.0 million was lowered to an NAIC class six, which requires that the security be reported at the lower of amortized cost or fair value. While the results of the valuation testing determined that this security did not have an other than temporary credit impairment, a $7.7 million interest-rate related loss was recorded to adjust this security to its estimated fair value at December 31, 2011 and was accounted for as a realized capital loss charged to the Interest Maintenance Reserve (“IMR”). Given the current inactivity for this security, its fair value was estimated using internal valuation models and techniques.
Losses that are considered to be other than temporary are recognized in net income when incurred. All bonds are subjected to the Company’s quarterly review process for identifying other than temporary impairments. This impairment identification process utilizes a screening procedure that includes all bonds in default or not in good standing, as well as bonds with a fair value that is less than 80% of their cost for a continuous six-month period. The Company writes down bonds that it deems to have an other than temporary impairment after considering a wide range of factors, including, but not limited to, the extent to which cost exceeds fair value, the duration of that market decline, an analysis of the discounted estimated future cash flows for asset-backed and mortgage-backed securities, an analysis of the financial health and specific prospects for the issuer, the likeli-hood that the Company will be able to collect all amounts due according to the contractual terms of the debt security in effect at the date of acquisition, consideration as to whether the decline in value is due to general

nOteS tO COnSOLIDateD StatUtORy FInanCIaL StatementS
December 31, 2011 and 2010
changes in interest rates and credit spreads and the Company’s intent and ability to retain its investment in the issuer for a period of time sufficient to allow for any anticipated recovery in fair value. Effective January 1, 2010, if an impairment is determined to be other than temporary, a realized capital loss equal to the entire difference between the amortized cost of the bond and its fair value is recorded and a new cost basis for the bond is estab-lished. Credit-related other-than-temporary impairment losses are recorded as realized capital losses included in net income (and through the asset valuation reserve), whereas interest-related other-than-temporary impair-ment losses are recorded in the IMR.
Common and Preferred Stocks — At December 31, 2011 and 2010, common stocks include $34.8 million and $34.5 million, respectively, invested in a sponsored series of mutual funds for institutional investors. The Decem-ber 31, 2011 and 2010, amounts also include $3.3 million, in each year, invested in an actively managed Mid-Cap Growth equity portfolio. Common stocks in good standing are stated at fair value. Fair value is determined by reference to valuations quoted by an independent pricing organization. Unrealized gains and losses are recorded directly to unassigned surplus. Preferred stock is carried at cost. During 2010, the preferred stock owned by the Company was called by its issuer and redeemed at par. A loss of $.1 million was recognized on this transaction.
Losses that are considered to be other than temporary are recognized in net income when incurred. All equity investments are subjected to the Company’s quarterly review process for identifying other-than-temporary impairments. This impairment identification process utilizes a screening procedure that includes all common stock issuers not in good standing, as well as common stocks where the fair value is less than 80% of their cost for a continuous six-month period. The Company writes down common stocks that it deems to have an other-than-temporary impairment after considering a wide range of factors, including, but not limited to, the extent to which cost exceeds fair value, the duration of that market decline, an analysis of the financial health and specific prospects for the issuer and the Company’s intent and ability to retain its investment for a period of time sufficient to allow for any anticipated recovery in fair value in the short-term. The Company also considers other qualitative and quantitative factors in its evaluation of other-than-temporary impairments.
Guaranteed Funds Transferable — Guaranteed funds transferable consists of funds held with a former rein-surer and is stated at the total principal amount of future guaranteed transfers to Mutual of America, net of a $1.5 million unrealized loss that was recorded as a direct reduction to unassigned surplus. No additional losses were recorded on this investment during 2011 and 2010.
Mortgage Loans — Mortgage loans are carried at amortized indebtedness. Impairments of individual loans that are considered other than temporary are recognized in net income when incurred. There were no impairment losses incurred during 2011 and 2010.
Real Estate — Real estate, which is classified as Company-occupied property, is carried at cost, including capital improvements, net of accumulated depreciation of $148.8 million and $140.2 million at December 31, 2011 and 2010, respectively, and is depreciated on a straight-line basis over 39 years. Tenant improvements on real estate investments are depreciated over the shorter of the lease term or the estimated life of the improvement.

M u t u a l o f a M e r i c a 2 0 1 1 a n n u a l r e p o r t • p a g e 3 7
Policy Loans — Policy loans are stated at the unpaid principal balance of the loan. There were no losses recog-nized during 2011 and 2010.
Other Assets — Certain other assets, such as net deferred income tax assets not expected to be realized within three years, furniture and fixtures and prepaid expenses, are considered “nonadmitted assets” and are excluded from the consolidated statutory statements of financial condition.
insurance and annuity reserVes
Reserves for annuity contracts are computed on the net single premium method and represent the estimated present value of future retirement benefits. These reserves, which were $.9 billion at both December 31, 2011 and 2010, are based on mortality and interest rate assumptions (ranging predominately from 5.00% to 6.50% at both December 31, 2011 and 2010), which meet or exceed statutory requirements and are not subject to discretionary withdrawal.
Reserves for contractual funds not yet used for the purchase of annuities are accumulated at various credited interest rates that, during 2011 and 2010, averaged 2.50% and 2.90%, respectively, and are deemed sufficient to provide for contractual surrender values for these funds. These reserves, which were $5.4 billion and $5.0 billion at December 31, 2011 and 2010, respectively, are subject to discretionary withdrawal at book value.
Reserves for guaranteed investment contracts, which were $39.2 million and $33.0 million at December 31, 2011 and 2010, respectively, are accumulated at various guaranteed interest rates, which during 2011 and 2010 aver-aged 2.21% and 5.63%, respectively, and meet statutory requirements. Reserves for life and disability insurance are based on mortality, morbidity and interest rate assumptions, which meet statutory requirements.
interest Maintenance and asset Valuation reserVes
Realized gains and losses, including certain other-than-temporary impairment losses, net of applicable taxes, arising from changes in interest rates are accumulated in the IMR and are amortized into net investment in-come over the estimated remaining life of the investment sold. All other realized gains and losses are reported in the consolidated statements of operations.
An Asset Valuation Reserve (“AVR”), applying to the specific risk characteristics of all invested asset catego-ries excluding cash, policy loans and investment income accrued, has been established based on a statutory formula. Realized and unrealized gains and losses, including other-than-temporary impairment losses arising from changes in the creditworthiness of the issuer, are included in the appropriate subcomponent of the AVR. Changes in the AVR are recorded directly to unassigned surplus.
seParate account oPerations
Variable annuity considerations and certain variable life insurance premiums may be allocated at participants’ discretion among investment funds in Separate Accounts. Separate Account funds invest in mutual funds, in-cluding funds managed by Mutual of America Capital Management Corporation, a wholly owned subsidiary (the “Adviser”), and other funds managed by outside investment advisers. All net realized and unrealized capital gains in the Separate Accounts, which reflect investment performance of the mutual funds in which they invest, accrue directly to participants (net of administrative and other Separate Account charges) and are not reflected
nOteS tO COnSOLIDateD StatUtORy FInanCIaL StatementS
December 31, 2011 and 2010
in the Company’s Consolidated Statutory Statements of Operations and Surplus. Certain administrative and other charges are assessed as a percentage of Separate Account assets and vary based upon the average size of the participant’s equity in the Separate Accounts and the level of administrative services provided. In 2011 and 2010, such charges were equal to approximately 1.04% and .91%, respectively, of total average Separate Account assets. Separate Account charges and investment advisory fees paid to the Adviser are included in the Consoli-dated Statutory Statement of Operations and Surplus. Investments held in the Separate Accounts are stated at fair value and are not available to satisfy liabilities of the General Account. Participants’ corresponding equity in the Separate Accounts is reported as liabilities in the accompanying statements. Premiums and benefits re-lated to the Separate Accounts are combined with the General Account in the accompanying statements. Net operating gains and losses are offset by changes to reserve liabilities in the respective Separate Accounts. These reserves, which were approximately $5.9 billion and $6.5 billion at December 31, 2011 and 2010, respectively, are subject to discretionary withdrawal at fair value.
PreMiuMs and annuity considerations
All annuity considerations derived from voluntary retirement-savings-type plans and defined benefit plans, which represents the vast majority of the Company’s annual premiums, are recognized as income when received. In-surance premiums and annuity considerations derived solely from defined contribution plans are recognized as income when due. Group life and disability insurance premiums are recognized as income over the contract period.
inVestMent incoMe and exPenses
General Account investment income is reported as earned and is presented net of related investment expenses. Operating expenses, including acquisition costs for new business, are charged to operations as incurred.
diVidends
Dividends are based on formulas and scales approved by the Board of Directors and are accrued currently for payment subsequent to plan anniversary dates.
Certain 2010 amounts included in the accompanying consolidated statutory financial statements have been reclassified to conform to the 2011 presentation.
2. INVESTMENTS
Valuation
The statement and fair values of investments in fixed maturity securities (bonds and notes) at December 31, 2011 and 2010, are shown on the next page. Excluding U.S. government and government agency investments, the Company is not exposed to any significant concentration of credit risk.

M u t u a l o f a M e r i c a 2 0 1 1 a n n u a l r e p o r t • p a g e 3 9
Statement GrossUnrealized Fair
December31,2011(inmillions) Value Gains Losses Value
Fixed maturities:Mortgage- and asset-backed securities: Residential mortgage-backed securities $2,337.5 $143.9 $ .3 $2,481.1 Commercial mortgage-backed securities — — — — Other asset-backed securities 23.9 .3 .1 24.1 Total $2,361.4 $144.2 $ .4 $2,505.2
U.S. Treasury securities and obligations of U.S. government corporations and agencies 910.8 66.5 — 977.3 Obligations of states and political subdivisions 23.0 3.5 — 26.5 Debt securities issued by foreign governments 34.6 4.7 — 39.3 Corporate securities 3,670.8 235.0 15.0 3,890.8 Total $7,000.6 $453.9 $ 15.4 $7,439.1
Statement GrossUnrealized Fair
December31,2010(inmillions) Value Gains Losses Value
Fixed maturities: Mortgage- and asset-backed securities: Residential mortgage-backed securities $2,519.3 $113.3 $ 8.7 $2,623.9 Commercial mortgage-backed securities 2.5 — — 2.5 Other asset-backed securities 17.3 .2 .1 17.4 Total $2,539.1 $113.5 $ 8.8 $2,643.8
U.S. Treasury securities and obligations of U.S. government corporations and agencies 741.6 23.8 10.5 754.9 Obligations of states and political subdivisions 21.5 .8 — 22.3 Debt securities issued by foreign governments 34.2 4.4 .1 38.5 Corporate securities 3,250.4 202.9 18.1 3,435.2 Total $6,586.8 $345.4 $ 37.5 $6,894.7
The Company does not have any exposure to subprime mortgage loans, either through direct investment in such loans or through investments in residential mortgage-backed securities, collateralized debt obligations or other similar investment vehicles. Approximately 95% of the $2.5 billion invested in mortgage-backed securities were issued by Fannie Mae (“FNMA”), Freddie Mac (“FHLMC”) or Ginnie Mae (“GNMA”) and, as such, are 100% guaranteed by the U.S. government. The Company does have investments in publicly traded bonds of financial institutions. These financial institutions may have investments with subprime exposure. At December 31, 2011, the statement value and fair value of the Company’s bond investments in financial institutions totaled $891.8 million and $927.6 million, respectively. At December 31, 2010, the statement value and fair value of the Company’s bond investments in financial institutions totaled $564.3 and $595.6 million, respectively.

nOteS tO COnSOLIDateD StatUtORy FInanCIaL StatementS
December 31, 2011 and 2010
Short-term fixed maturity securities with a statement value and fair value of $3.0 million and $14.1 million at December 31, 2011 and 2010, respectively, are included in the above tables. At December 31, 2011 and 2010, the Company had $3.3 million (par value $3.4 million), respectively, of its long-term fixed maturity securities on deposit with various state regulatory agencies.
fair Value
The Company values its financial instruments at fair value. Fair value is an estimate of the price the Company would receive upon selling a security in an orderly arms-length transaction. Investments are categorized based on a three-level valuation hierarchy for measurement and disclosure of fair value. The valuation hierarchy is based upon the transparency of inputs used to measure fair value. The three levels are as follows:
Level 1 — quoted prices in active markets for identical securities.Level 2 — quoted prices for identical or similar assets in markets that are not active or other signifi-
cant observable inputs (including yield, quality, coupon rate, maturity, issue type, quoted prices for similar securities, prepayment speeds, trading characteristics, etc.).
Level 3 — significant unobservable inputs (including the assumptions in determining the fair value of investments).
The Company has determined the fair value inputs used to measure all of its assets that are considered financial instruments, which includes fixed maturity securities, common stocks, cash and short-term investments, mort-gage loans, policy loans, other invested assets and Separate Account funds whose net asset values are calculated on a daily basis. Cash, short-term investments, common stocks, investments in publicly traded mutual funds that are registered with the Securities and Exchange Commission and Separate Account assets were deter-mined to be Level 1. The vast majority of the Company’s fixed maturity securities (bonds and notes), and all of its policy loans, other invested assets and private-placement common stock were determined to be Level 2. Finally, certain fixed maturity securities, the guaranteed funds transferrable and mortgage loans representing less than 1% of the total, for which quoted market prices were unavailable or an inactive market for the security currently exists, were determined to be Level 3. The inputs used for valuing these securities are not necessarily an indication of the risk associated with investing in those securities.
The following tables provide fair value information at December 31, 2011 and 2010, about the Company’s assets that are considered financial instruments:
December31,2011FinancialInstrument Level1 Level2 Level3 Total
Bonds and notes $ — $7,409.3 $26.9 $ 7,436.2 Common stocks 42.3 2.5 — 44.8 Cash and short-term investments 7.1 — — 7.1 Guaranteed funds transferrable — — 30.3 30.3 Mortgage loans — — 1.3 1.3 Policy loans — 101.3 — 101.3 Separate Accounts assets 5,899.9 — — 5,899.9 Total $5,949.3 $7,513.1 $58.5 $13,520.9

M u t u a l o f a M e r i c a 2 0 1 1 a n n u a l r e p o r t • p a g e 4 1
December31,2010FinancialInstrument Level1 Level2 Level3 Total
Bonds and notes $ — $6,821.8 $58.8 $ 6,880.6 Common stocks 39.0 2.4 — 41.4Cash and short-term investments 18.1 — — 18.1 Guaranteed funds transferrable — — 36.0 36.0Mortgage loans — — 1.8 1.8 Policy loans — 96.6 — 96.6 Separate Accounts assets 6,471.4 — — 6,471.4 Total $6,528.5 $6,920.8 $96.6 $13,545.9
The book value of Level 3 securities declined from $96.6 million at December 31, 2010, to $58.5 million at De-cember 31, 2011, primarily as a result of the sale of two securities during the year that had an adjusted fair value of $16.6 million and $2.5 million, respectively. The company realized capital gains on these sales of $3.3 million and $2.5 million, respectively, which are included in net income in 2011. Furthermore, as previously discussed in Note 1, one additional security in this group, with an unadjusted book value of $12.0 million was determined to be an NAIC class six at December 31, 2011 and a $7.7 million adjustment to report this security at the lower of amortized cost or fair value was recorded. The fair value of the remaining securities classified as Level 3 decreased by $5.1 million in 2011 as a result of the redetermination of the fair value of these securities during the year. The guaranteed funds transferrable and the mortgage loan asset balances declined due to the receipt of scheduled principal payments during the year. There were no additional securities added to the Level 3 clas-sification during 2011.
In determining the fair value of Level 3 bonds and notes, the Company utilized expected cash flows provided by an independent valuation service together with discount rate and default factor assumptions commensurate with the current credit rating of such securities and consistent with those that would be used in pricing similar types of securities based upon market conditions that existed at December 31, 2011 and 2010.
unrealized Gains and losses
At December 31, 2011 and 2010, net unrealized (depreciation) appreciation reflected in surplus consisted of the following:
December31(inmillions) 2011 2010 Change
Equity securities (common and preferred stock) $ 7.6 $ 8.8 $ (1.2)Bonds and notes (16.8) (11.7) (5.1)Guaranteed funds transferable (1.5) (1.5) — Net unrealized (depreciation) appreciation $(10.7) $(4.4) $(6.3)

nOteS tO COnSOLIDateD StatUtORy FInanCIaL StatementS
December 31, 2011 and 2010
Net unrealized depreciation related to the Company’s bonds and equity securities increased by $6.3 million during the year as shown above. The net unrealized appreciation of $7.6 million related to equity securities at December 31, 2011, consists of $8.0 million of gross unrealized gains and $.4 million of gross unrealized losses, of which none of the unrealized losses are less than 12 months old. The net unrealized appreciation of $8.8 million related to equity securities at December 31, 2010, consisted of $8.9 million of gross unrealized gains and $.1 million of gross unreal-ized losses, of which $.1 million of the unrealized losses were greater than 12 months old.
During 2010, Regulation No. 172 was amended to adopt the accounting change and new disclosure require-ments set forth in SSAP No. 100 titled Fair Value Measurements, under which the criteria used to determine the fair value of certain types of investment securities was changed. As a result of this change in 2010, the Com-pany recorded an $11.7 million unrealized loss to adjust the carrying value of certain loan-backed securities in the portfolio to their estimated current fair value. These securities had an adjusted book value of $27.5 million prior to the recognition of this unrealized loss. At December 31, 2011, an additional unrealized loss of $5.1 mil-lion was recorded to adjust these securities to their estimated fair value. SSAP No. 100 also established the valuation hierarchy for measuring fair value and establishes disclosure requirements about fair value.
The following is an analysis of the fair values and gross unrealized losses as of December 31, 2011 and 2010, aggregated by fixed maturity category and length of time that the securities were in a continuous unrealized loss position. As shown in the table below, total gross unrealized losses as of December 31, 2011 and 2010, were $15.4 million and $37.5 million, respectively and the majority of such losses related to corporate and U.S. Trea-sury securities. These unrealized losses arise primarily from general changes in interest rates and credit spreads, which are still wider than historical norms, despite having narrowed considerably during 2011 and are not due to fundamental credit problems that exist with the specific issuers.
The tables that follow exclude $6.8 billion and $5.7 billion at December 31, 2011 and 2010, respectively, of fair value of fixed maturity securities in an unrealized gain position.
Fair Unrealized Number Fair Unrealized Number Value Losses of Issues Value Losses of IssuesDecember 31, 2011 (in millions) Twelve Months or Less Twelve Months or Greater
Fixed maturities:Mortgage- and asset-backed securities: Residential mortgage-backed securities $ 28.2 $ .2 8 $ 9.1 $ .1 5 Commercial mortgage-backed securities — — — — — — Other asset-backed securities 1.1 — 1 6.4 .1 2 Total $ 29.3 $ .2 9 $ 15.5 $ .2 7
U.S. Treasury securities and obligations of U.S. government corporations and agencies 8.5 — 2 — — —Obligations of states and political subdivisions — — — — — —Debt securities issued by foreign governments — — — — — —Corporate securities 264.5 7.1 29 277.8 7.9 14 Total $302.3 $ 7.3 40 $ 293.3 $ 8.1 21

M u t u a l o f a M e r i c a 2 0 1 1 a n n u a l r e p o r t • p a g e 4 3
Fair Unrealized Number Fair Unrealized Number Value Losses of Issues Value Losses of IssuesDecember 31, 2010 (in millions) Twelve Months or Less Twelve Months or Greater
Fixed maturities:Mortgage- and asset-backed securities: Residential mortgage-backed securities $ 352.6 $ 8.6 34 $ 2.8 $ .1 3 Commercial mortgage-backed securities — — — — — — Other asset-backed securities 3.1 — 1 3.7 .1 2 Total $ 355.7 $ 8.6 35 $ 6.5 $ .2 5
U.S. Treasury securities and obligations of U.S. government corporations and agencies 245.9 10.5 6 — — —Obligations of states and political subdivisions — — — — — —Debt securities issued by foreign governments 2.0 — 1 1.5 .1 1Corporate securities 459.3 13.3 27 152.6 4.8 13 Total $1,062.9 $ 32.4 69 $ 160.6 $ 5.1 19
realized caPital Gains and losses
Net realized capital gains (losses) reflected in the statements of operations for the years ended December 31, 2011 and 2010, were as follows:
December31(inmillions) 2011 2010
Bonds and notes $ 3.3 $ —Equity securities (common and preferred stock) .9 .9 Net realized capital gains (losses) $ 4.2 $ .9
At December 31, 2011 and 2010, the book value and fair value of the Company’s mortgage-backed and asset-backed securities portfolio totaled $2.8 billion and $2.8 billion, and $3.0 billion and $2.9 billion, respectively, of which approximately 95% in both years are U.S. government agency guaranteed instruments. Investments in loan-backed and asset-backed securities are carried at amortized cost, except for those securities rated as class 6 by the NAIC, which are carried at lower of amortized cost or fair value.
Sales of investments in fixed maturity securities resulted in $30.8 million and $49.9 million of net interest rate related gains being accumulated in the IMR in 2011 and 2010, respectively, as follows:
December31(inmillions) 2011 2010
Fixed maturity securities Proceeds $1,971.4 $2,355.5 Gross realized gains 39.7 50.3 Gross realized losses (8.9) (.4)

nOteS tO COnSOLIDateD StatUtORy FInanCIaL StatementS
December 31, 2011 and 2010
During 2011 and 2010, $19.3 million and $16.3 million, respectively, of the IMR was amortized and included in net investment income.
Sales of investments in equity securities resulted in $.9 million of net capital gains in both 2011 and 2010 being recognized in net income as follows:
December31(inmillions) 2011 2010
Equity securities Proceeds $4.9 $35.8 Gross realized gains 1.1 1.0 Gross realized losses (.2) (.1)
Maturities
The statement and fair values of investments in fixed maturity securities by contractual maturity (except for mortgage-backed securities, which are stated at expected maturity) at December 31, 2011, are shown below. Expected maturities may differ from contractual maturities because borrowers may have the right to prepay obligations with or without prepayment penalties.
Statement FairDecember31,2011(inmillions) Value Value
Due in one year or less $ 399.1 $ 406.9Due after one year through five years 2,655.3 2,815.7Due after five years through 10 years 3,294.0 3,513.1Due after 10 years 652.2 703.4 Total $7,000.6 $7,439.1
3. GUARANTEED FUNDS TRANSFERABLE
In 1980, Mutual of America terminated a reinsurance arrangement and assumed direct ownership of funds held by John Hancock Mutual Life Insurance Company (“Hancock”), the former reinsurer, and direct liability for the contractual obligations to policyholders. The liability to such policyholders is included as insurance and annuity reserves in the consolidated statutory statements of financial condition. The principal amount of the funds held by the former reinsurer is guaranteed to earn at least 3.125% per year.
The guaranteed funds are transferable to Mutual of America over time through 2030 and are stated at the total principal amount of future guaranteed transfers to Mutual of America of $30.3 million and $36.0 million at December 31, 2011 and 2010, respectively. The actual interest and other allocated investment earnings related to this contract amounted to $1.5 million and $2.0 million in 2011 and 2010, respectively, and are included in net investment income.
M u t u a l o f a M e r i c a 2 0 1 1 a n n u a l r e p o r t • p a g e 4 5
4. REAL ESTATE
Real estate consists primarily of an office building that Mutual of America purchased for its corporate head-quarters. The Company occupies approximately one-third of this office building as its corporate headquar-ters and leases the remaining space. Depreciation expense was $8.6 million and $8.4 million in 2011 and 2010, respectively.
5. PENSION PLAN AND POSTRETIREMENT BENEFITS
Pension Benefit and other Benefit Plans
The Company has a qualified, noncontributory defined benefit pension plan covering virtually all employees. Benefits are generally based on years of service and final average earnings. The Company’s funding policy is to contribute annually, at a minimum, the amount necessary to satisfy the funding requirements under the Employee Retirement Income Security Act of 1974 (“ERISA”). The Company also maintains a nonqualified defined benefit pension that provides benefits to employees whose total compensation exceeds the maximum allowable compensation limits for qualified retirement plans under ERISA.
The Company has two defined benefit postretirement plans covering substantially all salaried employees. Post-retirement benefit plan expense required to be recorded under this plan was $4.7 million and $3.0 million in 2011 and 2010, respectively. Employees may become eligible for such benefits upon attainment of retirement age while in the employ of the Company and upon satisfaction of service requirements. One plan provides medical and dental benefits and the second plan provides life insurance benefits. The postretirement plans are contributory for those individuals who retire with less than 25 years of eligible service, with retiree contribu-tions adjusted annually, and contain other cost-sharing features, such as deductibles and coinsurance. All benefit plans are underwritten by Mutual of America.
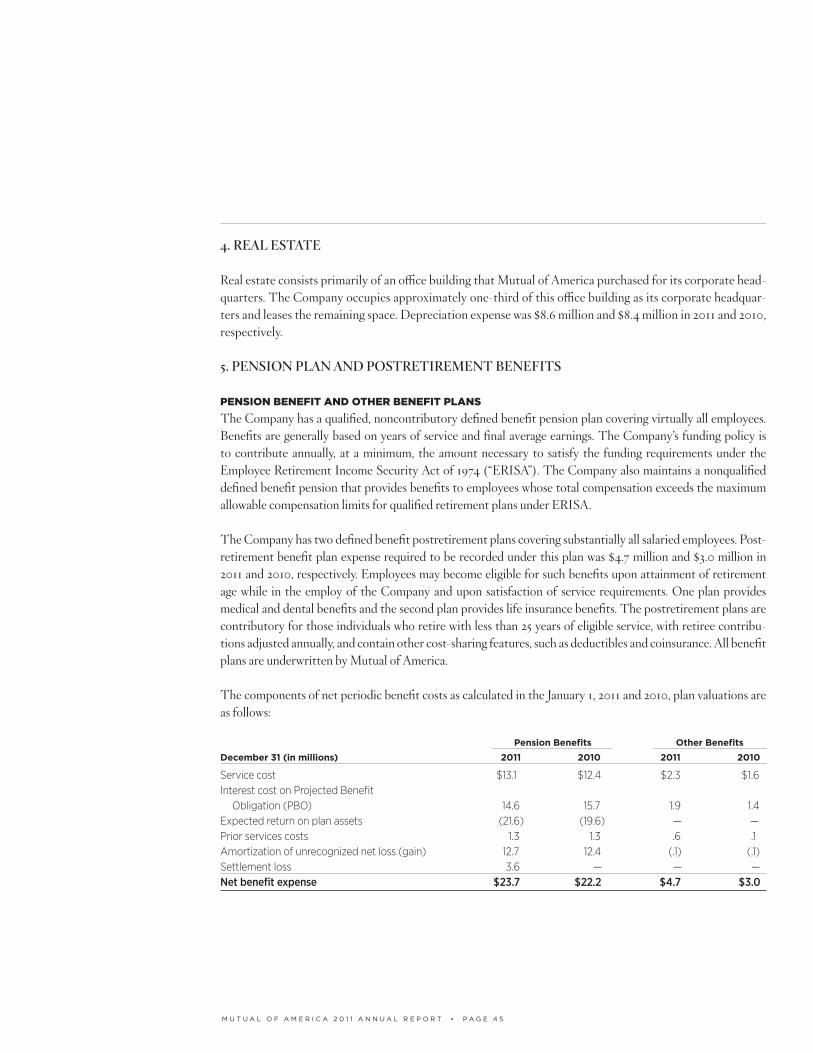
The components of net periodic benefit costs as calculated in the January 1, 2011 and 2010, plan valuations are as follows:
PensionBenefits OtherBenefits
December31(inmillions) 2011 2010 2011 2010
Service cost $ 13.1 $ 12.4 $ 2.3 $ 1.6Interest cost on Projected Benefit Obligation (PBO) 14.6 15.7 1.9 1.4Expected return on plan assets (21.6) (19.6) — —Prior services costs 1.3 1.3 .6 .1Amortization of unrecognized net loss (gain) 12.7 12.4 (.1) (.1)Settlement loss 3.6 — — —Net benefit expense $ 23.7 $ 22.2 $ 4.7 $ 3.0

nOteS tO COnSOLIDateD StatUtORy FInanCIaL StatementS
December 31, 2011 and 2010
During 2011 pension expense included a $3.6 million settlement loss, resulting from the level of lump-sum ben-efit payments made from the nonqualified plan during the year exceeding the plan’s interest and service costs. During 2010, there were no settlement losses recognized.
The changes in the PBO and plan assets are as follows:
PensionBenefits OtherBenefits
December31(inmillions) 2011 2010 2011 2010
Change in PBOPBO, beginning of year $ 292.3 $ 279.9 $ 37.2 $ 25.6 Service cost 13.1 12.4 2.3 1.6 Interest cost 14.6 15.7 1.9 1.4 Plan amendment — — — — Change in assumptions 12.1 10.9 2.6 3.2 Actuarial loss (gain) 11.0 (2.8) 4.0 8.1 Benefits and expenses paid (27.2) (23.8) (3.3) (2.7)PBO, end of year $315.9 $292.3 $44.7 $37.2
PensionBenefits OtherBenefits
December31(inmillions) 2011 2010 2011 2010
Change in Plan Assets Plan assets, beginning of year $ 215.8 $ 199.4 $ — $ — Employer contributions 10.0 13.6 — — Return on plan assets .1 26.6 — — Benefits and expenses paid (27.2) (23.8) — —Plan assets, end of year 198.7 215.8 — —Plan assets (lower than) PBO $(117.2) $ (76.5) $(44.7) $(37.2)
At December 31, 2011 and 2010, all of the pension plan assets are invested in several of the investment funds offered by the Company’s Separate Accounts and in the Company’s General Account, and consisted of ap-proximately 80% in equity investments and 20% in fixed-income investments. A distribution of plan assets by investment objective as of December 31, 2011 and 2010, is as follows:
($inmillions) 2011 2010
Fixed Income Funds $ 30.1 $ 28.7 Equity Funds: Index 88.6 86.6 Growth 25.4 28.3 Balanced 24.1 26.4 Total Level 1 Investments $ 168.2 $ 170.0 General Account 30.5 45.8 Total Plan Assets $198.7 $215.8
M u t u a l o f a M e r i c a 2 0 1 1 a n n u a l r e p o r t • p a g e 4 7
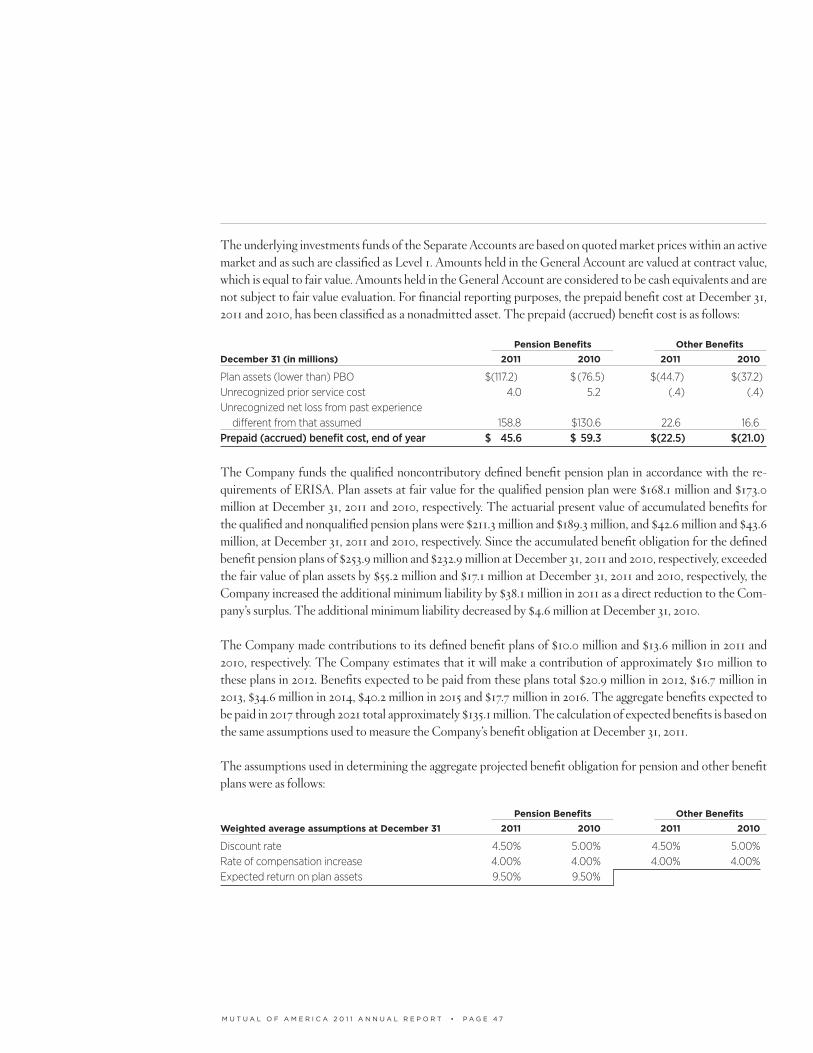
The underlying investments funds of the Separate Accounts are based on quoted market prices within an active market and as such are classified as Level 1. Amounts held in the General Account are valued at contract value, which is equal to fair value. Amounts held in the General Account are considered to be cash equivalents and are not subject to fair value evaluation. For financial reporting purposes, the prepaid benefit cost at December 31, 2011 and 2010, has been classified as a nonadmitted asset. The prepaid (accrued) benefit cost is as follows:
PensionBenefits OtherBenefits
December31(inmillions) 2011 2010 2011 2010
Plan assets (lower than) PBO $(117.2) $ (76.5) $(44.7) $(37.2)Unrecognized prior service cost 4.0 5.2 (.4) (.4)Unrecognized net loss from past experience different from that assumed 158.8 $130.6 22.6 16.6Prepaid (accrued) benefit cost, end of year $ 45.6 $ 59.3 $(22.5) $(21.0)
The Company funds the qualified noncontributory defined benefit pension plan in accordance with the re-quirements of ERISA. Plan assets at fair value for the qualified pension plan were $168.1 million and $173.0 million at December 31, 2011 and 2010, respectively. The actuarial present value of accumulated benefits for the qualified and nonqualified pension plans were $211.3 million and $189.3 million, and $42.6 million and $43.6 million, at December 31, 2011 and 2010, respectively. Since the accumulated benefit obligation for the defined benefit pension plans of $253.9 million and $232.9 million at December 31, 2011 and 2010, respectively, exceeded the fair value of plan assets by $55.2 million and $17.1 million at December 31, 2011 and 2010, respectively, the Company increased the additional minimum liability by $38.1 million in 2011 as a direct reduction to the Com-pany’s surplus. The additional minimum liability decreased by $4.6 million at December 31, 2010.
The Company made contributions to its defined benefit plans of $10.0 million and $13.6 million in 2011 and 2010, respectively. The Company estimates that it will make a contribution of approximately $10 million to these plans in 2012. Benefits expected to be paid from these plans total $20.9 million in 2012, $16.7 million in 2013, $34.6 million in 2014, $40.2 million in 2015 and $17.7 million in 2016. The aggregate benefits expected to be paid in 2017 through 2021 total approximately $135.1 million. The calculation of expected benefits is based on the same assumptions used to measure the Company’s benefit obligation at December 31, 2011.
The assumptions used in determining the aggregate projected benefit obligation for pension and other benefit plans were as follows:
PensionBenefits OtherBenefits
WeightedaverageassumptionsatDecember31 2011 2010 2011 2010
Discount rate 4.50% 5.00% 4.50% 5.00%Rate of compensation increase 4.00% 4.00% 4.00% 4.00%Expected return on plan assets 9.50% 9.50%

nOteS tO COnSOLIDateD StatUtORy FInanCIaL StatementS
December 31, 2011 and 2010
The Company’s overall expected long-term rate of return on plan assets was determined based upon the cur-rent projected benefit payout period and the current mix of plan investments, which generally consists of ap-proximately 80% in equity investments and 20% in fixed-income investments. The Company believes that this investment mix properly matches the plan’s benefit obligations. The equity component of the expected long-term rate of return was determined using a combination of the actual rate of return of equities (net of inflation) and an inflation-adjusted equity rate of return (assuming an inflation rate of 4%) based upon historical 30-year rolling averages (with the most recent five years more heavily weighted).
The health care cost trend rate assumption has an effect on the amounts reported. The assumption is 7.0% for 2012, 6.5% for 2013, 6.0% for 2014, 5.5% for 2015, 5.0% for 2016 and 5.0% for 2017 and beyond. For example, increasing the assumed health care cost trend rate by 1.0% each year would increase the accumulated postretire-ment obligation for the plan as of December 31, 2011, by $1.5 million and the aggregate of the service and interest cost components of the net periodic benefit cost for 2011 by $.2 million. Benefits expected to be paid from this plan total $4.3 million in 2012, $4.5 million in 2013, $5.1 million in 2014, $5.5 million in 2015 and $6.0 million in 2016. Aggregated benefits expected to be paid in the period 2017 through 2021 total approximately $33.9 mil-lion. The calculation of expected benefits is based on the same assumptions used to measure the Company’s benefit obligation at December 31, 2011.
saVinGs and other incentiVe Plans
All employees may participate in a Company-sponsored savings plan under which the Company matches a por-tion of the employee’s contributions up to 6% of salary. The Company contributed $2.5 million in both 2011 and 2010, respectively. The Company also has a long-term performance-based incentive compensation plan for cer-tain employees and directors. Shares under this plan are granted each year and generally vest over a three-year period. The value of such shares is equal to the number of shares multiplied by the current share price, which is determined by the level of total assets of the Company. A financial performance threshold measure must also be met in order to receive a payout at the end of the third year. The total expense incurred related to these plans was $10.1 million and $11.0 million in 2011 and 2010, respectively. At December 31, 2011 and 2010, the accrued liability related to these plans was $20.4 million and $19.9 million, respectively.
6. COMMITMENTS AND CONTINGENCIES
Rental expenses approximated $24.7 million and $25.1 million as of December 31, 2011 and 2010, respectively. The approximate minimum rental commitments under noncancelable operating leases are as follows: $4.0 mil-lion in 2012; $3.8 million in 2013; $3.2 million in 2014; $2.9 million in 2015; $2.5 million in 2016 and $2.3 million in 2017 and beyond. Such leases are principally for leased office space and certain data processing equipment, fur-niture and communications equipment. Certain office space leases provide for adjustments relating to changes in real estate taxes and other expenses.
The Company is involved in various legal actions that have arisen in the course of the Company’s business. In the opinion of management, the ultimate resolution with respect to such lawsuits, as well as other contingencies, will not have a material adverse effect on the Company’s consolidated financial statements.

M u t u a l o f a M e r i c a 2 0 1 1 a n n u a l r e p o r t • p a g e 4 9
7. FEDERAL INCOME TAXES
Effective January 1, 1998, Mutual of America’s pension business became subject to federal income tax. Mutual of America files its federal income tax return on a separate company basis. Mutual of America’s noninsurance subsidiaries file a consolidated income tax return.
Regulation No. 172 requires New York-domiciled insurers to adopt certain deferred income tax accounting principles as their prescribed basis of accounting. These principles require that a deferred tax asset (“DTA”) or deferred tax liability (“DTL”) be established for temporary differences between the tax and statutory report-ing bases of assets and liabilities. The change in Mutual of America’s net DTA must be recorded as a separate component of gains and losses in surplus.
Net DTAs are permitted to be recorded as an admitted asset to the extent that the amount will be realized within three years, subject to a maximum admitted asset equal to 15% of statutory surplus and to the Company’s risk based capital ratio exceeding certain thresholds.
A reconciliation of the income tax (expense) recognized in the Company’s consolidated statutory financial statement of operations to the amount obtained by applying the statutory tax rate of 35% to net gain from operations before federal income taxes follows:
December31($inmillions) 2011 2010
Net gain from operations $ 45.9 $ 16.5Statutory rate 35% 35%Tax at statutory rate (16.1) (5.8)IMR amortization 6.7 5.7Realized capital (gains) losses (1.5) (.3)Net capital gains (losses) deferred in IMR (13.5) (17.5)Change in nonadmitted assets 6.5 (5.7)Change in Mutual of America’s net DTA 8.7 26.2Other 5.6 (3.2)Federal income tax (expense) $ (3.6) $ (.6)Effective tax rate 7.8% 3.6%
The federal income tax expense of $3.6 million in 2011 and $.6 million in 2010 relates primarily to the Com-pany’s non-insurance subsidiaries.

nOteS tO COnSOLIDateD StatUtORy FInanCIaL StatementS
December 31, 2011 and 2010
The components of the net DTA recognized in the Company’s statement of financial condition are as follows:
December31($inmillions) 2011 2010
Total gross DTAs excluding unrealized (gains) losses $ 293.1 $ 311.5Statutory valuation allowance adjustment — —Total adjusted gross DTAs excluding unrealized (gains) losses $ 293.1 $ 311.5Total gross DTLs excluding unrealized (gains) losses (37.9) (47.6)Mutual of America’s net DTA 255.2 263.9Tax effect of unrealized (gains) losses 3.2 1.0DTA nonadmitted (199.1) (211.3)Mutual of America’s net admitted DTA 59.3 53.6Noninsurance Subsidiaries 5.0 7.9Total net DTAs $ 64.3 $ 61.5
At December 31, 2011, the gross DTA including the tax effect of unrealized losses of $296.3 million includes $262.9 million of ordinary DTAs and $33.4 million of capital DTAs. As shown in the above table, Mutual of America’s net admitted DTA increased by $5.7 million during 2011, of which $3.4 million related to the incre-mental increase arising from the application of Statement of Statutory Accounting Principles No. 10R “Income Taxes” (SSAP No. 10R). The $59.3 million and $53.6 million of net admitted DTA at December 31, 2011, and 2010, includes $41.5 million and $38.1 million, respectively, related to the incremental increase arising from the application of SSAP No. 10R and are expected to be realized within three years of the financial statement date.
The tax effects of temporary differences that give rise to a significant portion of the DTAs and DTLs arise from the differing statutory and tax-basis treatment of assets and liabilities, insurance and annuity reserves, realized capital gains and losses on investment transactions, nonadmitted assets and net operating loss carryforwards. Included in such differences are items resulting from transition rules under the Code as of January 1, 1998, which accompanied the change in taxation of Mutual of America’s pension business. The transition rules will continue to moderate Mutual of America’s current tax expense over the next several years. As such, Mutual of America incurred a federal income tax expense of $.7 million in 2011 and $.3 million in 2010. The other $2.9 mil-lion in 2011 and $.3 million in 2010 of the tax expense shown on the Consolidated Statement of Operations and Surplus relates to the operating results of the Company’s noninsurance subsidiaries. At December 31, 2011, the Company had consolidated net operating loss carryforwards of approximately $301.5 million, expiring at various dates between 2016 and 2029. On July 21, 2009, Mutual of America executed a formal settlement with the IRS Appeals Division resolving all disputed adjustments related to the Company’s tax deductions for certain intangible assets and for capital losses related to the sale of a holding company and a partnership interest for the tax years 2000 through 2005. At December 31, 2011 and 2010, Mutual of America’s gross and net DTA’s reflected the above IRS settlement. This settlement resulted in no tax due for the years under audit and had no impact on Mutual of America’s surplus. On September 1, 2010, the IRS notified Mutual of America that it concluded its audit of the Company’s 2006,

M u t u a l o f a M e r i c a 2 0 1 1 a n n u a l r e p o r t • p a g e 5 1
2007 and 2008 tax years and that no tax was due for the years examined.8. FAIR VALUE OF FINANCIAL INSTRUMENTS
The fair values of financial instruments have been determined using available market information and the valuation methodologies described below. Considerable judgment is often required in interpreting market data to develop estimates of fair value for financial instruments for which quoted market prices are not avail-able or an inactive market for the instrument currently exists. Accordingly, certain fair values presented here-in (refer to Note 2) may not necessarily be indicative of amounts that could be realized in a current market exchange. The use of different assumptions or valuation methodologies may have a material effect on the estimated fair value amounts. Amounts related to the Company’s financial instruments at December 31, 2011 and 2010 were as follows:
2011 2010
Statement Fair Statement Fair(inmillions) Value Value Value Value
ASSETSBonds and notes $6,997.6 $7,436.2 $6,572.7 $6,880.6 Common stocks 44.8 44.8 41.4 41.4 Cash and short-term investments 7.1 7.1 18.1 18.1 Guaranteed funds transferable 30.3 35.3 36.0 39.1 Mortgage loans 1.3 1.3 1.8 1.8 Policy loans 101.3 101.3 96.6 96.6
LIABILITIESInsurance and annuity reserves $6,377.3 $6,562.6 $6,088.5 $6,180.8
Fixed Maturities and Equity Securities — Fair value for fixed maturities is determined by reference to market prices quoted by an independent pricing source. If quoted market prices are not available, fair value is deter-mined using internal valuation models and techniques or based upon quoted prices for comparable securities. Fair value for equity securities is determined by reference to valuations quoted by an independent pricing or-ganization.
Cash and Short-Term Investments — The carrying value for cash and short-term investments approximates fair values due to the short-term maturities of these instruments.
Guaranteed Funds Transferable — Fair value for guaranteed funds transferable is determined by reference to market valuations provided by the former reinsurer.
Mortgage Loans — Fair value for mortgage loans is determined by discounting the expected future cash flows using the current rate at which similar loans would be made to borrowers with similar credit ratings and remain-ing maturities.

nOteS tO COnSOLIDateD StatUtORy FInanCIaL StatementS
December 31, 2011 and 2010
Policy Loans — The majority of policy loans are issued with variable interest rates, which are periodically ad-justed based on changes in rates credited to the underlying policies and therefore are considered approximate fair value.
Insurance and Annuity Reserves — Contractual funds not yet used to purchase retirement annuities and other deposit liabilities are stated at their cash surrender value. General Account policies are issued with variable interest rates that are periodically adjusted based on changes in underlying economic conditions.
The fair value of immediate annuity contracts (approximately $1.0 billion at December 31, 2011 and 2010, re-spectively) was determined by discounting expected future retirement benefits using current mortality tables and interest rates based on the duration of expected future benefits. Weighted average interest rates of 3.81% and 4.36% were used at December 31, 2011 and 2010, respectively.
9. SIGNIFICANT DIFFERENCES BETWEEN STATUTORY ACCOUNTING PRACTICES AND GENERALLY ACCEPTED ACCOUNTING PRINCIPLES (“GAAP”)
The accompanying financial statements are presented in conformity with statutory accounting practices prescribed or permitted by the New York Department (“statutory accounting”), which practices differ from GAAP. The significant variances between such practices and GAAP are described below. The Company has not computed the variance between Surplus and Net Income calculated in accordance with statutory accounting practices prescribed or permitted by the New York Department and GAAP, as there is no reporting require-ment to do so and the costs involved exceed the benefits derived from these calculations. Generally, GAAP results in a more favorable presentation of the Company’s financial condition.
asset Valuations and inVestMent incoMe recoGnition
GAAP requires the Company’s bonds and notes to be classified as either held to maturity (“HTM”) or available for sale (“AFS”); whereas for statutory accounting, no such classification is required. In addition, for GAAP, AFS bonds and notes are carried at their fair value with the unrealized gains and losses applied directly to equity; whereas for statutory accounting, all bonds and notes in good standing are carried at their amortized cost.
Realized capital gains and losses, net of applicable taxes, arising from changes in interest rates are recognized in income currently for GAAP accounting, rather than accumulated in the IMR and amortized into income over the remaining life of the security sold for statutory accounting.
A general formula-based Asset Valuation Reserve is recorded for statutory accounting purposes, whereas such a reserve is not required under GAAP.
For statutory accounting, certain assets, principally net deferred income tax assets not expected to be re-alized within three years, furniture and fixtures and prepaid expenses are excluded from the statement of financial condition by a direct charge to surplus; whereas under GAAP, such assets are carried at cost, net of accumulated depreciation.

M u t u a l o f a M e r i c a 2 0 1 1 a n n u a l r e p o r t • p a g e 5 3
Policy acquisition costs
Under GAAP, policy acquisition costs that are directly related to and vary with the production of new business are deferred and amortized over the estimated life of the applicable policies, rather than being expensed as incurred, as required under statutory accounting.
insurance and annuity reserVes
Under statutory accounting practices, the interest rates and mortality and morbidity assumptions used are those which are prescribed or permitted by the New York Department. Under GAAP, for annuities, the interest rate assumptions used are generally those assumed in the pricing of the contract at issue; for disability benefits, the interest rates assumed are those anticipated to be earned over the duration of the benefit period. Mortality and morbidity assumptions are based on Company experience.
PreMiuM recoGnition
Insurance contracts that do not subject the insurer to significant mortality or morbidity risk are considered, under GAAP, to be primarily investment contracts. GAAP requires all amounts received from policyholders under these investment contracts to be recorded as a policyholder deposit rather than as premium income.
deferred incoMe taxes
GAAP requires that a deferred tax asset or liability be established to provide for temporary differences between the tax and financial reporting bases of assets and liabilities. Statutory accounting adopted similar accounting principles, except that deferred income tax assets (net of any required valuation allowance) are recognized for statutory accounting only to the extent that they can be utilized within three years; whereas for GAAP, all such assets are recognized (net of any required valuation allowance) regardless of when they will be utilized. All changes in deferred income tax assets or liabilities are recorded directly as a charge or benefit to surplus for statutory accounting purposes.
cash and short-terM inVestMents
The Statements of Cash Flows are presented in accordance with statutory accounting. This reporting format differs from GAAP, which requires a reconciliation of net income to net cash from operating activities. The statutory Statements of Cash Flows include changes in cash and short-term investments and also certain non-cash related changes.
10. SUBSEQUENT EVENTS
The Company has evaluated subsequent events through March 20, 2012, the date the financial statements were available to be issued, and no events have occurred subsequent to the balance sheet date and before the date of evaluation that would require disclosure.

RePORt OF InDePenDent RegISteReD PUbLIC aCCOUntIng FIRm
the Board of directors
mUtUaL OF ameRICa LIFe InSURanCe COmPany:
We have audited the accompanying consolidated statutory statements of financial condition of Mutual of America Life Insurance Company and subsidiaries as of December 31, 2011 and 2010, and the related consoli-dated statutory statements of operations and surplus, and cash flows for the years then ended. These financial statements are the responsibility of the Company’s management. Our responsibility is to express an opinion on these financial statements based on our audits.
We conducted our audits in accordance with the standards of the Public Company Accounting Oversight Board (United States). Those standards require that we plan and perform the audit to obtain reasonable assurance about whether the financial statements are free of material misstatement. An audit includes examining, on a test basis, evidence supporting the amounts and disclosures in the financial statements. An audit also includes as-sessing the accounting principles used and significant estimates made by management, as well as evaluating the overall financial statement presentation. We believe that our audits provide a reasonable basis for our opinion.
As described more fully in Notes 1 and 9 to the consolidated statutory financial statements, the Company pre-pared these financial statements using accounting practices prescribed or permitted by the New York State Department of Financial Services, which practices differ from U.S. generally accepted accounting principles. The effects on the financial statements of the variances between the statutory accounting practices and U.S. generally accepted accounting principles, although not reasonably determinable, are presumed to be material.
In our opinion, because of the effects of the matter discussed in the preceding paragraph, the financial state-ments referred to above do not present fairly, in conformity with U.S. generally accepted accounting principles, the financial position of Mutual of America Life Insurance Company and subsidiaries as of December 31, 2011 and 2010, or the results of their operations or their cash flows for the years then ended.
Also, in our opinion, the consolidated statutory financial statements referred to above present fairly, in all material respects, the financial position of Mutual of America Life Insurance Company and subsidiaries as of December 31, 2011 and 2010, and the results of their operations and their cash flows for the years then ended, in conformity with accounting practices prescribed or permitted by the New York State Department of Financial Services.
New York, New YorkMarch 20, 2012

M u t u a l o f a M e r i c a 2 0 1 1 a n n u a l r e p o r t • p a g e 5 5
thomas J. moranChairman, President and Chief Executive Officer
William S. Conway, CLU, ChFCSenior Executive Vice President and Chief Operating Officer
John R. greed, CPaSenior Executive Vice President and Chief Financial Officer
amir Lear, CFaChairman and Chief Executive OfficerMutual of America Capital Management Corporation
thomas J. Dillman, CFaPresidentMutual of America Capital Management Corporation
thomas gilliam, CLUChairman and Chief Executive OfficerMutual of America Foundation
theodore L. Herman, CLU, ChFCVice ChairmanMutual of America Foundation
ACTUArIALSerVICeS
Jeremy J. brown, FSa, maaa, ea, CLU, CHFCExecutive Vice President and Chief Actuary
Corporate Actuarial
Walter W. Siegel, FSa, maaa, eaSenior Vice President and Corporate Actuary
Virginia a. Carlisi, FLmI, aCSVice President
Fanny F. eng, FSa, maaa, eaVice President and Actuary
Joseph a. gross, FSa, maaaVice President and Actuary
Steve ngai, FSa, maaaVice President and Actuary
andrew b. Hirschfeld, aSa, maaaSecond Vice President and Associate Actuary
Jeffrey tsai, FSaSecond Vice President
Actuarial Consulting
mark Koehne, maaa, eaSenior Vice President and Actuary
David m. block, maaa, eaVice President and Actuary
Robert J. mcelroy, maaa, eaVice President and Actuary
Joanne ChangSecond Vice President
Jenny b. KimSecond Vice President
Judy muiSecond Vice President
ADmInISTrATIVeTeChnICALSerVICeS
Jared gutmanExecutive Vice President and Chief Privacy Officer
Administrative Services
Dennis S. mcmanus, FLmI, aCSSenior Vice President
Debbie a. RogersVice President
bernice P. CoaxumSecond Vice President
Kathleen L. Summers, FLmI, aCS, aIaaSecond Vice President
Technical Services
nicole Lanni, FLmI, aCS, CIaSenior Vice President
Katherine CannizzaroSenior Vice President
miro beverin, FLmI, aCSVice President
Victor Fried, FSa, maaa, eaVice President and Actuary
barry S. goldbergVice President
Cindy y.W. LeeVice President
thomas J. PoulakowskiVice President
Kenneth F. Powers, CebS, aCSVice President
Dawn C. WeissmanVice President
Joseph aurelloSecond Vice President
Raymond guintaSecond Vice President
michael P. mulliganSecond Vice President
COrPOrATeFInAnCe
george L. medlin, CIaExecutive Vice President andTreasurer
Accounting & Financial Systems
Chris W. Festog, CPaSenior Vice President and Deputy Treasurer
Budget & Cost Accounting
nicholas a. branchinaSenior Vice President
Robert Healy, CamSVice President
William J. KrupskasVice President
Steven Duong, CPaSecond Vice President
Controller’s Office
Christopher m. miseo, CPaSenior Vice President and Director of Accounting and Financial Reporting
maria L. brophySenior Vice President
John a. Schabhutl, CPaVice President and Deputy Director of Financial Planning and Reporting
Corporate Tax
Harold J. gannonSenior Vice President
estelle e. miller, CPaVice President
Treasurer’s Office
myron O. Schlanger, CPa, FLmISenior Vice President and Associate Treasurer
brian J. KeoghVice President
thomas K. ngSecond Vice President
COrPOrATeLAW
James J. RothExecutive Vice President andGeneral Counsel
thomas L. martinExecutive Vice President and Deputy General Counsel
Scott H. RothsteinExecutive Vice President andDeputy General Counsel
anne marie CarrollSenior Vice President andAssociate General Counsel
nicholas S. CurabbaSenior Vice President andAssociate General Counsel
James K. mcCutcheonSenior Vice President andAssociate General Counsel
Vincent R. Fitzpatrick, IIIVice President andAssistant General Counsel
thomas m. HoganVice President and Assistant General Counsel
amy m. LatkinVice President and Assistant General Counsel
anne m. mcCarthyVice President andAssistant General Cousnel
FInrA/SeCreGULATOryCOmPLIAnCe
Kathryn LuExecutive Vice President and Chief Compliance Officer
eileen m. tarascoVice President
hUmAnreSOUrCeS&COrPOrATeSerVICeS
Daniel J. LeSaffreExecutive Vice President
Corporate Services
Carson J. Dunbar, Jr.Senior Vice President
James bucklandSenior Vice President
timothy R. JohnsonSecond Vice President
Employee Benefits
thomas CiocianoSenior Vice President
Jenny Lum, FLmI, aCSSecond Vice President
Facilities Management
Sean CarrollSenior Vice President
John terwilliger, FLmI, aCSSenior Vice President
Hal bacharachVice President
James griffinVice President
James D. gribbinSecond Vice President
Human Resources
michael e. Conway, SPHRSenior Vice President
tanisha L. Cash, PHRSenior Vice President
thomas a. HarwoodSenior Vice President
John R. LuebsSenior Vice President
anne m. Stanard, SPHRSenior Vice President
Training & Leadership Development
Lynn m. nadler, FLmI, aCS, aIaaSenior Vice President
Joseph KrakowskiVice President
John P. O’ConnorVice President
InTernALAUDIT
John J. Corrigan, CPa, CIa, CISaExecutive Vice President and Internal Auditor
Diana H. glynn, CPa, CIa, CISa, FLmI, aCSVice President
Robert P. Kane, CIa, CFSaVice President
mArkeTInG&COrPOrATeCOmmUnICATIOnS
William RoseExecutive Vice President andChief Marketing Officer
Administration
Sean a. mannionVice President John R. gilbrideVice President
michael P. Heffernan, CebS, CLU, ChFCVice President
annette C. Henry, CLUVice President
Peter R. Skrzypinski, FLmI, aCS, aIaaVice President
mUtUaL OF ameRICa OFFICeRS

Advertising, Direct Response & Telemarketing
ed WonacottSenior Vice President
Frances InfantinoVice President
Paul L. morigeratoVice President
marcia HudsonSecond Vice President
Competition & Research
Paul O’HaraSenior Vice President
matthew J. malmSecond Vice President
Financial Consulting Services
William g. ShannonSenior Vice President
greg F. aumanVice President
mary ellen Dolan, CebSVice President
Zohreh ghaissariVice President
mary e. LepkoVice President
ann m. nortonVice President
Joseph S. ReevesVice President
Patricia R. SawyersVice President
brian SullivanVice President
Kellie t. thomasVice President
National Accounts/Institutional Funds
thomas e. macmurray, CLU, ChFC, FLmISenior Vice President
Robert b. Kordecki, CLUSenior Vice President
James W. WardSenior Field Vice President
Sales Operations
James goberExecutive Field Vice President, Western Region
Louis a. montanti, CebSExecutive Field Vice President, Eastern Region
Scott Stankiewicz, CRPSExecutive Field Vice President, Mid-West Region
James P. Vogel, CLU, ChFCExecutive Field Vice President, Mid-South Region
Corporate Communications & Strategic Planning
Jeffrey m. angeloExecutive Vice President
barbara CraneSenior Vice President
michael J. O’gradySenior Vice President
Robert W. Ruane, CLUSenior Vice President
mary-Clare Swanke, FLmI, aCSSenior Vice President
annette barbaschVice President
John P. ClareVice President
Florence Ferguson, aCS, aIaaVice President
Samuel m. greeneVice President
martine a. Krause, aCS, aIaaVice President
Paul J. Lorenti, CebSVice President
Kathleen m. mullally, CLU, ChFCVice President
Kieran P. O’DwyerVice President
alfie tuckerVice President
taryn m. LubinSecond Vice President
mary ellen mcCarren, FLmI, aCSSecond Vice President
OFFICeOFTheChAIrmAn,PreSIDenT&ChIeFexeCUTIVeOFFICer
External Affairs
edward J. t. KenneyExecutive Vice President
OFFICeOFTheSeCreTAry
Diane m. aramonyExecutive Vice President and Corporate Secretary/Assistant to the Chairman
OFFICeOFTeChnOLOGy
Joan m. Squires, CebSExecutive Vice President andChief Information Officer
Peter nicklinSenior Vice President
MIS Operations
Robert giaquintoExecutive Vice President
Howard J. RubinSenior Vice President
Sonia SamuelsSenior Vice President
Salvatore P. ConzaVice President
michael L. ellisVice President
Ronald FriedVice President
albert Singh, FLmISecond Vice President
Office of Technology-NY
Dennis J. RoutledgeSenior Vice President
Information Security
James t. Dixon, CISSP, CISmVice President
LAN Administration/Solution Center/Telecommunications
Joseph antonowiczVice President
William J. DohertyVice President
youlian SimovVice President
MIS Business Applications
Donald L. HenningtonVice President
Phil JordanVice President
esther m. Lester, FLmI, aCSVice President
Susan WatsonVice President
mUTUALOFAmerICACAPITALmAnAGemenTCOrPOrATIOn
Administration
thomas P. KellyVice President
Client Services
Paul travers, CFa, FLmISenior Vice President
Susan J. FerberSenior Vice President
nancy mcaveySenior Vice President
Equities
Stephen J. RichExecutive Vice President and Chief Equity Strategist
marguerite H. WagnerExecutive Vice President
Fixed Income
andrew L. HeiskellExecutive Vice President andDirector of Fixed Income
gary P. Wetterau, CFaExecutive Vice President
Jacqueline SabellaVice President
michelle Olave, CFaSecond Vice President
Marketing
Kevin m. WalshSenior Vice President andChief Marketing Officer
Joseph P. O’ReillyVice President
Patrick J. SullivanVice President
Research
James P. accurso, CFaSenior Vice President and Director of Fixed Income Research
Joseph R. gaffoglio, CFa, CPaSenior Vice President
Doreen m. Johns, CFaSenior Vice President
David W. JohnsonSenior Vice President
Duygu akyatanVice President
Kevin Frain, Jr.Vice President
alexander KotlyarVice President
grace y. LeeVice President
Isabel e. macalintalVice President
John PolcariVice President
Jamie a. ZendelVice President
alexander ginisSecond Vice President
benjamin L. HebenSecond Vice President
John KorbisSecond Vice President
Robert J. Lewis, CFaSecond Vice President
michael mastrogiannisSecond Vice President
mUtUaL OF ameRICa OFFICeRS

M u t u a l o f a M e r i c a 2 0 1 1 a n n u a l r e p o r t • p a g e 5 7
AkrOn,OhIO
Frank e. ZugaroRegional Vice President
Jennifer Knepper, FLmI, aCSService Manager
Embassy Corporate Park3700 Embassy ParkwaySuite 500Akron, OH 44333-8377Tel. (330) 665-1915
AnChOrAGe,ALASkA
Dennis DudleyAssociate Account Executive
Denali Towers South2600 Denali StreetSuite 502Anchorage, AK 99503-2754Tel. (907) 274-7449
ATLAnTA,GeOrGIA
austin Ort, ChFC, CLU, CRPSVice President
gregory S. Hibbert, CRPSService Manager
Five Concourse Parkway, NESuite 1275Atlanta, GA 30328-7102Tel. (770) 396-9795
BALTImOre,mAryLAnD
michael R. braney, CRPSRegional Vice President
martha SulcaService Manager
Court Towers210 West Pennsylvania AvenueSuite 210Towson, MD 21204-5301Tel. (410) 825-7770
BOSTOn,mASSAChUSeTTS
Christopher bailey, ChFC, CRPSVice President
James mcadams, CebS, CRPSVice President
Westborough Office Park1800 West Park DriveSuite 350Westborough, MA 01581-3927Tel. (508) 366-2418
ChICAGO,ILLInOIS
Christopher Conway, ChFCVice President
Pamela m. KodrichSecond Vice President
Four Westbrook Corporate CenterSuite 240Westchester, IL 60154-5736Tel. (708) 836-0644
CInCInnATI,OhIO
Stephen g. yards, CebSRegional Vice President
Cristie a. SamsService Manager
Turfway Ridge Office Park7300 Turfway RoadSuite 560Florence, KY 41042-1386Tel. (859) 283-1200
DALLAS,TexAS
Jody a. Jurica, CebSSenior Field Vice President
Dennis P. berryVice President
Urban Towers NorthSuite 1420-N222 Las Colinas Boulevard WestIrving, TX 75039-5446Tel. (972) 556-2371
DenVer,COLOrADO
Rosa R. Weyman, CRPSRegional Vice President
barbara C. ReganSecond Vice President
Plaza Tower One6400 South Fiddler’s Green CircleSuite 1700Greenwood Village, CO 80111-4961Tel. (303) 694-6102
hArTFOrD,COnneCTICUT
Robert V. Fay, CebSSenior Field Vice President
Joy beatrice-Cody, FLmI, aCS, aIaaVice President
Somerset Square95 Glastonbury BoulevardSuite 410Glastonbury, CT 06033-4414Tel. (860) 659-3610
hOnOLULU,hAWAII
Scott t. matsumotoAssociate Account Executive
Lee m. RobinsonAssociate Account Executive
737 Bishop StreetSuite 2305Honolulu, HI 96813-3211Tel. (808) 532-1055
hOUSTOn,TexAS
Christopher thompsonSenior Field Vice President
Shari m. Lavelle, FLmI, aCS, aIaa, aRaSecond Vice President
3040 Post Oak BoulevardSuite 1250Houston, TX 77056-6552Tel. (713) 850-1371
InDIAnAPOLIS,InDIAnA
mark Deady, CebS, CRPSSenior Field Vice President
Joann bule, CebSVice President
300 North Meridian StreetSuite 1000Indianapolis, IN 46204-1382Tel. (317) 237-2190
LOnGISLAnD,neWyOrk
David J. LynchSenior Field Vice President
Joseph mullady, FLmI, aLmI, aCSVice President
Two Jericho Plaza, Suite 303Jericho, NY 11753-1670Tel. (516) 937-9177
LOSAnGeLeS,CALIFOrnIA
brian Q. Severin, CRPSSenior Field Vice President
Shannon moriarty, aIRC, aCS, CRPSVice President
111 W. Ocean BoulevardSuite 925Long Beach, CA 90802-7931 Tel. (562) 983-0407
mILWAUkee,WISCOnSIn
Paul t. Wierzba, CebS, CRPSVice President
Lisa a. thurston, aCS, aIaa, CRPSVice President
Two Park Plaza10850 West Park PlaceSuite 520Milwaukee, WI 53224-3637Tel. (414) 359-1221
mInneAPOLIS,mInneSOTA
troy S. Johnson, CRPSSenior Field Vice President
beth a. eberbach, FLmI, aCS, aIaaVice President
Normandale Lake Office Park8000 Norman Center DriveSuite 1110Bloomington, MN 55437-1119Tel. (952) 820-0089
nAShVILLe,TenneSSee
LaDoverick HugginsSenior Field Vice President
melanie J. De Cant, FLmI, aCSService Manager
One Lakeview Place25 Century BoulevardSuite 411Nashville, TN 37214-3601Tel. (615) 872-8223
neWOrLeAnS,LOUISIAnA
James murphy, CRPSVice President
eileen gettysField Vice President
mariela m. Rodriguez, FLmI, CRPSService Manager
Three Lakeway Center3838 North Causeway BoulevardSuite 3100Metairie, LA 70002-8342Tel. (504) 832-9055
neWyOrkCITy,neWyOrk
tyrone a. golatt, FLmISenior Field Vice President
Harry HarrisVice President
adyna PressleySecond Vice President
One Liberty Plaza165 Broadway, Suite 4601New York, NY 10006-1465Tel: 212-587-9045
mUtUaL OF ameRICa RegIOnaL OFFICeS

PArSIPPAny,neWJerSey
michael J. ScottVice President
Stephen g. WeberVice President
Morris Corporate Center300 Interpace ParkwaySuite 260Parsippany, NJ 07054-1125Tel. (973) 299-8228
PhILADeLPhIA,PennSyLVAnIA
Charles P. bagley, CLU, ChFC, FLmI, CRPSVice President
William R. gallagherField Vice President
anthony C. DePiero, FLmI, aCSSecond Vice President
Blue Bell Executive Campus470 Norristown Road, Suite 301Blue Bell, PA 19422-2322Tel. (610) 834-1754
PhOenIx,ArIzOnA
benjamin D. bartel, CRPSRegional Vice President
ann m. balzanoSecond Vice President
Biltmore Financial Center2398 E. Camelback RoadSuite 510Phoenix, AZ 85016-9012Tel. (602) 224-8080
PITTSBUrGh,PennSyLVAnIA
Patrick a. RingRegional Vice President
meghan mcIntyre, aCS, aIaaVice President
Three Gateway CenterSuite 2378Pittsburgh, PA 15222-1011Tel. (412) 391-1300
QUeenS,neWyOrk
Vincent t. DragoneSenior Field Vice President
mario F. bentoField Vice President
David C. DonohueVice President
Forest Hills Tower118-35 Queens BoulevardSuite 1602Forest Hills, NY 11375-7251Tel. (718) 520-8998
rIChmOnD,VIrGInIA
Robert giorgi, CRPSVice President
norman Watkins, Jr., aCSService Manager
Arboretum One9100 Arboretum ParkwaySuite 360Richmond, VA 23236-3493Tel. (804) 560-0023
rOCheSTer,neWyOrk
brian thomas, CRPSVice President
edwin W. Wallace, FLmI, aLmI, aCSVice President
Linden Oaks Office Park360 Linden OaksSuite 210Rochester, NY 14625-2814Tel. (585) 264-9890
ST.LOUIS,mISSOUrI
Ralph Joest, CRPSRegional Vice President
Lawrence grellner, CLUField Vice President
Duane Stumpp, aCS, aIaaSecond Vice President
The Sevens Building7777 Bonhomme AvenueSuite 1710St. Louis, MO 63105-1940Tel. (314) 721-3123
SAnDIeGO,CALIFOrnIA
brian Q. Severin, CRPSSenior Field Vice President
James tiensvold, CebSField Vice President
Janet Koblen, aCSVice President
Symphony Towers750 B StreetSuite 2860San Diego, CA 92101-8132Tel. (619) 544-0860
SAnFrAnCISCO,CALIFOrnIA
abbas moloo, CebS, CRPSVice President
michael P. malone, aCS, CRPSVice President
1333 North California BoulevardSuite 660Walnut Creek, CA 94596-4504Tel. (925) 937-9900
SeATTLe,WAShInGTOn
David Lim, CRPSRegional Vice President
Samuel P. taberService Manager
Alderwood Business Center3400 188th St. S.W.Suite 440Lynnwood, WA 98037-4773Tel. (425) 778-8434
SOUThFIeLD,mIChIGAn
James D. Fergusson, CLU, ChFCSenior Field Vice President
Julie malewskiVice President
One Northwestern Plaza28411 Northwestern HighwaySuite 1100Southfield, MI 48034-5518Tel. (248) 351-4190
TAmPABAy,FLOrIDA
Jeanne e. tyre, ChFCRegional Vice President
Harrison givens III, CebSSecond Vice President
Bayport Plaza3000 Bayport DriveSuite 950Tampa, FL 33607-8408Tel. (813) 281-8882
TArryTOWn,neWyOrk
Leonard egan, CLU, ChFC, CRPSVice President
Susan H. Ross, aCS, aIaaService Manager
120 White Plains RoadSuite 120Tarrytown, NY 10591-5588Tel. (914) 332-0124
WAShInGTOn,D.C.
Renee Shew, CRPSVice President
geoffrey Callan, CebSField Vice President
Caroline magruder, aCSService Manager
One Research CourtSuite 350Rockville, MD 20850-6233Tel. (301) 977-6717
WeSTPALmBeACh,FLOrIDA
barbara Romine-green, CebS, CRPS Senior Field Vice President
Darlene m. greeneVice President
One Lakeside at Centrepark1450 Centrepark BoulevardSuite 200West Palm Beach, FL 33401-2280Tel. (561) 471-1445
mUTUALOFAmerICA
National Telecommunicationsand Conference Center1150 Broken Sound Parkway N.W.Boca Raton, FL 33487-3598

Design: Decker Design, Inc.
Photography: John Madere
Printing: RR Donnelley Printed in the USA
Before investing in our variable accumulation annuity contracts, you should consider the investment objectives, risks, charges and expenses (a contract fee, Separate Account expenses and Underlying Funds expenses) carefully. This and other information is contained in the contract prospectus or brochure and the Underlying Funds prospectuses. Please read the prospectuses and brochure carefully before investing. The prospectuses and brochure can be obtained by calling 1-800-468-3785 or visiting mutualofamerica.com.
A variable accumulation annuity contract is suitable for long-term investing, particularly retirement. The value of a variable accumulation annuity will fluctuate depending on the value of its underlying Separate Account funds. At redemption, amounts placed in a variable accumulation annuity’s Separate Account may be greater or less than the principal amount invested. Generally, an annuity contract provides no additional tax-deferred treatment beyond that provided by a tax-qualified pension or retirement plan. Therefore, the annuity contract should not be selected based on this criterion.
Pursuant to FINRA Conduct Rule 2210(d)(2)(A), statements made in this publication by clients of Mutual of America are not paid testimonials. These testimonials may not be representative of the experience of other clients and are not indicative of future performance or success.
Past performance is no guarantee of future results.
1 While these ratings do not apply to the safety or investment performance of the Separate Account investment funds available under Mutual of America’s products, they do reflect the Company’s ability to fulfill its General Account obligations, which include its obligations under the Interest Accumulation Account, annuity purchase rate guarantees and annuity benefit payouts, as well as life insurance and disability income payments. Third-party ratings are subject to change.
A.M. Best, Standard & Poor’s® and Fitch Ratings are independent rating agencies. Standard & Poor’s® and S&P® are trademarks of Standard & Poor’s Financial Services LLC, a subsidiary of The McGraw-Hill Companies, Inc. Press releases are available at mutualofamerica.com/ratings.
2 Withdrawals from our products are generally subject to a 10% federal tax penalty prior to age 59 1/2, and current ordinary federal income taxes, although there are some exceptions.
3 We guarantee that we will credit interest for the life of the contract to amounts in the Interest Accumulation Account of our General Account at a rate at least equal to the greater of (1) any contractual minimum guarantee provided by the contract or (2) the minimum rate required by applicable state law or, if no state law minimum rate is applicable to a contract, the guaranteed minimum credited interest rate will be set pursuant to National Association of Insurance Commissioners (NAIC) standard nonforfeiture law. The NAIC minimum rate is determined in accordance with a formula, and cannot be less than 1.00% or more than 3.00% in any event. We determine whether the application of the formula will change the minimum guaranteed rate each November, and any change is effective the following January 1 for that calendar year. The minimum rate for 2012 has been set at 1.00% in accordance with this formula. In addition, Mutual of America may credit interest to your contract amounts in the General Account at a higher rate that we declare from time to time and which may increase or decrease at our sole discretion, although we are not obligated to credit interest in excess of the minimum guaranteed rate. If you have an existing contract, you should refer to it before making a decision, because it may have a guaranteed minimum rate in excess of the formula described above and the advertised declared rate. We compound interest daily on your contract amounts in the General Account to produce an effective annual yield that is equal to the stated interest rate. This guarantee is subject to Mutual of America’s financial strength and claims-paying ability.
4 See www.dartmouth.edu/~alusardi/Papers/FinancialLiteracy.pdf
Mutual of America Life Insurance Company, 320 Park Avenue, New York, NY 10022-6839, is a registered Broker-Dealer.
Mutual of America® and Mutual of America-Your Retirement Company® are registered service marks of Mutual of America Life Insurance Company.

1
Mutual of AmericaLife Insurance Company320 Park AvenueNew York, New York 10022mutualofamerica.com