mvc dss tutorial - obwb
TRANSCRIPT

MiddleVernonCreekDSS
Tutorial
Background
Middle Vernon Creek (MVC) is an important spawning channel for Kokanee (Oncorhynchus nerka) in the Okanagan. It typically supports between ~5000 and ~22,000 spawners each year (Figure 1) and is the principal creek used for spawning by the Kokanee population in Wood Lake. The sport fishery on Wood Lake is estimated to be worth more than $300,000 annually and is one of the few remaining low elevation lakes in the Okanagan that supports a Kokanee sports fishery. The in-stream flow requirement for Kokanee spawning in MVC during September and October is estimated to be approximately 0.15 m3/s. Unfortunately, flows are frequently below this target and MVC frequently runs dry (e.g. 2003 and 2004) (Figure 2).
Figure 1: The number of Kokanee spawners for Middle Vernon Creek from 1992 to 2005 (Geostream 2006).

Figure 2: Picture of Middle Vernon Creek running dry (from OFGC Presentation 2006).
Middle and Upper Vernon Creek drain an area of approximately 154 km2 draining to Wood Lake. From the headwaters, Upper Vernon Creek runs through a series of small lakes including the Swalwell (Beaver) Lake reservoir and then drops steeply before flowing over an alluvial fan and the Hiram Walker flume. At that location, Upper Vernon Creek is joined by Clark Creek and flows into the shallow Ellison (Duck) Lake. MVC flows out of Ellison Lake at a low gradient for approximately 5 km before joining Wood Lake (elev. 390 m). Flows in MVC are managed primarily by a permanent dam at Swalwell Lake (managed by the District of Lake Country, DLC) and a seasonal sandbag dam at the outlet of Ellison Lake (managed by the Oceola Fish and Game Club, OFGC). The sandbag dam has been utilized for almost 10 years. The Swalwell Lake outflows are usually managed conservatively, as mean annual inflows are insufficient for refilling the reservoir from a fully drained state. Several water users hold water licenses on Upper and Middle Vernon Creek, including the District of Lake Country, Eldorado Ranch, and domestic licences. Many licenses are not fully utilized (e.g. DLC only uses 20-30% of their licensed capacity. The DLC also has a large (~11,000 ML) water license on Okanagan Lake, which could potentially be used to divert water into MVC; however, the water would require de-chlorination. The Okanagan Nation Alliance (ONA) is currently in its second year of a five-year study that includes development of a water management plan for MVC. A key component of the plan is an analysis of the impacts of various reservoir operations and water withdrawals on flows in MVC, with a particular focus on the Kokanee spawning period. The water balance analysis serves as an important communication tool for exploring alternative water management strategies and communicating multiple objective trade-offs with water users. The purpose of the decision support system (DSS) for MVC is to function as an in-season management tool with new features that would allow more detailed analysis of risks and help water managers identify optimal water management strategies. Further, the design and technology platform we would use for the enhanced DSS could be extended in the future to include near real-time data links for more enhanced forecasting. This would build upon proven technology strategies and designs used in the award winning Okanagan Fish Water Management Tool (FWMT) developed by ESSA Technologies, under the technical and scientific leadership of the Canadian Okanagan Basin Technical Working Group.

Exercise 1: Running a basic scenario
Purpose: To get familiar with the scenario screen of the MVC DSS
1. Start the MVC DSS
2. Enter the following data:
a. Name: “Exercise 1”
b. Start date: 30 May 2013
c. End date: 17 November 2013
d. Swallwell lake elevation (m): Historical
e. Ellison Lake Elevation (m): Historical
3. Leave the Hydrology table unchanged.
4. Your screen should now look like Figure 3
5. Click the Run-button
6. The MVC DSS status (at the bottom of the screen) will change to “Running hydrological
submodels” and “Generating report” as the simulation runs.
7. The simulation report opens in Excel and should look like Figure 3
Figure 3: Filled out Scenario screen for Exercise 1 (left pane). Results for exercise 1 (right pane).

Exercise 2: Running a management scenario
Purpose: In this exercise we will run our first alternative management scenario
1. Start the MVC DSS (if it is not already running)
2. Enter the following data:
a. Name: “Exercise 2”
b. Start date: 30 May 2013
c. End date: 17 November 2013
d. Swallwell lake elevation (m): Historical
e. Ellison Lake Elevation (m): Historical
3. Change the “Ellison (Duck) Lake sandbag dam status” column to “Out” for all simulation weeks.
4. Your screen should now look like Figure 4
5. Click the Run-button
a. The MVC DSS status (at the bottom of the screen) will change to “Running hydrological
submodels” and “Generating report” as the simulation runs.
6. The simulation report opens in Excel and should look like Figure 4
Figure 4: Filled out Scenario screen for Exercise 2 (left pane). Results for exercise 2 (right pane).

Exercise 3: Quick updating of management actions
Purpose: To practice a quicker way of updated the management actions and calculating new flows
1. Open the “Management” sheet of the Exercise 2 report
a. Insert a new column C and D and name it “Modified outflow”)
b. Copy data from cell C2 to C18 to cell D2 to D18
c. For cell D19, enter the equation “=C19+0.150”
d. Copy the equation from cell D19 to cell D20 to D24
2. The final table should look like Figure 5
3. Select cell D2 to D24 in Excel
4. Press Ctrl+C to copy
5. Open MVC DSS
6. Click on the cell for “Swallwell (Beaver) Lake Controlled Release (m3/s) for week 23
7. Right click and select copy (see Figure 5)
Figure 5: Final excel table for Exercise 3 (left pane). Notice how modified flows in Column D are higher than Column C in
September to November. The data can be copied from Excel (or any other program) into the MVC DSS by right-clicking in a
cell in the Hydrology table and selecting Copy (right pane) for a quick way to setup new scenarios.

8. Change Name to Exercise 3
9. Your screen should now look like Figure 6
10. Click the Run-button
a. The MVC DSS status (at the bottom of the screen) will change to “Running hydrological
submodels” and “Generating report” as the simulation runs.
11. The simulation report opens in Excel and should look like Figure 6
Figure 6: Filled out Scenario screen for Exercise 3 (left pane). Notice how the values from Septermber to November is on
average approximatiy 0.50. Results for exercise 3 (right pane).
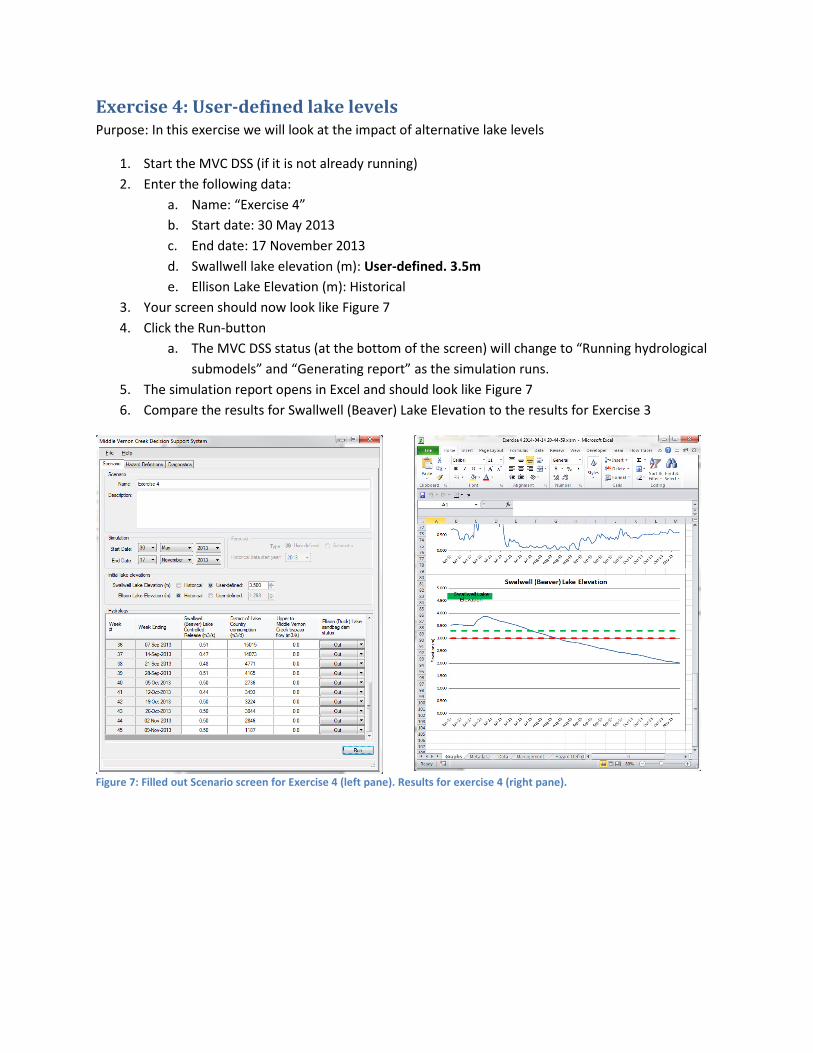
Exercise 4: User-defined lake levels
Purpose: In this exercise we will look at the impact of alternative lake levels
1. Start the MVC DSS (if it is not already running)
2. Enter the following data:
a. Name: “Exercise 4”
b. Start date: 30 May 2013
c. End date: 17 November 2013
d. Swallwell lake elevation (m): User-defined. 3.5m
e. Ellison Lake Elevation (m): Historical
3. Your screen should now look like Figure 7
4. Click the Run-button
a. The MVC DSS status (at the bottom of the screen) will change to “Running hydrological
submodels” and “Generating report” as the simulation runs.
5. The simulation report opens in Excel and should look like Figure 7
6. Compare the results for Swallwell (Beaver) Lake Elevation to the results for Exercise 3
Figure 7: Filled out Scenario screen for Exercise 4 (left pane). Results for exercise 4 (right pane).

Exercise 5: Running a forecast simulation
Purpose: In this exercise we will run our first forecast simulation
1. Start the MVC DSS (if it is not already running)
2. Enter the following data:
a. Name: “Exercise 5”
b. Start date: 1 July 2013
c. End date: 30 June 2014
d. Swallwell lake elevation (m): Historical
e. Ellison Lake Elevation (m): Historical
3. When the end date is later than the historical data, the Forecast form will be enabled. Enter the
following data
a. Forecast type: User-defined
b. Historical data start year: 1978
4. Your screen should now look like Figure 8
5. Click the Run-button
a. The MVC DSS status (at the bottom of the screen) will change to “Running hydrological
submodels” and “Generating report” as the simulation runs.
6. The simulation report opens in Excel and should look like Figure 8
Figure 8: Filled out Scenario screen for Exercise 5 (left pane). Results for exercise 5 (right pane).

Exercise 6: Adding a new Hazard Definition
Purpose: To illustrate how users can add and modify hazard definitions
1. Start the MVC DSS (if it is not already running)
2. Switch to the “Hazard Definitions” tab, see Figure 9
3. Click the “add new hazard definition” button. A new form will open
4. Enter the following data into the Hazard Definitions form
a. Objective: Swallwell Lake Drawdown
b. Performance Measure: Swallwell (Beaver) Lake Drawdown
c. Good-OK Threshold: 0.50
d. OK-Poor Threshold: 0.80
e. Time Period Start: August 1
f. Time Period End: December 31
5. You Hazard Definition form should now look like Figure 9
6. Click the OK-button
7. Switch back to the Scenario-tab
8. Change name to Exercise 6
9. Your screen should now look like Figure 10
10. Click the Run-button
a. The MVC DSS status (at the bottom of the screen) will change to “Running hydrological
submodels” and “Generating report” as the simulation runs.
11. The simulation report opens in Excel and should look like Figure 10
Figure 9: Hazard definitions tab (left pane). Hazard definitions form filled out for Exercise 6 (right pane).

Figure 10: Filled out Scenario screen for Exercise 6 (left pane). Results for exercise 6 (right pane).