my n a s a d a ta 9 -1 2 : t r o p i c a l a tl a n ti c a ... · a n a l yze g e o sci e n ce d a...
TRANSCRIPT

My NASA Data 9-12: Tropical Atlantic Aerosols & Cloud Cover Lesson Plan Purpose: Students will use NASA satellite data to determine the location of the greatest concentrations of aerosols during the course of a year in the tropical Atlantic region and their relationship to cloud coverage.
Grade Level: 8-12 Time: 2 50 minute class periods
Lesson Objectives: ● Describe aerosols and their sources in the Earth System ● Analyze aerosols and cloud cover concentrations at different
longitudes in the tropical Atlantic over 2015 and 2016 ● Develop a claim indicating perceived relationship of aerosols to
cloud cover ● Collect evidence in relation to student’s claim and provide
reasoning as to how the evidence supports the claim
Sphere(s): ● Atmosphere
Phenomena NASA Connection:
In this lesson, students will view a simulation of satellite data to observe aerosols moving across the Earth’s atmosphere where they will examine the transport of desert dust off the west coast of Africa. Desert dust warms the atmosphere regionally by absorbing radiation and suppressing storm cloud formation.
Essential Questions:
1. What influence do aerosols have on the Earth System? 2. How are clouds and aerosols connected? 3. How do we use data to make and support claims?
NGSS Performance Expectation(s):
● HS-ESS2-2. Analyze geoscience data to make the claim that one change to Earth's surface can create feedbacks that cause changes to other Earth systems.
Science & Engineering Practices: Analyzing and Interpreting Data Analyze data using tools, technologies, and/or models (e.g., computational, mathematical) in order to make valid and reliable scientific claims or determine an optimal design solution.
Disciplinary Core Ideas: ESS2.A: Earth Materials and Systems Earth’s systems, being dynamic and interacting, cause feedback effects that can increase or decrease the original changes. ESS2.D: Weather and Climate The foundation for Earth’s global climate systems is the electromagnetic radiation from the sun, as well as its reflection, absorption, storage, and redistribution among the atmosphere, ocean, and land systems, and this energy’s re-radiation into space.
Crosscutting Concepts: Stability and Change Feedback (negative or positive) can stabilize or destabilize a system.
Cross-Curricular Connections: College, Career, and Civic Life (C3) Framework for Social Studies State Standards:
● D2.Geo.1.9-12. Use geospatial and related technologies to create maps to display and explain the spatial patterns of cultural and environmental characteristics.
● D2.Geo.2.9-12. Use maps, satellite images, photographs, and other representations to explain relationships between the locations of places and regions and their political, cultural, and economic dynamics.
● D2.Geo.3.9-12. Use geographic data to analyze variations in the spatial patterns of cultural and environmental characteristics at multiple scales.
Common Core State Standards Connections: ELA/Literacy -
RST.11-12.1 Cite specific textual evidence to support analysis of science and technical texts, attending to important distinctions the author makes and to any gaps or inconsistencies in the account.
RST.11-12.2 Determine the central ideas or conclusions of a text; summarize complex concepts, processes, or informationa text by paraphrasing them in simpler but still accurate terms.

My NASA Data: 9-12, Tropical Atlantic Aerosols
Mathematics - MP.2 Reason abstractly and quantitatively.
HSN.Q.A.1 Use units as a way to understand problems and to guide the solution of multi-step problems; choose and interpret units consistently in formulas; choose and interpret the scale and the origin in graphs and data displays.
Career Connections: o Atmospheric and Space Scientists – Investigate weather and climate related phenomena to prepare weather reports and
forecasts for the public o Hydrologists - Investigate water that is at the surface of the earth or underground. o Geographic Information Systems Technicians - Provide guidance to scientists or others who use geographical
information systems (GIS) databases. o Geospatial Information Scientists and Technologists - Research or develop new geospatial technologies. o Atmospheric Chemists - Research chemicals found in the atmosphere using experiments or observation. o Environmental Scientists - Research methods for removing hazards that affect people's health or the environment. o Remote Sensing Scientists and Technologists - Research a variety of topics using remote sensing techniques. o Remote Sensing Technicians - Assist researchers using remote sensing methods.
Multimedia Resources: ● Unnarrated version of the 2017 Hurricanes and Aerosols Simulation
(https://svs.gsfc.nasa.gov/vis/a010000/a012700/a012772/12772_hurricanes-aerosols-1920-raw.mp4) ● 2017 Hurricanes and Aerosols Simulation (https://youtu.be/h1eRp0EGOmE) ● Sources of Aerosols, NASA https://svs.gsfc.nasa.gov/vis/a010000/a010300/a010386/Desert_to_Aerosol_Sources_640x360.m4v ● GLORY: The Cloud Makers, NASA (https://youtu.be/2wgiy3Qo6gg) ● CER Video, Bozeman Science: https://youtu.be/5KKsLuRPsvU ● Aerosols: Tiny Particles, Big Impact (NASA) https://earthobservatory.nasa.gov/Features/Aerosols/page1.php
Materials/Resources Needed: Teacher Demonstration: (optional) ● Map, Atlas or Globe
Per Student: ● 1 Copy of the following sheets per student
○ KWL Chart ○ Map of Research Area ○ Student Data Sheet ○ C-E-R Rubric (cut in half) ○ Clouds and Aerosols: How much do you know? Quiz
(optional) ● Ruler ● Pencil
Key Vocabulary:
● Aerosol ● Claims ● Cloud cover ● Evidence ● optical depth or thickness ● Reasoning
Background Information:
Teacher Background Content: The atmosphere is a mixture of gases including nitrogen, oxygen, carbon dioxide and other trace gases. Additionally, the atmosphere contains small, suspended liquid and particle matter called aerosols. Aerosols come from various sources, both natural and anthropogenic (man-made). Some examples are volcanic ash, dust, sand, sea salts, industrial pollutants and smoke from biomass burning. Aerosols are important to study and monitor because they have direct and indirect effects on regional weather and global climate. Depending upon their exact nature, several radiation budget effects may occur. For instance, some aerosols can scatter back the sun’s radiation to space (a cooling effect). Some can absorb radiation, keeping radiation from escaping to space (a warming effect). Some change cloud particle sizes, invoke chemical reactions, or even suppress cloud formation (modifying cloud radiative effects). The global balance between all of these effects is still being determined and is heavily debated in the field of Earth science.
2

My NASA Data: 9-12, Tropical Atlantic Aerosols
There are several NASA satellite instruments currently monitoring the Earth’s atmosphere to measure aerosols. The satellite does not directly measure the aerosol concentration, but rather the instruments measure aerosol optical thickness, (AOT) or the extent that aerosols reduce the passage of sunlight through the atmosphere by scattering or absorption. The larger the optical depth, the less radiation reaches Earth’s surface. One of the questions that NASA scientists are trying to answer with data from the Aqua, Cloudsat, and CALIPSO satellites is what impact warm, dry, dusty air blowing out of the Sahara Desert might have on hurricane formation in the Atlantic. Does the dry air suppress hurricane formation, or does dust provide seeds for clouds, prompting storm formation? Together, the three satellites reveal humidity, aerosols (dust), temperature, and cloud structure within the layer of Saharan air, which allows scientists to map out these characteristics of the air mass in relation to where and when hurricanes form. By understanding where Saharan air is in relation to hurricanes, scientists can then observe what impact the air might have on storms. In this lesson, you will be exploring real NASA satellite data from the Multi-angle Imaging Spectroradiometer (MISR) instrument to examine the transport of desert dust off the west coast of Africa. Desert dust warms the atmosphere regionally by absorbing radiation and suppressing storm cloud formation. For more information, visit GLORY: The Cloud Makers, NASA (https://youtu.be/2wgiy3Qo6gg). Data Types:
● Monthly Cloud Coverage (percent) collected by the CERES Mission. Cloud coverage describes the amount of clouds in the sky. Cloud coverage is sometimes called cloud fraction or cloud cover. It can be measured as a percentage (0-100) or as a fraction (0-1). Monthly cloud coverage is averaged over a month. This parameter shows how much of the Earth was covered by clouds, on average, over the selected month. My NASA Data includes many types of cloud coverage data, each corresponding to a particular type of cloud or cloud coverage (see a cloud chart). In this case, the parameter includes all clouds of any type. It is an overall measure of how much of the sky was covered with clouds throughout the month.
● Monthly Aerosol Optical Depth (dimensionless) collected by the MISR Mission. This parameter measures how “thick” the quantity of aerosols in the atmosphere is, averaged over a month. This parameter is measured based on “optical depth.” Optical means “light” and “optical depth” is related to the passage of light through a medium. When light passes through the atmosphere, it interacts with air, cloud, or aerosol particles. This interaction can reduce how much of the light is able to pass through the atmosphere. Light passing through a medium is called “transmission”. Optical depth is a measure of how much light is transmitted through a medium compared to the incoming (“incident”) light. Since aerosols reduce transmission, optical depth measures how opaque the atmosphere is. The physical thickness (size) of cloud or aerosol layers plays a role in Earth’s energy budget. However, the optical depth of cloud and aerosol layers is much more important to Earth’s energy budget. This parameter is a monthly average of the optical depth measurement.
Data Issues: The Monthly Aerosol Optical Depth data used in this lesson were collected from NASA’s MISR (Multi-angle Imaging SpectroRadiometer) instrument onboard the Terra satellite. Students will notice that these line graphs may not be complete, meaning that there are gaps in the data. The missing data could be due to a variety of reasons such as problems with the sensor’s performance, communications, or reception, for example. These gaps provide a teachable moment to address a tenant of the Nature of Science: Science demands evidence. Scientific knowledge is derived from data and evidence gathered by observation or experimentation. Scientists prefer to control the conditions to obtain their data, however, this is not always practical (like studying the Earth from a satellite). In these cases, observations must be made over a large periods of time so that scientists can collect a wide base of evidence. This reliance on evidence make the development of better technologies and observation techniques very important.
Prerequisite Student Knowledge/Skills: ● latitude and longitude ● line graphs and components of a graph
3

My NASA Data: 9-12, Tropical Atlantic Aerosols
● cloud cover % (For lesson on this topic, see the GLOBE Learning Activity: Estimating Cloud Cover: A Simulation, https://scool.larc.nasa.gov/lesson_plans/globe-cloudcover.pdf
Possible Misconceptions: ● Often students have problems with the computation, prediction, and extracting information not explicitly
included in the graph. ● New clouds cannot form. Clouds are just pushed from place to place (AAAS Project 2061, n.d.). ● Aerosols are all man-made and bad for the environment.
Procedure:
Pre-Lesson Task: 1. Load the unnarrated version of the 2017 Hurricanes and Aerosols Simulation video.
Part 1: Engage Prior Knowledge of Aerosol Movement in the Atmosphere
1. Tell students that you will show them an unnarrated simulation created by data and computer models. Tell them that there are no labels, dates or indication of color scales.
2. Review the Frayer Model with the students to guide their observations: 3. Frayer Model includes:
a. Topic in the Center: Students write down what they believe is the basis of their observation b. How long do you think this simulation covers (1 day, week, month, season, year/s, decades)? Why? c. What do the different colors indicate? d. What patterns do you see? e. In what ways does the atmosphere connect the continents?
4. Play the video. 5. Students describe their answers. 6. Set the learning intention by telling students that they will be exploring aerosols in the atmosphere and their
relationship to weather.
Part 2: Aerosols: Introduction 1. Present the term “Aerosols” in the KWL 2. Students work in teams to brainstorm what they know (K) and questions that they have (W) and share these
with the class. 3. Tell students that aerosols are natural and human-made. Review the Teacher Background for more
information on Aerosols. Students will review a video and try to identify the four sources and their approximate location in the movie. Play the Sources of Aerosols video with the class (~2 min)
4. Review students findings of the sources of aerosols with the class: India (urban haze-sog), desert dust (Northern Africa), biomass burning (California, US), and ocean (salt) spray (Pacific Ocean).
5. Show the Youtube 2017 Hurricanes and Aerosols Simulation (narrated version). Students should look for the answers to these three questions:
a. What are the three types of aerosols that this video show? b. What are their colors? c. Where are they concentrated?
i. Sea Salt - blue ii. Dust - tan (African) iii. Smoke - white (North America’s Pacific Northwest)
6. Describe the video to students: a. Tracking the aerosols carried on the winds let scientists see the currents in our atmosphere. This
visualization follows sea salt, dust, and smoke from July 31 to November 1, 2017, to reveal how these particles are transported across the map.
b. The first thing that students may notice is how far the particles can travel. Smoke from fires in the Pacific Northwest gets caught in a weather pattern and pulled all the way across the US and over to Europe. Hurricanes form off the coast of Africa and travel across the Atlantic to make landfall in the United States. Dust from the Sahara is blown into the Gulf of Mexico. To understand the impacts of aerosols, scientists need to study the process as a global system.
4

My NASA Data: 9-12, Tropical Atlantic Aerosols
Part 3: Clouds & Aerosols
1. Set the stage by explaining to the students that they will be reviewing graphs of aerosol and cloud cover percentage taken of the tropical Atlantic during 2015 and 2016.
2. Distribute Map of Research Area, identify the 29°N latitude in the tropical region of the Atlantic. Have students label the continents. Identify the different lines of longitude along the 29°N latitude on their map. Note: the map only features major meridian (0, 30°, 60°) lines so students must infer the 75°W, 45°W, 15°W, and 15° E. Students should draw these lines in using a ruler. Ask students what they already know about this region. Students may likely mention that this region is characterized by hurricanes and tropical storms, warm ocean temperatures, Northeast Trade Winds, Prevailing Westerlies, etc.
3. Distribute the Student Data Sheet (note: one sheet contains two copies). Review the Claim, Evidence, Reasoning. For more information on the use of the C-E-R Chart, see MND Lesson: Introduction: Building Claims from Evidence or the CER Youtube Video. Distribute the C-E-R Rubric and review with students.
4. Now, distribute the 2015 graphs to students. Together review the January graphs: Aerosol and Cloud Coverage. Point to the graphs’ titles, units, labels, etc. Identify the location of these graphs along the Map.
5. Together model the process of making an observation with students by first identifying longitude band: 1.) 75°W-45°W 2.) 45°W - 15°W 3.) 15°W - 15° E
Part 4: Jigsaw Learning
1. We will use a Jigsaw Teaching Model to help students process the data in the graphs more efficiently. InItially, divide the class into five groups (January, April, July, October, December). Students will be assigned different months of 2015 to review first. Allow students to work in their team to review the graphs for their month for about 3-5 minutes.
2. Next, students will work together to create a claim that links aerosols with formation of cloud cover percent. They will write this on the top of the Student Data Sheet. Encourage students to include variables such as month, season, or degrees longitude into their claim statements.
Possible claims could include: -The more aerosol concentrations during the XX months, the more/less cloud cover in the XXX months. (and vice versa) -The more concentrations of aerosols in XXX longitude, the more/less cloud cover in XXX longitude.
3. Next, further divide each group into three: 1.) 75°W-45°W, 2.) 45°W - 15°W, and 3.) 15°W - 15° E so that students can focus their observations and then share with their larger group.
5

My NASA Data: 9-12, Tropical Atlantic Aerosols
a. Students will continue to review the graph but this time only in their latitude bands. They will make qualitative and quantitative observations and write these under the 2015 Evidence columns.
b. Next, have students review their evidence in light of their Claim. Does this support the Claim? If so, how? If not, why not? Write these ideas briefly in the space provided. (This could be done for homework.)
c. Students should return their team and report their findings. Repeat Steps 6-7 but for 2016 data.
Wrapping Up:
1. Students should create a larger data table showing their information in the Student Data Sheet as on a sheet of paper, butcher paper, dry erase board, or PPT/Google Slide to present to the class. This data table should summarize the Team’s works. Students share their claims and describe why the claim is valid and include the following. NOTE: Students claims may not have been substantiated with evidence. This is ok. Students should describe with i-iii as to why the Claim was insufficient.
a. general scientific principle that supports this claim b. background/ prior knowledge and reasoning with the class c. scientific data that supports the claim through data taken from the graphs with specific examples
referenced from different longitude bands, variable, month, and year
2. Independently, have students complete the Learn part of the KWL and share out. 3. Optional: see assessment
KWL Chart Student Name: Date: Period:
K W L What do you think you know? What do you WANT to learn?
What questions do you have? What did you LEARN?
6

My NASA Data: 9-12, Tropical Atlantic Aerosols
7

My NASA Data: 9-12, Tropical Atlantic Aerosols
8

My NASA Data: 9-12, Tropical Atlantic Aerosols
Student Data Sheet Longitude Band: 75°W-45°W 45°W - 15°W 15°W - 15° E
Student Name: Date: Period:
Claim: (One sentence statement that addresses the relationship between aerosol and % cloud coverage.)
Evidence: Sufficient, Appropriate, and Observation-driven
Reasoning (Why is this evidence important?)
2015 Aerosols:
1.
2.
3.
2016 Aerosols:
1.
2.
3.
2015 Cloud Cover:
1.
2.
3.
2016 Cloud Cover:
1.
2.
3.
2015 Aerosols:
1.
2.
3.
2016 Aerosols:
1.
2.
3.
2015 Cloud Cover:
1.
2.
3.
2016 Cloud Cover:
1.
2.
3.
9

My NASA Data: 9-12, Tropical Atlantic Aerosols
C-E-R Rubric
Description 3 Points 2 Points 1 Point 0 Points
Claim Makes an accurate and complete
statement linking independent and dependent variables
Makes an accurate but incomplete claim addressing only one
variable
Makes an inaccurate claim
Does not make a claim
Evidence Provided appropriate and sufficient
evidence to support claim using qualitative and quantitative observations of both the independent and dependent
variables
Provide appropriate but insufficient evidence to support
claim
Provides inappropriate evidence. The
evidence does not support the claim
Does not provide evidence
Reasoning Provides reasoning that connects each piece of evidence to the claim. Uses scientific principles to explain why the
evidence supports the claim.
Provides appropriate but incomplete reasoning. Each piece of evidence is not supported by a
line of reasoning.
Provides inappropriate
reasoning.
Does not provide reasoning.
Total
Student Name: Date: Period:
C-E-R Rubric
Description 3 Points 2 Points 1 Point 0 Points
Claim Makes an accurate and complete
statement linking independent and dependent variables
Makes an accurate but incomplete claim addressing only one
variable
Makes an inaccurate claim
Does not make a claim
Evidence Provided appropriate and sufficient
evidence to support claim using qualitative and quantitative observations of both the independent and dependent
variables
Provide appropriate but insufficient evidence to support
claim
Provides inappropriate evidence. The
evidence does not support the claim
Does not provide evidence
Reasoning Provides reasoning that connects each piece of evidence to the claim. Uses scientific principles to explain why the
evidence supports the claim.
Provides appropriate but incomplete reasoning. Each piece of evidence is not supported by a
line of reasoning.
Provides inappropriate
reasoning.
Does not provide reasoning.
Total
10

My NASA Data: 9-12, Tropical Atlantic Aerosols
Student 2015 Graphs
Monthly Aerosol Optical Depth (MISR) (dimensionless)
LATITUDE : 28.8N 16-JAN-2015 12:00
Monthly Cloud Coverage (CERES) (percent) LATITUDE : 28.8N 16-JAN-2015 12:00
11

My NASA Data: 9-12, Tropical Atlantic Aerosols
Monthly Aerosol Optical Depth (MISR) (dimensionless) LATITUDE : 28.8N 16-APR-2015 00:00
Monthly Cloud Coverage (CERES) (percent) LATITUDE : 28.8N 16-APR-2015 00:00
12
My NASA Data: 9-12, Tropical Atlantic Aerosols
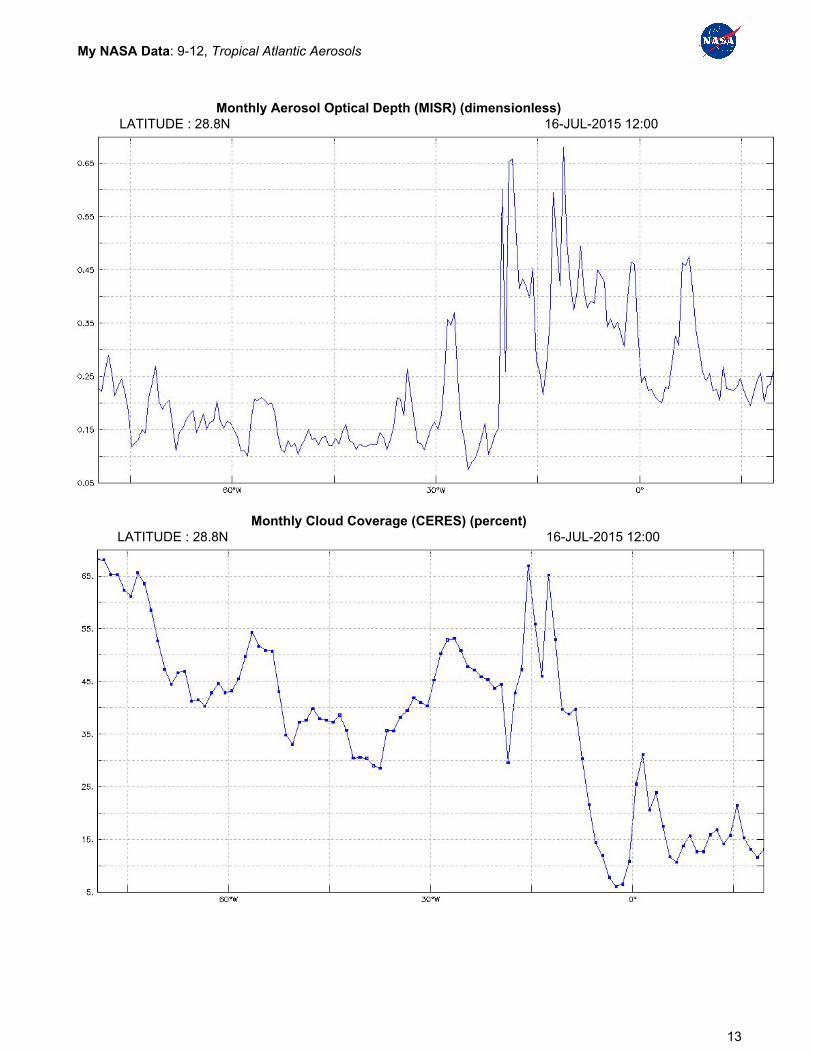
Monthly Aerosol Optical Depth (MISR) (dimensionless) LATITUDE : 28.8N 16-JUL-2015 12:00
Monthly Cloud Coverage (CERES) (percent)
LATITUDE : 28.8N 16-JUL-2015 12:00
13

My NASA Data: 9-12, Tropical Atlantic Aerosols
Monthly Aerosol Optical Depth (MISR) (dimensionless)
LATITUDE : 28.8N 16-OCT-2015 12:00
Monthly Cloud Coverage (CERES) (percent) LATITUDE : 28.8N 16-OCT-2015 12:00
14

My NASA Data: 9-12, Tropical Atlantic Aerosols
Monthly Aerosol Optical Depth (MISR) (dimensionless)
LATITUDE : 28.8N 16-DEC-2015 12:00
Monthly Cloud Coverage (CERES) (percent) LATITUDE : 28.8 16-DEC-2015 12:00
15

My NASA Data: 9-12, Tropical Atlantic Aerosols
Student 2016 Graphs
Monthly Aerosol Optical Depth (MISR) (dimensionless) LATITUDE : 28.8N 16-JAN-2016 12:00
Monthly Cloud Coverage (CERES) (percent)
LATITUDE : 28.8N 16-JAN-2016 12:00
16

My NASA Data: 9-12, Tropical Atlantic Aerosols
Monthly Aerosol Optical Depth (MISR) (dimensionless) LATITUDE : 28.8N 16-APR-2016 00:00
Monthly Cloud Coverage (CERES) (percent)
LATITUDE : 28.8N 16-APR-2016 00:00
17

My NASA Data: 9-12, Tropical Atlantic Aerosols
Monthly Aerosol Optical Depth (MISR) (dimensionless)
LATITUDE : 28.8N 16-JUL-2016 12:00
Monthly Cloud Coverage (CERES) (percent)
LATITUDE : 28.8N 16-JUL-2016 12:00
18

My NASA Data: 9-12, Tropical Atlantic Aerosols
Monthly Aerosol Optical Depth (MISR) (dimensionless)
LATITUDE : 28.8N 16-OCT-2016 12:00
Monthly Cloud Coverage (CERES) (percent) LATITUDE : 28.8N 16-OCT-2016 12:00
19

My NASA Data: 9-12, Tropical Atlantic Aerosols
Monthly Aerosol Optical Depth (MISR) (dimensionless)
LATITUDE : 28.8N 16-DEC-2016 12:00
Monthly Cloud Coverage (CERES) (percent) LATITUDE : 28.8N 16-DEC-2016 12:00
20

My NASA Data: 9-12, Tropical Atlantic Aerosols
Clouds and Aerosols: How much do you know? STUDENT COPY
Directions: Answer the questions below by circling the letter next to with the the best answer.
What are aerosols? A. Another name for precipitation B. Another name for greenhouse gases like carbon dioxide and methane C. Minute particles suspended in the atmosphere D. All of the above 2. Most aerosols in the atmosphere are from human-caused pollution. A. True B. False 3. What effects do various aerosols have on the climate? A. Reflect sunlight back into space, cooling the planet B. Provide a platform for water droplets and ice crystals to form and develop into clouds C. Increase the brightness of clouds, making them reflect more solar energy back into space D. Absorb sunlight, heat the surrounding air and prevent cloud formation E. All of the above F. a, b, and c 4. Where in the atmosphere are aerosols found? A. Only in the troposphere, the layer closest to Earth’s surface B. Only in the stratosphere C. At all altitudes
21

My NASA Data: 9-12, Tropical Atlantic Aerosols
Clouds and Aerosols: How much do you know? TEACHER’S ANSWER KEY
Directions: Answer the questions below by circling the letter next to with the the best answer.
1.What are aerosols?
C. Minute particles suspended in the atmosphere
Aerosols range in size from smaller than the smallest virus to about the diameter of a human
hair and can remain aloft anywhere from a few days to years.
2. Most aerosols in the atmosphere are from human-caused pollution
B. False
Most occur naturally, including sea salt, desert dust, wildfire smoke and sulfates from volcanic
eruptions. A significant minority is from human causes such as industrial pollution, cars and
deliberate burning of trees and agricultural waste. But the artificial stuff can dominate the air
downwind of urban and industrial areas.
3. What effects do various aerosols have on the climate?
E. All of the above
We admit that this is a tricky one, but that’s part of what makes aerosols so hard to pin down
in climate models. Various kinds of aerosols have various kinds of effects, both direct and
indirect. As a direct effect, aerosols scatter sunlight back into space. As an indirect effect, they
can either help or hinder the development of clouds, which in turn can either cool or warm the
planet.
4. Where in the atmosphere are aerosols found?
C. At all altitudes
Aerosols can be found in the air over oceans, deserts, mountains, forests, ice, and every
ecosystem in between. They can be found drifting in Earth’s atmosphere from the
stratosphere to the troposphere to the Earth's surface.
22