myocardial blood flow and its distribution in anesthetized...
TRANSCRIPT

619
Myocardial Blood Flow and Its Distributionin Anesthetized Polycythemic Dogs
ADRIANTA SURJADHANA, JACQUES ROULEAU, LAWRENCE BOERBOOM, AND
JULIEN I.E. HOFFMAN
SUMMARY Decreased cardiac output, coronary blood flow, and systemic oxygen transport in poly-cythemia are attributed to increased blood viscosity and regarded as potentially harmful. We studiedthe effects of isovolemic polycythemia on these variables as well as on myocardial oxygen consumptionand regional myocardial blood flow in 31 anesthetized dogs, seven with cannulated left main coronaryarteries. Measurements were made at rest, during hypoxemia or adenosine infusions, and with aorticstenosis, pacing, or an aorto-atrial fistula. When hematocrit increased from 42% to 66%, it reducedcardiac output by 36% and systemic oxygen transport by 8%; with hypoxemia, cardiac output rose inpolycythemic dogs. Normoxemic polycythemia decreased myocardial blood flow by 46% and increasedmean coronary resistance by 54%, slightly decreased myocardial oxygen transport and consumption,and did not alter coronary sinus oxygen tension or myocardial oxygen extraction. Cardiac stress,hypoxemia, and adenosine infusion lowered coronary resistance in polycythemic dogs. Left ventricularmyocardial oxygen transport was dependent on pressure work and not on arterial oxygen content orhematocrit. With maximal coronary vasodilation, coronary vascular resistance at hematocrits of 66%was 1.5 times that at 42%. Polycythemia per se did not alter the even distribution of flows across theleft ventricular wall, but subendocardial underperfusion began at higher perfusion pressures inpolycythemic than in normocythemic dogs. We conclude that autoregulation plays a role in regulatingflows and oxygen transport in polycythemia. With maximal coronary vasodilation, however, theincreased viscosity of polycythemic blood could be an important factor reducing the amount ofmyocardial blood flow and oxygen transport.
THE EFFECTS of polycythemia on the circulationdepend in part on whether there is an associatedincrease in blood volume1 which is usually elevatedin most forms of polycythemia in man.2"5 Becauseof the raised blood volume, cardiac output is usuallyincreased, unless there is heart failure. Systemicoxygen transport (cardiac output times arterialoxygen content) is therefore increased above nor-mal when arterial oxygen saturation is normal4 andmay be normal or only moderately reduced whenthere is arterial hypoxemia.6
In experimental animals it is possible to keepblood volume constant when inducing polycythe-mia, thereby demonstrating the effects of the raisedhematocrit per se.1'7"9 With high hematocrits, sys-temic oxygen transport decreases because cardiacoutput is decreased more than arterial oxygen-carrying capacity is increased. The fall in outputhas been attributed to the increased viscosity ofpolycythemic blood, and the reduced systemic ox-ygen transport has been regarded as actually orpotentially endangering the supply of oxygen to
From the Cardiovascular Research Institute and the Department ofPediatrics, University of California, San Francisco, California.
Supported by Program Project Grant HL 06285 from the NationalHeart, Lung, and Blood Institute.
Dr. Surjadhana was funded by a research grant from the UniversityWidya Mandala, Surabaya, Indonesia. Dr. Rouleau was supported by theCanadian Heart Foundation.
Address for reprints: Julien I.E. Hoffman, M.D., 1403-HSE, Universityof California, San Francisco, California 94143.
Received April 7, 1977; accepted for publication May 5, 1978.
tissues.7'10 Some support for these hypotheses inman has come from studies in children with cy-anotic heart disease in whom an isovolemic reduc-tion of hematocrit caused an increase in cardiacoutput and systemic oxygen transport.6 However,demonstration of the inadequacy of the oxygensupply in polycythemia has not been well docu-mented. In polycythemic dogs" or people,12 in-creased blood viscosity does not prevent the cardiacoutput from rising with exercise so that autoregu-latory responses need not be abolished by polycy-themia.
Less attention has been paid to the effects ofpolycythemia on coronary blood flow. There was areduced coronary blood flow to the left ventriclewhen polycythemia was produced in dogs,9'13' u andsimilar findings in people living at high altitudewere reported by Moret et al.;15 the coronary vas-cular bed therefore seems to respond like the wholebody when there is polycythemia. No studies ofregional myocardial blood flow have been done inpolycythemia, yet there is reason to think that highhematocrits might play a part in producing myo-cardial ischemia. Children with cyanotic heart dis-ease may have subendocardial hemorrhages, necro-sis, or fibrosis at autopsy,16 so that the possibility ofsubendocardial ischemia caused by polycythemiamust be considered.
Because of the occurrence of polycythemia inmany diseases and because of the physiologicalimportance of understanding the control of oxygen
by guest on June 2, 2018http://circres.ahajournals.org/
Dow
nloaded from

620 CIRCULATION RESEARCH VOL. 43, No. 4, OCTOBER 1978
delivery in polycythemia, we designed studies ofdogs with acute isovolemic polycythemia. We mea-sured cardiac output and total and regional myo-cardial blood flows, as well as systemic and leftventricular myocardial oxygen transport. Thesemeasurements were made at rest and after stressingthe circulation by producing hypoxemia or alteringcardiac work by pacing, aortic stenosis, or an aorto-atrial fistula, and also after infusing adenosine toabolish autoregulation.
MethodsThirty-one dogs weighing 25-35 kg were anesthe-
tized with sodium pentobarbital, 30 mg/kg, iv, andgiven small supplemental doses as needed. Theywere ventilated via a cuffed endotracheal tube by aHarvard respirator with room air and either addedoxygen to maintain normal arterial oxygen tensionsor nitrogen to produce hypoxemia. We opened thethorax in the 5th left intercostal space, incised thepericardium, and supported the heart in a pericar-dial cradle. Two end-hole catheters were insertedinto the left atrium through its appendage, one tomeasure pressure and one to inject microspheres.The coronary sinus was cannulated to obtain bloodsamples and measure its pressure. Pressures in theleft ventricle were measured with a catheter tipmanometer (Bio-Tek Instruments) insertedthrough the left atrium and mitral valve, and aorticpressures were measured by a catheter advancedinto the ascending aorta from the ieft femoral ar-tery. Pulmonary arterial pressures were measuredwith a side-hole catheter inserted directly into themain pulmonary artery. All pressures, except forthose from the catheter tip manometer, were mea-sured with Statham P23Db transducers and thetracings were recorded on a Beckman 12 channelDynograph pen recorder. Large polyvinyl catheterswere placed in a femoral and a jugular vein forinfusing and withdrawing blood, and a catheter wasplaced in the right femoral artery to obtain refer-ence samples during microsphere injection.
In seven of these dogs we placed a modified Greggcannula in the left main coronary artery via thesubclavian artery. The cannula received blood froma pressurized bottle and this bottle, in turn, wasfilled from the dog's carotid artery by a Sarns rollerpump; the bottle was kept in a water bath at 37°C.Pressure in the coronary artery was measured viaa tube that passed inside the cannula to its tip.
Phasic and mean flows in the circumflex or leftanterior descending coronary artery were recordedwith an electromagnetic flowmeter (Narco Biosys-tems). A thread was placed distal to the transducerto obtain periodic occlusion zeros and to test reac-tive hyperemia. Lead II of the electrocardiogramalso was recorded.
Total and regional myocardial blood flows weremeasured with 9 ± 1 (SD) jum in diameter micro-spheres labeled with 125I, H1Ce, ^Sr, or 46Sc (3MCompany). Microspheres were injected into the leftatrium except that, in the dogs with the Gregg
cannula, they were injected into the tubing leadingto the cannula. The microspheres were suspendedin saline to which Tween 80 had been added to aconcentration of less than 0.05% to reduce aggre-gation. The vial was then placed on a Vortex mixerjust before injection to ensure uniform suspension;microscopic examination of samples from the vialrevealed no aggregates. For the left atrial injection,we injected about 3 X 10⁶ microspheres with 15-20ml of warmed blood over 15-20 seconds and col-lected reference samples for 2 minutes with a Holterpump at a steady rate of 11-12 ml/min. In the dogswith the Gregg cannula, we injected about 3 x 10⁵
microspheres with 15 ml of warmed blood over15-20 seconds and collected a reference sample ata rate of 11-12 ml/min from a side arm of thecannula that was about 40 cm from the point ofinjection and separated from it by two mixing cham-bers.
At the end of the experiment, the dogs were killedwith potassium chloride or sodium pentobarbital.The heart was removed and placed in 10% formalinfor 5-7 days, after which it was cut into atria, rightand left ventricular free walls, and ventricular sep-tum. The left ventricular free wall and septum werecut into three segments from apex to base, and eachsegment was cut into four layers of about equalthickness from endocardium to epicardium or, forthe septum, from left to right ventricular sides. Theright ventricle was also cut into three segmentsfrom apex to base, and each segment was dividedinto inner and outer layers of equal thickness. Theindividual layers were then cut into small pieces,placed in vials, and their gamma emissions werecounted for 1 minute in a well scintillation counterwith a sodium iodide crystal. We used a multichan-nel pulse height analyzer with variable regions ofinterest (Nuclear-Chicago), according to the meth-ods described by Heymann et al.17 The counts perminute of the tissues and blood samples were thenrun on an IBM 360 computer to determine flows,flows per gram, and cardiac outputs. The percent-age of total counts of each isotope in the region ofinterest and the counting efficiency were related tothe height of the tissues in the vial, and correctionswere included for these in the program.
Flow to any cardiac region (ml/min) was com-puted as Cr X Fa/Ca where Cr and Ca are thecounts per minute in the cardiac regions and bloodreference samples, respectively, and Fa is the rateof withdrawal of the reference sample (ml/min).For any region of the heart, the flows in componentpieces were added and the total was divided by thetotal weight of the pieces to give the average flowper gram in that region. Cardiac output was calcu-lated as Ci X Fa/Ca, where Ci is the total countsper minute injected into the left atrium.
Donor blood, collected from one or two dogs 1day before or on the day of study, was centrifuged(International Equipment Co.), and the dogs weregiven heparin (500 IU/kg). Polycythemia wasachieved by infusing 1000-1500 ml of packed red
by guest on June 2, 2018http://circres.ahajournals.org/
Dow
nloaded from
CORONARY BLOOD FLOW IN POLYCYTHEMIA/Sur/WAana et al. 621
cells (hematocrit 85-90) into the dogs while thesame amount of whole blood was withdrawn over30-40 minutes. Hematocrits were determined onarterial samples by the microhematocrit method(International Equipment Co.); no correction wasmade for trapped plasma. Like Gregg and Wiggers,18
we observed that the spleen was very distendedafter transfusion and that we could maintain higherhematocrits after acute splenectomy; this was done,therefore, on all except the first six dogs. ArterialpH, Po2, and Pco2 were measured with a Radiome-ter blood gas analyzer at 37°C; in some dogs thiswas done also for coronary sinus blood. The oxygencontents of arterial and coronary sinus sampleswere measured by the Lex-O2-Con (Lexington In-strument Corp.). Part of the same sample was ex-posed to room air for 20 minutes in a tonometer andanalyzed for oxygen capacity. Blood oxygen satu-ration was then calculated by correcting for dis-solved oxygen.
In six splenectomized dogs we measured bloodvolume before and after exchange transfusion. Welabeled the dogs' own red cells with nonradioactivecesium, injected the cells, and sampled them after10 and 20 minutes. The cell dilution was detectedby fluorescence excitation19 and the blood volumewas calculated by extrapolating back to zero time.No correction was made for differences betweenlarge vessel and whole-body hematocrits.
Statistical tests were done by unpaired £-tests,linear regression, and correlation and multiple lin-ear regression.20 Values are reported as mean ±standard error unless otherwise specified.
Experimental ProtocolWe studied 31 dogs, 24 without and 7 with a
Gregg cannula. In 10 of the uncannulated dogs, westudied those with normal hematocrits and thengave an exchange transfusion to raise the hemato-crit; arterial oxygen tension was kept normal. Ineight other uncannulated dogs, we did not makecontrol measurements with normal hematocrits butmade the first measurements with polycythemia; infour dogs with normal hematocrits, polycythemiawas not produced, and two dogs with polycythemiawere not studied unstressed. Thus, in total, therewere 14 dogs with normal hematocrits and 18 un-stressed polycythemic dogs with normal arterialoxygen tensions. Eighteen polycythemic dogs werethen studied during stress. We made 16 measure-ments with hypoxemia in which arterial oxygentensions varied from 20-60 torr, seven measure-ments while pacing the atria between 200 and 250beats/min, and eight measurements in which anaortic-right atrial fistula was produced. We alsoinduced supravalvar aortic stenosis with peak sys-tolic gradients ranging from 75 to 220 mm Hg byplacing an umbilical tape around the ascendingaorta and made eight measurements; one of thesewas in a dog with a fistula. Three uncannulateddogs were studied with normal hematocrits beforeand after hypoxemia, and five measurements were
made with arterial oxygen tensions between 20 and50 torr. Before each intervention, arterial bloodgases and pH were checked and corrected if needed.After the microsphere injection, we sampled arterialand coronary sinus blood to measure blood oxygencontent and capacity, gases, and pH. In anotherseven dogs we produced polycythemia and theninserted a Gregg cannula into the left main coronaryartery. While left ventricular systolic pressure waskept constant, we reduced perfusion pressure in thecoronary artery and measured flows at 21 differentDPTIc:SPTI ratios (see below). In three of thesecannulated dogs, we infused adenosine into theperfusion line (1.22 mg/min) until reactive hyper-emia was abolished and flow measurements weremade at six different DPTIc: SPTI ratios.
CalculationsMyocardial oxygen demand was estimated from
the tension time index (TTI) of Sarnoff et al.21
obtained by multiplying the mean left ventricularpressure by cycle length and subtracting from it themean left atrial pressure multiplied by diastolicduration. Mean pressures were measured by elec-trical damping. We prefer to call this index thesystolic pressure time index (SPTI) rather thenTTI because tension is not measured. SPTI multi-plied by heart rate gives SPTI per minute (mm HgX sec/min). The area between the aortic and leftventricular pressures in diastole was calculated bymultiplying the difference between mean aortic andleft ventricular diastolic pressures by diastolic du-ration; we termed this the diastolic pressure timeindex or DPTI. Multiplying DPTI by heart rategave DPTI per minute (mm Hg X sec/min), anindex of pressure and time available each minutefor coronary perfusion in diastole. In the cannulateddogs, DPTI was calculated similarly, except thatcoronary arterial pressure at the tip of the cannulareplaced aortic pressure; the index was termedDPTIc. The ratio DPTLSPTI or DPTIc:SPTI isused to predict subendocardial blood flow,22 andwhen either of these ratios is multiplied by arterialoxygen content (CaO2), it should predict the bal-ance of myocardial oxygen supply and demand.23
Systemic oxygen transport (ml/min per kg) is theproduct of cardiac output (liters/min per kg) andarterial oxygen content (ml/liter), and left ventric-ular oxygen transport (ml/min per 100 g) is theproduct of left ventricular flow (liters/min per 100g) and arterial oxygen content (ml/liter). Left ven-tricular myocardial oxygen consumption (ml/minper 100 g) is the product of left ventricular flow(liters/min per 100 g) and arterio-coronary sinusdifference of oxygen content (ml/liter). The per-centage of oxygen extraction is the difference inoxygen content of arterial and coronary sinus blooddivided by arterial oxygen content and multipliedby 100.
Systemic vascular resistance (mm Hg/liter permin per kg) was calculated by dividing mean aorticpressure (mm Hg) by cardiac output (liters/min per
by guest on June 2, 2018http://circres.ahajournals.org/
Dow
nloaded from

622 CIRCULATION RESEARCH VOL. 43, No. 4, OCTOBER 1978
kg) and pulmonary vascular resistance (mm Hg/liter per min per kg) by dividing the differencebetween mean pulmonary arterial and left arterialpressures (mm Hg) by cardiac output (liters/minper kg). Mean coronary vascular resistance (mmHg/liter per min per 100 g) was calculated by divid-ing the mean difference between aortic or coronaryarterial pressure and coronary sinus pressure by leftventricular flow (liters/min per 100 g). Minimalcoronary vascular resistance (mm Hg/liter per minper 100 g) was calculated from peak diastolic coro-nary flow during reactive hyperemia and corre-sponding aortic or coronary pressures.24 These flowswere computed from mean and phasic flows re-corded with the flowmeter on a branch of the cor-onary artery, and then the mean flow tracings werecalibrated from the simultaneous microsphere mea-surements; this calibration was then used for thephasic flow tracings. In this way there was no needto calibrate the flowmeter at the end of the experi-ment, thereby risking errors due to changes in cal-ibration throughout the experiment.24 Coronaryvascular reserve (reactive hyperemic response) wasestimated for each intervention by occluding abranch of the coronary artery for 15 seconds, mea-suring the peak diastolic flow, and comparing it tothe peak diastolic flow before occlusion.
Results
Systemic MeasurementsThe 18 polycythemic dogs had hematocrits of 66
± 1.3% (mean ± SE) compared to 42 ± 1.7 for the 14controls. There was no significant change in bloodvolume after the exchange transfusion in the sixdogs in which it was measured; the mean differencewas -1.47%, with a range of +12 to -20%. In dogswith normal arterial oxygen saturations, the cardiacoutput decreased significantly as hematocrit in-creased (Fig. 1). Since the heart rate did not changesignificantly with polycythemia (162 ± 8.2 in con-trols and 152 ± 6 . 1 beats/min in polycythemicdogs), the decreased cardiac output was due to afall in stroke volume. Cardiac output increased inthe polycythemic dogs during hypoxemia, particu-larly when arterial oxygen tensions were under 30torr, and in one dog during adenosine infusion.Mean arterial pressure fell significantly (P < 0.05)from 128 ± 6.4 mm Hg in controls to 105 ± 5.6 mmHg with polycythemia. Systemic vascular resistancedid not change up to a hematocrit of 68%, and itaveraged 1593 ± 89 mm Hg/liter per min per kg.For hematocrits of 68-74%, the resistance rose sig-nificantly (r = 0.61, P < 0.05) with a slope of 396mm Hg X liter/min per kg for each 1% increase inhematocrit. Systemic vascular resistances in thepolycythemic dogs did not change with mild hypox-emia (arterial oxygen tensions 47-67 torr) but fellfrom an average of 2359 to 1031 mm Hg/liter permin per kg (P < 0.05) with severe hypoxemia (ar-terial oxygen tensions, 17-34 torr) especially when
Cordioc Output(ml • min'^kg*1)
Systemic 02 Transport(ml • min~'-kgH!
30r
_ t» # . • »l
0 u50
Hematocrit
FIGURE 1 Left panel: Cardiac outputs recorded from32 measurements with normal arterial oxygen tensionsat different hematocrits. Right panel: Relationship be-tween systemic oxygen transport and hematocrit for thedata in the left panel.
the resistances were high before hypoxia was in-duced. Pulmonary arterial pressure was 15 ± 0.6mm Hg with normocythemia and was similar withpolycythemia. Pulmonary vascular resistance (Y)rose with hematocrit (X); the correlation coefficientwas slightly higher for the logarithm of Y (r = 0.64)than for a linear relationship (r = 0.57). The regres-sion equation was logio Y = 0.0089 (± 0.0025) X +1.7225, where the term in parentheses is the stan-dard deviation of the slope. This relationship wasnot altered by hypoxemia even though pulmonaryarterial pressures rose to 18 ± 1,4 mm Hg. A changein hematocrit from 42% to 66% caused an averagechange in pulmonary vascular resistance from 125to 204 mm Hg/liter per min per kg.
In dogs with normal arterial oxygen saturations,systemic oxygen transport was lower with polycy-themia than with normocythemia and, when plot-ted against hematocrit (Fig. 1), gave a roughlyinverted U-shaped curve with its peak in the he-matocrit range of 45-55%. When the polycythemicdogs were made hypoxemic, although cardiac out-put increased, the systemic oxygen transport waslower than in the polycythemic dogs with normalarterial oxygen saturations.
Myocardial MeasurementsThe ratios of myocardial blood flows per 100 g in
the left and right ventricular free walls were 1.78 innormocythemic dogs, 1.60 during polycythemia,and 1.39 for polycythemic dogs with hypoxemia.Myocardial blood flows per 100 g were similar inthe left ventricular free wall and the septum in allexperiments, and only data from the left ventricularfree wall will be discussed further.
The control dogs had a left ventricular flow of 90± 7.2 ml/min per 100 g and, in polycythemic dogswith normal arterial oxygen saturations, left ven-tricular flow decreased linearly as hematocrit in-creased (Fig. 2). A negative linear correlation wasalso found between left ventricular flow and arterial
by guest on June 2, 2018http://circres.ahajournals.org/
Dow
nloaded from

CORONARY BLOOD FLOW IN POLYCYTHEMIA/Surjadhana et al. 623
oxygen content (r = -0.79, P<0.01). Whenhypox-emia was added to polycythemia, left ventricularflow increased from 49 ± 4.2 to 111 ± 25 ml/minper 100 g, and this rise was proportionately greaterthan the rise in cardiac output (P < 0.01); further-more, with mild hypoxemia, there was an increasein left ventricular flow but no change in cardiacoutput. When data from hypoxemic dogs were in-cluded, left ventricular flow no longer correlatedwith hematocrit but showed a hyperbolic relation-ship to arterial oxygen content (Fig. 3); there was alinear correlation between the logarithm of leftventricular flow and arterial oxygen content, withr = —0.84. In polycythemic dogs, pacing and aorticstenosis increased left ventricular flow by 31% and84%, respectively, and also increased SPTI andmyocardial oxygen consumption (Table 1). When
LV Flow
(ml •min" ' - IOOg"1)
I4o|- D
•
100
60
20 L
B
°Do,
OxygenExtraction
8 0 r
60
40L, I _L30 50 70
Hemotocrit (%)
FIGURE 2 Relationship of hematocrit to left ventricularflow (upper panel) and to left ventricular oxygen extrac-tion (lower panel) in dogs with normal arterial oxygentension (same dogs as in Figure I). The regression linerelating hematocrit (X) and left ventricular flow (Y) is:Y = 164.6 - 1.77X, r = -0.78, P < 0.01.
LV Flow
(ml-min" l - l00g"1 )
400 -
300
200
100
O Normocythemio, normoxia• Polycythemio, normoxioA Polycythemio, hypoxioA Normocythemia, hypoxio• Anemia (from Brazier et alt
• A *
• / : \
8 16 24 32
Arteriol Oxygen Content (ml • d l " ' )
FIGURE 3 Relationship between left ventricular flowand arterial oxygen content of normocythemic and po-lycythemic dogs with and without hypoxemia. This re-lationship was best fitted by a power function: Y =1401.47X-0994, r = -0.84, P < 0.01. We included in thegraph the left ventricular flows of anemic dogs from thestudy of Brazier et al.23
there was an aorto-atrial fistula, left ventricularflow in the polycythemic dogs was initially main-tained but decreased when the fistula was so largethat perfusion pressure decreased markedly.
Left ventricular oxygen transport fell slightly(0.05 < P < 0.10) when hematocrit was increased indogs with normal arterial oxygen saturations; therewas no convincing inverted U-shaped curve relatinghematocrit and oxygen transport (Fig. 4). Therewas no significant relationship of left ventricularoxygen transport to hematocrit for hematocrits un-der 68%, but 7 of 11 dogs with hematocrits of 68-74%had lower values for left ventricular oxygen trans-port than had any of the other dogs. The hemato-crits of these low and high oxygen transport groupswere, respectively, 70.5 ± 1.03 and 70.8 ± 0.97%,and were not significantly different (P > 0.5). How-ever, the low oxygen transport group when com-pared to the high oxygen transport group had sig-nificantly lower values for myocardial oxygen con-sumption (6.7 ± 0.43 vs. 10.6 ± 0.64 ml/min per 100g, P < 0.01) and significantly lower values for SPTI(2814 ± 291 vs. 3887 ± 248 mm Hg X sec/min, P <0.01). At any SPTI, the left ventricular flow wasmuch lower with polycythemia than with normo-cythemia (Fig. 5, left panel), but left ventriculartransport for a given SPTI was similar in polycy-
by guest on June 2, 2018http://circres.ahajournals.org/
Dow
nloaded from

624 CIRCULATION RESEARCH VOL. 43, No. 4, OCTOBER 1978
TABLE 1 Effects of Isovolemic Polycythemia on Myocardial Oxygen Consumption, Regional Myocardial BloodFlow, and Other Variables
Normo-cythemia
Poly-cythemia
Hypoxemia
Pacing
Stenosis
Fistula
n
14(12)
18(17)
16(14)
7
8
8(6)
Ht
421.7
66*1.3
641.1
671.2
662.0
681.8
HR
1628
1526
1668
230*8
17615
14312
CaO2
19.70.8
29.5*0.7
17.6*2.1
29.00.9
30.01.0
31.50.6
PAo
1286
105f6
1067
937
136f14
60*4
CO
866
55*5
657
423
413
106*16
Rs
154676
2177f238
1821158
2276246
F,.v
907
49*4
111*25
64*8
90*20
395
R,.v
1474133
2273*159
1458*200
1504*132
1644f156
1666235
CSO2
6.50.7
9.8*0.6
4.7*0.8
7.80.5
10.21.1
7.61.1
%E
673
672
733
732
663
76f4
I/O
1.100.06
0.990.04
0.970.04
1.000.05
0.940.08
0.80*0.03
DPTI/SPTI
0.840.05
0.850.04
0.930.05
0.840.06
0.51*0.07
0.48*0.04
LVOT
17.21.35
13.9*1.01
12.51.14
18.0*2.30
27.2*6.19
12.41.81
DPTIx CaO2
SPTI
16.61.3
25.1*1.2
17.0*2.6
24.01.6
15.0*1.9
15.0*1.3
SPTI
4090233
3386196
3290236
3030220
5320*646
2354*107
MVO2
11.70.9
8.9f0.6
8.80.7
13.1*1.6
18.0*4.6
8.01.5
Values are means ± SE; n = number of measurements (parentheses indicate number for CSO2, %E, MVO2); Ht = heart rate (beats/minute); CaO2 =arterial oxygen content (ml/dl); PAo = mean aortic pressure (mm Hg); CO = cardiac output (ml/min per kg); Rs = systemic vascular resistance (mmHg/liter per min per kg); Fi.v = left ventricular myocardial flow (ml/min per 100 g); Ri.v = left ventricular coronary vascular resistance (mm Hg/liter permin per 100 g); CSO2 = coronary sinus oxygen content (ml/dl); %E = myocardial oxygen extraction (%); I/O = subendocardial: subepicardial bloodflow ratio per gram; DPTI;SPTI = myocardial supply-demand ratio; DPTI X CaO2/SPTI = myocardial oxygen supply-demand ratio (ml/dl); SPTI =systolic pressure time index (mm Hg X sec/min); MV02 = myocardial oxygen consumption (ml/min per 100 g); LVOT = left ventricular oxygen transport(ml/min per 100 g).
*, f, and % are probabilities P < 0.01, P < 0.05, 0.05 < P < 0.10, respectively. For the unstressed polycythemic dogs, the comparisons are with thenormocythemic dogs. For all the other values for the stressed polycythemic dogs, the comparisons are with the unstressed polycythemic dogs.
themic and normocythemic dogs (Fig. 5, rightpanel). Left ventricular oxygen transport was alsorelated to myocardial oxygen demand as estimatedby SPTI and to measured myocardial oxygen con-sumption for the polycythemic dogs with pacing,aortic stenosis, and fistula and was not related to
LV Oxygen Transport
(ml • min"1-100 of1)3Or *
20
10
the increased hematocrit. When there was hypox-emia, the polycythemic dogs increased their leftventricular flows. With mild hypoxemia, this in-crease in flow compensated for the fall in arterialoxygen content so that left ventricular oxygentransport was not decreased, but with severe hy-poxemia, compensation was incomplete and leftventricular oxygen transport was below normal.
The variables affecting left ventricular flow andoxygen transport were assessed further by multiplelinear regression analysis (forward method). Thelogarithm of left ventricular flow for all the studies(n = 76) was predominantly related to arterial
LV Flow(ml- mirT'-lOO q'1]
LV Oxygen Tronsport(ml • min"'• 100 g"')
• • • • » o° •
•
r•
i
O"O
6>
HCT <
o
15%HCT >60%
1
°LL30 50
Hematocrit (%)70
FIGURE 4 Relationship between left ventricular oxygentransport (Y) and hematocrit (X) for the experimentsfeatured in Figure 2. Y = 23.0 -0.14X, r = -0.46, P <0.01.
u 2OOO 4000 6000 ° 2OOOSPTI (mm Hg-sec • min"1)
FIGURE 5 Relationship between left ventricular (LV)flow and SPTI (left panel) and left ventricular (LV)oxygen transport and SPTI (right panel) for normocy-themic and polycythemic dogs with hematocrits <45%and >60% and with normal arterial oxygen tensions.Note that, for a given SPTI, flow was lower in thepolycythemic dogs compared to the normocythemic dogs,but left ventricular oxygen transport at a given SPTIwas similar in the two groups.
by guest on June 2, 2018http://circres.ahajournals.org/
Dow
nloaded from
CORONARY BLOOD FLOW IN POLYCYTHEMIA/Sur/W/ia/ia et al. 625
oxygen content with r = 0.74 (P < 0.01), but thecorrelation increased significantly (r = 0.90) whenSPTI was added: including hematocrit did not im-prove the multiple correlation. Left ventricularoxygen transport in these dogs was significantlyrelated only to SPTI (r = 0.75), and addition ofarterial oxygen content or hematocrit did not sig-nificantly improve the correlation. If data from dogswith severe hypoxemia were excluded, then thecorrelation between left ventricular oxygen trans-port and SPTI rose to 0.87.
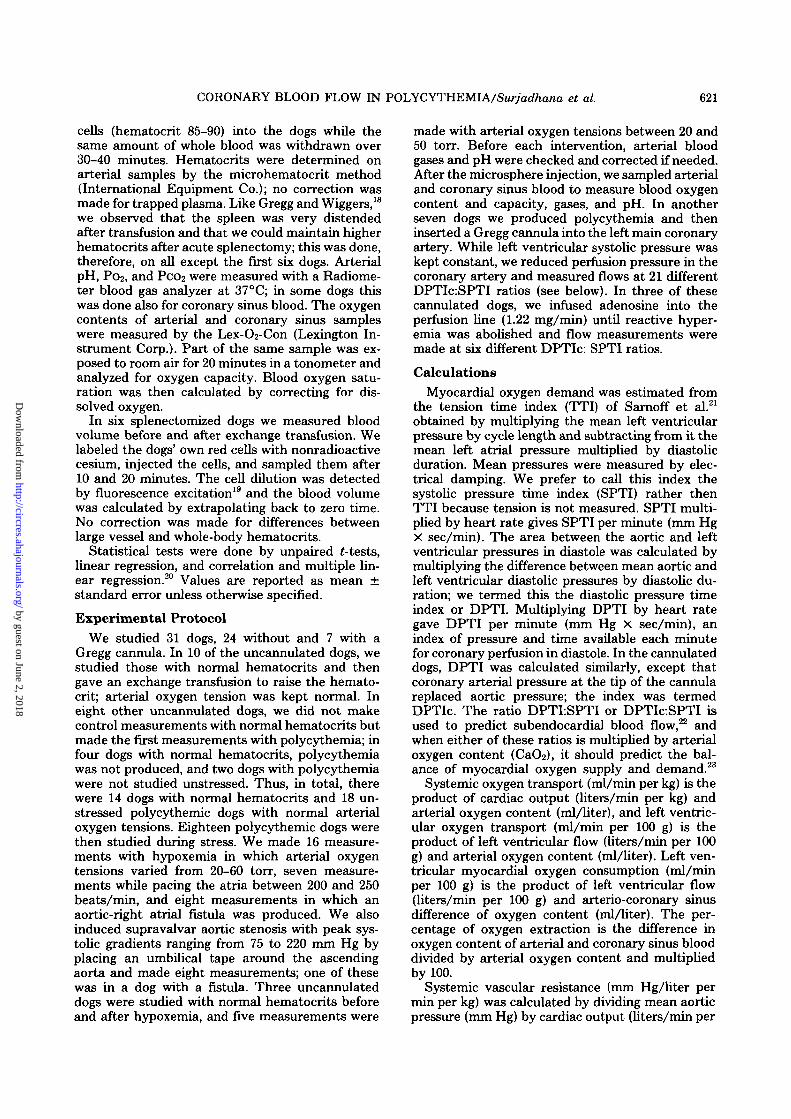
Mean coronary vascular resistance (Y) in mmHg/liter per min per kg increased as hematocrit (X)rose (Fig. 6). As in the pulmonary bed, a curvilinearrelationship gave a slightly higher correlation coef-ficient than did the linear relationship (r = 0.79 and0.76, respectively); in addition, it made the varianceof Y homogeneous over the range of X values. Theequation was log10 Y = 0.0096 (± 0.0013) X + 2.7227.A change in hematocrit from 42% to 66% caused anaverage increase in coronary vascular resistancefrom 1336 to 2271 mm Hg/liter per min per 100 g.To determine how much coronary vascular resist-ance (log Y) was related to hematocrit (Xi) in theabsence of changes in myocardial oxygen demandas assessed by SPTI (X2), we calculated the multi-ple linear regression relating these three variablesfor the normoxemic, unstressed dogs. The equationwas: log10 Y = 0.009626X, -0.0000000932X2 +2.7232, with r = 0.806 (P < 0.01). The coefficientfor SPTI was not significant and was of small mag-nitude. This lack of significant influence of SPTI oncoronary vascular resistance was confirmed by ex-amining the relationship of these two variables inthe 11 dogs with hematocrits of 68-74%; the corre-lation between them was not significant (r = 0.31,P > 0.20). In the polycythemic dogs, mean coronaryresistance was lowest with severe hypoxemia whenit was similar to the values found during adenosineinfusion (Table 1). After temporary occlusion of abranch of the left coronary artery, there was reac-tive hyperemia in all the polycythemic dogs withoutstress; however, no reactive hyperemia was notedin some of the polycythemic dogs with severe hy-poxemia or a large fistula. The minimal diastolicresistance at peak reactive hyperemia (Y) was sig-nificantly related to hematocrit (X) by logio Y =0.0076 (± 0.0020)X + 2.1168 (Fig. 6). The minimalresistances at hematocrits of 42% and 66% averaged,respectively, 273 and 415 mm Hg/liter per mm per100 g.
As the hematocrit rose there was a linear increasein arterial oxygen content in dogs with normaloxygen tensions, with r = 0.937. Oxygen saturationswere similar in normocythemic and polycythemicdogs. Arterial-coronary sinus difference of oxygencontent increased from a mean of 13.2 ml/dl incontrols to 19.7 ml/dl with polycythemia; however,the coefficient of oxygen extraction did not change(Fig. 2). Coronary sinus oxygen content was signifi-cantly increased by polycythemia (P < 0.01). Cor-onary sinus oxygen tension fell as low as 18 torr in
5000
3000
2000
1000ca
a>CC 500
200
100
30 40 70 8050 60
Hematocrit (%)FIGURE 6 The hematocrit is plotted against the loga-rithm (to base 10) of vascular resistances. O = meancoronary vascular resistance; A = minimal coronaryvascular resistance during maximal vasodilation withreactive hyperemia; • = mean pulmonary vascular re-sistance.
a few dogs at high hematocrits, but the change forall the dogs was not significant. The arteriovenousoxygen difference, coronary sinus oxygen content,and coefficient of oxygen extraction were not sig-nificantly altered in the polycythemic dogs withpacing or aortic stenosis (Table 1). With severehypoxemia and a large fistula, however, the coro-nary sinus oxygen content and tension fell and thecoefficient of oxygen extraction rose to 80-90%.
Left ventricular oxygen consumption was re-duced in polycythemia, and its fall correlated wellwith the fall in SPTI (r = 0.64, P < 0.01) and thedecrease in left ventricular flow (r = 0.75, P < 0.01).Left ventricular oxygen consumption also changedlinearly as demand (SPTI) was increased by pacingor stenosis or decreased by a fistula, (r = 0.84, P <0.01). However, no correlation was noted in dogswith polycythemia and hypoxemia among left ven-tricular flow, oxygen consumption, and SPTI. Whenall data were examined by multiple linear regressionanalysis, left ventricular oxygen consumption wassignificantly correlated with SPTI (r = 0.69) andthe correlation was not significantly increased byincluding hematocrit or arterial oxygen content.
Regional Left Ventricular MeasurementsPolycythemia reduced both DPTI and SPTI pro-
portionately in the unstressed and hypoxemic dogsso the DPTLSPTI did not change from controlvalues. As expected,22 the ratio fell markedly with
by guest on June 2, 2018http://circres.ahajournals.org/
Dow
nloaded from

626 CIRCULATION RESEARCH VOL. 43, No. 4, OCTOBER 1978
both aortic stenosis and the fistula (P < 0.01) butnot with pacing. Pacing reduced the proportion offlow in diastole only slightly from 82% to 67%, butit produced a marked increase of 167% in absolutesystolic flow when the mean heart rate was 230beats/min. Although left ventricular flow increased105% with supravalvar aortic stenosis, the propor-tion of flow in diastole fell by 38%, diastolic timedecreased by 15%, and ejection time was prolonged.With large fistulas, there was a marked fall in aorticdiastolic pressure and a 33% decrease in the pro-portion of diastolic flow. The myocardial oxygensupply-demand ratio (DPTI X CaO2:SPTI) rosewith polycythemia and was reduced slightly bypacing and markedly by stenosis, fistula, or hypox-emia (P<0.01).
With polycythemia, although left ventricularflows were reduced, the subendocardial-subepicar-dial flow ratio (inner-outer flow ratio) did notchange from control values and was unchangedwith the imposed stresses except the fistulas. Whenthe inner-outer flow ratios were plotted against theDPTLSPTI ratio (Fig. 7, left panel) most of thepoints fell within the normal range determined inour laboratory. However, when the inner-outer ra-tio was plotted against the myocardial oxygen sup-ply-demand ratio (Fig. 7, right panel), some poly-cythemic dogs with fistulas and stenosis had myo-cardial oxygen supply-demand ratios above the crit-ical value of 10, yet had inner-outer flow ratiosbelow the lower limit of normal for anesthetizeddogs;23 these are the five points below and to theright of the normal range. With hypoxemia, the
Inner /OuterLV Flow Rotio
l.6r- A o
polycythemic dogs had inner-outer ratios of about0.8 or more, even with low DPTI X CaO2:SPTIratios, whereas the normocythemic dogs at similarlow ratios of DPTI X CaO2:SPTI had inner-outerratios of about 1.2. This can be seen in Figure 7(right panel) in which most of the data points forhypoxemic dogs fell to the left of and above thenormal curve.
Cannulated Polycythemic DogsThe hematocrit values of the cannulated dogs
were 70 ± 1.0%, slightly higher than in the uncan-nulated dogs, but they had similar arterial oxygencontents because of the slightly lower arterial oxy-gen saturations in the cannulated dogs. In two dogswe varied coronary arterial pressure over a widerange while keeping the left ventricular pressureconstant, and demonstrated that, during a stablestate, left ventricular flow, as judged by the flow-meter readings on the circumflex coronary artery,remained constant over DPTIc:SPTI ratios rangingfrom 0.60 to 1.02. With lower ratios there was aprogressive fall in the flowmeter readings. In Figure8 we plotted the pressure ratios against inner-outerflow ratios for 21 measurements in polycythemicdogs. When these polycythemic dogs were com-pared to normocythemic dogs studied previously,25
the polycythemic dogs began to show a decrease ininner-outer flow ratios at a higher DPTIeSPTIratio (as well as a higher DPTI X CaO2:SPTI ratio)than did the normocythemic dogs. For dogs withnormal hematocrits, the point of departure fromeven distribution of flow across the wall was at a
1.2
0.8
0.4
Inner/OuterLV Flow Ratio
I.6L. A O
1.2
0.8
0.4
O Normocythemia, normoxio• Polycythemio, normoxio& Pvlycythemio, hypoxioA Normocythemio, hypoxioD Fistula• StenosisO Pacing
0.4 0.8
DPTI/SPTI
1.2 " 12 24 36
DPTI-CoO2/SPTI
FIGURE 7 Flow ratios per 100 g of left ventricular subendocardial muscle (inner) to subepicardial muscle (outer)measured by microspheres is plotted against DPTLSPTI (left panel) and DPTI X CaO2:SPTI ratios (right panel) forvarious interventions. The black lines represent the normal range found in our laboratory. The area between theparallel black lines separates the graph into three zones. The zone between the lines indicates the normal relationshipof the inner-outer flow ratio to the myocardial supply-demand ratios. The zone below and to the right of the lower lineindicates flow ratios that are too low for the corresponding supply-demand ratios. The zone above and to the left of theupper line indicates flow ratios that are higher than expected for the corresponding supply-demand ratios. The datapoints with the fistula, aortic stenosis, and pacing are in polycythemic dogs with normal oxygen tensions.
by guest on June 2, 2018http://circres.ahajournals.org/
Dow
nloaded from
CORONARY BLOOD FLOW IN POLYCYTHEMIA/Sur/ad/ia/ia et al. 627
Inner /Outer
LV Flow Ratio
1.6-
0.8
&UTOREGULATION
O Normocythemio
• Polycythemia
VASODILATATION
A Polycythemio
LV Flow
ml- n
800
(ml-min "' -lOOg"' )
0.4 1.60.8 1.2
DPTIC/SPTI
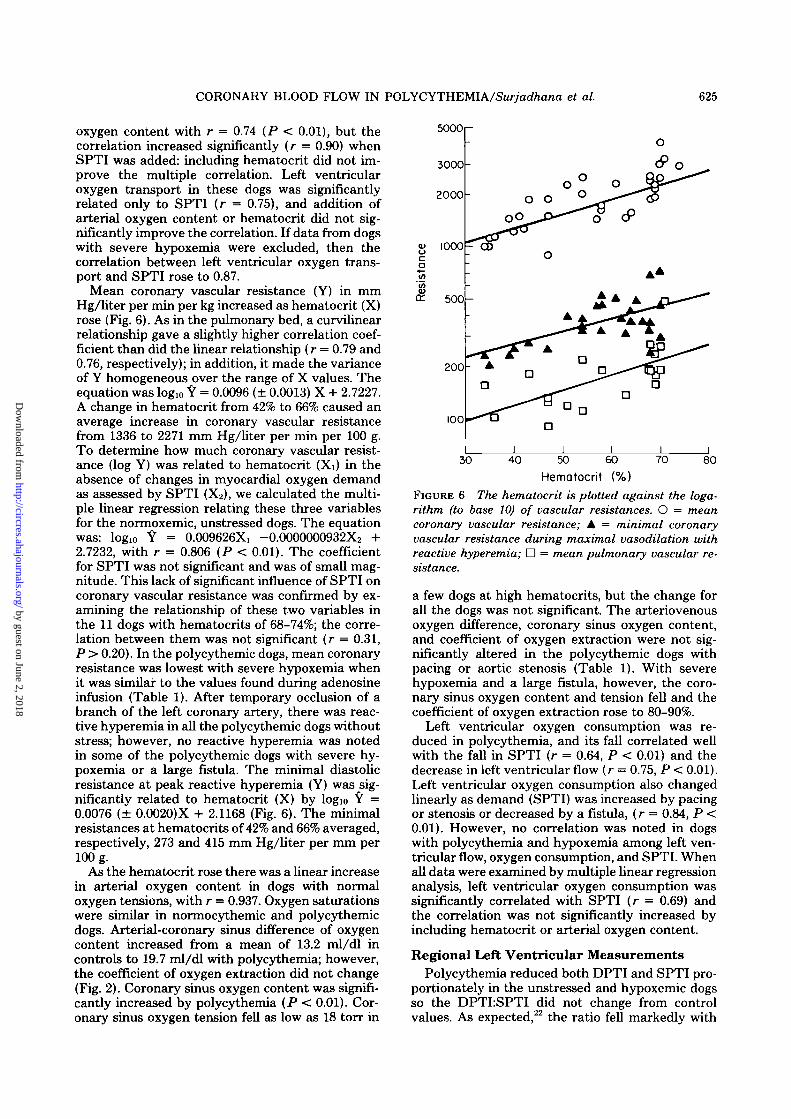
FIGURE 8 As in Figure 7, the flow ratios are plottedagainst DPTIc:SPTI for the cannulated polycythemicdogs. Note that the polycythemic dogs had subendocar-dial underperfusion at higher pressure ratios than inthe normocythemic dogs.2S Also shown are the inner-outer flow ratios when adenosine was given in the poly-cythemic dogs.
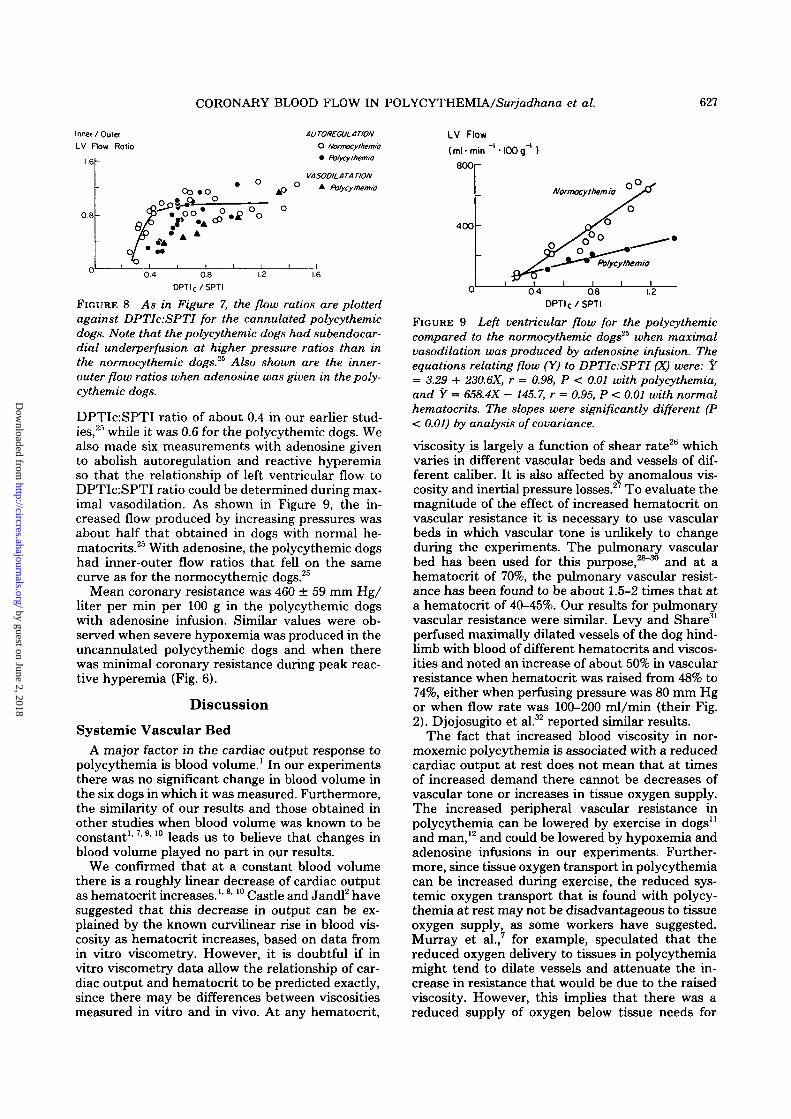
DPTIc:SPTI ratio of about 0.4 in our earlier stud-ies,25 while it was 0.6 for the polycythemic dogs. Wealso made six measurements with adenosine givento abolish autoregulation and reactive hyperemiaso that the relationship of left ventricular flow toDPTIc:SPTI ratio could be determined during max-imal vasodilation. As shown in Figure 9, the in-creased flow produced by increasing pressures wasabout half that obtained in dogs with normal he-matocrits.25 With adenosine, the polycythemic dogshad inner-outer flow ratios that fell on the samecurve as for the normocythemic dogs.25
Mean coronary resistance was 460 ± 59 mm Hg/liter per min per 100 g in the polycythemic dogswith adenosine infusion. Similar values were ob-served when severe hypoxemia was produced in theuncannulated polycythemic dogs and when therewas minimal coronary resistance during peak reac-tive hyperemia (Fig. 6).
Discussion
Systemic Vascular BedA major factor in the cardiac output response to
polycythemia is blood volume.1 In our experimentsthere was no significant change in blood volume inthe six dogs in which it was measured. Furthermore,the similarity of our results and those obtained inother studies when blood volume was known to beconstant1'7> 9| 10 leads us to believe that changes inblood volume played no part in our results.
We confirmed that at a constant blood volumethere is a roughly linear decrease of cardiac outputas hematocrit increases.1'8l 10 Castle and Jandl2 havesuggested that this decrease in output can be ex-plained by the known curvilinear rise in blood vis-cosity as hematocrit increases, based on data fromin vitro viscometry. However, it is doubtful if invitro viscometry data allow the relationship of car-diac output and hematocrit to be predicted exactly,since there may be differences between viscositiesmeasured in vitro and in vivo. At any hematocrit,
400
Normocythemio
0.4 0.8
DPTIC/SPTI
1.2
FIGURE 9 Left ventricular flow for the polycythemiccompared to the normocythemic dogs2* when maximalvasodilation was produced by adenosine infusion. Theequations relating flow (Y) to DPTIc.SPTI (X) were: Y= 3.29 + 230.6X, r = 0.98, P < 0.01 with polycythemia,and Y = 658.4X - 145.7, r = 0.95, P < 0.01 with normalhematocrits. The slopes were significantly different (P< 0.01) by analysis of covariance.
viscosity is largely a function of shear rate2b whichvaries in different vascular beds and vessels of dif-ferent caliber. It is also affected by anomalous vis-cosity and inertial pressure losses.27 To evaluate themagnitude of the effect of increased hematocrit onvascular resistance it is necessary to use vascularbeds in which vascular tone is unlikely to changeduring the experiments. The pulmonary vascularbed has been used for this purpose,28"30 and at ahematocrit of 70%, the pulmonary vascular resist-ance has been found to be about 1.5-2 times that ata hematocrit of 40-45%. Our results for pulmonaryvascular resistance were similar. Levy and Share31
perfused maximally dilated vessels of the dog hind-limb with blood of different hematocrits and viscos-ities and noted an increase of about 50% in vascularresistance when hematocrit was raised from 48% to74%, either when perfusing pressure was 80 mm Hgor when flow rate was 100-200 ml/min (their Fig.2). Djojosugito et al.32 reported similar results.
The fact that increased blood viscosity in nor-moxemic polycythemia is associated with a reducedcardiac output at rest does not mean that at timesof increased demand there cannot be decreases ofvascular tone or increases in tissue oxygen supply.The increased peripheral vascular resistance inpolycythemia can be lowered by exercise in dogs11
and man,12 and could be lowered by hypoxemia andadenosine infusions in our experiments. Further-more, since tissue oxygen transport in polycythemiacan be increased during exercise, the reduced sys-temic oxygen transport that is found with polycy-themia at rest may not be disadvantageous to tissueoxygen supply, as some workers have suggested.Murray et al.,7 for example, speculated that thereduced oxygen delivery to tissues in polycythemiamight tend to dilate vessels and attenuate the in-crease in resistance that would be due to the raisedviscosity. However, this implies that there was areduced supply of oxygen below tissue needs for
by guest on June 2, 2018http://circres.ahajournals.org/
Dow
nloaded from

628 CIRCULATION RESEARCH VOL. 43, No. 4, OCTOBER 1978
which there is little evidence. Replogle and Merrill10
did observe that with polycythemia there was adecreased systemic oxygen transport and that, attimes, excess lactate was produced; they thereforeconcluded that polycythemia reduced tissue perfu-sion enough to produce anaerobiosis. However, intheir study there was only mild polycythemia (he-matocrit 60%) and the arteriovenous difference ofoxygen content was 7.15 ml/dl, so that the mixedvenous oxygen saturation can be calculated asabout 72%. It is difficult to believe that generalizedanaerobiosis would occur with so much venousoxygen still available. Furthermore, with polycythe-mia, in their study, there was a fall in body oxygenconsumption, so that in fact the decrease in sys-temic oxygen transport matched the decrease inoxygen consumption.
If autoregulation is still possible, there is no rea-son why tissue hypoxia should occur in polycythe-mia and, in fact, not all the dogs studied by Replogleand Merrill10 produced excess lactate. Furthermore,Thorling and Erslev33 produced tissue pockets inrats and measured the oxygen tension in them atdifferent hematocrits; at high hematocrits the tissueoxygen tensions were normal. This response to poly-cythemia is probably part of a more fundamentalregulation of tissue oxygen transport that has beenshown in many ways. For example, in normocy-themic dogs, Shepherd et al.34 did a series of studiesto show that cardiac output was regulated partly bythe peripheral vascular beds. Although the degreeof autoregulatory control of blood flow was highlyvariable from dog to dog, oxygen dehvery to tissueswas constant. They stressed that oxygen extractioncould also be important in delivering enough oxygento tissues. A similar observation was made byWeisse et al.11 who showed that in polycythemia adecreased systemic oxygen transport was not nec-essarily disadvantageous to tissue oxygen uptake.
Finally, it is important to note that, although theinverted U-shaped curve relating systemic oxygentransport to hematocrit is also found when bloodvolume is increased, the actual oxygen transport ishigher at each hematocrit than when blood volumeis normal.1 There is thus even less reason to thinkthat when blood volume is increased the reducedoxygen transport at high hematocrits limits tissueoxygen use, a view supported by the lack of anaer-obic metabolism in patients with polycythemiavera.4'5
Coronary Vascular BedThe polycythemic dogs with normal arterial
oxygen saturations had lower total and left ventric-ular blood flows and higher coronary vascular re-sistances, as noted by others in dogs9'13-14 andman.15 In our studies, the rise in coronary vascularresistance as hematocrit increased was not relatedto changes in myocardial oxygen demand or con-sumption, so that it probably was due either to theincrease in viscosity or to the increased arterial
oxygen content that paralleled the rise in hemato-crit.
We can estimate the magnitude of the increaseof in vivo viscosity in these polycythemic dogs fromexamining the changes of resistance in vascularbeds that do not undergo autoregulatory changes oftone. When hematocrit increased from an averageof 42-66%, there was a 1.63-fold increase of pulmo-nary vascular resistance and a 1.52-fold increase ofcoronary vascular resistance when the coronaryvessels were maximally dilated by reactive hyper-emia or adenosine infusion. In the autoregulatedcoronary vessels, the comparable increase in resist-ance was 1.70-fold. By analysis of covariance, theslopes relating the logarithm of resistance to he-matocrit for pulmonary, coronary, and maximalcoronary resistances were not significantly different(P > 0.5). This similarity of logarithmic slopessupports the similarity of resistance ratios at he-matocrits of 42% and 66%. Since there would havebeen lower shear rates and thus higher in vivoviscosities with the lower coronary flows when au-toregulation was intact than with the higher flowsof maximal coronary vasodilation, it is possible thatthere might even have been some autoregulatoryvasodilation that helped to minimize the reductionof coronary blood flow induced by a raised viscosity.However, our data are too variable to demonstratethis with certainty, and an alternative explanationis that, even in polycythemic dogs, the lowest shearrates were high enough not to affect viscosity.9
In the normoxemic dogs, left ventricular oxygentransport was related to myocardial oxygen demandand not to hematocrit; myocardial oxygen extrac-tion and coronary sinus oxygen tension did notchange as hematocrit increased, in keeping withprevious reports.9 There was thus no evidence thatthe increased blood viscosity caused myocardialischemia at this time. Even though, in a few dogs,the coronary sinus oxygen tension was as low as 18torr, this is still well above the level at whichmyocardial ischemia occurs. Furthermore, withpolycythemia there was no rise of left atrial pressureso that there was no evidence of gross myocardialdysfunction. Finally, well-marked reactive hyper-emia and normal inner-outer ratios in the normox-emic unstressed dogs indicated good vasomotor re-serve in all layers of the left ventricle.
The fact that in these polycythemic dogs thechanges of coronary flow and resistance seemed tobe related to viscosity with little evidence for au-toregulatory changes is probably fortuitous. Thearterial oxygen content increased, 1.57-fold whenthe average hematocrit rose from 42% to 66%, andthis almost balanced the decrease in coronary flowdue to a similar increase in hematocrit and viscousresistance. Therefore, there was no need for majorautoregulatory changes of vascular geometry tomaintain left ventricular oxygen transport, al-though it is likely that variations in viscosity oroxygen need were compensated for by autoregula-
by guest on June 2, 2018http://circres.ahajournals.org/
Dow
nloaded from

CORONARY BLOOD FLOW IN POLYCYTHEMIA/Sur/W/iana et al. 629
tory changes of vessel caliber which acted as fine-tuning mechanisms. That autoregulation was stillpresent, however, was shown by well-marked reac-tive hyperemia and by experiments that stressedthe heart. When hypoxemia was added to polycy-themia, the left ventricular flow was increased andno longer correlated with hematocrit; a better cor-relation was found with arterial oxygen content,suggesting that at this time vasomotor tone couldovercome the effects of an increased viscosity. Fur-thermore, when all data from polycythemic dogswith and without stress were analyzed, left ventric-ular flow was significantly correlated with arterialoxygen content and SPTI but not with hematocrit;this implies that when the myocardium neededmore oxygen, it obtained it by increasing coronaryflow in the polycythemic as well as the normocy-themic dogs. Obligatory restriction of flow due toincreased viscosity was not observed. Moret et al.15
also noted that in people living at high altitude thedecreased coronary flow could be increased whenhypoxic gas mixtures were breathed.
We found no inverted U-shaped curve relatingleft ventricular oxygen transport to hematocrit overa range of hematocrits from 34% to 74%. Lowerhematocrits were investigated by Murray and Ra-paport35 who observed that left ventricular oxygentransport increased from 22 ml/min when the he-matocrit was 47.8% to 27.7 ml/min when it was19.3%. Similarly, von Restorff et al.36 found no de-crease in left ventricular oxygen transport whenhematocrit was reduced from 47.5% to 12.5%. Janand Chien,9 however, did find decreased left ven-tricular transport when hematocrit was below 20%.It is clear that as hematocrits fall to zero there mustat some point be a fall in left ventricular oxygentransport. However, the peak left ventricular oxy-gen transport does not occur at the normal hema-tocrit for the species as is found for systemic oxygentransport. If flows and oxygen transport dependedonly on viscosity, then an inverted U-shaped curveof oxygen transport vs. hematocrit with a peak atthe normal hematocrit would occur in all organs.That it does not occur in the heart indicates that,there, autoregulation is an important determinantof the resistance to flow at any hematocrit, and ifthis is true of the heart, it may well be true of otherorgans. The main reason for the different patternof response for the heart compared to the wholebody is likely to be that the heart is an activelyworking muscle with a very high rate of oxygenconsumption, even in anesthetized animals.
When coronary vessels were maximally dilatedduring peak reactive hyperemia or with an adeno-sine infusion, polycythemia did elevate minimalcoronary vascular resistance about 2-fold. Johans-son et al.37 found that the dogs with increasedviscosity produced by high molecular weight dex-tran exchange transfusion had a 40% decrease inmyocardial blood flow after release of a coronaryarterial occlusion. This was a direct effect of viscos-
ity and its magnitude is similar to that noted in thelung28"30 or the maximally dilated hindlimb.31'32
Regional Coronary Flow DistributionIn the dogs with the Gregg cannula, as the
DPTIc:SPTI ratio fell, both left ventricular flowand equality of flow across its wall remained con-stant until a critical pressure ratio was reached.Below that pressure ratio, left ventricular and sub-endocardial flow decreased so that the inner-outerratio fell below the normal range of 0.8-1.2, a fallthat occurs because autoregulation is lost first insubendocardial vessels.25 Both normal and polycy-themic dogs showed this pattern of response, withthe difference being that the subendocardial flowsand inner-outer ratio decreased at higherDPTIc:SPTI ratios in the polycythemic than thenormocythemic dogs. Therefore, despite the in-creased oxygen content per unit of blood in thepolycythemic dogs, they had maximal vasodilationand pressure dependency in subendocardial vesselsat higher-than-normal pressure ratios. This oc-curred because the increased oxygen-carrying ca-pacity at a hematocrit of 66% in our experimentswas only 1.50 times greater than normal and theviscosity due to polycythemia increased slightlymore than that. Furthermore, when perfusing pres-sure was reduced in the Gregg cannula, there mighthave been reduced shear rates and even higherviscosities. (This conclusion is supported by Levyand Share31 who noted that the relative viscosity ofblood perfusing maximally dilated vessels of thedog's hindlimb was greater at low than high perfus-ing pressures.) As a result, autoregulation was lostat higher pressure ratios than in dogs with normalhematocrits.
In the uncannulated dogs, the data points fromthe polycythemic dogs fell in the normal range inthe figure relating the DPTLSPTI ratio to theinner-outer flow ratio (Fig. 7, left panel). If thearterial oxygen content rose without a change inblood viscosity, then a normal left ventricular oxy-gen transport could occur at lower than normalcoronary pressures and flows; therefore, theDPTLSPTI ratio at which maximal subendocardialvasodilation occurred should be lower in polycy-themic than in normocythemic dogs, and the exper-imental data points should be to the left of thelower portion of the normal range. Their absencefrom this region of the graph implies that the in-creased viscosity due to polycythemia decreasedsubendocardial oxygen transport at higher pressureratios than in normocythemic dogs. That this rea-soning is correct is shown by Figure 7, right panel.When the pressure ratios were multiplied by arterialoxygen content to give an estimate of the balanceof myocardial oxygen supply and demand of the leftventricle, some of the data points from the polycy-themic dogs fell to the right of the normal rangerelating DPTI X CaOy.SPTI to inner-outer flowratio.23 These findings were also consistent with the
by guest on June 2, 2018http://circres.ahajournals.org/
Dow
nloaded from

630 CIRCULATION RESEARCH VOL. 43, No. 4, OCTOBER 1978
results in the cannulated polycythemic dogs (Fig.8).
The experiments with hypoxemia in the normo-cythemic and polycythemic dogs showed that theinner-outer flow ratio sometimes remained normaldespite very low DPTI X CaO2:SPTI ratios (Fig. 8).Those dogs had severe hypoxemia, and all myocar-dial vessels were maximally dilated, as shown bythe absence of reactive hyperemia after coronaryarterial occlusion. When this happens, the inner-outer flow ratio is related only to pressure ratiosand not to the oxygen supply-demand ratio of theleft ventricle.25 Since the polycythemic dogs withhypoxemia had lower perfusion pressures than didthe normocythemic dogs, their inner-outer flow ra-tio also was lower compared to the normocythemicdogs. We did not see low inner-outer flow ratioswith the hypoxemia experiments because of thehigh perfusion pressures that were present, perhapsdue to release of catecholamines.
Clinical Implications and Conclusions
Care is needed in extending our findings to clini-cal situations, since only the aspect of increased redcell mass (hematocrit) was studied in acutely in-duced normovolemic polycythemia. Moret et al.15
and Balke38 have shown that people with increasedhematocrits function well at high altitudes. Weshowed that, as long as perfusion pressure is normal,hematocrit values up to 74% did not alter bloodflow distribution across the myocardial wall. Thus,subendocardial hypoxemia is unlikely to occur atrest in normoxemic polycythemic patients with nor-mal coronary arteries.
The decreased cardiac output and systemic oxy-gen transport in polycythemia in these studies wereprobably due to increased viscosity but did not limitoxygen supply to tissues, and both could be in-creased when metabolic needs caused peripheralvasodilation. Furthermore, even in polycythemia,autoregulation is retained in the heart, as shown bythe constancy of myocardial oxygen transport andits relation only to myocardial oxygen demand re-gardless of hematocrit. This fits in with the ideathat there is a tissue autoregulatory mechanism foroxygen.34'39 The mechanism of this autoregulationstill is not clear; it could be either a direct effect ofoxygen on the vessels or an indirect effect via va-sodilatory metabolites like adenosine, as suggestedby Berne.40
However, when maximal coronary vasodilation isreached (and this occurs earlier in subendocardialvessels than in subepicardial vessels), the raisedviscosity of polycythemic blood could decrease flowenough to outweigh the effect of the high arterialoxygen content, and a reduced subendocardial ox-ygen supply would occur. This may happen in poly-cythemia with stenotic coronary arteries or withsevere stresses, especially when accompanied byarterial hypoxemia.
AcknowledgmentsWe thank Elizabeth Shapkin, Bruce Payne, and Roger Chei-
tlin for their technical assistance, Lesley Williams for expertelectronic assistance, Elizabeth Dornbusch and her staff forperforming the blood gas analyses, and Susan Axelrod for thepreparation of this manuscript. Dr. John Murray gave us helpfuladvice about the conduct of these experiments and Dr. LeonKaufman provided advice and assistance in the fluorescent ex-citation analysis.
References1. Murray JF, Gold P, Johnson BL Jr: The circulatory effects
of hematocrit variations in normovolemic and hypervolemicdogs. J Clin Invest 42: 1150-1159,1963
2. Castle WB, Jandl JH: Blood viscosity and blood volume:Opposing influences upon oxygen transport in polycythemia.Semin Hematol 3: 193-198, 1966
3. Rosenthal A, Button LN, Nathan DG, Miettinen OS, NadasAS: Blood volume changes in cyanotic congenital heartdisease. Am J Cardiol 27: 162-167, 1971
4. Cobb LA, Kramer RJ, Finch CA: Circulatory effects ofchronic hypervolemia in polycythemia vera. J Clin Invest39: 1722-1728, 1960
5. Weber PM, Pollycove M, Bacaner MB, Lawrence JH: Car-diac output in polycythemia vera. J Lab Clin Med 73:753-762, 1969
6. Rosenthal A, Nathan DG, Marty AT, Button LN, MiettinenOS, Nadas AS: Acute hemodynamic effects of red cell volumereduction in polycythemia of cyanotic congenital heart dis-ease. Circulation 42: 297-307, 1970
7. Murray JF, Gold P, Johnson BL Jr: Systemic oxygen trans-port in induced normovolemic anemia and polycythemia.Am J Physiol 203: 720-724, 1962
8. Richardson TQ, Guyton AC: Effects of polycythemia andanemia on cardiac output and other circulatory factors. AmJ Physiol 197: 1167-1170, 1959
9. Jan K-M, Chien S: Effect of hematocrit variations on coro-nary hemodynamics and oxygen utilization. Am J PhysiolH2: 106-113, 1977
10. Replogle RL, Merrill EW: Experimental polycythemia andhemodilution. J Thor Cardiovasc Surg 60: 582-588, 1970
11. Weisse AB, Calton FM, Kuida H, Hecht HH: Hemodynamiceffects of normovolemic polycythemia in dogs at rest andduring exercise. Am J Physiol 207: 1361-1366, 1964
12. Segel N, Bishop JM: Circulatory studies in polycythaemiavera at rest and during exercise. Clin Sci 32: 332-343, 1968
13. Case RB, Berglund E, Sarnoff SJ: Ventricular function. VII.Changes in coronary resistance and ventricular functionresulting from acutely induced anemia and the effect thereonof coronary stenosis. Am J Med 18: 397-405, 1955
14. Regan TJ, Frank MJ, Lehan PH, Galante JG, Hellems HK:Myocardial blood flow and oxygen uptake during acute redcell volume increments. Circ Res 13: 172-181, 1963
15. Moret P, Covarrubias E, Coudert J, Duchosal F: Cardiocir-culatory adaptation to chronic hypoxia. Comparative studyof coronary flow, myocardial oxygen consumption, and effi-ciency between sea level and high altitude residents. ActaCardiol 27: 283-305, 1972
16. Franciosi RA, Blanc WA: Myocardial infarcts in infants andchildren. I. A necropsy study in congenital heart disease. JPediatr 73: 309-319, 1968
17. Heymann MA, Payne BD, Hoffman JIE, Rudolph AM:Blood flow measurements with radionuclide labeled parti-cles. Prog Cardiovasc Dis 20: 55-79, 1977
18. Gregg DE, Wiggers CJ: The circulatory effects of acuteexperimental hypervolemia. Am J Physiol 104: 423-432,1933
19. Price DC, Swann SJ, Hung ST-C, Kaufman L, Huberty JP,Shohet SB: The measurement of circulating red cell volumeusing nonradioactive cesium and fluorescent excitation anal-ysis. J Lab Clin Med 87: 535-543, 1976
by guest on June 2, 2018http://circres.ahajournals.org/
Dow
nloaded from
CORONARY BLOOD FLOW IN POLYCYTHEMIA/SM/yad/jana et al. 631
20. Kim J-O, Kohout FJ: Multiple regression analysis. In Statis-tical Package for the Social Sciences, edited by NH Nie, CHHull, JG Jenkins, K Steinbrenner, DH Bent. New York,McGraw-Hill, 1975, pp 320-360
21. Sarnoff SJ, Braunwald E, Welch GH Jr, Case RB, StainsbyWN, Macruz R: Hemodynamic determinants of oxygen con-sumption of the heart with special reference to the tensiontime index. Am J Physiol 192: 148-156, 1958
22. Buckberg GD, Fixler DE, Archie JP, Hoffman JIE: Experi-mental subendocardial ischemia in dogs with normal coro-nary arteries. Circ Res 30: 67-81, 1972
23. Brazier J, Cooper N, Buckberg GD: The adequacy of sub-endocardial oxygen delivery: the interaction of determinantsof flow, arterial oxygen content, and myocardial oxygen need.Circulation 49: 968-977, 1974
24. Carlson EL, Selinger SL, Utley J, Hoffman JIE: Intramy-ocardial distribution of blood flow in hemorrhagic shock inanesthetized dogs. Am J Physiol 230: 41-49, 1976
25. Rouleau J, Boerboom LE, Surjadhana A, Hoffman JIE: Therole of autoregulation in myocardial blood flow distribution(abstr). Circulation 54 (suppl II): 106, 1976
26. Wells RE, Merrill EW: Influence of flow properties of bloodupon viscosity-hematocrit relationships. J Clin Invest 41:1591-1598, 1962
27. Benis AM, Usami S, Chien S: Effect of hematocrit andinertial losses on pressure-flow relations in the isolated hind-paw of the dog. Circ Res 27: 1047-1068, 1970
28. Benis AM, Tavares P, Mortara F, Lockhart A: Effect ofhematocrit on pressure-flow relations for perfused isolatedlobes of the canine lung. Pfluegers Arch 314: 347-360, 1970.
29. Agarwal JB, Paltoo R, Palmer WH: Relative viscosity ofblood at varying hematocrits in pulmonary circulation. JAppl Physiol 29: 866-871, 1970
30. Bucens D, Pain MCF: Influence of hematocrit, blood gastensions and pH on pressure-flow relations in the isolatedcanine lung. Circ Res 37: 588-596, 1975
31. Levy MN, Share L: The influence of erythrocyte concentra-tion upon the pressure-flow relationships in the dog's hind-limb. Circ Res 1: 247-255, 1953
32. Djojosugito AM, Folkow B, Oberg B, White SW: A compar-ison of blood viscosity measured in vitro and in a vascularbed. Acta Physiol Scand 78: 70-84, 1970
33. Thorling EB, Erslev AJ: The "tissue" tension of oxygen andits relation to hematocrit and erythropoiesis. Blood 31:332-343, 1968
34. Shepherd AP, Granger HJ, Smith EE, Guyton AC: Localcontrol of tissue oxygen delivery and its contribution to theregulation of cardiac output. Am J Physiol 225: 747-755,1973
35. Murray JF, Rapaport E: Coronary blood flow and myocar-dial metabolism in acute experimental anaemia. CardiovascRes 6: 360-367, 1972
36. von Restorff W, Hofling B, Holtz J, Bassenge E: Effect ofincreased blood fluidity through hemodilution on coronarycirculation" at rest and during exercise in dogs. PfluegersArch 357: 15-24, 1975
37. Johansson B, Linder E, Seeman T: Effects of hematocrit andblood viscosity on myocardial blood flow during temporarycoronary occlusions in dogs. Scand J Thorac CardiovascSurg 1: 165-174, 1967
38. Balke B: Cardiac performance in relation to altitude. Am JCardiol 14: 796-810, 1964
39. Bergofsky EH, Bertun P: Response of regional circulationsto hyperoxia. J Appl Physiol 21: 567-572, 1966
40. Berne RM: Regulation of coronary blood flow. Physiol Rev44: 1-29, 1964
by guest on June 2, 2018http://circres.ahajournals.org/
Dow
nloaded from

A Surjadhana, J Rouleau, L Boerboom and J I HoffmanMyocardial blood flow and its distribution in anesthetized polycythemic dogs.
Print ISSN: 0009-7330. Online ISSN: 1524-4571 Copyright © 1978 American Heart Association, Inc. All rights reserved.is published by the American Heart Association, 7272 Greenville Avenue, Dallas, TX 75231Circulation Research
doi: 10.1161/01.RES.43.4.6191978;43:619-631Circ Res.
http://circres.ahajournals.org/content/43/4/619.citationWorld Wide Web at:
The online version of this article, along with updated information and services, is located on the
http://circres.ahajournals.org//subscriptions/
is online at: Circulation Research Information about subscribing to Subscriptions:
http://www.lww.com/reprints Information about reprints can be found online at: Reprints:
document. Permissions and Rights Question and Answer about this process is available in the
located, click Request Permissions in the middle column of the Web page under Services. Further informationEditorial Office. Once the online version of the published article for which permission is being requested is
can be obtained via RightsLink, a service of the Copyright Clearance Center, not theCirculation Research Requests for permissions to reproduce figures, tables, or portions of articles originally published inPermissions:
by guest on June 2, 2018http://circres.ahajournals.org/
Dow
nloaded from