n° 126 - statistiques.public.lu
TRANSCRIPT

*The authors gratefully acknowledge support from Luxembourg’s National Research fund (grant number FNR-14844092). The authors are affiliated to STATEC and STATEC Research. Thanks are due to Steinn Steinsson for his support during the data collection, to Guillaume Osier, Marc Pauly, and Johann Neumayr. The authors are grateful to Johannes Abeler and Daniele Nosenzo for sharing the questionnaires of the project "Survey of acceptability of app-based contact tracing in the UK, US, France, Germany and Italy”. Authors are grateful to Peter Lugtig, Markus Dürmuth, Peter Ryan, Francesco Sarracino and other colleagues at STATEC for advice and useful comments. Views and opinions expressed in this article are those of the author(s) and do not reflect those of STATEC and STATEC Research.
N° 126 Novembre 2021
Authors:
Cesare A. F. Riillo, Chiara Peroni (STATEC and STATEC Research)*
Acceptability of COVID-19 Contact-tracing apps in Luxembourg: a Panel Analysis
Abstract
This paper presents overall results of the APPRECIATE project, which set to study the public’s support for COVID-19 contact-tracing apps in Luxembourg. We constructed the first nationally representative, probability-based online panel for the country, and conducted two survey waves during 2020. Results from the analysis of the longitudinal dataset show that support for contact-tracing apps is high and stable over time, but privacy and data security concerns remain. If a tracing app were available, respondents would favour an app that is European, installed on a voluntary basis, and respectful of privacy. Preferences on app design did not change considerably over time. Analysis of the determinants of the likelihood to adopt the app, using various regression techniques, consistently shows that trust is a key determinant of app adoption. A methodological contribution, the project shows that conducting online representative surveys is feasible in Luxembourg.
Résumé
Cet article présente les résultats globaux du projet APPRECIATE, qui vise à étudier le soutien du public aux applications de traçage de contacts COVID-19 au Luxembourg. Nous avons construit le premier panel probabiliste pour le Luxembourg et représentatif au niveau national et avons mené deux vagues d'enquête en 2020. Les résultats de l'analyse de l'ensemble des données longitudinales montrent que le soutien aux applications de traçage de contacts est élevé et stable dans le temps, mais que des préoccupations relatives à la confidentialité et à la sécurité des données subsistent. Si une application de traçage était disponible, les répondants privilégieraient une application européenne, installée sur une base volontaire et respectueuse de la vie privée. Les préférences concernant le design des applications n'ont pas beaucoup changé au fil du temps. L'analyse des déterminants de la probabilité d'adopter l'application, à l'aide de diverses techniques de régression, montre systématiquement que la confiance est un facteur déterminant de l'adoption de l'application. Contribution méthodologique, le projet montre que la réalisation d'enquêtes représentatives en ligne est possible au Luxembourg.
1
Acceptability of COVID-19 Contact-tracing apps in Luxembourg: a Panel Analysis1
Cesare A. F. Riillo, Chiara Peroni
Abstract This paper presents overall results of the APPRECIATE project, which set to study the public’s support for COVID-19 contact-tracing apps in Luxembourg. We constructed the first nationally representative probability-based online panel for the country, and conducted two survey waves during 2020. Results from the analysis of the longitudinal dataset show that support for contact-tracing apps is high and stable over time, but privacy and data security concerns remain. If a tracing app were available, respondents would favour an app that is European, installed on a voluntary basis, and respectful of privacy. Preferences on app design did not change considerably over time. Analysis of the determinants of the likelihood to adopt the app, using various regression techniques, consistently shows that trust is a key determinant of app adoption. A methodological contribution, the project shows that conducting online representative surveys is feasible in Luxembourg.
1 Introduction
Since the onset of the pandemic, non-pharmacological interventions (npis), including digital technologies, have played a crucial role in controlling the exponential spread of COVID-19 infections (Budd et al., 2020).
Countries worldwide have deployed contact-tracing applications for mobile phones to help control the diffusion of the coronavirus. Compared to manual tracing, digital applications provide a mechanism for rapid notification of exposure to COVID-19 which remains effective also when the rate of contagion grows rapidly. Another advantage of digital applications is that they allow authorities to mitigate physical distancing, which carries high economic and social costs on societies. Mobile phone apps have contributed to the successful containment strategies acted by countries such as Korea, Singapore and Taiwan (Huang, Y et al., 2020). In contrast, in Western Europe, where apps have been provided on a voluntary basis, the apps deployment has encountered delays and technical problems. The public response has been mixed, and adoption rates have varied widely, ranging from 45% in UK to a 5% in France. A
1 The author(s) are affiliated to STATEC and STATEC Research. The authors gratefully acknowledge support from Luxembourg's National Research fund (grant number FNR-14844092). Thanks are due to Steinn Steinsson for his support during the data collection, and to Guillaume Osier, Marc Pauly, and Johann Neumayr for their help. The authors are grateful to Johannes Abeler and Daniele Nosenzo for sharing the questionnaires of the project "Survey of acceptability of app-based contact tracing in the UK, US, France, Germany and Italy". Authors are grateful to Peter Lugtig, Markus Dürmuth, Peter Ryan, Francesco Sarracino and other colleagues at STATEC for advise and useful comments. Views and opinions expressed in this article are those of the author(s) and do not reflect those of STATEC and STATEC Research.

2
contributing factor, contact-tracing apps have been subject to intense public scrutiny, due to the sensitive nature of the collected data and privacy concerns.
Against this backdrop, an increasing number of studies show that apps are effective in preventing virus transmission. Early studies showed that, even at low levels of uptake, apps are effective in reducing infections, hospitalisations, and deaths (Abueg et al., 2021; Almagor and Picascia, 2020; Ferretti et al, 2020; Ferguson, 2020;). Kendall et al. (2020) found that the UK Test and trace programme, including the app, reduced the virus reproduction rate (R) on the Isle of Wight. Wymant et al. (2020) estimated that a 1% increase in usage could have decreased the number of infections by 0.8–2.3%. They concluded that apps might have averted more than 224000 infections in the United Kingdowm. More recently, studies indicated that notifications of exposure from apps were on average higher than those from manual contact-tracing. Based on a controlled experiment in Spain, Rodríguez et al. (2021) found that the Spanish tracing app is two times more effective than manual tracing alone in identifying close-contacts per infected individual. Based on findings from the literature, Colizza et al. (2021) provide five key criteria for an overall evaluation of the apps and for ensuring their effectiveness. Overall, the scientific evidence indicates that a mix of digital and manual contact-tracing is highly effective in controlling the spread of the virus. In particular, digital tools work best when accompanied by other public health measures. To be effective, however, apps require the backing of authorities and public’s acceptance and adherence.
Studies investigating predictors of acceptance of tracing apps for COVID-19 showed that intentions to install were widespread among the public. They also highlighted the relevance of privacy concerns as factors against the apps, and of trust as a correlate of acceptance. These studies have been conducted, at cross-country level (Altmann et al., 2020; Kostka and Habich-Sobiegalla, 2020; Utz et al., 2021), and on individual countries, such as Belgium (Walrave et al., 2020), France (Guillon & Kergall, 2020), Ireland (O’Callaghan et al., 2020), Netherlands (Jansen-Kosterink et al., 2020), Switzerland (Wyl et al. 2021) and US (Simko et al., 2020). These analyses have been largely conducted on cross-sectional data and non-random samples, implying that results cannot be easily generalised to the population.
This article, from the project APPRECIATE, addresses these limitations and contributes evidence to the literature on public’s adherence to health policies. In doing so, it attempts to shed light on the observed gap between actual installation and declared willingness to install.
The project APPRECIATE was established to contribute to the understanding of the public support for digital contact-tracing technologies. The project studies the willingness of the public to adopt a contact-tracing app for COVID-19 in Luxembourg, their attitudes and preferences regarding installation regimes and apps technical features, and how these are shaped by individual’s characteristics and levels of trust, using newly collected survey data.
An output of the project, this article analyses the longitudinal dataset compiled from the survey APPRECIATE, administered during the second half of 2020 in Luxembourg. The survey was conducted in two waves, during the summer and autumn of the year 2020, on a newly constructed panel of respondents. This panel constitutes the first representative online panel of Luxembourg’s residents. Respondents answered questions on preferred app design, motivations for and against installing the app, and provided information on their socio-

3
demographic characteristics. Due to opt-in and post-stratification weighting, the survey data are representative of Luxembourg’s residents population. .
In a related article, Riillo et al. (2020) reported results from the first survey, finding that the declared public support for a COVID-19 contact-tracing app was widespread in Luxembourg. 72% of respondents declared they would probably or definitely install the app. (38 % of respondents indicated that they would definitely install an app, and 34 % that they would likely install it). Respondents indicated that they favoure apps that operate across borders and in Europe, that can be installed on a voluntary basis, and that store data on the users’ mobile device. A strong motivating factor for installing the app was the sense of responsibility towards the community. Conversely, a strong factor against uptake was fear of greater surveillance and privacy concerns.
This study examines the data from both survey waves and provides the following contributions. Firstly, it tracks changes over time in the acceptance of the tracing app, in motivations, and in attitudes towards privacy and installation regimes. Secondly, it studies determinants of the likelihood to install the app using panel data methods.
We find that trust plays an important role in determining the willingness to install the app: people who trust the government more, are more likely to installing a contact-tracing app compared to others. What’s more, attitudes and preferences did not change significantly over the course of 2020.
It should be noted that Luxembourg authorities have not deployed a contact-tracing app, and that there are currently no plan to introduce one. Nonetheless, this study provides valuable insights on apps’ features and design, should an app be made available in the future. Moreover, the results are relevant to understand the contributing factors to the public adherence to health policies, which is of general relevance to the control of future pandemic.
The paper is organized as follows. Section 2 describes the methodology used in the study, and briefly describes features of the panel and the field work. Section 3 gives descriptive results on public support, motivations for and against, and attitudes towards app features and design, comparing answers from the two surveys. Section 4 presents results from the estimation of regression models on the longitudinal dataset. The last section concludes.
2 Methodology and data
We use a longitudinal dataset to study the likelihood to adopt contact-tracing apps for COVID-19 in Luxembourg. The dataset is compiled from the respondents’ answers to the survey APPRECIATE, administered in two waves to a representative online panel of Luxembourg’s residents during the second half of 2020.
2.1 The online panel
The online panel of respondents - essentially a list of e-mail addresses - consists of 1300 individuals older than 18 years. Panelists were recruited from participants to the Luxembourg Survey on Income and Living Conditions (SILC), conducted by STATEC in 2019 (see section 7.1

4
in the Appendix for more details). This feature permits to compute the probability of recruiting the respondents (also know as “opt-in probabilities”), and to control for coverage error. As a result representativeness improves, and as well the overall quality of the collected data.2 This is a distinct advantage compared to other online surveys which mostly neglect the opt-in probabilities. Table 1 documents that estimates based on opt-in probabilities improve the representativeness of the panel in terms of socio-demographic characteristics, before any additional statistical adjustments. Table 1 shows the distribution of socio-demographics characteristics of the online panel, both unweighted (column 1) and weighted (column 2), and of the Luxembourg’s adult population (column 3). For each characteristic, Table 1 reports also the Mean Absolute Error (MAE) and Root Mean Square Error (RMSE) between the panel and the population. With the exception of the area of residence, we observe that both MAE and RMSE are always smaller when we use opt-in weights. This suggests that, overall, the use of opt-in probabilities increases the “resemblance” of the online panel to the Luxembourg’s adult population.
Any residual differences in observed socio-demographics characteristics between data for the analysis and population was accounted for following the data collection. All completed questionnaires were reweighted (using opt-in weights as base weights) to ensure that totals for the final sample matched the totals for the population in terms of age, gender, and residence area.
2 Opt-in weights are computed as the inverse of the probability to opt-in the online panel. This is estimated via a logit model on data from the EU-SILC survey. Opt-in probabilities aim to mitigate potential coverage errors due to the fact that the frame of the survey (people in the online panel) is a not-random subset of the target population (Luxembourg’s adult resident population).

5
Table 1: Descriptive statistics of the online panel and comparison with population.
(1) (2) (3)
Unweighted Opt-in
weights Population
Age 18-30 20,3 20,6 19,9 31-40 25,2 16,5 19,2 41-50 20,9 18,2 18,6 51-60 17,9 22,6 18,3 61-70 11,7 14,5 13,2 71+ 4,0 7,6 10,9 Total 100 100 100
MAE 2,9 2,1
RMSE 3.9 2,5
Gender
Man 47,1 47,7 49,7 Woman 52,9 52,3 50,3 Total 100 100 100
MAE 2,6 2,0
RMSE 2,6 2,0
Education
Lower secondary education (ISCED 0-2) 14,8 24,7 26,5 Secondary non-tertiary education (ISCED 3-4) 35,6
44,2
34,1
Bachelor (ISCED 5-6) 18,3 13,9 17,6 Master or PhD (ISCED 7-8) 31,2 17,1 21,8 Total 100 100 100
MAE 5,8 5,1 RMSE 7,6 5,9 Area of residence
Centre 37,1 28,2 35,7 South 35,1 39,5 37,7 North 11,8 16,7 14,5 East 16,0 15,6 12,1 Total 100 100 100
MAE 2,7 2,9
RMSE 2,8 4,4
Source: Authors’ calculations on APPRECIATE online panel (columns 1-2), EU-SILC 2019 (gender age and area of residence in column 3) and Labour Force Survey 2019 (education in column 3 ). Note: MAE is Mean Absolute Error, RMSE is the Root Mean Square Error.

6
2.2 Questionnaire
The questionnaire included questions on the acceptability of the app; preferences on different installation regimes; socio-demographic characteristics; trust in government; and other respondents’ characteristics. The questions were made available in four languages (Luxembourgish, German, French and English). The questionnaire is based on the one designed by Altmann and colleagues (Altmann et al., 2020). We added several questions on apps’ design (centralised vs. decentralised), and on issues relevant to Luxembourg, such as preferences for national versus European apps. We introduced also two methodological changes compared to the original study by Altmann et al., (2020). Firstly, as mentioned, we ran the survey twice on the same set of respondents, with a slightly modified questionnaire, in order to obtain a longitudinal (panel) dataset3. Secondly, we retained answers from respondents who declared they did not own a smartphone, and who failed a set of preliminary questions. The reason is that these respondents are part of the target population (i.e. the adult population residing in Luxembourg), and their exclusion could affect the estimate for the app adoption rate. 4
2.3 Timing of the surveys
Figure 1 shows the survey timeline, superimposed to the number of new daily infections in Luxembourg. The country’s national lockdown lasted from the 18th of March to the 11th of May 2020, followed by gradual reopening and the deployment of a large-scale testing programme. One can see a noticeable increase in daily infections during the summer. We conducted the first survey between the 10th of July and the 10th of August, on a sample of 1300 residents. The answer rate was about 60%, yielding a total of 730 completed questionnaires.5 The second survey - administered to those who had given their consent to be contacted again - went on the field between the 20th of October and 7th of November 2020. The second survey’s answer rate was about 70%, yielding a total of 522 complete questionnaires. The second survey took place during the second pandemic wave. One can see the dramatic increase of new daily cases in October-November 2020.
3 The complete questionnaire of the first survey is available in Riillo et al. (2020). The questionnaire used for the second wave did not include the comprehension checks but included 4 additional questions: education attained, work status, explicit preferences about geographical scope and app design (centralised vs. decentralised).
4 Altmann et al., (2020) report that nearly 40 % of respondents did not pass the comprehension checks and 1% does not own a mobile phone. In the first APPRECIATE survey, nearly 12 % of respondents failed at least one comprehension check and 3.7% declared having no mobile phone.
5 Few days before conducting the survey, media have paid much attention to COVID -19 tracing apps. This is because some European countries have introduced the first tracing apps. For example, the German Corona-Warn tracing app have been introduced on the 15th June 2020 and it has been also available for download in Luxembourg since 25th June 2020 (see https://www.wort.lu/fr/luxembourg/l-appli-de-tracage-allemande-disponible-au-luxembourg-5ef4a29cda2cc1784e36056d)

7
Figure 1: COVID-19 Cases and field work of the surveys.
3 Descriptive results
This section presents descriptive results, focusing on the comparison of the answers from the two survey waves. Thus, it borrows heavily from the corresponsing sections of the article by Riillo et al. (2020).
3.1 How many residents would be willing to install a tracing APP?
The survey results indicate that the public’s support for a tracing app is high and stable over time in Luxembourg.
Figure 2 shows the respondents’ declared willingness to install the app, and compares it with answers to the previous survey. The proportion of respondents that would definitely install the app decreased from 38% to 33%, while the proportion of respondents who would probably install the app increased from 34% to 41%. This indicates a shift between categories, but also points to an overall high, slightly increased, willingness to install (74%).
This result should be interpreted cautiously, in light of the observed discrepancy between declared willingness to install and observed installation behaviour highlighted in Riillo et al. (2020). Prior to the introduction of the apps, surveys on the acceptability of digital contact-tracing indicated similar levels of acceptability in several European countries (Altmann et al., 2020), in line with those reported for Luxembourg. However, when the apps were effectively introduced, despite the declared support for the technology, the apps’ adoption rates varied widely across Europe and remained lower than indicated by the surveys.6 As an example, the
6 There are no official data on the adoption rate of tracing apps in European countries. Adoption rates reported in this article are authors’ estimates based on information retrieved from the apps’ official websites (or the media), on the 22/10/2020. We define the adoption rate as the number of downloads over the adult population (more

8
proportion of respondents that would definitely install the app is nearly 45% in the UK and France in March 2020. In contrast, in October 2020, the estimated adoption rate was 34% in the UK, and 5 % in France. Germany and Italy had, respectively, an adoption rate of 27% and 18%.
In our previous article we posit that factors such as users’ concerns, app features and design, individual characteristics and broader context (the evolution of the pandemic) might have influenced the observed installation behaviour. Indeed, investigating the concerns and motivations for installing and using the app provide insights which help to understand the observed discrepancy between stated-willingness to install and installation behaviours. It can also provide guidance on factors that incentivise the installation and use of the app.
Thus, the remaining of this paper presents the comparative descriptive analysis of respondents’ motivations and preferences, and an econometric analysis of factors explaining individuals’ likelihood to install. In what follows, the first and second survey waves will be referred to as, respectively, survey 1, and survey 2. Figure 2: Would you install the app? Survey 1 and survey 2.
Source: Authors’ calculations on data from the APPRECIATE surveys. Survey 1 is conducted in July-August 2020, survey 2 in October –November 2020. Note: The category “Definitely install” includes also
than 18 years old). The most recent population data by age group are retrieved from Eurostat and ONS. In the case of UK, app data refer to England and Wales, where the NHS COVID-19 app is made available on the 24/09/2020 (see NHS Covid-19 app: How England and Wales' contact-tracing service works - BBC News). It is important to note that downloding the app is not guarantee of effective use of the app. Recent surveys in UK suggest that 20% of user have deleted the app (Savanta ComRes, 2021).
9
respondents that have already installed a tracing app (respectively 1.3% in survey 1, 3% in survey 2); the category “Definitely not” includes respondents that do not own a smartphone (respectively 4.3% in survey 1 and 2.8% in survey 2).
3.2 What are the reasons for and against installing the app?
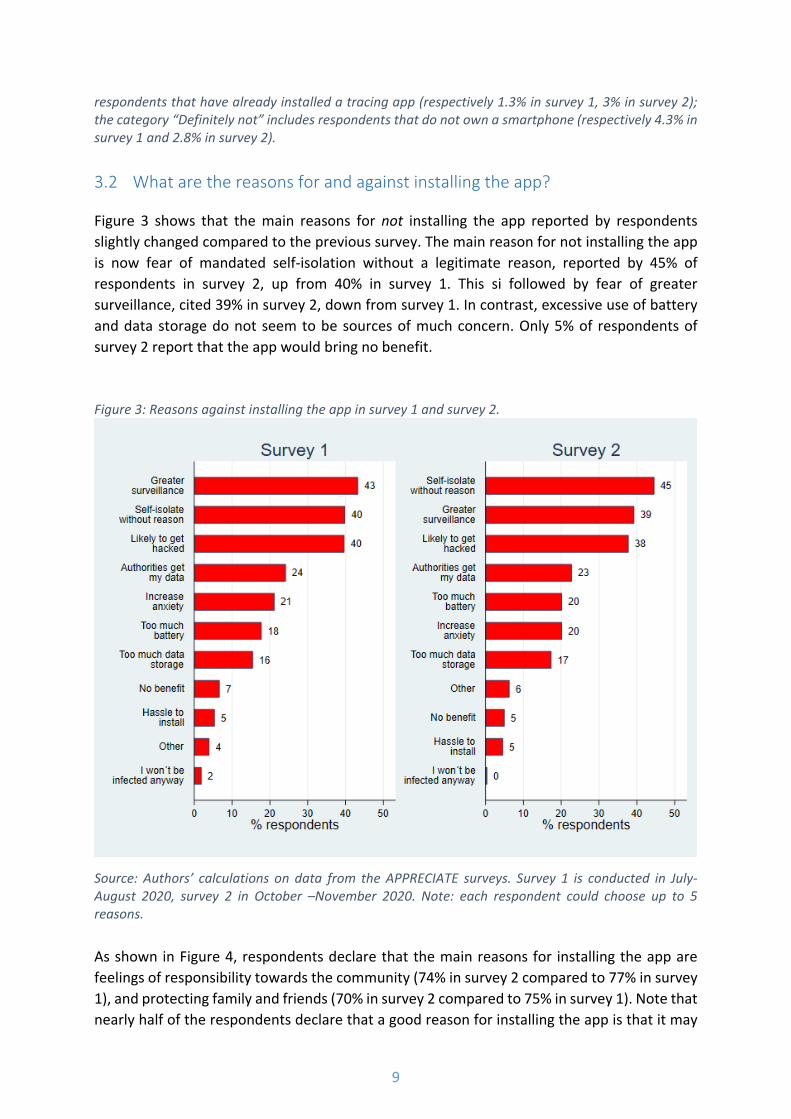
Figure 3 shows that the main reasons for not installing the app reported by respondents slightly changed compared to the previous survey. The main reason for not installing the app is now fear of mandated self-isolation without a legitimate reason, reported by 45% of respondents in survey 2, up from 40% in survey 1. This si followed by fear of greater surveillance, cited 39% in survey 2, down from survey 1. In contrast, excessive use of battery and data storage do not seem to be sources of much concern. Only 5% of respondents of survey 2 report that the app would bring no benefit.
Figure 3: Reasons against installing the app in survey 1 and survey 2.
Source: Authors’ calculations on data from the APPRECIATE surveys. Survey 1 is conducted in July-August 2020, survey 2 in October –November 2020. Note: each respondent could choose up to 5 reasons.
As shown in Figure 4, respondents declare that the main reasons for installing the app are feelings of responsibility towards the community (74% in survey 2 compared to 77% in survey 1), and protecting family and friends (70% in survey 2 compared to 75% in survey 1). Note that nearly half of the respondents declare that a good reason for installing the app is that it may

10
stop the epidemic, up from survey 1, and more than half perceived it as effective in communicating the risk of infection.
Overall, this evidence is in line with closely related studies reporting privacy concerns as crucial reasons for not installing the apps (Altmann et al., 2020; O’Callaghan, 2021; Braithwaite et al., 2020).
Figure 4: Reasons for installing the app in survey 1 and survey 2.
Source: Authors’ calculations on data from the APPRECIATE surveys. Survey 1 is conducted in July-August 2020, survey 2 in October –November 2020. Note: each respondent could choose up to 5 reasons.
11
3.3 Willingnes to install, installation regimes, and app design
Technical solutions, installation regimes and apps’ geographical scope might also play a role in the willingness to install an app, especially if they are linked to concerns expressed by potential users. Respondents’ answers regarding these aspects can also provide an indication of what explains the observed discrepancy between willingness to install and installation behaviour.
Respondents prefer a decentralised system to a centralised one.
One of the main feature of the apps’ architecture lies in the system they use to match the identifiers of users and their infected contacts7. The two designs, referred to as the centralised and decentralised designs, have different privacy implications, with the decentralised one having milder implications.8 To date, nearly all European health authorities have opted for a decentralised app, with the exception of France and Slovakia.9 On the 18 June 2020, the UK moved from a centralised to a decentralised infrastructure to increase adoption rate and because of privacy concerns.10
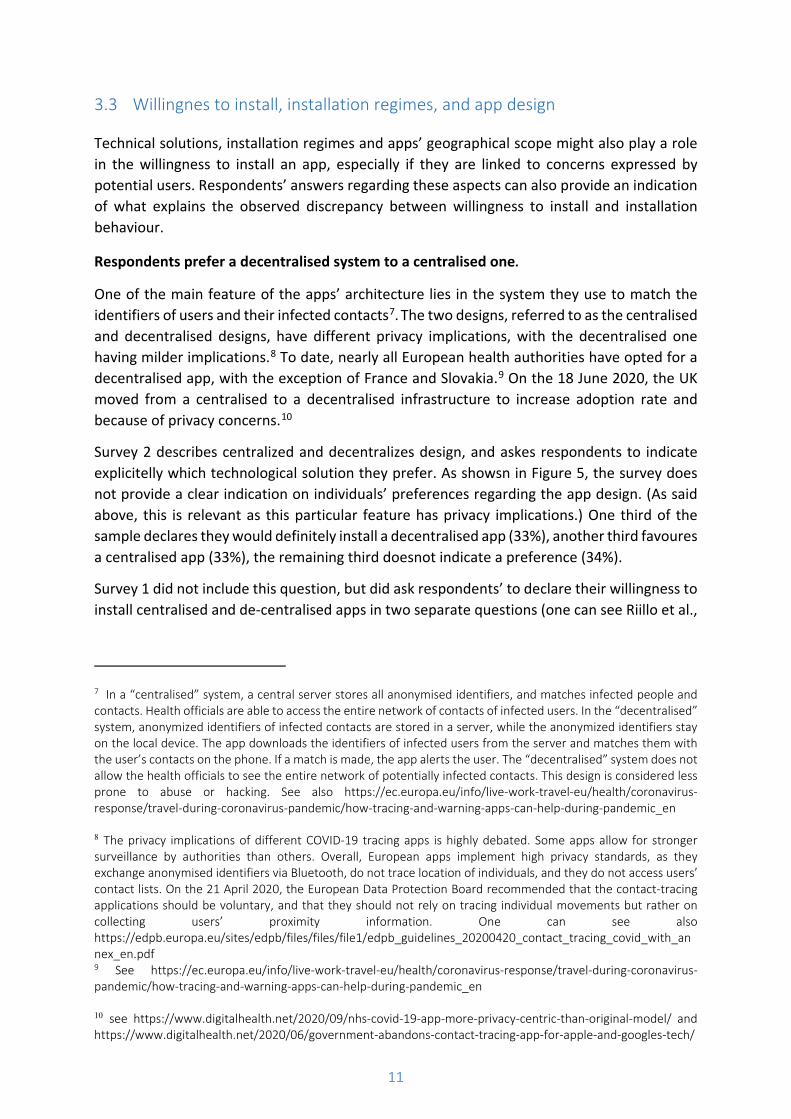
Survey 2 describes centralized and decentralizes design, and askes respondents to indicate explicitelly which technological solution they prefer. As showsn in Figure 5, the survey does not provide a clear indication on individuals’ preferences regarding the app design. (As said above, this is relevant as this particular feature has privacy implications.) One third of the sample declares they would definitely install a decentralised app (33%), another third favoures a centralised app (33%), the remaining third doesnot indicate a preference (34%).
Survey 1 did not include this question, but did ask respondents’ to declare their willingness to install centralised and de-centralised apps in two separate questions (one can see Riillo et al.,
7 In a “centralised” system, a central server stores all anonymised identifiers, and matches infected people and contacts. Health officials are able to access the entire network of contacts of infected users. In the “decentralised” system, anonymized identifiers of infected contacts are stored in a server, while the anonymized identifiers stay on the local device. The app downloads the identifiers of infected users from the server and matches them with the user’s contacts on the phone. If a match is made, the app alerts the user. The “decentralised” system does not allow the health officials to see the entire network of potentially infected contacts. This design is considered less prone to abuse or hacking. See also https://ec.europa.eu/info/live-work-travel-eu/health/coronavirus-response/travel-during-coronavirus-pandemic/how-tracing-and-warning-apps-can-help-during-pandemic_en
8 The privacy implications of different COVID-19 tracing apps is highly debated. Some apps allow for stronger surveillance by authorities than others. Overall, European apps implement high privacy standards, as they exchange anonymised identifiers via Bluetooth, do not trace location of individuals, and they do not access users’ contact lists. On the 21 April 2020, the European Data Protection Board recommended that the contact-tracing applications should be voluntary, and that they should not rely on tracing individual movements but rather on collecting users’ proximity information. One can see also https://edpb.europa.eu/sites/edpb/files/files/file1/edpb_guidelines_20200420_contact_tracing_covid_with_annex_en.pdf 9 See https://ec.europa.eu/info/live-work-travel-eu/health/coronavirus-response/travel-during-coronavirus-pandemic/how-tracing-and-warning-apps-can-help-during-pandemic_en
10 see https://www.digitalhealth.net/2020/09/nhs-covid-19-app-more-privacy-centric-than-original-model/ and https://www.digitalhealth.net/2020/06/government-abandons-contact-tracing-app-for-apple-and-googles-tech/
12
2020, page 11). As a result, answers are not directly comparable. Survey 1 respondents indicated a higher willingness to install a de-centralised app compared to a centralised one.
Figure 5: Centralised vs de-centralised app in survey 2.
Source: Authors’ calculations on data from the APPRECIATE surveys. Survey 2 is conducted in October –November 2020.
Respondents prefer European apps to global and national apps.
Apps that operate across countries, also known as interoperable apps, might do a better job at reducing virus diffusion. This is especially true in countries characterised by higher population mobility and cross-border movements, as Luxembourg is. Currently, the European Commission offers a service that allows interoperability of decentralised apps across many countries.11 Interoperability is an inherent characteristic of the decentralised apps adopted in Europe. Interoperable apps might be controversial, as some personal data must be shared across countries. Survey 2 asked respondents to indicate explicitly which geographical coverage area they preferred.
11The following countries have interoperable apps: Austria, Belgium, Croatia, Republic of Cyprus, Czech Republic, Denmark, Estonia, Finland, Germany, Ireland, Italy, Latvia, Lithuania, Malta, Netherlands, Poland, Slovenia, and Spain https://ec.europa.eu/info/live-work-travel-eu/health/coronavirus-response/travel-during-coronavirus-pandemic/how-tracing-and-warning-apps-can-help-during-pandemic_en

13
Survey 1 did not include this question, but did ask respondents’ to declare their willingness to install European and global apps (one can see Riillo et al., 2020, page 12). Thus, answers are not directly comparable. In survey 1, the willingness to install was significantly higher for a European app compared to a global one.
In Luxembourg, 44% of respondents declared they would favour a European app, 23% a national one, and 18% a global app, as shown in Figure 6.
Figure 6: European vs Global apps in survey 2.
Source: Authors’ calculations on data from the APPRECIATE surveys. Survey 2 is conducted in October –November 2020.
Respondents prefer a voluntary installation regime.
Apps’ installation regimes can be either voluntary or automatic. In the automatic installation regime, the app is pre-installed on the mobile phone by mobile providers, and users have an option to uninstall it. In the voluntary regime, users can choose whether or not to install the app. The drawback of the latter approach is that it can lead to a substantially lower uptake than automatic installation.
Figure 7 shows that 70 % of respondents declare they prefer a voluntary regime, while 30 % prefer an automatic installation. (In Survey 1, 64% of respondents declared their preference for a voluntary installation regime, indicating a further shift towards voluntary installation.)

14
Figure 7: Voluntary vs Automatic app installation in survey 1 and survey 2.
Source: Authors’ calculations on data from the APPRECIATE surveys. Survey 1 is conducted in July-August 2020, survey 2 in October –November 2020.
Respondents would like data to be used for research.
At the end of the epidemic, a decision would need to be made about what to do with the data collected. Figure 8 shows that 66 % of respondents of survey 2 (65% in survey 1) indicate that data should be anonymized and made available for researchers to prepare for future epidemics. This result is consistent with the work by Altmann and colleagues (2020, pag. 37), who found that 60% of the respondents agreed that the data should be made available to researchers. The authors explain this finding with the sense of responsibility towards the community that motivates the installation of the app (see also Figure 4). It is important to note that the 32 % of respondents would prefer to delete all data, probably due to privacy concerns. These figures show a very slight increase in favour of research over time.

15
Figure 8: Use of data at the end of the pandemic in survey 1 and survey 2.
Source: Authors’ calculations on data from the APPRECIATE surveys. Survey 1 is conducted in July-August 2020, survey 2 in October –November 2020.
4 Determinants of the likelihood to install the app
This sections presents the econometric analysis of the probability to adopt a tracing app. As said above, this is relevant because understanding the factors that affect installation can provide useful information for the development of the apps, and of measures directed at increasing the uptake, such as communication campaigns. What’s more, this analysis provides insights on factors determining the public’s adherence to health policies.
The analysis that follows presents estimates of the probability that respondents declare they will definitely install the app. The aim is to gauge the impact of the individuals’ features and other factors on the likelihood to install. To this purpose, we consider the answer definitely install as a proxy for factual installation behaviour. We focus on definitely install rather than probably install because it is plausible that only the most enthusiastic individuals will actually install the app.12
We analyse first a pooled sample which combines data from both surveys. We specify and estimate linear probability (LPM) and ordered logit (ologit) models for the probability of
12 For robustness, we repeat the analysis merging the two categories: definitely install and probably install. The results are largely consistent with the patterns presented Figure 9. See section 4.1 for other robustness checks.
16
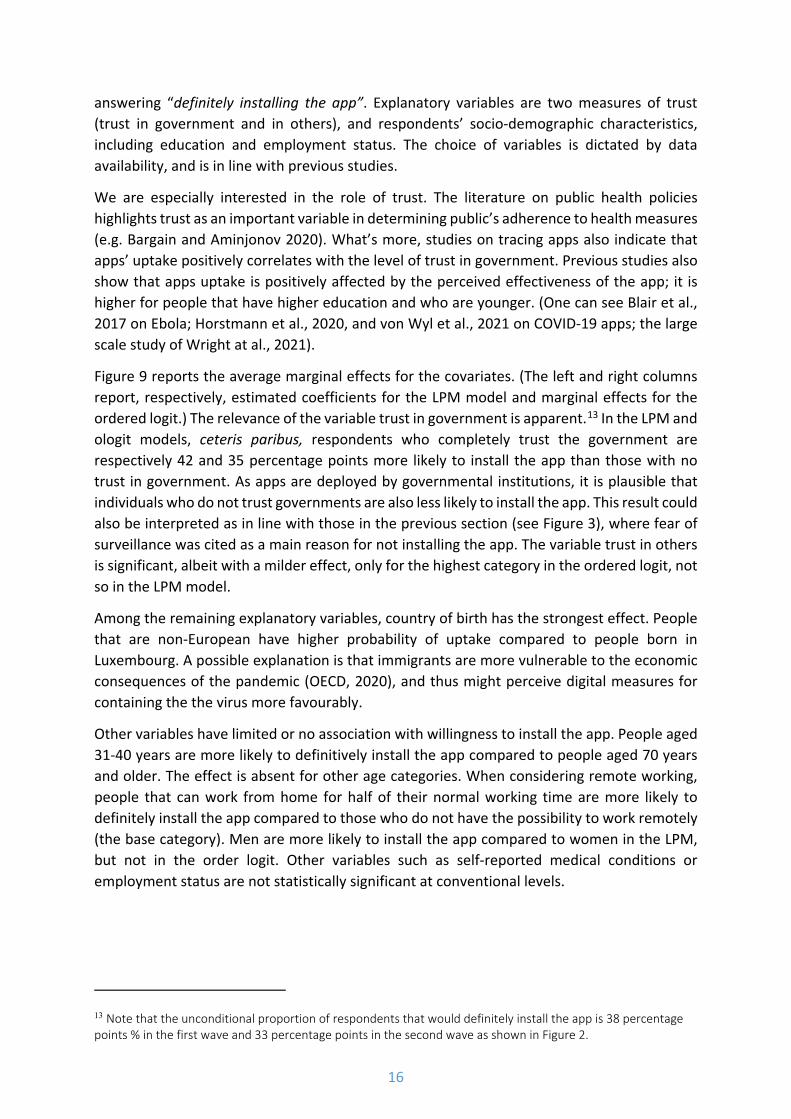
answering “definitely installing the app”. Explanatory variables are two measures of trust (trust in government and in others), and respondents’ socio-demographic characteristics, including education and employment status. The choice of variables is dictated by data availability, and is in line with previous studies.
We are especially interested in the role of trust. The literature on public health policies highlights trust as an important variable in determining public’s adherence to health measures (e.g. Bargain and Aminjonov 2020). What’s more, studies on tracing apps also indicate that apps’ uptake positively correlates with the level of trust in government. Previous studies also show that apps uptake is positively affected by the perceived effectiveness of the app; it is higher for people that have higher education and who are younger. (One can see Blair et al., 2017 on Ebola; Horstmann et al., 2020, and von Wyl et al., 2021 on COVID-19 apps; the large scale study of Wright at al., 2021).
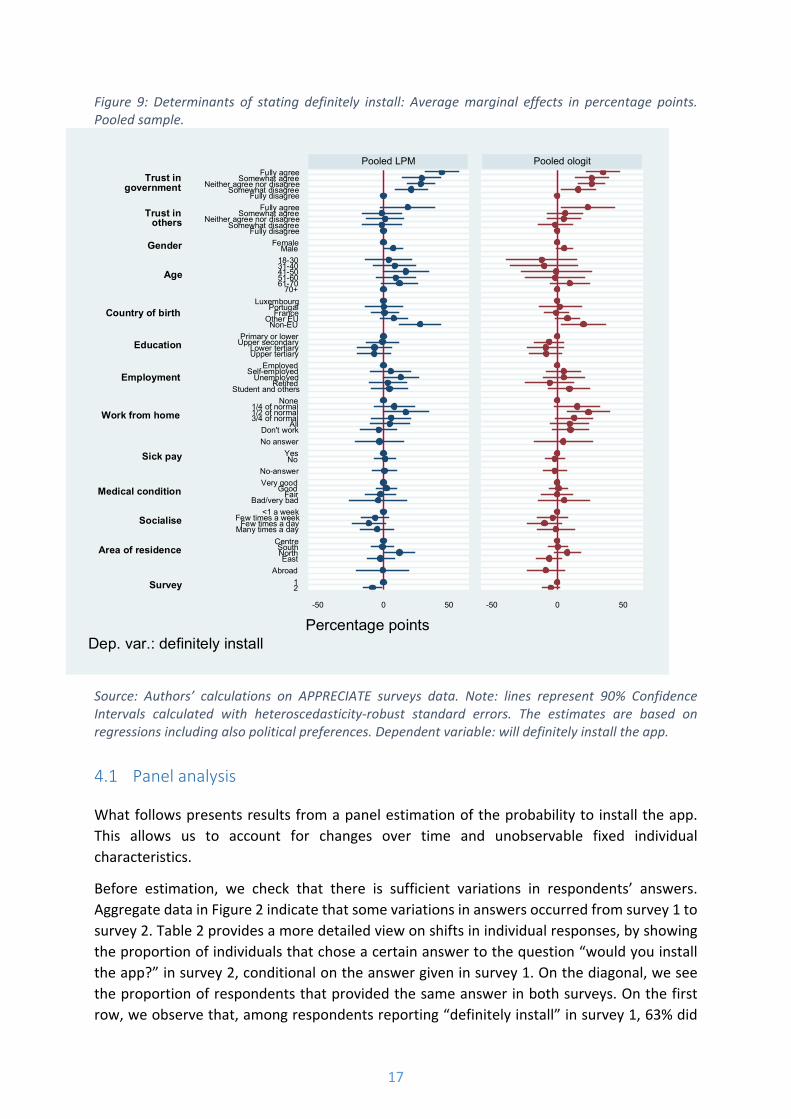
Figure 9 reports the average marginal effects for the covariates. (The left and right columns report, respectively, estimated coefficients for the LPM model and marginal effects for the ordered logit.) The relevance of the variable trust in government is apparent.13 In the LPM and ologit models, ceteris paribus, respondents who completely trust the government are respectively 42 and 35 percentage points more likely to install the app than those with no trust in government. As apps are deployed by governmental institutions, it is plausible that individuals who do not trust governments are also less likely to install the app. This result could also be interpreted as in line with those in the previous section (see Figure 3), where fear of surveillance was cited as a main reason for not installing the app. The variable trust in others is significant, albeit with a milder effect, only for the highest category in the ordered logit, not so in the LPM model.
Among the remaining explanatory variables, country of birth has the strongest effect. People that are non-European have higher probability of uptake compared to people born in Luxembourg. A possible explanation is that immigrants are more vulnerable to the economic consequences of the pandemic (OECD, 2020), and thus might perceive digital measures for containing the the virus more favourably.
Other variables have limited or no association with willingness to install the app. People aged 31-40 years are more likely to definitively install the app compared to people aged 70 years and older. The effect is absent for other age categories. When considering remote working, people that can work from home for half of their normal working time are more likely to definitely install the app compared to those who do not have the possibility to work remotely (the base category). Men are more likely to install the app compared to women in the LPM, but not in the order logit. Other variables such as self-reported medical conditions or employment status are not statistically significant at conventional levels.
13 Note that the unconditional proportion of respondents that would definitely install the app is 38 percentage points % in the first wave and 33 percentage points in the second wave as shown in Figure 2.
17
Figure 9: Determinants of stating definitely install: Average marginal effects in percentage points. Pooled sample.
Trust ingovernment
Trust inothers
Gender
Age
Country of birth
Education
Employment
Work from home
Sick pay
Medical condition
Socialise
Area of residence
Survey
Fully agreeSomewhat agree
Neither agree nor disagreeSomewhat disagree
Fully disagreeFully agree
Somewhat agreeNeither agree nor disagree
Somewhat disagreeFully disagree
FemaleMale
18-3031-4041-5051-6061-70
70+Luxembourg
PortugalFrance
Other EUNon-EU
Primary or lowerUpper secondary
Lower tertiaryUpper tertiary
EmployedSelf-employed
UnemployedRetired
Student and othersNone
1/4 of normal1/2 of normal3/4 of normal
AllDon't workNo answer
YesNo
No-answerVery good
GoodFair
Bad/very bad<1 a week
Few times a weekFew times a day
Many times a dayCentreSouthNorthEast
Abroad12
-50 0 50 -50 0 50
Pooled LPM Pooled ologit
Percentage pointsDep. var.: definitely install
Source: Authors’ calculations on APPRECIATE surveys data. Note: lines represent 90% Confidence Intervals calculated with heteroscedasticity-robust standard errors. The estimates are based on regressions including also political preferences. Dependent variable: will definitely install the app.
4.1 Panel analysis
What follows presents results from a panel estimation of the probability to install the app. This allows us to account for changes over time and unobservable fixed individual characteristics.
Before estimation, we check that there is sufficient variations in respondents’ answers. Aggregate data in Figure 2 indicate that some variations in answers occurred from survey 1 to survey 2. Table 2 provides a more detailed view on shifts in individual responses, by showing the proportion of individuals that chose a certain answer to the question “would you install the app?” in survey 2, conditional on the answer given in survey 1. On the diagonal, we see the proportion of respondents that provided the same answer in both surveys. On the first row, we observe that, among respondents reporting “definitely install” in survey 1, 63% did

18
not change opinion in survey 2, but 31% reported “probably install” and 2 % “definitely not”. Overall, Table 2 shows that support for the app changes over time at individual level, which justifies the implementation of panel techniques.
Table 2: Transition probabilities: willingness to install the app in survey 2 conditional to willingness to install the app in survey 1.
Would you install the app? Survey 2
Definitely install
Probably install
May or may not
Probably not
Definitely not
Total
Surv
ey 1
Definitely install
63 31 1 3 2 100
Probably install 20 64 2 9 5 100
May or may not 6 33 56 6 0 100
Probably not 6 32 8 44 10 100
Definitely not 2 16 12 24 47 100
Notes: On the diagonal, the proportion of respondents with the same answer in survey 1 and survey 2.
Unobservable time invariant features like personality traits may confound the results of the pooled analysis. For this reason, we re-estimated the regression models presented in Figure 9 using panel data techniques, which allow us to exploit the information from repeated observations on the same respondents.
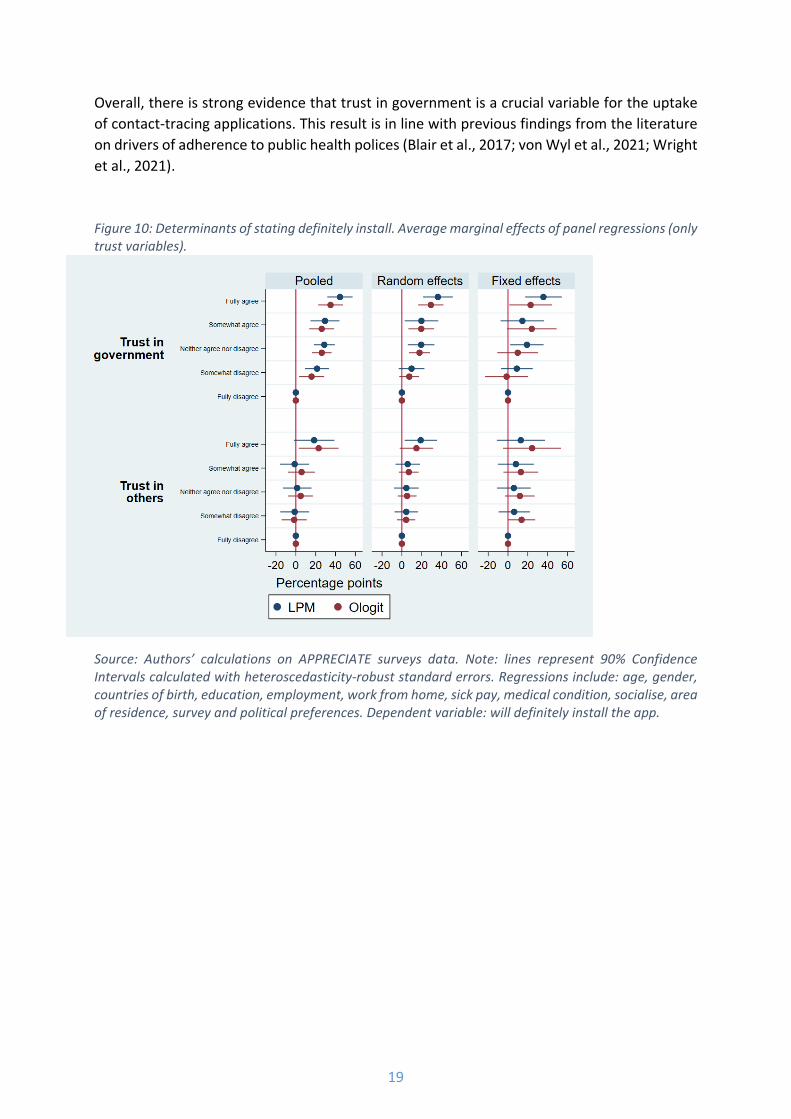
What follows presents results for the trust variables (full results and additional statistics are reported in the Appendix, respectively Table 5 and Figure 13 and 14 ). Figure 10 reports the average marginal effect of trust on the probability to install the app using pooled (for reference), random and fixed effects regressions. The effect of trust in government is consistent in magnitude and significance across all models. 14
For robustness checks, we repeated the analiysis using the following alternative specifications:
1) only the trust variables as covariates; 2) trust variables recoded from 5 categories into 3 categories ("Fully/somehow agree"
"Neither agree nor disagree", "Fully/somehow disagree"); 3) without using sampling weights; 4) two top categories of the dependent variable merged (definitely and probably install); 5) technological preferences on the app design included as additional control varibales.
The results are largely consistent with those presented here.
14 Results from the Hausman test suggest that random effect estimates should be preferred over fix effect estimates.
19
Overall, there is strong evidence that trust in government is a crucial variable for the uptake of contact-tracing applications. This result is in line with previous findings from the literature on drivers of adherence to public health polices (Blair et al., 2017; von Wyl et al., 2021; Wright et al., 2021).
Figure 10: Determinants of stating definitely install. Average marginal effects of panel regressions (only trust variables).
Source: Authors’ calculations on APPRECIATE surveys data. Note: lines represent 90% Confidence Intervals calculated with heteroscedasticity-robust standard errors. Regressions include: age, gender, countries of birth, education, employment, work from home, sick pay, medical condition, socialise, area of residence, survey and political preferences. Dependent variable: will definitely install the app.

20
5 Conclusions
Recent months have been marked by the emergence of new COVID-SARS-2 variants fueling furtehr pandemic waves, and by experts’ warning that the virus is likely becoming endemic. Countries have been mixing medical interventions, and non-pharmaceutical interventions (npis), and stepping up vaccination campaigns. The use of digital technologies in preventing COVID-19 is still debated, and is developing further considering the current introduction of COVID-19 “passports”. It is also increasingly clearer that acceptance of npis measures and social cohesion is crucial in the fight against the virus, in face of high economic and social costs of lockdowns and distancing. This issue of the public willingness to accept digital technologies for contact-tracing, namely contact-tracing apps installed on mobile phones, and more broadly, the use of technology to help living with deadly virus is still topical.
Contact-tracing apps can be effective tools to control the pandemic and could mitigate the high costs of other measures. Their effectiveness, however, depend on public’s uptake and adherence to public health recommendations.
Results from two waves of a nationally representative survey conducted in Luxembourg during summer and autumn 2020 show widespread public support for an app-based contact-tracing of COVID-19. Respondents are in favour of apps that: operate across borders and in Europe, can be installed on a voluntary basis, and store data on the users’ mobile device rather than on a central server. It is plausible that privacy concerns explain at least part of the discrepancy between declared support and observed low installation rates when apps are implemented. Further, our results indicate that a strong motivating factor for installing the app is the sense of responsibility towards the community. The analysis of answers’ variations across survey waves shows that these results are stable over the first pandemic year.
The econometric analysis of the longitudinal (panel) dataset compiled from both surveys highlights that trust in government is a major determinant of the likelihood to install the app. Note that this result is based on self-reported willingness of installing a hypothetical tracing app: acceptability might not translate in actual uptaking, if an app were introduced. Indeed, one limitation of this study is that uptake cannot be observed. Results from other studies, however, show that trust is a strong predictor of self-reported actual installation when tracing apps have been introduced (Horstmann et al., 2020; von Wyl et al., 2021).
For this reason, we expect that trust would play a crucial role in Luxembourg in case a tracing app would be made available.
Both descriptives and econometric results, when examined jointly, suggest that communication to the public and actions should focus on building trust in the population to effectively promote uptake and adherence. They also suggests that communicating benefits of the app, and addressing privacy concerns, could prove crucial for its effectiveness.
These results are also relevant for the overall understanding of factors that determine public adherence to healh measures.
From a methodological point of view, the research constructs and exploits the first probability-based online panel available in Luxembourg to collect data from a representative sample of

21
residents. This panel can be used to collect timely data in the future, thereby improving the resilience of STATEC and of the Luxembourgish research community to unpredictable and new events that could otherwise disrupt the usual stream of data collection and elaboration.
6 References
Abueg M., Hinch R., Wu N., Liu L., Probert W.J.M., Wu A., Eastham P., Shafi Y., Rosencrantz M., Dikovsky M., Cheng Z., Nurtay A., Abeler-Dörner L., Bonsall D.G., McConnell M.V., Shawn O'Banion S., and C. Fraser C. (2021). Modeling the combined effect of digital exposure notification and non-pharmaceutical interventions on the COVID-19 epidemic in Washington state, NPJ digital medicine, 4(1), 1-10. https://doi.org/10.1038/s41746-021-00422-7
Almagor, J., and Picascia, S. (2020). Exploring the effectiveness of a COVID-19 contact tracing app using an agent-based model. Scientific Reports, 10(1), 1–11. https://doi.org/10.1038/s41598-020-79000-y
Altmann, S., Milsom, L., Zillessen, H., Blasone, R., Gerdon, F., Bach, R., Kreuter, F., Nosenzo, D., Toussaert, S., and Abeler, J. (2020). Acceptability of App-Based Contact Tracing for COVID-19: Cross-Country Survey Study. JMIR MHealth and UHealth, 8(8), e19857. https://doi.org/10.2196/19857
Budd, J., Miller, B. S., Manning, E. M., Lampos, V., Zhuang, M., Edelstein, M., Rees, G., Emery, V. C., Stevens, M. M., Keegan, N., Short, M. J., Pillay, D., Manley, E., Cox, I. J., Heymann, D., Johnson, A. M., & McKendry, R. A. (2020). Digital technologies in the public-health response to COVID-19. Nature Medicine, 26(8), 1183–1192. https://doi.org/10.1038/s41591-020-1011-4
Bargain, O., and Aminjonov, U. (2020). Trust and compliance to public health policies in times of COVID-19. Journal of Public Economics, 192, 104316. https://doi.org/10.1016/j.jpubeco.2020.104316
Blair R.A., Morse B.S,. and, Tsai LL. (2017), Public health and public trust: Survey evidence from the Ebola Virus Disease epidemic in Liberia. Soc Sci Med. 172, pp. 89-97. doi: 10.1016/j.socscimed.2016.11.016.
Braithwaite, I., Callender, T., Bullock, M., and R.W. Aldridge (2020), Automated and partly automated contact tracing: a systematic review to inform the control of COVID-19. The Lancet Digital Health, 2,(11), e607-e621, available at https://www.thelancet.com/journals/landig/article/PIIS2589-7500(20)30184-9/fulltext .
Colizza, V., Grill, E., Mikolajczyk, R., Cattuto, C., Kucharski, A., Riley, S., Kendall, M., Lythgoe, K., Bonsall, D., Wymant, C. and Abeler-Dörner, L., (2021). Time to evaluate COVID-19 contact-tracing apps. Nature Medicine, 27(3), pp. 361-362. https://doi.org/10.1038/s41591-021-01236-6
Eurostat. (2019). Quality report Luxembourg EU-SILC 2018. https://circabc.europa.eu/sd/a/1474503e-a151-4d61-9202-46d051ddbfbb/SILC_ESQRS_LU_2018.zip
22
Ferguson C. (2020). Do digital contact tracing apps work? Here’s what you need to know. MIT TECHNOLOGY REVIEW. Available at https://www.technologyreview.com/2020/11/20/1012325/do-digital-contact-tracing-apps-work-heres-what-you-need-to-know/
Ferretti L., Wymant C., Kendall M., Zhao L., Nurtay A., Abeler-Dörner L., Parker M., Bonsal D., and C. Fraser (2020). Quantifying SARS-CoV-2 transmission suggests epidemic control with digital contact tracing, Science, 368(6491), available at https://science.sciencemag.org/content/368/6491/eabb6936.
Guillon, M., and Kergall, P. (2020). Attitudes and opinions on quarantine and support for a contact-tracing application in France during the COVID-19 outbreak. Public Health, 188(1), pp. 21–31. https://doi.org/10.1016/j.puhe.2020.08.026
Horstmann, K. T., Buecker, S., Krasko, J., Kritzler, S., and Terwiel, S. (2020). Short report: Who does or does not use the “Corona-Warn-App” and why?. European Journal of Public Health, 31(1), pp.49-51. https://doi.org/10.1093/eurpub/ckaa239
Huang, Y., Sun, m., and Yuze Sui, (2020). How Digital Contact Tracing Slowed Covid-19 in East Asia, Harvard Business Review,available at https://hbr.org/2020/04/how-digital-contact-tracing-slowed-covid-19-in-east-asia
Jansen-Kosterink, S. M., Hurmuz, M., den Ouden, M., and van Velsen, L. (2020). Predictors to use mobile apps for monitoring COVID-19 symptoms and contact tracing: A survey among Dutch citizens. MedRxiv, available at https://doi.org/https://doi.org/10.1101/2020.06.02.20113423
Jian S.W., Cheng H. Y., Huang X. T., Liu D. P., (2020). Contact tracing with digital assistance in Taiwan’s COVID-19 outbreak response, International Journal of Infectious Diseases, 101, pp. 348-352.
Kendall, M., Milsom, L., Abeler-Dörner, L., Wymant, C., Ferretti, L., Briers, M., Holmes, C., Bonsall, D., Abeler, J. and Fraser, C. (2020). Epidemiological changes on the Isle of Wight after the launch of the NHS Test and Trace programme: a preliminary analysis. The Lancet Digital Health, 2(12), e658-e666. https://doi.org/10.1016/S2589-7500(20)30241-7.
Kostka, G., and Habich-Sobiegalla, S. (2020). In Times of Crisis: Public Perceptions Towards COVID-19 Contact Tracing Apps in China, Germany and the US. SSRN Electronic Journal, 1–36. https://doi.org/10.2139/ssrn.3693783
Kretzschmar, M.E., Rozhnova, G., Bootsma, M.C., van Boven, M., van de Wijgert, J.H. and Bonten, M.J. (2020), Impact of delays on effectiveness of contact tracing strategies for COVID-19: a modelling study, The Lancet Public Health, 5(8), pp. e452-e459, available at https://www.sciencedirect.com/science/article/pii/S2468266720301572
Lewis D. (2021) Contact-tracing apps help reduce COVID infections, data suggest. Nature. doi: https://doi.org/10.1038/d41586-021-00451-y
O’Callaghan, M. E., Buckley, J., Fitzgerald, B., Johnson, K., Laffey, J., McNicholas, B., Nuseibeh, B., O’Keeffe, D., O’Keeffe, I., Razzaq, A., Rekanar, K., Richardson, I., Simpkin, A.,
23
Abedin, J., Storni, C., Tsvyatkova, D., Walsh, J., Welsh, T., and Glynn, L. (2020). A national survey of attitudes to COVID-19 digital contact tracing in the Republic of Ireland. Irish Journal of Medical Science. https://doi.org/10.1007/s11845-020-02389-y
OECD (2020). What is the impact of the COVID-19 pandemic on immigrants and their children?, OECD Policy Responses to Coronavirus (COVID-19), OECD Publishing, Paris, https://doi.org/10.1787/e7cbb7de-en.
Riillo, C. A. F., Peroni, C., and Sarracino, F. (2020). Determinants of Acceptability of Contact Tracing Apps for COVID-19: Initial Results from Luxembourg. Économie et Statistiques No. 117, available at https://statistiques.public.lu/catalogue-publications/economie-statistiques/2020/117-2020.pdf
Rodríguez, P., Graña, S., Alvarez-León, E. E., Battaglini, M., Darias, F. J., Hernán, M. A., López, R., Llaneza, P., Martín, M. C., Ramirez-Rubio, O., Romaní, A., Suárez-Rodríguez, B., Sánchez-Monedero, J., Arenas, A., and Lacasa, L. (2021). A population-based controlled experiment assessing the epidemiological impact of digital contact tracing. Nature Communications, 12(1), pp. 1–6. https://doi.org/10.1038/s41467-020-20817-6
Savanta ComRes (2021) NHS Covid-19 app polling - 13th July 2021. Available at https://comresglobal.com/polls/nhs-covid-19-app-polling-13th-july-2021/
Simko, L., Chang, J. L., Jiang, M., Calo, R., Roesner, F., and Kohno, T. (2020). COVID-19 Contact Tracing and Privacy: A Longitudinal Study of Public Opinion. Proceedings of the ACM on Measurement and Analysis of Computing Systems, 37(4). http://arxiv.org/abs/2012.01553
Utz, C., Becker, S., Schnitzler, T., Farke, F. M., Herbert, F., Schaewitz, L., Degeling, M., and Dürmuth, M. (2021). Apps Against the Spread: Privacy Implications and User Acceptance of COVID-19-Related Smartphone Apps on Three Continents. In Proceedings of the 2021 CHI Conference on Human Factors in Computing Systems, pp. 1-22. http://arxiv.org/abs/2010.14245
von Wyl, V., Höglinger, M., Sieber, C., Kaufmann, M., Moser, A., Serra-Burriel, M., Ballouz, T., Menges, D., Frei, A., and Puhan, M. A. (2021). Drivers of acceptance of COVID-19 proximity tracing apps in Switzerland: Panel survey analysis. JMIR Public Health and Surveillance, 7(1), pp. 1-15. https://doi.org/10.2196/25701
Walrave, M., Waeterloos, C., and Ponnet, K. (2020). Ready or Not for Contact Tracing? Investigating the Adoption Intention of COVID-19 Contact-Tracing Technology Using an Extended Unified Theory of Acceptance and Use of Technology Model. Cyberpsychology, Behavior, and Social Networking, 24(4), pp. 377-383. https://doi.org/10.1089/cyber.2020.0483
Wright, L., Steptoe, A. and Fancourt, D., (2021). Predictors of self-reported adherence to COVID-19 guidelines. A longitudinal observational study of 51,600 UK adults. The Lancet Regional Health-Europe, 4, p.p. 2666-7762. https://doi.org/10.1016/j.lanepe.2021.100061
Wymant, C., Ferretti, L., Tsallis, D., Charalambides, M., Abeler-Dörner, L., Bonsall, D., Hinch, R., Kendall, M., Milsom, L., Ayres, M., Holmes, C., Briers, M., and Fraser, C. (2021). The

24
epidemiological impact of the NHS COVID-19 App. Nature, 594(7863), pp.408-412. http://go.nature.com/2m4scgk
7 Appendix
7.1 Construction of the probability- based online panel
This section provides some details on the sampling and the procedure implemented to compute the opt- in probabilities. The inverse of the opt-in probability is the base weight that is used when computing both cross-sectional and longitudinal sampling weights. The opt-in probabilities characterize the online panel as probability-based and are key for assuring representativeness of our survey.
The opt-in probabilities are computed based on the EU-SILC 2019 data for Luxembourg, a large and reliable official survey aiming to investigate Income and Living Conditions in European countries. The quality and representativeness of EU-SILC assures that the online probability based panel is representative of Luxembourg adult population. In Luxembourg, EU-SILC is mandated by law and participation is mandatory. A stratified random sample of resident households are drown from population register and invited to participate to EU-SILC. The interview is conducted face to face and the answer rate is quite high for general population survey (47% individual total response rate). Sampling weights are computed based on a rich set of variables ( gender, age, canton of residence, NACE (for who is employed), citizenship and size of the household (extrapolation from the census). See Eurostat (2019) for more details.
Figure 11 shows the main steps for conducting the APPRECIATE survey. Of the 8725 respondents of EU-SILC 2019, 1300 gave their consent to be contacted for other surveys and voluntarily shared their private email addresses. The following question was asked to the 87250 respondents of EU-SILC 2019, who were at least 16 years-old in 2018: “Le STATEC réalise régulièrement des études qualitatives (groupes de discussion, entretiens cognitifs etc.) portant sur des sujets variés. Ces études permettent au STATEC de mieux comprendre certaines thématiques et aussi de tester ces questionnaires afin d'améliorer leur qualité. Accepteriez-vous de participer à ce type d'études? » If yes, the respondent was asked to provided the email.
A possible concern is that asking for an email, we are recruiting online panelists among respondents of EU-SILC that may have unobserved higher informatics skills. This should be not a major concern. First, we note that 95% of EU-SILC respondents report having internet at home (this proportion decreases to 70% for people aged 70+ ). Second, out on 1325 that have given the consent to be contacted only 13 have not provided an email. This alleviate concerns that the online panel suffers of unobserved bias towards individual with higher informatics skills, at least in the labour force population.

25
Out of the 1342 initial emails from EU-SILC, 42 were duplicates or not complete, therefore we sent 1300 invitations. 84 email invitations were not delivered because not existing anymore or because the inbox was full. Overall, 1226 invitations were effectively delivered. 904 individuals clicked on the link to the survey, 812 started the survey and 730 were completed. The final answer rate results in nearly 60%, which is high for a voluntary survey, and higher than other general population surveys in Luxembourg. The second survey was administered to the 655 respondents of the first survey that explicitly consented to be contacted again. The final answer rate is about 70%, yielding a total of 522 complete questionnaires in the second survey.
Figure 11: Sampling procedure .
7.2 The model of the opt- in the online panel
We implement a logit model to estimate the probability to provide an email to be contacted to participate for other studies.
After a simple imputation procedure (replacing missing items of categorical variables with the mode and replacing with the mean continuous variables), the sample were randomly split in the training and test set. A linear Lasso model was implanted to pre-select candidate variables for finale model in the training set. Previous literature and economic reasoning complements the list of Lasso preselected variables. The final model contains the following variables: gender age, country of birth, nationality, education, marital status, income, employment, health status, life satisfaction, area of residence, access to internet, language used during the interview, attention to complete the interview (as assessed by the interviewer), consent to use administrative data for completing the survey, participation to previous wave of EU-SILC. Because of GDPR constraints, this data are only used at this stage of the analysis.
26
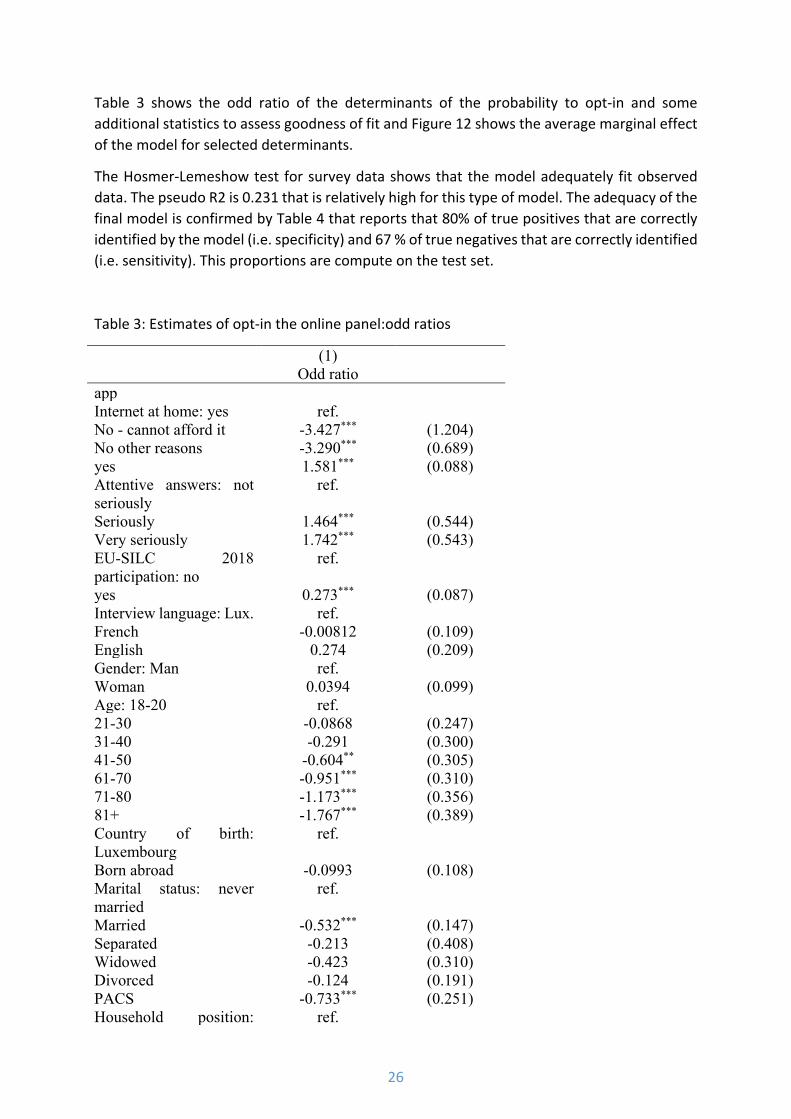
Table 3 shows the odd ratio of the determinants of the probability to opt-in and some additional statistics to assess goodness of fit and Figure 12 shows the average marginal effect of the model for selected determinants.
The Hosmer-Lemeshow test for survey data shows that the model adequately fit observed data. The pseudo R2 is 0.231 that is relatively high for this type of model. The adequacy of the final model is confirmed by Table 4 that reports that 80% of true positives that are correctly identified by the model (i.e. specificity) and 67 % of true negatives that are correctly identified (i.e. sensitivity). This proportions are compute on the test set.
Table 3: Estimates of opt-in the online panel:odd ratios
(1) Odd ratio app Internet at home: yes ref. No - cannot afford it -3.427*** (1.204) No other reasons -3.290*** (0.689) yes 1.581*** (0.088) Attentive answers: not seriously
ref.
Seriously 1.464*** (0.544) Very seriously 1.742*** (0.543) EU-SILC 2018 participation: no
ref.
yes 0.273*** (0.087) Interview language: Lux. ref. French -0.00812 (0.109) English 0.274 (0.209) Gender: Man ref. Woman 0.0394 (0.099) Age: 18-20 ref. 21-30 -0.0868 (0.247) 31-40 -0.291 (0.300) 41-50 -0.604** (0.305) 61-70 -0.951*** (0.310) 71-80 -1.173*** (0.356) 81+ -1.767*** (0.389) Country of birth: Luxembourg
ref.
Born abroad -0.0993 (0.108) Marital status: never married
ref.
Married -0.532*** (0.147) Separated -0.213 (0.408) Widowed -0.423 (0.310) Divorced -0.124 (0.191) PACS -0.733*** (0.251) Household position: ref.

27
head Spouse -0.346*** (0.122) Partner -0.420* (0.217) Son/daughter -1.897*** (0.246) Others -2.740*** (0.582) Refused/don't know 0.0499 (0.307) Household total disposable income
-0.00000172** (0.000)
Employment: employed ref. Unemployed 0.525 (0.337) Retired 0.269 (0.320) Studying 0.643* (0.341) Other inactive 0.155 (0.289) Self-employed: no ref. yes -0.435* (0.257) Seeking job: currently working
ref.
Yes 0.357 (0.301) No -0.0846 (0.279) Education: primary ref. Lower secondary 0.828*** (0.214) Upper secondary 0.975*** (0.198) Post-secondary non-tertiary
0.900*** (0.344)
Short-cycle tertiary 1.303*** (0.254) Bachelor 1.467*** (0.227) Master 1.746*** (0.212) PhD 1.990*** (0.331) Don't know/refused -0.0670 (0.460) Health condition: very good
ref.
Good 0.0561 (0.107) Fair 0.189 (0.137) Bad -0.193 (0.215) Very bad -0.596 (0.473) Don't know/refused -2.127*** (0.746) Life satisfaction: 1-completelly unsatisfied
ref.
2 -0.801 (0.866) 3 0.0703 (0.672) 4 -0.414 (0.655) 5 -0.398 (0.558) 6 -0.0250 (0.556) 7 0.0360 (0.547) 8 -0.0312 (0.546) 9 0.0988 (0.551) 10- Completely satisfied 0.236 (0.559) Area of residence: CAPELLEN
ref.
CLERVAUX -0.790** (0.353) DIEKIRCH -0.0953 (0.236)
28
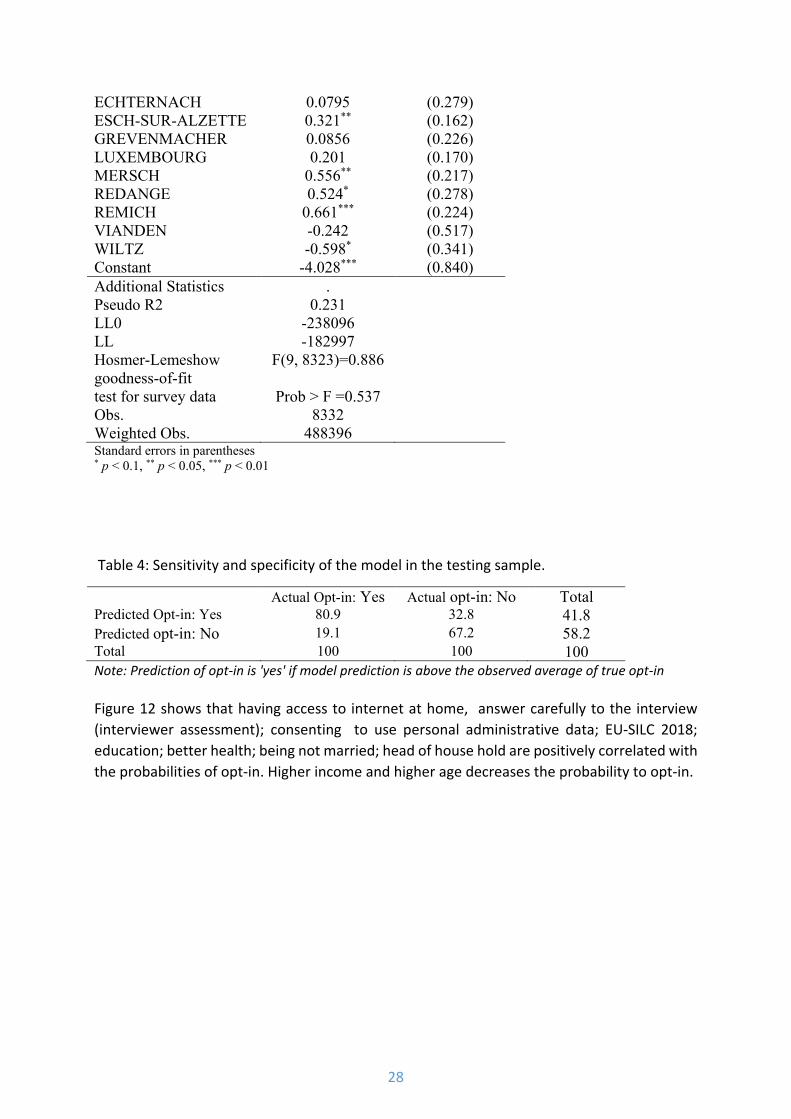
ECHTERNACH 0.0795 (0.279) ESCH-SUR-ALZETTE 0.321** (0.162) GREVENMACHER 0.0856 (0.226) LUXEMBOURG 0.201 (0.170) MERSCH 0.556** (0.217) REDANGE 0.524* (0.278) REMICH 0.661*** (0.224) VIANDEN -0.242 (0.517) WILTZ -0.598* (0.341) Constant -4.028*** (0.840) Additional Statistics . Pseudo R2 0.231 LL0 -238096 LL -182997 Hosmer-Lemeshow goodness-of-fit
F(9, 8323)=0.886
test for survey data Prob > F =0.537 Obs. 8332 Weighted Obs. 488396 Standard errors in parentheses * p < 0.1, ** p < 0.05, *** p < 0.01
Table 4: Sensitivity and specificity of the model in the testing sample.
Actual Opt-in: Yes Actual opt-in: No Total Predicted Opt-in: Yes 80.9 32.8 41.8 Predicted opt-in: No 19.1 67.2 58.2 Total 100 100 100 Note: Prediction of opt-in is 'yes' if model prediction is above the observed average of true opt-in Figure 12 shows that having access to internet at home, answer carefully to the interview (interviewer assessment); consenting to use personal administrative data; EU-SILC 2018; education; better health; being not married; head of house hold are positively correlated with the probabilities of opt-in. Higher income and higher age decreases the probability to opt-in.

29
Figure 12: Selected determinants of the probability to opt-in the online panel: average marginal effects.
yesNo - cannot afford itNo other reasons
Noyes
Not at all seriouslySeriouslyVery seriously
Noyes
LuxembourghishFrenchEnglish
ManWoman
18-2020-3030-4040-5060-7070-8080+
Born in LuxembourgBorn abroad
Never marriedMarriedSeparetedWidowedDivorcedPACS
Head of HHSpousePartnerSon/daughterOthersRefused/don't know
Household total disposable income
At workUnemployedRetiredStudyingOther inactive
Noyes
Currently workingYesNo
PrimaryLower secondaryUpper secondaryPost-secondary non-tertiaryShort-cycle tertiaryBachelorMasterPhDDon't know/refused
Very goodGoodFairBadVery badDon't know/refused
Internt at home
Consent to use administrative data
Attentive answers
EU-SILC 2018 parteciaption
Interview language
Gender
Age
Country of birth
Marital status
Household position
Income
Employment
Self-employed
Seeking job
Education
Health condition
-20 -10 0 10 20Percentage points
Source: Authors’ calculations on EU-SILC 2019 data. Note: lines represent 90% Confidence Intervals calculated with heteroscedasticity-robust standard errors. The estimates are based on regressions including also life satisfaction and area of residence. The most frequent category is the base line of categorical variables. Dependent variable: opt-in the online panel.

30
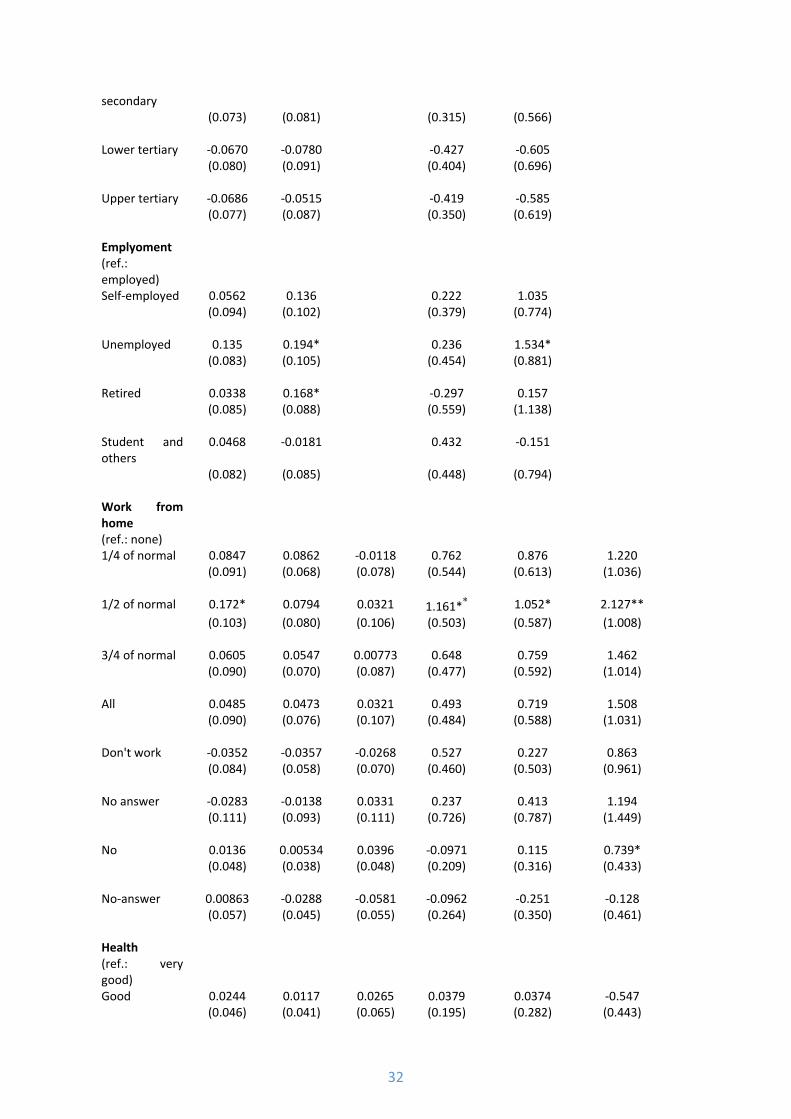
Table 5: Probability to definitely install: pooled and longitudinal models estimates in survey 1 and survey 2.
Linear Probability Model Ologit Model (1) (2) (3) (4) (5) (6) Pooled Random
Effects Fixed
Effects Pooled Random Effects Fixed
Effects Trust in government
(ref.: fully disagree)
Fully agree 0.445*** 0.363*** 0.357*** 1.984*** 2.567*** 1.661* (0.077) (0.091) (0.112) (0.562) (0.763) (0.949) Somewhat agree
0.294*** 0.197* 0.146 1.584*** 1.793** 1.745
(0.089) (0.103) (0.134) (0.562) (0.761) (1.107) Neither agree nor disagree
0.287*** 0.194** 0.192* 1.588*** 1.649** 0.717
(0.064) (0.082) (0.102) (0.522) (0.686) (0.913) Somewhat disagree
0.214*** 0.0973 0.0895 1.082* 0.750 -0.0996
(0.074) (0.079) (0.098) (0.580) (0.654) (0.967) Trust in others (ref.: fully disagree)
Fully agree 0.184 0.189* 0.129 1.056* 1.222 1.767 (0.125) (0.099) (0.147) (0.566) (0.837) (1.290) Somewhat agree
-0.0120 0.0577 0.0796 0.273 0.591 0.944
(0.089) (0.074) (0.110) (0.396) (0.523) (0.776) Neither agree nor disagree
0.0136 0.0450 0.0591 0.230 0.448 0.876
(0.088) (0.075) (0.103) (0.369) (0.508) (0.658) Somewhat disagree
-0.0116 0.0441 0.0625 -0.0850 0.367 0.999
(0.088) (0.072) (0.095) (0.379) (0.487) (0.612) Political preferences (ref:5)
1 Link 0.128 0.101 0.332 0.796 (0.079) (0.088) (0.377) (0.753) 3 0.0444 -0.0718 0.0431 -0.358 (0.087) (0.093) (0.362) (0.637) 4 0.0402 -0.0565 0.279 0.0323

31
(0.091) (0.097) (0.339) (0.650) 6 -0.131* -0.107 -0.652* -1.037 (0.076) (0.101) (0.356) (0.745) 7 0.0194 -0.0561 -0.111 -0.516 (0.108) (0.109) (0.441) (0.828) 8 0.0369 -0.0452 0.323 -0.388 (0.104) (0.098) (0.382) (0.723) 10 Right 0.0425 -0.0557 -0.159 -1.029 (0.107) (0.129) (0.605) (1.185) No answer -0.0226 -0.0574 -0.317 -0.496 (0.058) (0.066) (0.258) (0.509)
Gender Male 0.0766* 0.0539 0.248 0.481 (0.043) (0.045) (0.180) (0.344) Age (ref.: 70+) 18-30 0.0401 0.206* -0.600 -0.217 (0.107) (0.118) (0.795) (1.642) 31-40 0.0871 0.223** -0.505 -0.238 (0.099) (0.111) (0.758) (1.539) 41-50 0.171* 0.262** -0.0413 0.0435 (0.103) (0.114) (0.759) (1.572) 51-60 0.0963 0.148 -0.0897 -0.159 (0.091) (0.101) (0.648) (1.348) 61-70 0.123 0.137 0.438 0.670 (0.085) (0.097) (0.416) (0.806)
Country of birth
(ref.: Luxembourg)
Portugal 0.00441 -0.0899 0.0965 0.0683 (0.085) (0.081) (0.472) (0.817) France 0.00871 -0.0223 -0.0402 0.101 (0.062) (0.070) (0.280) (0.494) Other EU 0.0799 0.0646 0.361 0.751 (0.062) (0.067) (0.265) (0.485) Non-EU 0.280*** 0.168* 0.919* 0.868 (0.095) (0.090) (0.481) (0.733) Education (ref. Primary or lower)
Upper -0.00566 -0.0496 -0.293 -0.645
32
secondary (0.073) (0.081) (0.315) (0.566) Lower tertiary -0.0670 -0.0780 -0.427 -0.605 (0.080) (0.091) (0.404) (0.696) Upper tertiary -0.0686 -0.0515 -0.419 -0.585 (0.077) (0.087) (0.350) (0.619) Emplyoment (ref.: employed)
Self-employed 0.0562 0.136 0.222 1.035 (0.094) (0.102) (0.379) (0.774) Unemployed 0.135 0.194* 0.236 1.534* (0.083) (0.105) (0.454) (0.881) Retired 0.0338 0.168* -0.297 0.157 (0.085) (0.088) (0.559) (1.138) Student and others
0.0468 -0.0181 0.432 -0.151
(0.082) (0.085) (0.448) (0.794) Work from home
(ref.: none) 1/4 of normal 0.0847 0.0862 -0.0118 0.762 0.876 1.220 (0.091) (0.068) (0.078) (0.544) (0.613) (1.036) 1/2 of normal 0.172* 0.0794 0.0321 1.161** 1.052* 2.127** (0.103) (0.080) (0.106) (0.503) (0.587) (1.008) 3/4 of normal 0.0605 0.0547 0.00773 0.648 0.759 1.462 (0.090) (0.070) (0.087) (0.477) (0.592) (1.014) All 0.0485 0.0473 0.0321 0.493 0.719 1.508 (0.090) (0.076) (0.107) (0.484) (0.588) (1.031) Don't work -0.0352 -0.0357 -0.0268 0.527 0.227 0.863 (0.084) (0.058) (0.070) (0.460) (0.503) (0.961) No answer -0.0283 -0.0138 0.0331 0.237 0.413 1.194 (0.111) (0.093) (0.111) (0.726) (0.787) (1.449) No 0.0136 0.00534 0.0396 -0.0971 0.115 0.739* (0.048) (0.038) (0.048) (0.209) (0.316) (0.433) No-answer 0.00863 -0.0288 -0.0581 -0.0962 -0.251 -0.128 (0.057) (0.045) (0.055) (0.264) (0.350) (0.461) Health (ref.: very good)
Good 0.0244 0.0117 0.0265 0.0379 0.0374 -0.547 (0.046) (0.041) (0.065) (0.195) (0.282) (0.443)

33
Fair -0.0220 -0.0831 -0.0573 -0.0139 -0.797* -2.163*** (0.068) (0.058) (0.082) (0.353) (0.476) (0.823) Bad/very bad -0.0384 -0.0948 -0.0202 0.240 -1.170 -2.414* (0.132) (0.102) (0.110) (0.548) (0.748) (1.236) Socialise (ref.: <1 a week)
Few times a week
-0.0629 0.00740 0.0693 -0.174 0.190 0.540
(0.063) (0.062) (0.083) (0.329) (0.501) (0.438) Few times a day
-0.111 0.00541 0.125 -0.490 0.125 1.249*
(0.078) (0.066) (0.090) (0.385) (0.532) (0.704) Many times a day
-0.0461 0.00988 0.120 -0.0587 0.389 1.693***
(0.077) (0.065) (0.089) (0.405) (0.578) (0.652) Area of residence
(ref.: centre) South -0.00563 -0.0243 0.0165 -0.140
(0.050) (0.055) (0.210) (0.397) North 0.123* 0.112 0.353 0.533 (0.071) (0.071) (0.288) (0.536) East -0.0221 -0.0616 -0.313 -0.481 (0.063) (0.069) (0.284) (0.497) Abroad -0.00500 0.0558 -0.452 -0.0517 (0.121) (0.131) (0.466) (0.833) Survey (ref.:1) Survey 2 -0.0817** -0.0737** -0.0697** -0.238 -0.173 0.0635 (0.041) (0.030) (0.032) (0.183) (0.206) (0.219) Additional Statistics
LL0 -635.2 49.8 -462204.9
-548437.7 -505121.5
LL -552.9 83.3 -429749.0
-514698.2 -201388.7
Hausman test(unweighted)
Chi2(23)=14.18
Chi2(23)=11.71
appropriateness of the RE estimator
Prob>chi2 =0.92
Prob>chi2 =0.97
Robust standard errors in parentheses. Time invariant variables are not estimated in Fix effect models * p < 0.1, ** p < 0.05, *** p < 0.01
34
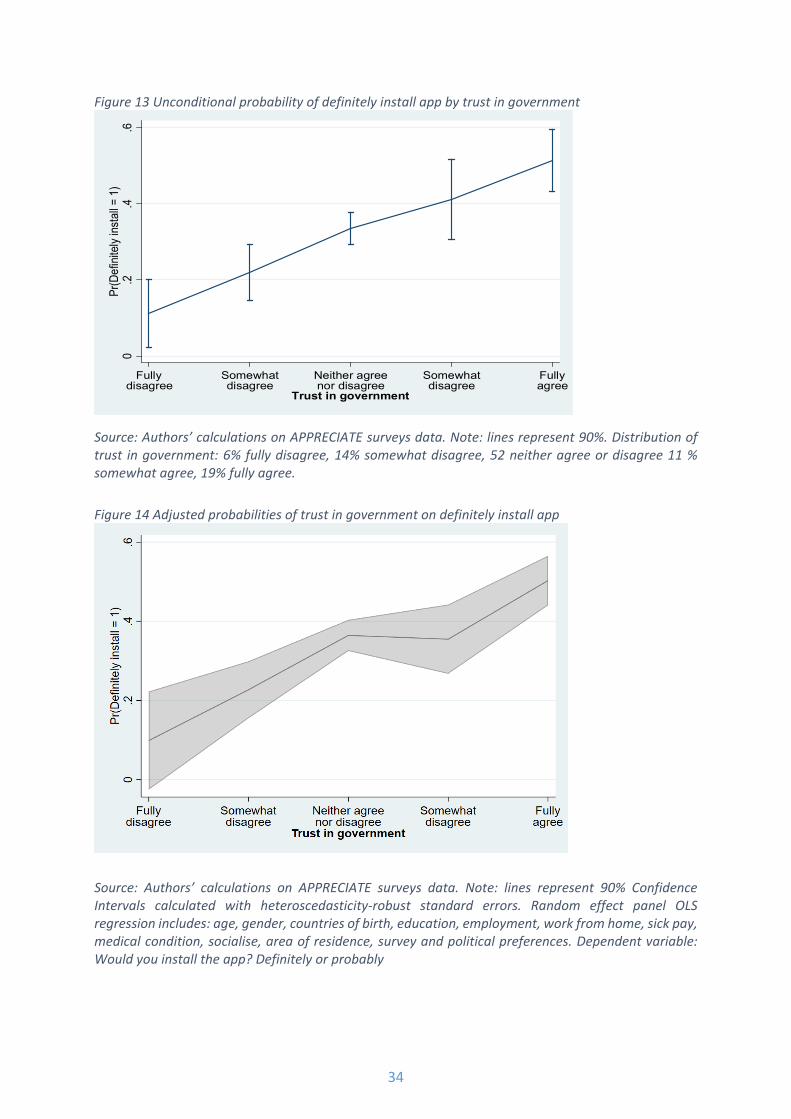
Figure 13 Unconditional probability of definitely install app by trust in government
Source: Authors’ calculations on APPRECIATE surveys data. Note: lines represent 90%. Distribution of trust in government: 6% fully disagree, 14% somewhat disagree, 52 neither agree or disagree 11 % somewhat agree, 19% fully agree.
Figure 14 Adjusted probabilities of trust in government on definitely install app
Source: Authors’ calculations on APPRECIATE surveys data. Note: lines represent 90% Confidence Intervals calculated with heteroscedasticity-robust standard errors. Random effect panel OLS regression includes: age, gender, countries of birth, education, employment, work from home, sick pay, medical condition, socialise, area of residence, survey and political preferences. Dependent variable: Would you install the app? Definitely or probably
0.2
.4.6
Pr(D
efin
itely
inst
all =
1)
Fullydisagree
Somewhatdisagree
Neither agreenor disagree
Somewhatdisagree
Fullyagree
Trust in government