n e w j e r s e y s t a t e l e g i s l a t u r e€¦ · paul a. sarlo chairman brian p. stack...
TRANSCRIPT

PAUL A. SARLO
Chairman
BRIAN P. STACK
Vice-Chairman
NILSA CRUZ-PEREZ
SANDRA B. CUNNINGHAM
PATRICK J. DIEGNAN, JR.
LINDA R. GREENSTEIN
M. TERESA RUIZ
TROY SINGLETON
DAWN MARIE ADDIEGO
ANTHONY R. BUCCO
DECLAN J. O’SCANLON, JR.
STEVEN V. OROHO
SAMUEL D. THOMPSON
FRANK W. HAINES III
Legislative Budget and
Finance Officer
THOMAS KOENIG
Assistant Legislative Budget
and Finance Officer
(609) 847-3105
N e w J e r s e y S t a t e L e g i s l a t u r e SENATE BUDGET AND APPROPRIATIONS COMMITTEE
STATE HOUSE ANNEX PO BOX 068
TRENTON NJ 08625-0068
May 2, 2018
Honorable Zakiya Smith Ellis Honorable David J. Socolow
Acting Secretary Executive Director
New Jersey Higher Education Higher Education Student Assistance Authority
20 West State Street 4 Quakerbridge Plaza
P.O. Box 542 Trenton, New Jersey 08619
Trenton, New Jersey 08625-0542
Dear Secretary Smith Ellis and Executive Director Socolow:
During the Higher Educational Services hearing before the Senate Budget and Appropriations
Committee on April 26, 2018, you indicated that a written response would be forthcoming to the
following questions raised by members of the committee:
Senator Cunningham:
It has been suggested that the recommended appropriation for the Governor’s community
college opportunity grant program would eliminate tuition and fees at county colleges for
approximately 15,000 individuals. Please provide a detailed explanation of the data and
methodology used to obtain this estimate.
HESAA’s estimates for the proposed Community College Opportunity Grants (CCOG) started with
the baseline total enrollment of 150,468 at New Jersey’s 19 county colleges, as reported in the
Integrated Postsecondary Education Data System (IPEDS) fall 2016 enrollment survey.
We analyzed HESAA data on county college students who were awarded Tuition Aid Grants (TAG),
including these students’ average family income. We also estimated students’ likely Pell Grant
awards based on data HESAA received from completed Free Application for Federal Student Aid
(FAFSA) forms filed by students who listed a county college but who did not qualify for TAG.
Through this analysis, we estimated that 15,579 students either did not receive TAG and Pell Grant
awards or received Pell Grants in amounts that only partially covered their county colleges’ combined
tuition and educational fees (thus having a remaining tuition balance unpaid via other aid). Under the
proposal, each of these students would be eligible for CCOG funding to cover the gap. As outlined
on attachment #1, we then estimated Spring 2019 CCOG utilization through projections based on
these 2016/2017 data, including assumptions about increased enrollment levels as students became
aware of CCOG funding, as well as adjustments to the baseline to account for the typical drop in
spring enrollment compared with the fall semester. Through these calculations, we estimated CCOG
awards of $36 million for the Spring 2019 semester.

Honorable Zakiya Smith Ellis
Honorable David J. Socolow
Page 2
May 9, 2018
To ensure sufficient funds, the budget language allocated $40 million for the CCOG awards. In
addition, it is important to note that the overall program cost of $50 million includes budget language
appropriating an additional $5 million for the purpose of providing planning grants to community
colleges to develop plans for a program of free community college education including but not limited
to goals and strategies for capacity building, increasing student completion, reducing financial
burdens on students, and estimates and plans by the community colleges for adapting to increased
enrollment. The budget language also provides an additional amount of no more than $5 million
which can be reallocated to augment the Educational Opportunity Fund program at community
colleges, to provide mentoring, tutoring, and other services to help students succeed and complete
their college program.
Senator Singleton:
Under the proposed community college opportunity grant program, what is the projected
average award per grantee?
The estimated average CCOG award for Spring 2019 is $2,117. Please see attachment #1.
For the most recent academic year for which data are available, please provide data showing,
among students that receive either a Pell grant or a tuition aid grant, the average percent of
tuition and fees that are covered by these grants. Please provide the data separately for
students attending two-year institutions and four-year institutions.
Based on institutional data from the National Center for Education Statistics, as compiled on the
website of the New Jersey Office of the Secretary of Higher Education (OSHE)
(http://www.nj.gov/highereducation/statistics/PubCollData.shtml), HESAA estimates that the
average percentage of tuition and fees covered by either a Pell grant and/or a tuition aid grant for
students who attended two-year institutions in the Academic Year 2015-2016 was 68%. The average
percentage for students who attended four-year institutions was 27%.
A number of other states have implemented student assistance programs that eliminate tuition
at two-year institutions of higher education. Please provide information regarding the impacts
of these programs, including, wherever possible, changes in enrollment, student retention, and
costs incurred by the institutions.
There are several states that have tuition-free community college programs, including Tennessee,
Oregon, Rhode Island, California, Arkansas, and most recently, Maryland. These states have
approached their program designs in various ways, each somewhat differently. For instance,
technically, California does not charge in-state tuition for its community colleges, but does require
mandatory “fees” for educational costs, which are nominal and were already covered for most
students through a waiver. Recently, the state enacted legislation to cover most of these fees for all
students. The program in Tennessee is quite different, and pays the difference between the amount
of tuition covered by Pell grants and other state aid and the remaining tuition balance for eligible
students. The style of program, the population of students eligible, and type of implementation will
impact the results.

Honorable Zakiya Smith Ellis
Honorable David J. Socolow
Page 3
May 9, 2018
Most of these state programs are too new to have been thoroughly researched. However, this recent
manuscript shared at the Association for Education Finance and Policy (AEFP) conference provides
some preliminary insight into the potential impacts of the Tennessee program. The full impacts on
degree completion won’t be known for several years; the study’s finding to date are summarized
below. First, this paper suggests that the Promise program in Tennessee created a shift in
enrollment among African American students in the state from private, for-profit schools to
community colleges. Given the completion and debt levels at for-profit colleges compared to that of
community colleges, this could actually be a positive trend. Second, institutions eligible for the
Promise program did see a large increase in in-state enrollment, while those schools that were
ineligible (public four-year colleges) saw a decrease in enrollment of in-state students, coupled with
an increase in enrollment of out-of-state students.
However, a note of caution about these findings: this analysis was completed based on the initial
implementation of the Tennessee promise—which was only available to first-time, full-time recent
high school graduates. The program proposed by Governor Murphy in the FY19 budget would be
available to both recent high school graduates and older working adults. In addition, the regional
differences between Tennessee and New Jersey might also make the impacts of this kind of
program different in New Jersey than in Tennessee.
For further information, please review this brief summary of initial impacts of the Tennessee
program from the Educational Advisory Board: https://www.eab.com/-/media/EAB/Research-and-
Insights/AAF/Resources/Academic-Leadership-Center/Proposals%20for%20Tuition-
Free%20and%20Debt-Free%20College.pdf
We would be happy to discuss this information in more detail with you in person.
In the current academic year, what is the total amount of tuition waived by Thomas Edison
State University for members of the New Jersey National Guard, and children or surviving
spouses of members of the New Jersey National Guard who were killed in the performance
of their duties? How does that compare to the amount of institutional support provided by the
State during the same year?
In responding to this question, we solicited the relevant information directly from Thomas Edison
State University.
Thomas Edison State University’s response: Thomas Edison has waived $796,589 in tuition for members of the New Jersey National Guard and
Veterans through the end of the third quarter of fiscal year 2018. The University did not have any
waivers for children or surviving spouses of members of the New Jersey National Guard who were
killed in the performance of their duties. The waivers include $559,749 and $236,840 in New Jersey
National Guard waivers and Yellow Ribbon waivers for Veterans, respectively. The University is on
pace to waive $1,062,119 in tuition during fiscal year 2018. The fiscal year 2019 recommended direct
support for the University is $3,292,000. These waivers represent 32.3% of the fiscal year 2019
recommended direct support for the University.
Please provide the graduation rates at two-year and four-year public institutions of higher
education for the five most recent academic years available.
Honorable Zakiya Smith Ellis
Honorable David J. Socolow
Page 4
May 9, 2018
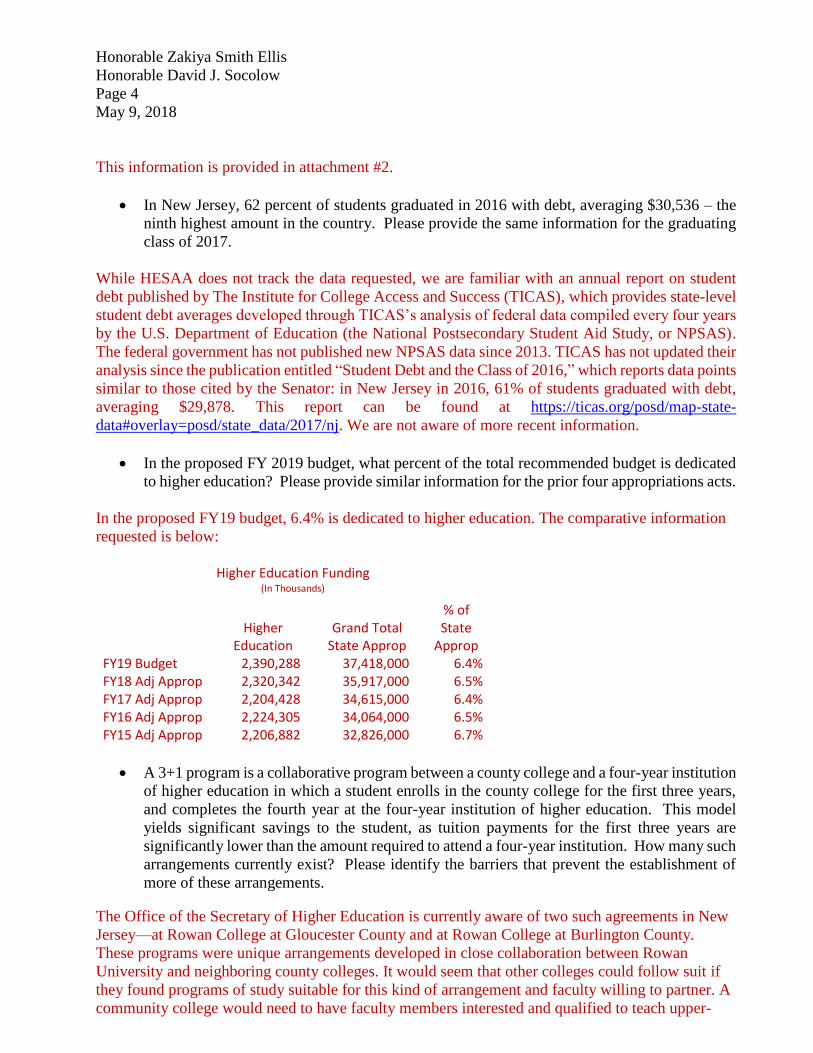
This information is provided in attachment #2.
In New Jersey, 62 percent of students graduated in 2016 with debt, averaging $30,536 – the
ninth highest amount in the country. Please provide the same information for the graduating
class of 2017.
While HESAA does not track the data requested, we are familiar with an annual report on student
debt published by The Institute for College Access and Success (TICAS), which provides state-level
student debt averages developed through TICAS’s analysis of federal data compiled every four years
by the U.S. Department of Education (the National Postsecondary Student Aid Study, or NPSAS).
The federal government has not published new NPSAS data since 2013. TICAS has not updated their
analysis since the publication entitled “Student Debt and the Class of 2016,” which reports data points
similar to those cited by the Senator: in New Jersey in 2016, 61% of students graduated with debt,
averaging $29,878. This report can be found at https://ticas.org/posd/map-state-
data#overlay=posd/state_data/2017/nj. We are not aware of more recent information.
In the proposed FY 2019 budget, what percent of the total recommended budget is dedicated
to higher education? Please provide similar information for the prior four appropriations acts.
In the proposed FY19 budget, 6.4% is dedicated to higher education. The comparative information
requested is below:
Higher Education Funding
(In Thousands)
Higher Education
Grand Total State Approp
% of State
Approp FY19 Budget 2,390,288 37,418,000 6.4% FY18 Adj Approp 2,320,342 35,917,000 6.5% FY17 Adj Approp 2,204,428 34,615,000 6.4% FY16 Adj Approp 2,224,305 34,064,000 6.5% FY15 Adj Approp 2,206,882 32,826,000 6.7%
A 3+1 program is a collaborative program between a county college and a four-year institution
of higher education in which a student enrolls in the county college for the first three years,
and completes the fourth year at the four-year institution of higher education. This model
yields significant savings to the student, as tuition payments for the first three years are
significantly lower than the amount required to attend a four-year institution. How many such
arrangements currently exist? Please identify the barriers that prevent the establishment of
more of these arrangements.
The Office of the Secretary of Higher Education is currently aware of two such agreements in New
Jersey—at Rowan College at Gloucester County and at Rowan College at Burlington County.
These programs were unique arrangements developed in close collaboration between Rowan
University and neighboring county colleges. It would seem that other colleges could follow suit if
they found programs of study suitable for this kind of arrangement and faculty willing to partner. A
community college would need to have faculty members interested and qualified to teach upper-

Honorable Zakiya Smith Ellis
Honorable David J. Socolow
Page 5
May 9, 2018
division level classes, and a partnering senior public institution would need to be willing to share
their curricula and training with the community college faculty. In addition, the partnering senior
public institution would need to be willing to allow the credits from the courses taken at the county
college to fully transfer to a particular program of study such that only a year of coursework is
remaining.
Our office’s understanding of the programs suggest that some programs are better suited to these
types of arrangements than others, so the ability to develop more programs of this nature is really
dependent on institutional capability and interest, both among administrators and faculty.
We would appreciate your providing this information within the next five working days so
that it may be utilized by the committee during its continued deliberations. Your response should be
directed to us through the following address:
Frank Haines
Legislative Budget and Finance Officer
Office of Legislative Services
State House Annex, P.O. Box 068
Trenton, New Jersey 08625-0068
Sincerely,
Paul A. Sarlo, Chairman
Senate Budget and Appropriations Committee
c Frank Haines, Legislative Budget and Finance Office
David Ridolfino, Office of Management and Budget
Eugene Lepore, Senate Democratic Office
Luke Wolff, Senate Democratic Office
Christopher Emigholz, Senate Republican Office
Allen Dupree, Office of Legislative Services


N
2006 Cohort 16,485 6,482 39.3% 10,259 62.2% 11,035 66.9%
2007 Cohort 17,068 7,202 42.2% 10,520 61.6% 11,457 67.1%
2008 Cohort 17,420 7,655 43.9% 11,016 63.2% 11,841 68.0%
2009 Cohort 18,195 7,892 43.4% 11,436 62.9% 12,376 68.0%
2010 Cohort 18,789 8,539 45.4% 12,035 64.1% 12,831 68.3%
2011 Cohort 19,226 8,893 46.3% 12,464 64.8% 13,236 68.8%
N
2009 Cohort 30,837 1,996 6.5% 5,283 17.1%
2010 Cohort 31,498 2,540 8.1% 5,128 16.3%
2011 Cohort 29,021 1,931 6.7% 5,019 17.3%
2012 Cohort 28,750 2,068 7.2% 5,588 19.4%
2013 Cohort 28,188 2,314 8.2% 6,031 21.4%
2014 Cohort 26,296 2,368 9.0% 5,821 22.1%
Source: IPEDS Graduation Rates Survey
2 years 3 years
NJ Public Institutions - Graduation Rates Five Year Trend
Graduated in:
Graduated in:
First-Time Full-Time Degreee Seeking only
4 years 5 years 6 years
Senior Public Institutions
County Colleges