n otes v ariables. v ariable a factor in an experiment that changes or could be changed there are 3...
TRANSCRIPT

NOTES VARIABLES

VARIABLEA factor in an experiment that
changes or could be changed There are 3 types

INDEPENDENT VARIABLEVariable that is changed on purpose, it is what you are testing.
You manipulate it to see how it affects the dependent variable.
There can only be one (1) independent variable in any investigation or experiment.
DEPENDENT VARIABLEThe variable that responds to changes in independent variable, it is what you look for changes in.
This is the factor that you measure in an experiment.
This is the observed result of independent variable changes.
There can be more than one in an experiment

CONTROLOften called control groupThis is what you compare your results to.
Not manipulated or changed in any way.
Example: Investigating how a weight affects the length of an elastic band.Use the same elastic band each timeUse the same scale each time

CONSTANTSSometimes mistaken for controlThis is what you compare your results to.These are factors you need to manage
so they don’t change your results.Usually small things that would not seem
to matter.Example: The way you held the dropper in
the penny lab, the way you released the helicopter, the height you dropped it from.

PRACTICEIdentify variables for the following
experiments.

PRACTICE QUESTION 1Does changing the temperature
of a ball affect the height the ball will bounce?

PRACTICE QUESTION 1Does changing the temperature
of a ball affect the height the ball will bounce?
Written in the blue is the dependant variable
Written in red is the independent variable
Control variables on next slide

CONSTANTS Same ballDropped from same heightDropped onto same surface
ControlDropping the ball at normal temp.

PRACTICE QUESTION 2
Does changing the color of light affect the growth rate of plants?

PRACTICE QUESTION 2
Does changing the color of light affect the growth rate of plants?
Written in the blue is the dependant variable
Written in red is the independent variable
Control variables on next slide

CONSTANTS
Same type and size of plantSame wattage of bulbSame amount of waterSame soilLight on for same amount of timeEtc…

VALID EXPERIMENTEverything you have seen goes into
making an experiment VALID.Can be repeated by anyone & get
same or similar results. It should also have a good control
group with a good comparison.Well monitored variablesGood written procedure

NOTES GRAPHS

TYPES OF GRAPHS
A graph is just a picture of an amount of something. Like size of buildings since 1900.

Circle or pie graph. Shows fractions of a whole.

Bar graph uses bars to show the data (words or numbers).

Histogram used to show pure numbers in order. Range of data can be shown, bars should be touching.

Line graph, shows points plotted on a graph connected by a line. Any type of data.

On a typical graph there are 2 axis. an X and a Y.

Your independent variable goes on X axis ( it is almost always time)
Your dependent variable goes on Y axis

Your X and Y axis scale can be differentbut the spacing between the
numbers should be the same on an axis.
Graphs should have title, and descriptions on both X and Y axis.

In other words your graph should TALK
T title descriptiveA axis evenly spacedL label both axis and titleK key or legend if needed

VOCABULARY Two very important terms when working with
graphs. Interpolation and Extrapolation

Interpolation – is when you find a value that lies on the smooth curve or line between two actual data points.
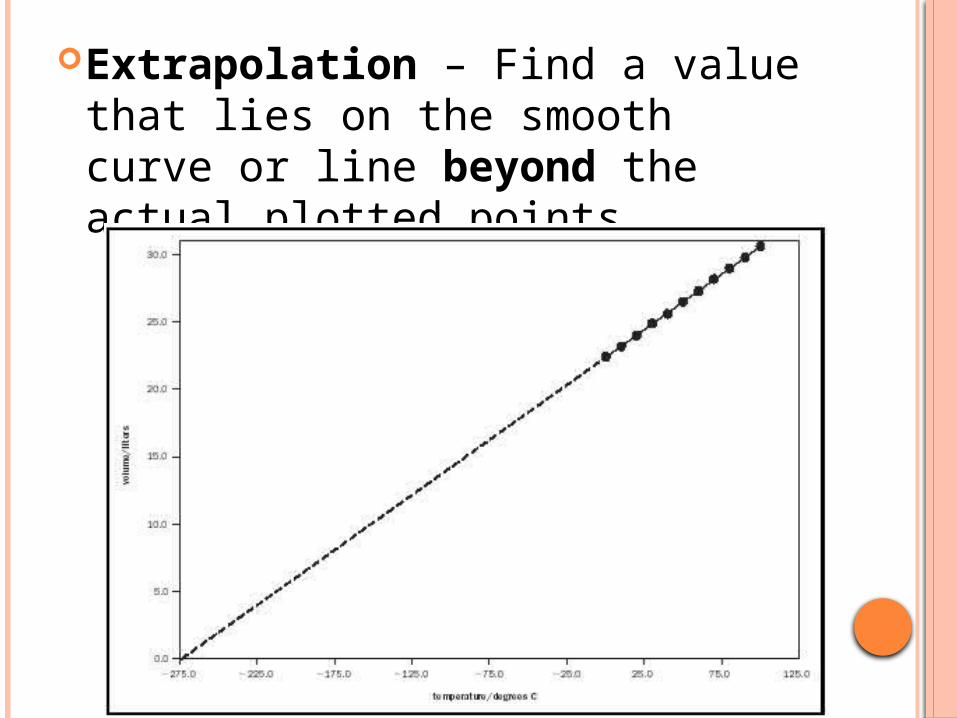
Extrapolation – Find a value that lies on the smooth curve or line beyond the actual plotted points.