n90 -16689 - nasa · the range of 193 to 223 _nnol/m_/s ana did not appear to change ... list of...
TRANSCRIPT

N90 -16689
1989 NASA/ASEE SUMMER FACULTY FELLOWSHIP PROGRAM
JOHN F. KENNEDY SPACE CENTER
UNIVERSITY OF CENTRAL FLORIDA
DYNAMICS OF CARBON DIOXIDE EXCHANGE OF A
WHEAT COMMUNITY GROWN IN A SEMI-CLOSED ENVIRONMENT
PREPARED BY:
ACADEMIC RANK:
UNIVERSITY AND DEPARTMENT:
NASA/KSC
DIVISION:
BRANCH:
NASA COLLEAGUE:
DATE:
CONTRACT NUMBER:
Dr. Kenneth A. Corcy
Associate Professor
University of Massachusetts
Department of Plant & Soil Sciences
Biomedical Operations and Research
Life Sciences Research Office
Mr. Ralph P. Prince
August 4, 1989
University of Central Florida
NASA-NGT-60002 Supplement: 2
58
- j
https://ntrs.nasa.gov/search.jsp?R=19900007373 2018-07-16T14:30:28+00:00Z


ACEN_S
I am extremely grateful for the opportunity to be a part of the
1989 NASA/ASEE Summer Faculty Fellowship Program. Many
individuals are responsible for helping to make this an
enjoyable, productive, and rewarding experience.
Special thanks is due to program director E. Ramon HQsler and hisadministrative assistant Kari Baird for their smoothhandling and
coordination of tours, activities, special events, and general
administrative details. To my KSC colleague, Ralph P. Prince, I
extend my appreciation for making this wonderful opportunity
possible and also for many stimulating discussions related to the
CELSS program.
A most special thanks is extended to Raymond M. Wheeler, the
project leader and my collaborator. It was only through Ray's
leadership and experience that this project could be conducted.
For his patience and time spent discussing experimental protocol
and interpretations of data, I am most grateful.
I am grateful to John Sager with whom I've had many stimulatingdiscussions and who introduced me to a valuable matha_atics
software package. I also acknowledge Glenn A. Markwell, for his
assistance in data retrieval and for providing PLC
statements for experiments, Cheryl L. Mackowiak for planting and
general crop maintenance, Katrina Chetirkin for her assistance in
data acquisition, and Peter B. Heifetz for introducing me to a
helpful graphics software package.
This project represents a small piece of work associated with the
larger scale efforts undertaken by many dedicated individuals.
To all those people who have contributed to the design,
development, and testing of the BPC and who I have not mentioned,
I extend my gratitude.
Finally, I would like to acknowledge the support of colleagues
from my home institution, the University of Massachusettsl
particularly Allen V. Barker, John H. Baker, and Lester F.Whitney for providing letters of reference which helped lead to
this opportunity.
59

ABSTRACT
A wheat (_ritic_ aestivum 'Yecora Rojo') community was grown in
the semi-closed con-ditions of the _KSC Biomass Productlon
Chamber (BPC). Experiments were conducted to determine whole
community carbon dioxide exchange rates as influenoed by growth
and development, carbon dioxide concentration, time within the
photoperiod, irradiance, a_d temperature. Plants were grown at a
population of about 1500/m z using a 20 hour light/4 hour dark
daily regime. Light was supplied by HPS vapor lamps andirradiance was malntained in the range of 590 to 675 _nuol/m2/s.
The temperature regime was 20 C light/16 C dark and nutrients
were supplied hydroponically as a thin film.
Fractional interception of PPF by the community increased rapidly
during growth reaching a maximum of 0.96, 24 days after planting.
This time corresponded to canopy closure and maximum rates of net
photosynthesis (NP). Net daily CO 2 utilization rates were
calculated to day 48 and a 4th order regression equation
integrated to obtain total moles of CO 2 fixed by the community.
This procedure may be useful for monitoring and prediction of
biomass yields in a CELSS.
Results of 5, 1-hour photosynthetic drawdowns of CO 2 during the
photoperiod and from the data log of mass flow injections of CO 2
into the chamber indicated a constant rate of NP during the
photoperiod. Net photosynthesis appeared to be relatively linear
with CO 2 concentration down to about 400 pl_u, suggesting minimal
enhancement of NP by supra-ambient CO 2 concentratlons with the
light regime used. The CO 2 condensation point (CCP) was in the
range of 45 to 55 p_u and was independent of irradiance. Carbon
dioxide exchange rates were related linearly to irradiance up to
750 _nuol/m2/s, indicating that growth was not light saturated.
Light compensation points (LCP_ of the whole co_wjnity were in
the range of 193 to 223 _nnol/m_/s ana did not appear to change
during growth between days 13 and 41. Net photosynthetic rates
for a fully developed canopy were maximized between 16 and 20 C
and dark respiration was minimized at 16 C.
This study resulted in the development of a broad database for
the CO 2 exchange dynamics of a wheat community and will bevaluable in the selection of environmental conditions in future
biomass production efforts for CELSS. The work also demonstrated
the unique research capabilities of the BPC and suggested an
approach to the monitoring and prediction of crop biomass.
V
6O

TABLE OF CONTENTS
Section
I.
1.1
1.2
II.
2.1
2.2
2.2.1
2.2.2
2.2.3
2.2.4
2.2.5
2.2.6
IIl.
3.1
3.2
3.3
3.4
3.5
3.6
IV.
V.
x& a
Introduction
Background
Objectives
Materials and Methods
Description of Production Regime
ExperimentalIrradiance Measurement s
Rates of Net Photosynthesis _qP) and Dark
Respiration (DR)
Diurnal Carbon Dioxide Exchange Rates (CER)
Determination of CO 2 Compensation Point (CCP)Effect of Irradiance on NP
Effects of Temperature on NP and DR
Results and Discussion
Irradiance
Growth and Development
Diurnal Carbon Dioxide Exchange Rates
Carbon Dioxide Compensation Point
Effect of Irradiance on NP
Effects of Temperature on NP and DR
Concluding Remarks
References
61

3-6
¢able
3-1
3-2
LIST OF ILLUSTRATIONS
Irradiance levels under HPS lamps at various locationsin the BPC.
Rates of NP and DR during growth of a wheat community.
Net daily CO 2 utilization rates during growth of awheat _ity.
Daily pattern of CO 2 exchange rates.
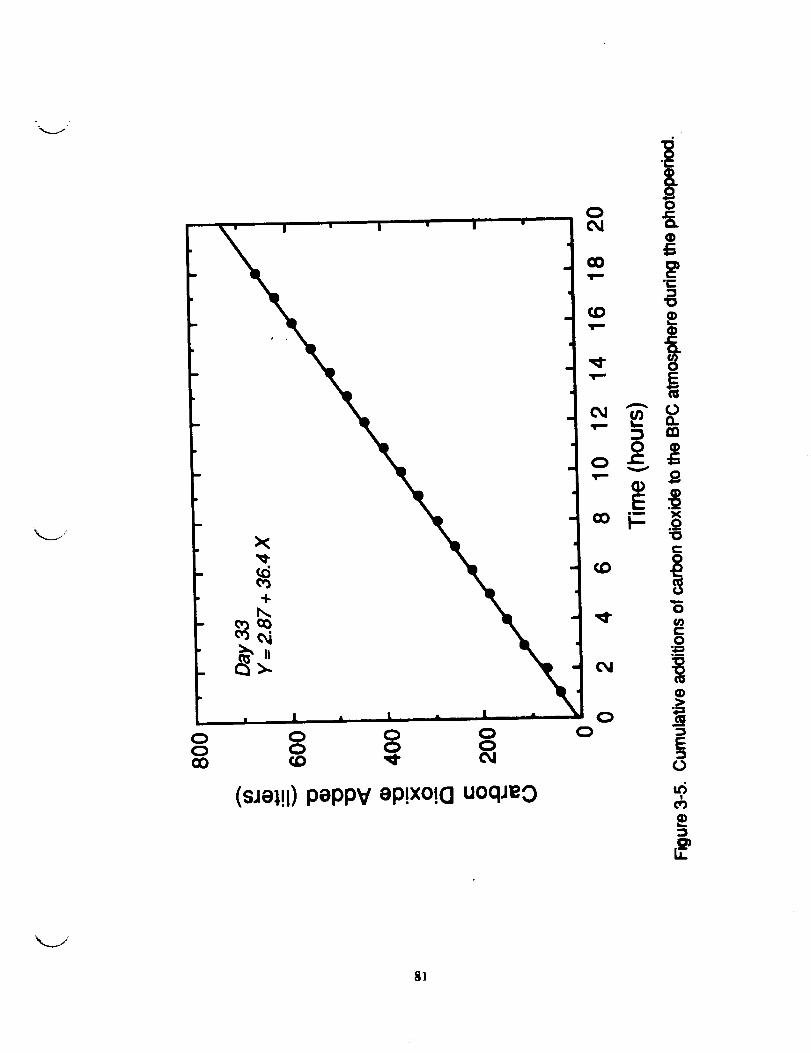
Cumulative additions of CO 2 to the BPC atmosphere
during the photoperiod.
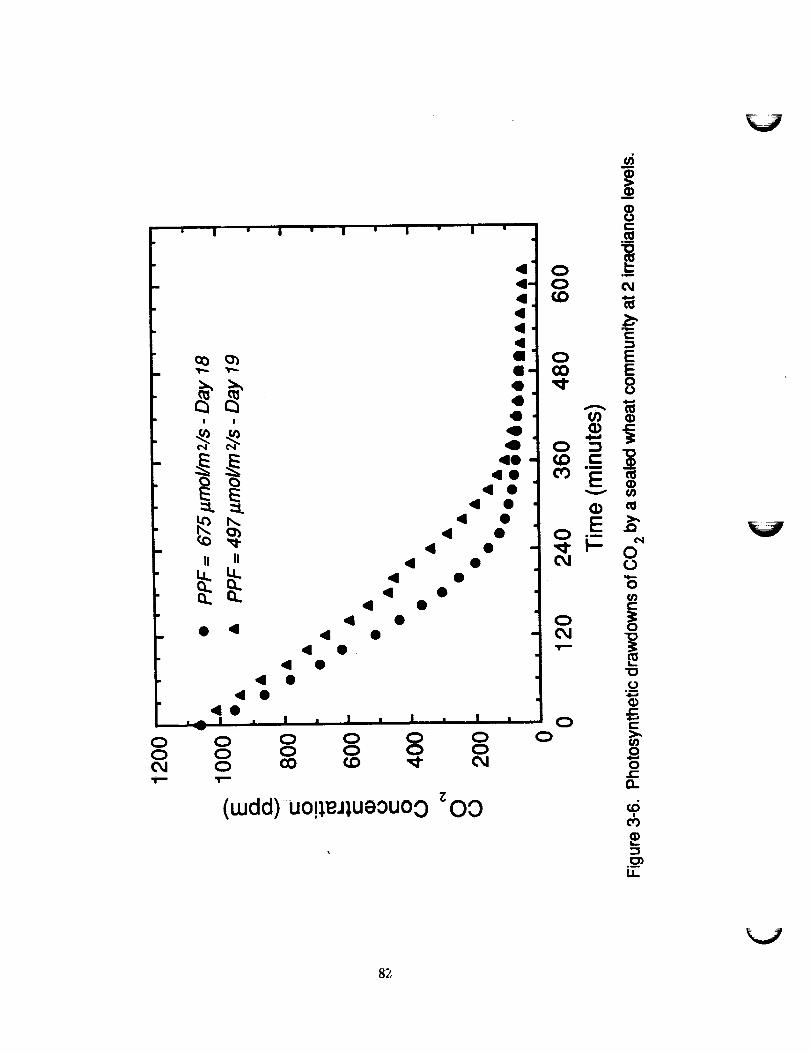
Photosynthetic drawdowns of CO 2 by a sealed wheatcommunity at 2 irradiance levels.
Relationship of CO 2 exchange rate with irradiance.
Effects of temperature on rates of NP and DR.
LIST OF TABLES
Incident (I), tran_tted (T), and reflected (R) PPF
and fractional interception (f) in the BPC during
growth and development of a wheat community.
Light compensation points (LCP) of a wheat community
during growth anddevelopment. See 2.2.5 for
experimental details and calculation procedures.
V
v
62

LIST OF ABBREVIATIONS A_D ACRONYMS
V
BPC
CER
CCP
CELSS
conc
DR
f
HPS
I
I_FJA
LCP
NCU
NP
PAR
PHICS
PLC
PPF
ppmR
RH
T
Biomass Production Chamber
Carbon dioxide Exchange Rate
Carbon dioxide Cca_ensation Point
Controlled Ecological Life Support Systemconcentration
Dark Respiration
fractional interception
High Pressure SodiumIncident PPF
Infra-red Gas Analyzer
Light Compensation PointNet Carbon dioxide Utilization
Net Photosynthesis
Photosynthetically Active Radiation
Plant-Human Integration in Closed Systems
Programmable Logic Controller
Photosynthetic Photon Flux
parts per millionReflected PPF
Relative HumidityTransmitted PPF
63

I. INTRCK)UCTICN
1.1 BACKGROUND
Humans living for long durations on lunar or planetary bases, on
planetary missions, and in space colonies will require the use of
controlled ecological life support system (CELSS) to produce,
process, and recycle biomass (1,2,3). An idealized CEILS would
sustain human llfe indefinitely without the necessity for
materials resupply. Human oxygen and nutritional requirements
would be met by the production and processing of plant biomass.
Carbon dioxide from the respiratory activity of humans and other
heterotrophic organisms would provide the necessary carbon for
photosynthesis while nutritional requirements of plants would be
supplied by recycling of human and plant wastes.
An important step by NASA in the development of a bioregenerative
llfe support system was the initiation of the CELSS BreacB_oard
Project (4,5) which has as its primary goals the design,
construction, and evaluation of systems and techniques for the
production, processing, and recycling of biomass. Implementation
of these goals began with the construction and testing of a pre-
prototype biomass production chamber (6). A hypobaric test
vessel used in the Mercury and Gemini programs was modified and
systecns constructed for heating, ventilation, and air
conditioning (HVAC), lighting, and nutrient delivery (6). In
addition, the BPC was provided with capabilities for the
monitoring and control of atmospheric variables (ten_erature,
relative humidity, and carbon dioxide and oxygen concentrations),
nutrient solution variables (quantity, flow rate, temperature,
pH, and conductivity), and irradiance (PPF).
Currently, the BPC is being tested under semi-closed conditions
for the production of wheat (Triticum aestivmu) and it is planned
that future tests will include other staple crops such as soybean
(_lycine max), Irish potato (Solan_uu tuberosum), and sweet potato
(I_Domeae batata_). A major constraint imposed on these crop
evaluations is that they are conducted in just one experimental
unit. However, relative to studies in conventional growth
chambers, the high degree of environmental control and the large
size of the plant community combine to provide the BPC with the
advantage of a well-integrated sample. Moreover, the BPC has
been designed and constructed to be operated as a closed, nearly
gas-tight system. This characteristic is particularly valuable
for the conduct of short term experiments involving the
monitoring of gas exchange processes as influenced byenvironmental variables.
64

An important aspect of environmental control in a CELSS will be
the monitoring and regulation of atmospheric gases (7) at
concentrations necessary for the maintenance of all life forms.
For example, it is important to know the rate of carbon dioxide
utilization by a crop community under various enviroraaental
conditions so that appropriate designs and control systems for
maintaining oxygen and carbon dioxide mass balances can be
achieved. Major variables that influenc_ the carbon dioxide
exchange rates of plants are temperature, irradianca, and carbon
dioxide concentration. Results of small-scale growth chamber
studies (8,9) can provide the appropriate ranges of these
variables to select for use in communlty-scale studies with the
BPC. The unique capabilities of the BPC can then be used for the
conduct of non-steady state gas exchange experiments with
relatively large crop samples.
1.2 OBJECTIVES
The overall objective of this study was to begin the contruction
of a gas exchange database for wheat grown in a semi-closed
environment. Specific objectives were to determine: a) rates of
net photosynthesis (NP) and dark respiration (DR) during growth
and development, b) influence of irradiance on carbon dioxide
exchange rates, c) carbon dioxide and light compensation points
of the whole community, and d) effects of temperature on net
photosynthesis and dark respiration.
65

2.1
II.
PRODUCTION REGI_
The hard red spring wheat cultivar Yecora RoJo was planted in the
Biomass Production Chamber (BPC) in the Life Sciences SuRport
Facility, Hangar L, Kennedy Space Center (KSC) on May 30, 1989.
Seed presoaked for 30 rain and held _or 4 days at about 3 C, wereplanted at a rate of 1900 to 2000/m L into strips of polyethylene
(white top/black bottom) attached to "T" shaped PVC _rt
pieces crossing the tray tops. Seed were suspended above the
tray bottom by opposing strips. The trapszoidally shaped trayswere 5 cm in depth and each provided approximately 0.25 m_
growing area. Each of the 4 levels in the BI_ contained 16trays, providing a,total growing area of 16 m_ excluding areas
between trays and outside trays where foliage extended during
growth.
Germinating seedlings were covered and maintained in the dark for
2 days following planting at a RH of 90 % and a temperature of 24
C in the BPC. Following an additional 2 days at 24 C, covers
were removed and a daily temperature regime of 20 C light/16 C
dark was used throughout growth and development except for 3, 3-
day spans when temperature was varied. Relative humidity in the
BPC was reduced to approximately 70 % on day 7 and _aintained as
such thereafter. An average stand qf 1488 plants/m L was measured
from a sample of 8 trays following emergence.
The nutrient delivery system consisted of supplying a thin filmof a modified half-strength Hoagland'B (10) solution at a flow
rate of 1 liter/rain/tray. The pH of the nutrient solution was
maintained in the range of 5.8 to 6.2 through automatic
injections of HNO 3 as the pH increased upon crop uptake of NO3--N.
The wheat conmnmity was provided with a daily regime of 20 hour
light/4 hour dark. Lighting during the 20 hour photoperiod was
supplied by high pressure sodi_u (HPS) vapor lamps attenuated
when necessary tR provide an average canopy top irradiance of
about 600 _mol/m_/s •
Carbon dioxide concentration was maintained at 1000 + 50 ppm
throughout growth and development except during daily dark
respiration and photosynthetic drawdown episodes and whenexperimental drawdowns were conducted. Establishment of set-
points, ranges, and timing of events for all BPC subsystem
variables was directed by progr_mmble logic controllers (PLC).
66

2.2 EXPERIMENTAL
_j
2.2.1 IRRADIANCE MEAS_S. Instantaneous photosynthetic
photon flux (PPF) measurements were made at least oncm weekly
using a sunfleck ceptometer (model SF-40, Decagon Devices Inc.,
Pullman, HA 99163). The ceptometer measures irradiance in the
wavelength region of 400 to 700 r_ or photosynthetically active
radiation (PAR). An average of 5 readings from each of the 64
trays was taken in each of 3 positions; 1) upfacing ceptaaeter at
the canopy top, termed the incident PPF (I), 2) upfacing
ceptometer at the canopy bottom or transmitted PPF (T), and 3)
inverted ceptometer at the canopy top, or reflected PPF (R).
Calculations of the fractional interoeption, f, were made from
the following equation using averages of all readings.
f- 1 - T/I - R/I
After 21 days from planting, irradiance levels at the canopy
bottom approached zero and measurements of T were taken from only
4 trays on each level.
2.2.2 RATES OF NET PHOTOSYNTHESIS (NP) AND DARK RESPIRATION
(DR) . Daily determinations of the rates of NP and DR were made
from changes in CO 2 conc in the upper and lower levels of the BPCatmosphere. Carbon dioxide conc was monitored with infra-red gas
analyzers (IRGA) and computer-logged at 4-rain intervals. At 0200
hr each day, the lights were set to turn off and the CO 2 conc in
the BPC increased linearly due to respiratory evolution. At 0600
hr, the CO 2 conc was above the 1000 ppm setpoint, the lights
turned on, and a linear decrease (photosynthetic drawdown) in CO 2conc occurred. Carbon dioxide conc at 20-rain intervals between
0300 and 0500 hr and at 12-rain intervals between 0628 and 0728
were used to obtain slopes of equations fit by linear regression.
Whole community rates of NP and DR were calculated from the
slopes assuming a BPC volmne of 112,060 liters (7). Leak rates
of CO 2 over the short time span from which calculations were made
were assumed to be negligible. A BPC leak rate of 0.417 %/hr was
measured in April, 1989 following the retrofitting of inflatable
door seals (John Sager, personal communication).
On days 44-48, 4 trays representing approximately 6 % of the
total chamber biomass were removed for study of downward rollingof leaves. Data for NP and DR were corrected for the bi_nass
removed during that period by using the factor 64/60 (1.0667).
Calculations of rates of NP for the 20 hr photoperiod and of DR
for the 4 hr period on a whole chamber basis were made to
determine a net daily rate of CO 2 utilization (NP - DR). A
polynomial was fit to the n_t daily rates of CO 2 utilization
(NCU) and the resulting function integrated over time to obtain a
total quantity of CO 2 fixed. A solution to the definite integral
67

was obtained using the Math CAD software program (Mathsoft, Inc.,
Cambridge, MA 02139).
2.2.3 DIURNAL CO 2 EXCHANGE RATES (CER). On day 36,
photosynthetic drawdowns of CO 2 conc were measured during 5 time
intervals of the photoperiod; 0628 - 0728, 1012 - 1112, 1508 -
1608, 2018 - 2118, and 0006 - 0106 (day 37). Linear regressions
were fit to 6 equally spaced points over each 60-rain interval.
Prior to each drawdown, CO 2 conc in the BPC was increased to
about 1200 ppm and the flow valves closed to avoid PLC-directed
injection of CO 2 upon depletion of CO 2 below the 1000 ppm
setpoint. Rates of DR were determined before and after the
photoperiod.
2.2.4 DETERMINATION OF CO 2 COMPENSATION POINT (CCP). On days 18
and 19, the CCP of the wheat commku)ity was approximated at 2
radiance levels (I - 675 ;m_ol/mCls on day 18 and I = 497 _mol//s on day 19). This was achieved by closing the CO 2 injection
flow valves, and allowing the BPC CO 2 conc to decline. The
barrier separating the upper and lower levels of the BPC was
removed to facilitate mixing of gases in the entire chamber.
Carbon dioxide drawdowns were conducted until the rate of CO 2decrease approached zero. on day 19, one of the flowmeters for
CO 2 injection was slightly open and a period of injection
occurred when the CO 2 conc was below 500 ppm. In handling this
data, a 90 rain segment of CO 2 conc data was spliced out in order
to approximate the time-dependent drawdown pattern.
2.2.5 EFFECTS OF IBBADIANCE ON NP' On days 13, 20, 27, and 41,
irradiance was varied by dimming the HPS lamps to provide 5
irradiance levels. At the start of the experiment, BPC 002 conc
was increased to approximately 2000 ppm and then allowed to
change for 1 hr at each irradiance. Carbon dioxide conc at 8 rain
intervals for a 32 min time span near the midddle of each PPF
drawdown event was used in calculations of CER. Measurements of
incident PPF for each irradiance level were made for all 64 trays
the day after the experiment. Light compensation points for the
community were calculated (x-intercept) from the linear
regressions of CER vs. PPF.
2.2.6 EFFECTS OF _ERATURE ON NP AND DR. On days 21 - 23 and
41 - 43, temperature of the BPC was varied. For each 3-day
experiment, temperature was set at 24 C for day 1, 20 C for day
2, and 16 C for day 3. Rates of NP and DR were calculated as
described previously.
2.2.7 MASS FLOW MEAS_S. Data logged for a cumulative
record of CO 2 injected into the BPC was retrieved and used to
calculate NP during uninterrupted times when the chamber was
sealed. Calculations of NP from mass flow data were compared
with those made from drawdown measurements.
V
V
68

III. RESULTS AND DISCUSSION
3. I IRRADIANCE
Irradiance incident at the canopy top was maintained between 590
and 675 pmol/mL/s throughout growth and development (Table 3-1).
As the wheat plants increased in height, it was necessary to
alter the dimming levels of the light banks in order to remain
within this range. Sharp decreases in the irradiance transmitted
to the bottom of the canopy (T) and reflected (R)at the top of
the canopy occurred after day 9. During this rapid growth phase
of the wheat community there was a near doubling in the
fractional interception (f) of PPF by the canopy. Canopy closureoccurred after about 3 weeks as indicated by f values of 0.94 to
0.96. After 24 days, transmitted PPF declined to negliglble
levels and remained negligible until day 42. It is anticipated
that both transmitted and reflected PPF will increase during
senescence of the canopy.
Table 3-1. Incident (I), transmitted (T), and reflected (R)
PPF and fractional interception (f) in the BPC during growth
and development of a wheat commmln£ty.
DAYS AFTER PPF (maol/m2/0) ab
PLANTING I T R f
9 628 + 44 317 + 28.0 104 + 11.2 0.34
11 665 + 42 173 + 22.0 46 + 5.5 0.67
14 675 + 47 66 + 9.0 26 + 2.1 0.86
17 675 + 30 37 + 2.6 13 + 2.9 0.93
21 620 + 27 5 + 0.6 30 + 2.0 0.94
24 659 + 33 2 + 0.7 27 + 1.3 0.96
28 610 + 17 ND _ ND
31 601 + 28 1 + 0.5 22 + 0.5 0.96
36 590 + 30 1 + 0.5 26 + 3.3 0.96
42 616 + 42 1 + 0.5 36 + 9.8 0.94
aValues represent the means of 4 levels + 1 standard deviation.bND=no data.
3.2 GROWTH AND DEVELOPMENT - NP AND DR
Wheat seedlings became photosynthetically competent 6 days after
planting. At this stage it was possible to obtain photosynthetic
drawdown rates fo110wing the dark respiration period. The rate
of NP increased sharply up to about 15 days and then remained in
69

the range of 30 to 35 ):mol/m2/s for about 3 weeks, followed by a
gradual downward trend up to day 48 (Figure 3-2). Rates of NP
reported herein from whole community CO 2 drawdowns are comparable
to those reported for single leaf blades (11). The trend fo_ _ _
rates of dark respiration early in development was similar to
that observed for rates of NP. After 2 weeks the rate of DR
remained relatively constant. During the interval of days 6 to
14, day-to-day variability in rates of NP and DR were low.
Subsequent fluctuations in the daily rates are attributable to
the conduct of temperature experiments (days 22-24 and days 42-
44), changes in canopy geometry (growth) with respect to
lighting, and periodic adjustments in lamp output to maintain a
relatively uniform level of canopy top irradiance throughout
growth.
Maximum daily rates of CO 2 utilization (35 mol/_/day)
occurred between 3 and 4 weeks after planting (Figure 3-3). The
equation fit to the data in figure 3-3 is:
Y -39.912 + 10.129 X 0.496 X 2 + 0.010331 X 3 0 000079541 X 4
R2 : 0.881.
This equation can be integrated to obtain the total moles of CO 2
fixed by the entire wheat community. Solving the definite
integral of the above equation between days 6 and 48 yields a
total CO_ fixed of 1,202 moles or 52.9 kg. Ass_g that 1 moleof CO 2 y_elds 1 mole of CH20, then 52.9 kg of CO 2 should yield
36.1 kg of carbohydrate (12). Upon obtaining a complete growth
and development data set, this procedure may be used in
conjunction with data on ash and total N as percentages of dry
weight to predict total comity biomass.
A gradual downward trend in NP (Figure 3-2) is expected to occur.
However, a gradual decrease in NP may be accompanied by a sharp
increase in DR as the plants senesce leading to a large decrease
in the daily net fixation of carbon dioxide.
3-3 DI_ PATTERN OF CARBON DIOXIDE EXCHANGE RATES
A question that arose from usingmorningphotosynthetic drawdown
rates of CO 2 as a measure of the daily rate of NP was the
following. How representative of the daily rate was a 1 hr
segment of CO 2 conc changes obtained at the beginning of a 20 hr
photoperiod? Measurements of NP obtained from the beginning and
end of the photoperiod and 3 intermediate times revealed some
variation in the rate of NP computed in this manner, but not
enough to discern any diurnal pattern in the rate (Figure 3-3).
The regions of the dotted lines represent presumed extrapolations
of the data. Actual plant reponses could differ only slightly
from these extrapolations. The absence of a distinct diurnal
pattern in NP for plants grown at constant irradiance and angle
V
7O

of incidence on the canopy contrasts with photosynthetic
responses of plant canopies receiving o_ly solar radiation, since
the angle of incidence and the intensity of solar radiation
varies throughout a day.
Further evidence to claim a relatively constant rate of NP was
obtained from mess flow data logged d_ri_ a complete photoperiod
when the BPC doors remained sealed (Figure 3-4). The rate of NP
calculated from the slope of the line presented in Figure 3-4 was
420 _ol/chamber/s as compared to a rate of 467 _ol/chamber/s
obtained from the morning photosynthetic drawdown data. The
disparity between the two methods of calculating rates of NP mayderive from several sources. First, the leak rate of _rbon
dioxide from the chamber over a period of 18 hours used in the
mess flow method of calculation could cause a significant errorin the measurement. This should lead to an overestimate of the
true rate. 14_wever, the drawdown coat_ation method yielded a
higher value for NP and therefore suggests that other factors
contribute to the disparate measurements. Another possibility is
the variability _ IRGA measurements used to obtain the drawdowndata. The IRmA subject to drift and needs to be calibrated on
a frequent basis to ensure consistency in the daily absolute
values of CO 2 conc. Such instrument _iability should he randomand result in times when the mass flow method yields higher orlower measurements of the rate than the drawdown method. This
contention was confirmed by comparison of data sets from other
days and it was concluded that factors contributing to the
disparity between methods tmre of a random nature.
3-4 CARBON DIOXIDE COb_ENSATION POINT
Photosynthetic drawdowns of C02 at PPF values of 497 and 675
_mol/m L/s were linear to co 2 concentrations below 400 ppm,
suggesting that C02 enrichment above ambient levels has a minoreffect on the rate of NP of a wheat community at these
irradiances and stage of development (Figure 3-6). However, it
will be necessary to repeat this experiment, perhaps at a higher
irradiance, to test this possibility.
The discontinuity in the presentation of the data for the 497 PPF
treatment represents the time splice explained in section 2.2.4.
The rate of CO 2 consumption was irradiance-depend_nt, but the CCPwas irradiance-independ_nt as indicated by the convergence of the
two data sets after about 6 hours. The plateau portion of the
plot approximates the CCP to be between 45 and 55 ppm which
agrees with values reported previously for wheat and other C3plants (13). This range may be a slight overestimate of the CCP
due to the long time required to ensure a complete drawdown.
Such extreme drawdowns represent possible scenarios in a CELSS
where atmospheric gas control systems may, on occasion, not be
altered in response to significant changes in the proportions of
71

CO2 evolved and utilized, or when resources (e.g. CO 2 supply,energy) become limiting and appropriate modifications must bemade.
Additional CCP data obtained from complete drawdowns will need to
be conducted unc_r different temperature regimes and perhaps
lower oxygen concentrations to broaden this database since CCP
has been reported to be teq0erature- and oxygen- dependent
(13,14,15,16). Nhile decreased oxygen conc for C 3 plants such aswheat should improve photosynthetic efficiency by decreasing
photorespiratory carbon loss, it would probably not be feasibleto lower the partial pressure of oxy_an in a CELSS with humansbelow about 0.15 atm, unless there was sufficient gas tight
partitioning of human and plant atmospheres.
3-5 EFFECT OF IRRADIANCE ON NP
Carbon dioxide exchange rate2was linearly related to PPF up tothe approximately 750 }_mol/m /s limit used during the 4 separate
irradiance experiments. An example of the results of one (day41) of these experiments is presented in Figure 3-7. Irradiance
levels used in this study were well below the light saturation
levels suggested by growth responses measured at higher
irradiances by Bugbee and Salisbury (9) and as summarized by
Larcher (17).
Following canopy closure (about 20 days), there was an increase
in the light coq_Lnsation points (LCP) of the whole wheat
community (Table 3-2).
Table 3-2. Light compensation points (LCP) of
a wheat community during growth and development.
See 2.2.5 for experimental details and calculations.
V
DAYS _PLANTING LCP (_oi/c/mmber/s)
13 209
20 193
27 229
41 223
Since fractional light interception by the canopy did not
increase after about 20 days (Table 3-I), it would be expected
that light would eventually become limiting considering thatirradiance was nonsaturating and that continued increases in
biomass were taking place. In general, the whole community LCP
values reported here are substantially higher (about 5-fold) than
72

Jv
those reported for single flag leaves (11) or those assumed forwheat in growth experiments (9). It is expected that a community
LCP would be higher than that measured for single leaves or
plants exposed to a higher irradiance than the average irradiance
recieved by all leaf surfaces in a dense canopy.
Additional determinations of LCP later in development will need
to be made to determine if changes occur during grain fill and
S_.eS_ce •
3-6 EFFECTS OF TEMPERATURE aN NPANDDR
Net photosynthetic rates for the 6-week old canopy was lowest at
the highest temperature (24 C), but decreased when the
temperature was lowered from 20 C to 16 C (Figure 3-8),
suggesting an optimum temperature between 16 and 20 C for NP.The rate of DR increased with increasing temperature. The net
daily rates of carbon dioxide utilization wore 28.6, 29.6, and
22.6 mol CO2/c/mmber/day for 16, 20, and 24 C, respectively. At
16 C, the rate of DR is decreased more than the rate of NPrelative to 20 C, which explains the small difference between the
2 temperatures in the daily rate of C02 utilization. Consideringthis minor difference in carbon-fixation, it maybe more
economical from the perspective of energy efficiency to use 16 C
as a growth temperature for wheat in a CELSS. It will also be
important to conduct similar temperature experiments at different
stages of development to determine if the sammtrend is observed.
k_/
73

IV. CONCLUDINGRm_U_KS
The biomass production chamber served as an exoe_lleh_ pre"
prototype CELSS test chamber for making determinations of the
rates of carbon dioxide exchange of a wheat community as
influenced by envirornental variables. Mhen sealed, carbon
dioxide exchange studies in the BPC may be conducted in a non-
steady state mode whereby CO 2 injection is prevented, or in a
quasi-steady state mode whereby 002 injections are made tomaintain near constant concentrations. In the quasi-steady state
mode, absolute quantities of CO 2 injected can be used tocalculate assimilation rates. The non-steady state mode allows
rapid determinations of 002 utilization and evolution ratesfollowing alterations in environmental variables.
The whole community gas exchange responses mea_ in the BPC
are judged to be more representative of crop responses thanstudies involving single leaf or single plant measurements.
Daily measurements of NP and DR enable constant monitoring of
crop 'activity' and may furthermore be used to estimate crop
biomass at any stage of development using straightforward
analytical techniques. Similar gas exchange studies conducted in
the BPC with other crops selected for C__LSS should provide
valuable databases. However, the constraints of one experimental
unit and the time _quired for conducting these studiesnecessitates judicious selection of variables and treatments.
An additional avenue of research t_t _ould be purstled durin_
the BPC crop evaluations is the acquisition of gas exchange datafor an integrated system of plants and h_nans. Plant-human
integration in closed systems (PHICS) will enable experimental
human ratings of the test chamber and also will serve to cross
verify measurements of gas exchange rates of each biotic
component measured in isolation.
k_/
74
f

k_/
V. REFERENCES
1. Salisbury, F.B., B.G. Bug_e, and D.L. Bubenheim. 1987. Wheat
production in controlled environments. Adv. Space Res. 7: 123-132.
2. Salisbury, F.B. and B.G. Bugbee. 1988. Space farming in the
21st century. 21st Century Science & Tech. i (I): 32-41.
3. Olson, R.L., M.W. Oleson, and T.J. Slavin. 1988. CELSS foradvanced manned mission. HortSclenoe 23: 275-286.
4. MacElroy, R.D. and J.Bredt. 1984. Current concepts and future
direction in CELSS. In NASA Conf. Pub. 2378. Life Support Systems
in Space Travel.
5. Prince, R.P., W.M. Knott, S.E. Hilding, and T.L. Mack. 1986.
A 'breadboard' biomass production chamber for CELSS. Amer.
Astronautical Society, 33rd Annual Meeting, Boulder, CO. AAS-86-338.
6. Prince, R.P., W.M. Knott, J.C. Sager, and S.E. Hilding. 1987.Design and performance of the KSC Bicmass Production Chamber.
Soc. Auto. Engin. Tech. Paper Set. No. 871437.
7. Sager, J.C., C.R. Hargrove, R.P. Prince, and W.M. Knott.
1988. CELSS atmospheric control system. Amer. Soc. Agric. Eng.
Paper No. 88-4018.
8. Tibbitts, T.W., D.C. Morgan, and I.J. Warringon. 1983. Growth
of lettuce, spinach, mustard, and wheat plants under four
combinations of high-pressure sodium, metal halide, and tungsten
halogen lamps at equal PPFD. J. Amer. Soc. Hort. Sci. 108: 622-630.
9. Bugbee, Bruce G. and Frank B. Salisbury. 1988. Exploring the
limits of crop productivity. Plant Physiol. 88: 869-878.
10. Hoagland, D.R. and D.I. Arnon. 1950. The water culture
method for growing plants without soil. Calif. Agr. Expt. Sta.Circ. 347.
11. Araus, J.L., L. Tapia. 1987. Photosynthetic gas exchangecharacteristics of flag-leaf blades during grain filling. Plant
Physiol. 85: 667-673.
12. Holt, D.A., R.J. Bula, G.E. Miles, M.M. Schreiber, and R.M.
Peart. 1975. Environmental physiology, modeling and simulation of
alfalfa growth. T. Conceptual development of SIMBD. Purdue
University, West Lafayette, IN, Agricultural Experiment StationResearch Bulletin 907 ."•
75

13. Bykov, O.D., V.A. Koshkin, and J. Catsky. 1981. Carbon
dioxide compensation concentration of C3 and C4 planti_dependence on temperature. Photosynthetica 15: 114-121.
14. Smith, E.W., N.E. Tolbert, and H.S. Ku. 1976. Variables
affecting the CO 2 compensation point. Plant Physiol. 58: 143-146.
15. Dvorak, J. and L. Natr. 1971. Carbon dioxide coa_sation
points of Triticum and _ species. Photosynthetica 5: 1-5.
16. Gerbaud, A. and M. Andre. 1980. Effect of C02, 02, and lighton photosynthesis and photorespiration in wheat. Plant Physiol.66: 1032-1036.
17. Larcher, W. 1980. In: Phvsioloaical _ _. 2nd. ed.,
Ch. 3: Carbon utilization and dry matter production. 303 pp.
76

\ J
I
• • m
_ _ ,q- C_I
(s/zw/1owfl) -Idd
o _ "_
Q0 a. _
I-(.0
0 .,-:o eb
2
E
77

V
0
0
i " | "
| ! , | |
0 0CO O_
SlzWlZO0 IowTI
I
0
0_o ._
0
• - 00
o
Q)
78

O
°¶ 0 _
, I , ' " I • • _ :I_Z
_ep/Jeqweqo/IOW _-
79

V
• ! • U " | " " II "
_ullgglwlmolelluUmlmw_mwllllllmgq IllulmBlllmllmo O W
-,,,,,I
F>
0
•- _- 0 0 0 _-"I i
(Jq/Jeqweqo/lOW)eleEl e6ueqox3 ep!xo!cl uoqJeO
E
I:3.
_>,
a
q)
=3
Li.
80
o _ _ o0 0aO C.D _
(sJe_!l)peppy ep!xo!cluoqJeo
8]
V
|
•,.,,.,.i" I111 o'!I_ _
: 0° 4
_:2;; !' "-' I • I I i I i I • I
C) >-in0 0 0 0 0 00 0 0 0 0 0
(wdd) u0BeJ],Ue0U00 zO0
.9.o0(.-
O.
os
LI_
8B

v
(s/Jeqweqo/IOWd)eleEI e6ueqox3 ep!xo!c] uoqJeo
83

0
slJeqLueqol_O0 IOtUTI
8_