n91-i 699 - nasa · n91-i 699 the effect of windshear during takeoff roll on aircraft stopping...
TRANSCRIPT
N91-I 699THE EFFECT OF WINDSHEAR DURING TAKEOFF ROLL
ON AIRCRAFT STOPPING DISTANCE
Terry Zweifel
Sperry Commerical Flight Systems Group
Honeywell, Inc., Phoenix, Arizona
3 February 1988
ABSTRACT
A simulation of a Boeing 727 aircraft during acceleration
on the runway is used to determine the effect of windshear on
stopping distance. Windshears of various magnitudes, dura-
tions, and onset times are simulated to assess the aircraft
performance during an aborted takeoff on five different runway
surfaces. A windshear detection system, active during the
takeoff roll and similar to the Honeywell Windshear Detection
System is simulated to provide a discrete to activate aircraft
braking upon shear detection.The results of the simulation indicate that several fac-
tors affect the distance required to stop the aircraft. Nota-
ble among these are gross weight, takeoff flap position, run-
way characteristics, and pilot reaction time. Of the wind-
shear parameters of duration, onset and magnitude, magnitude
appears to have the most significant effect.
INTRODUCTION
Low-level windshears have proven to be one of the most
significant threats to aircraft safety. Several aircraft
accidents have been directly attributed to the phenomenon,
and, as a result, considerable progress has been made in the
understanding of the atmospheric mechanisms, methodology of
detection, and the control of the aircraft's flight path dur-
ing a shear encounter.
The research has also resulted in the development of sev-
eral on-board systems which have been certified by the FAA and
are currently in use. These systems have proven effective in
detecting the presence of a windshear and, in at least two
cases, have been instrumental in the successful escape from anencountered windshear.
One aspect of the windshear problem which has not been
adequately addressed, however, is the effect of windshear on
the aircraft during takeoff roll: the time between the initial
acceleration of the aircraft on the runwav and ] tit off. Sev-
eral cases of windshear encounters durina the takeoff roll are
known, the most notable being the incident of United Airlines
Flight 663 at Stapleton International Airport on May 31, 1984.
In this instance the aircraft, a Boeing 727, encountered the
_:_.
549 _ :_i6.=_
https://ntrs.nasa.gov/search.jsp?R=19910002386 2018-11-30T13:15:13+00:00Z
localizer antenna located 1074 feet (327 m) beyond the depar-
ture end of the runway. Fortunately, no injuries occurred,
but substantial damage was done to the aircraft.
If • flight crew is aware of a windshear condition prior
to obtalmlmg the critical engine failure speed, Vl, they may
elect to either abort the takeoff or to continue on through
rotation and lift off V is thus a "go,no-go" speed which is
generally determined by tAe aircraft's ability to stop within
the remaining runway distance. V 1 is defined as a calibrated
airspeed and thus differs from the actual ground speed of the
aircraft by the magnitude of the wind. Consequently, the
attainment of V l in a windshear condition does not necessarily
assure that the aircraft can be safely stopped on the runway
since the ground speed, and hence the kinetic energy of the
aircraft, can be significantly higher than normal. The addi-
tional kinetic energy of the aircraft may result in a substan-
tial increase in the required runway to safely stop the air-
craft should the flight crew elect to abort the takeoff.
If the windshear is detected after obtaining Vl, thetakeoff must be continued in most cases as the available run-
way to stop the aircraft is usually insufficient.
This paper addresses the problem of windshear occurring
during takeoff roll by simulating an aircraft in various mag-
nitudes, durations, and onset times of windshears, at differ-
ent aircraft weights, and on different runway surfaces.
SIMULATION CONFIGURATION
A Boeing 727 aircraft was simulated on an Epson Equity
III+ computer as a three degree of freedom model with an
effective one-quarter second computational rate. Lift and
drag were computed from curve fits of actual aircraft data
with the assumption made that angle of attack, alpha, is con-
stant during the ground roll. Ground effect on lift and dragwere included in the simulation.
Thrust was computed from curve fits of Thrust/Delta versus
Mach number for a fixed takeoff engine pressure ratio (EPR).
The engines simulated were Pratt and Whitney JT8D-15 engines
To simulate engine spool down, a simple lag filter was uti-
lized. Engine thrust reversers were not simulated.
The lift and drag effect of ground speedbrakes was simu-
lated with the assumption that the ground speedbrakes achieve
maximum deployment within 1 second.
The aircraft's antiskid system was simulated by assuming
60% efficiency in achieving the maximum coefficient of fric-
tion available for the runway surface.
Five runway surfaces were simulated: (a) dry surface; (b)
wet, grooved asphalt; (c) wet, grooved concrete; (d) wet, tex-
tured asphalt; and (e) wet, textured concrete. The dry sur-
face coefficient of friction was applicable to either asphalt
550
or concrete. Coefficients of friction were derived from curve
fits of available data and are shown on Figure 7.
Windshear models available were a linear horizontal shear
and a vortex microburst model. The former was used for the
simulation runs since it allowed more precise control of shear
onset, magnitude, and duration.
The runway altitude was sea level for all cases and the
ambient temperature assumed to be standard day, 59 degrees F
(15 degrees C). The runway was assumed to have zero slope.
No explicit pilot model was necessary as braking is done
by the antiskid system; however, recognition delays were
incorporated to approximate pilot response. For all runs
except those directed at pilot recognition time, the delay
used was I second.
AIRCRAFT CONFIGURATION
The simulated flap setting for most takeoffs was 15
degrees, the most common setting for this aircraft. Aircraft
weight could be varied, but, as might be expected, the heavy
weight aircraft was most severely affected by the shears. To
achieve worst case conditions, the aircraft weight was set at
210,000 pounds (95254 Kg). Other runs, not included in this
paper, were conducted at 140,000 pounds (63503 Kg) and 175,000
pounds (79378 Kg).
SIMULATION RUNS
The aircraft was initialized at the end of the runway with
full takeoff power set and brakes applied. At the start of
the run, the brakes were released and the aircraft allowed to
accelerate.
The simulated runway was infinitely long to preclude the
complexity of altering aircraft weight and flap setting to
produce a balanced field length. In this way, the worst case
aircraft weight could be used throughout the runs.
_" To provide baseline data in no shear conditions, an
aborted takeoff was performed when the aircraft achieved V I.
Following the recognition delay, the thrust was reduced to
idle, the ground speed brakes deployed, and the antiskid sys-
tem activated to provide braking. The total runway used thus
provided a baseline value for comparing the effect of a wind-
shear.
RUNWAY SURFACE TYPES
As windshears may or may not be accompanied by rain, it is
important to assess the aircraft's performance on both dry and
wet runways. A wet runway is assumed to have from 0 to .5
inch ( 1.27 cm) of standing water. The type of runway surface
551
can also have significant effects on braking performance.
Consequently, the studies used grooved and textured asphalt
and concrete runways. For convenience, mnemonics were used
for the runway types according to Table i:
Table 1
Mnemonic Runway Surface
DRY
GVD ASPH
GVD CONC
TEX ASPH
TEX.CONC
Dry Asphalt or Concrete
Wet, Grooved Asphalt
Wet, Grooved Concrete
Wet, Textured Asphalt
Wet, Textured Concrete J
EFFECT OF FLAPS ON STOPPING DISTANCE
The flight crew's selection of takeoff flaps significantly
alters the amount of runway required to stop the aircraft. The
total runway required to accelerate the aircraft to V 1 and
then come to a complete stop using the available takeoff flap
settings for the Boeing 727 is shown on Figure I.
Clearly, the flap setting of 25 degrees provides the minimum
runway usage. This is primarily because V 1 for 25 degrees of
flaps is significantly lower than the others. Consequently,
the aircraft achieves V 1 with lower runway usage and also has
a lower kinetic energy.
However, consideration must be given to aircraft perfor u
mance once airborne in the event the flight crew elects to
continue the takeoff. For the Boeing 727, for example, a flap
setting of 15 degrees is preferred for airborne performance
_nd consequently, 15 degrees should be used as a compromise
between stopping distance and airborne performance.
As the incremental runway distance between a flap setting
of 5 degrees and 15 degrees is significantly more than that
between flap settings of 15 and 25 degrees, one must conclude
that a flap setting of 5 degrees for takeoff should not be
used if windshear is suspected.
EFFECT OF WINDSHEAR ONSET
To assess the effect of shear onset time on stopping dis-
tance, a constant shear of 5 knots per second (2.57 m/sec/sec)
was introduced at specified points as the aircraft acceler-
ated. The shear, once started, was of infinite duration.
Upon detection and recognition of the shear, the takeoff wa_
552

aborted. As can be seen in Figure 2, the total runway used in
most cases was less than or equal to the distance for the no
shear case. The times on the Figure indicate the time of
shear onset as measured from initial brake release.
In the cases where shear onset occurred slightly before
obtaining V I speed, the total runway usage was increased, but
not dramatically so.
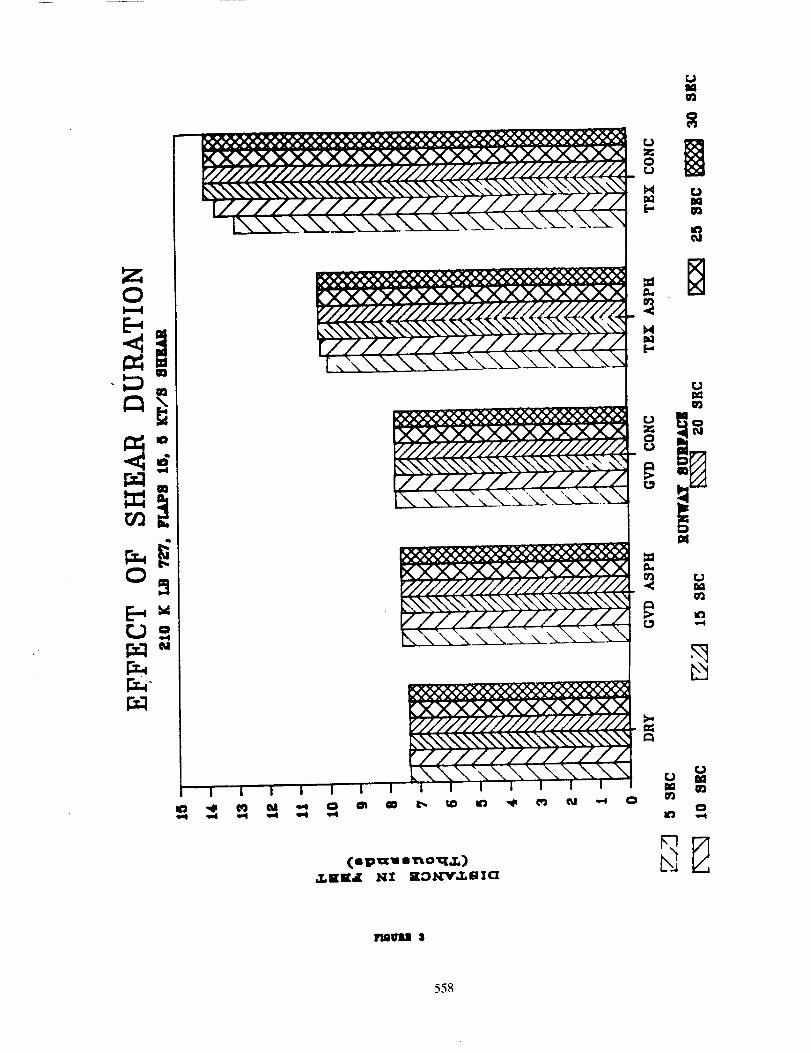
EFFECT OF WINDSHEAR DURATION
The effect of the duration of several shears of different
magnitudes was investigated to determine the increase in total
runway used in coming to a complete stop. In each case, the
onset of the shear was at approximately 10 knots before V 1
speed. Figure 3 illustrates the results. The ordinate axis
yields the total runway used in thousands of feet. The magni-
tude of the shear used was 5 knots per second. For the dry
runway or wet, grooved runways the additional runway used is
virtually independent of shear duration.
For the wet, textured asphalt or concrete runway, notice-
able increases in runway used are evident. However, once the
duration of the shear exceeds 15 seconds, the total runway
used is approximately constant, leading one to conclude that
shear duration is not a prime consideration except on texturedsurfaces.
EFFECT OF WINDSHEAR MAGNITUDE
A series of runs was conducted in which the shear onset,
detection, and reaction coincided with attaining V I. After
onset, the shear was sustained indefinitely. Figure 4 illus-
trates the results of the simulation runs. The ordinate axis
gives runway distance in thousands of feet.
The data indicate that shear magnitude is not of prime
concern for the dry or wet, grooved surfaces. Significant
increases in total distance used are evident in the wet, tex-
tured surfaces, however.
EFFECT OF UNDETECTED WINDSHEARS
As of the time of this writing, no on-board system is
available that will detect a shear during takeoff roll,
although one such system is now in the certification process.
Conseg_ently, At is left to the flight crew to determine
whether or not a windshear is present during takeoff roll. Thedetection of such shears can be difficult since the aircraft
is accelerating and the shear may be accompanied by turbu-
lence. I_ the simulation runs, the magnitudes of the shears
were intentionally made small to simulate shears that might go
unnoticed by the flight crew. The onset of the shears occurred
approximately 10 knots before v I speed and the shear was then
553

maintained indefinitely. When the aircraft achieved V l speed,
it was braked to a full stop and the total runway used noted.
A graph of total runway used versus shear magnitude is shown
on Figure 5. Undetected shear magnitudes of 2 knots per sec-
ond or less have profound effects on the total runway used,
particularly for the heavy weight aircraft. This is a
consequence of shear causing a low air mass acceleration
which, in turn, causes V 1 speed to be achieved much further
down the runway than normally.
EFFECT OF PILOT RECOGNITION
To assess the effect of a recognition delay in reacting to
a detected shear condition, simulation runs were made with
reaction delays of 0, I, 2, 3, 4, and 5 seconds. The results
of the runs are shown on Figure 6. In these cases, a 5 knot
per second infinite shear began at V I. The reaction time
represents the number of seconds between detection of the
shear and the pilot reaction of reducing thrust, braking, and
deploying the ground speed brakes. As can be seen, the
effects are dramatic, particularly for the longer delay times.
On the average, about 4% more runway is used for each addi-
tional second of delay, regardless of the surface type.
CONCLUSIONS
The data indicate that flap setting, runway surface type,
and pilot recognition time are all prime factors in determin-
ing total runway used. A worst case scenario for this air-
craft would be heavy gross weight with 5 degree takeoff flaps
on a wet, textured concrete runway. A long recognition time
further aggravates the situation.
Consequently, one may conclude that the largest possible
takeoff flap setting consistent with good airborne performance
should be used. For the 727 aircraft, this is a flap setting
of 15 degrees.
Timely pilot recognition and reaction to a windshear con-
dition on takeoff should and can be reenforced by simulator
training. As mentioned above, approximately 4% more runway is
used for each second of pilot reaction time. It is difficult
to overemphasize the necessity for rapid response to a wind-
shear condition, particularly if the takeoff is to be aborted.
It is interesting that windshears occurring on dry; wet,
grooved asphalt; and wet, grooved concrete runways have such a
small effect on braking performance. With a shear magnitude
of 5 kt/sec occurring at Vl, typical increases in requireddistance were of the order of I%.
The effect of ungrooved runway surfaces, however, is sig-
nificant. A 5 kt/sec shear encountered at V 1 increases the
total runway usage by almost 12% for a wet, textured concrete
surface. The corresponding number for the asphalt runway is5.4%. It should be noted also, however, that an aircraft on a
554
wet, textured concrete runway requires about 46% more distanceto stop even without a windshear than would be needed if the
runway surface were dry.The effect of shear onset and shear duration did not
appear to seriously affect the aircraft's braking performance.Of the detected shears, shear magnitude seemed most signifi-
cant in terms of braking distance.
Undetected shears resulted in large increases in runway
required - up to 56%. However, it is unlikely that the pilot
would elect to abort in these cases. It is also unlikely that
a low level shear would be sustained for long periods of time.
The simulations did provide an indication of the importance of
shear detection on the runway, however.
It is important to note that the effect of Windshear
Detection System delays were not included in the analysis.
Detection delays due to computation and filtering can add
appreciably to the total runway used in a windshear condition.
The effect of the delays is comparable to the pilot reaction
delays discussed in the paper: for each second of delay time,
up to 4% more runway may be required to stop the aircraft.
555

(op_t s _o_,.T.,),I,111[,4 KZ O:RR_ _Y4L_Zl_ "1_.I,0.T-
556

!0
<
_/////////////////////,_,.\\\\\\\\\\\\'__:
- f_YTY-2k3_
•V/////////////////////Z@_,.\\\\\\\\\\\\'_
l_x;<xxxxxxxxxN_///////////////////////,
k.3_
[XXXXXX_ XXXXXXx_///////_Y/////////////,
H///I\
J I I J ' J l l i I I " I J l J I I Ik'_
aO I_ I0 I_ NI, (PJ Oi -.4 0 C/t O0 _ lO i_ _P _) c_l _ o
(Ipll i 'i_I_I.1.)2,EE.[ _TI GEIIA .t.YJi_ "rv'_o,z,
r..1
r_ r_Im
r.j
O2
(=_=l
lmlmm |
557
r..__
r._
x3_xxxx_(._
r/////////////////
M///////////////////////A
/////,////////
/////./////.///
9"///////////////////////,,_",,._\\\\\\\\\\\\\\\\\\',e."////////////, \\._'\\\\',..\\\\
I I I I I I
(:ip_ " no_,Z,)
8
uu
o
558

!
r_r_r_
LX OOOOO<XXXXXX
/////////J_Z_L/ / /. . ("./
[XXXXXXXXXXXXXXX
[///////////////
IXXXXXXXXX._-XXXXK/////X //2_2"//d _4_ _ 2Z_/.//////.
V///// / _ _//'//
:xxxxxxxx'xx, xxxx9"/////d ///., _/. z/.,4/_, 9///////.
"/_,LL/J_/Z./_,( / / / /I I I I I I -i I I I Ill l I
rIO_lL8 •
O2\
Gdl
559

U
N
r/,+-,-...- , , i. i ,/,-i,-i. -l.{l,///I/ll/_'Ti-/t//.il i "i. ", . . l.._,/.,/.,l_i_ ." "" ," " "
V//////////////J///
_xxxx _
_/1//// /////__W_/L
- r{///,,,'/././././/././
PIll////.,x/X///
_/////////////////////////_k.\\\"__",,\"_,_ M\\\",.\\\\'_
V///////////k\\\\"\\\\\\',x\
I I i I I I I I i I i I i I ! i I I I
p_
FTIITLI I
560

E-,
I,-,,-I
IQ
i i , ,
KXXXXXX_XXXX)v'l_/f ///llz"f l_x,,'/./ll_
V/I/I/I/I////////////
IK_XXXXXXXXXXXX2
V//////////.
)<XXXXXXX"///I///////////_,',.\\\\'x\\\\\\\\_/!/////,4
¢:1
02
o
(ll 1I)_:i'l II il o _.,i,)
,Z, IEIE_r liZ C:ZS_8_ ._._"_M.L_ "Z'vvr.o:r.
IPitlllllll ii
561