na, mg, ni and cs distribution and speciation after long...
TRANSCRIPT
Available online at www.sciencedirect.com
www.elsevier.com/locate/gca
Geochimica et Cosmochimica Acta 73 (2009) 2283–2298
Na, Mg, Ni and Cs distribution and speciation afterlong-term alteration of a simulated nuclear waste glass:
A micro-XAS/XRF/XRD and wet chemical study
Enzo Curti a,d,*, Rainer Dahn a, Franc�ois Farges b,c, Marika Vespa a,1
a Laboratory for Waste Management, Paul Scherrer Institut, CH-5232 Villigen PSI, Switzerlandb Museum National d’Histoire Naturelle, 61 rue Buffon, 75005 Paris, France
c Department of Geological and Environmental Sciences, Stanford University, Stanford, CA 94305-2115, USAd Helmoltz Virtual Institute ‘‘Advanced Solid-Aqueous RadioGeochemistry”, Germany
Received 10 July 2008; accepted in revised form 27 January 2009; available online 20 February 2009
Abstract
Microscopic distribution and speciation of Na, Mg, Ni and Cs in a simulated (inactive) nuclear waste glass were studiedusing micro X-ray fluorescence (l-XRF) and micro X-ray absorption spectroscopy (l-XAS), after aqueous leaching during12 years at 90 �C. Na and Mg are major constituents of the glass that can be used to determine the progress of the glass cor-rosion process and the nature of secondary alteration phases. Ni and Cs represent dose determining long-lived radionuclides(59Ni, 135Cs) in vitrified nuclear waste.
The Na-Mg l-XRF maps revealed that the core regions of the glass fragments are apparently unaltered and composition-ally homogeneous, whereas rims and interstitial spaces are enriched with Mg-rich smectite formed during the leaching process.The micro X-ray absorption near edge structure (l-XANES) spectra collected at the Mg K-edge in the altered zones showthree sharp resonances typical for crystalline Mg-silicates. These resonances are distinctive of Mg occupying undistorted octa-hedral positions. In contrast, the l-XANES spectra collected in the core zones of the glass fragments lack this resonance pat-tern and are identical to the spectra measured on the pristine (unleached) MW glass.
Micro extended X-ray absorption fine structure (l-EXAFS) and l-XANES analyses at the Ni K-edge revealed three dis-tinct Ni(II) species: (a) Ni uniformly distributed in the glass matrix, (b) micro-inclusions with high Ni concentrations and (c)Ni associated to the Mg-clay. The comparison with reference spectra of unleached MW and other Ni-bearing silicate glassesindicated that species (a) represents the original coordinative environment of Ni in the glass. The l-EXAFS analyses revealedthat species (b) is structural Ni in trevorite (NiFe2O4), which probably formed through unmixing processes during the coolingof the glass melt. The l-EXAFS of species (c) could be successfully modeled assuming specific adsorption or incorporation ofNi into the lattice of trioctahedral Mg-clay minerals. Alternative models assuming other elements (Ni, Al, Fe) in addition toMg in the second shell could not be fitted successfully.
Aqueous concentration data were used to calculate the speciation of the leaching solutions. Saturation index (SI) calcula-tions indicate undersaturation with respect to NiCO3 and NiSO4�7H2O, but oversaturation with respect to b-Ni(OH)2. Thelatter result is probably due to the omission of Ni borate and Ni silicate complexes in the speciation calculations, for whichformation constants are not available. With the help of estimation techniques, we could infer that such complexes would dom-inate the Ni speciation and consequently reduce the SI below the saturation of b-Ni(OH)2.
0016-7037/$ - see front matter � 2009 Elsevier Ltd. All rights reserved.
doi:10.1016/j.gca.2009.01.032
* Corresponding author. Address: Laboratory for Waste Management, Paul Scherrer Institut, CH-5232 Villigen PSI, Switzerland. Fax: +4156 310 28 21.
E-mail address: [email protected] (E. Curti).1 Present address: Flemish organization of scientific research (FWO), Dutch-Belgian beamline, European Synchrotron Radiation Facility,
38041 Grenoble Cedex 9, France.

2284 E. Curti et al. / Geochimica et Cosmochimica Acta 73 (2009) 2283–2298
The l-XRF maps show that Cs is uniformly distributed in the MW glass, since no region with high Cs concentration couldbe detected. The Cs LIII-edge l-XAS spectra were all very similar independently of the degree of alteration, indicating similarcoordination environments of Cs in the core regions of the glass as well as in the secondary clays. These spectra largely differfrom that measured for pollucite (a potential secondary Cs-phase in altered glasses) implying that the coordination environ-ments of Cs in the MW glass and in pollucite are fundamentally different.
The present study shows that l-XRF and l-XAS are essential tools in determining the fate and the retention mechanismsof radionuclides released from nuclear waste during aqueous alteration. Our spectroscopic analyses allowed us to exclude for-mation of specific Ni and Cs secondary solids (e.g. nepouite, b-Ni(OH)2, pollucite) during the aqueous alteration. Ni and Csare instead distributed as trace elements in the alteration phases formed by major elements during the leaching process. Ourresults imply that solid solution and/or adsorption equilibria, rather than pure phase solubility equilibria, are the adequatechemical models to determine Ni and Cs aqueous concentrations in performance assessments for radioactive wasterepositories.� 2009 Elsevier Ltd. All rights reserved.
1. INTRODUCTION
Reprocessing and vitrification is a widely accepted op-tion in the strategy followed by many countries to guaran-tee the safe disposal of nuclear high-level waste (HLW). Forinstance, the US, Belgium, Germany, France and Switzer-land are planning to dispose vitrified waste in deep under-ground repositories sites hosted in appropriate geologicalformations (Witherspoon and Bodvarsson, 2006). Accord-ingly, safety analyses for such repositories must take intoaccount glass alteration processes in risk assessment calcu-lations. Understanding and quantifying the dissolution ofvitrified nuclear waste is an essential step in such calcula-tions, since radionuclide release from the glass will affectall subsequent steps in the prediction of radiological doses.Usually, radionuclides are assumed to be released congru-ently from the glass, up to elemental solubility limits de-fined through saturation equilibria. The limiting solids aretypically simple phases, e.g. hydrous oxides, carbonates orsulfates of the specific radionuclide (Nagra, 2002).
However, most actinides and fission products, even ifconcentrated in the nuclear waste, are trace elements com-pared to major elements like Al, Si, Mg, Fe and will hardlyprecipitate as pure radionuclide phases. More likely, theywill either co-precipitate as solid solutions with alterationphases dominated by major elements, or will be adsorbedon their surfaces. Both retention mechanisms will normallyprevent aqueous concentrations from reaching the satura-tion of the pure radionuclide solids. As a consequence,safety assessment calculations may be over-conservativeand predict exceedingly high release rates for specificradionuclides.
The investigated borosilicate glass (denoted ‘‘MW”) isone of two reference formulations for reprocessed high-le-vel radioactive waste from Swiss nuclear power plants. Itcorresponds to the specifications of British Nuclear FuelLtd. (BNFL), one of two official contractors in charge ofthe vitrification of Swiss high-level waste. The MW glassis a typical borosilicate glass containing about 6 wt%MgO and a number of chemical analogues (particularlylanthanides) replacing radioactive trivalent and tetravalentactinides. The second contractor (COGEMA, France) pro-duces a glass (SON68) of similar composition but Mg-free,the Mg being replaced by an equivalent amount of
Ca + Zn. A previous investigation focusing on the long-term dissolution kinetics and aqueous chemistry of bothglasses showed that the glass dissolution rates of the MWglass are about ten times faster than for the SON68. Thisresult was ascribed to the presence of Mg in the MW glass,which is supposed to accelerate the glass degradation byfavoring the formation of secondary clays (Curti et al.,2006).
In the present study, we focus on the micrometer-scalemobilization and the retention mechanisms of Ni and Csin the MW glass after alteration in pure water at 90 �Cduring 12 years. The nuclides 59Ni and 135Cs contributesignificantly to the predicted overall dose in the Swisssafety assessment, partly as a result of the high solubilitylimits assumed in the performance assessment calculations:3.1 � 10�5 M for Ni, based on the assumption of satura-tion with Ni carbonate, and unlimited solubility for Cs(Nagra, 2002). A major goal of this study was to identifythe solubility-limiting secondary host phases for Ni and Csin the altered MW glass and to shed light on their coordi-native environment, both in the intact glass and in the sec-ondary alteration products. To this aim, we used advancedX-ray techniques with high spatial resolution, notably mi-cro X-ray diffraction (l-XRD), micro X-ray fluorescence(l-XRF) and micro X-ray absorption spectroscopy (l-XAS).
In addition to Ni and Cs, spectroscopic measurementswere conducted also for Mg and Na. Mg was investigatedas a key major element of the glass alteration products,whereas Na served to distinguish between altered and intactglass. Such distinction was possible because Na is leachedout from the glass prior to any other element through selec-tive leaching, a process by which H3O+ ions diffuse into theglass and exchange for Na+ (Vernaz and Dussossoy, 1992;Wicks et al., 1993). Therefore, sodium provided a conve-nient marker of the spatial extent of the corrosion processand allowed determining the penetration depth of thehydration front into the glass.
Micro-spectroscopic investigations could not be carriedout on the second Swiss reference glass composition(SON68) because of the nanometric size of the secondaryalteration phases (cf. Curti et al., 2006). The beam size ofthe X-ray microprobes used in the present investigationwas too large for such small particles.

Long-term alternation of nuclear waste glass 2285
2. EXPERIMENTAL AND MODELING PROCEDURES
2.1. Sample preparation, characterization and aqueous
chemistry
The MW glass was crushed and sieved to collect thefraction <160 lm. The glass powder was then washed withethanol in an ultrasonic bath, decanted and dried at roomtemperature. Five 24 g aliquots of the washed powder wereintroduced in airtight stainless steel vessels and leached stat-ically at 90 �C in 600 ml of distilled water. At corrosiontimes of 5.7 and 12.2 years, two experiments were inter-rupted in order to collect the leaching solution for elementalconcentration analyses and the altered glass for the spectro-scopic and mineralogical investigations. The wet glass wasseparated from the aqueous solution and stored at 100%humidity in a refrigerator (T = 0–10 �C). Prior to use forspectroscopic investigations, the altered glass was washedwith distilled water in order to remove the interstitial solu-tion and finally dried in the oven at 40 �C during 24 h. Dueto the prolonged alteration, the glass grains and the corro-sion products coalesced to form a mm-thick crust on top ofthe loose powder (Fig. 1). The crust was cut transversally,embedded in epoxy resin and prepared as 30 lm-thick pol-ished thin section for optical microscopy and l-XRF/XASinvestigations. The transversal cut allowed us to study avertical profile of the altered glass crust from top (crust–bulk solution interface) to bottom (crust- loose glass pow-der interface). The composition of the unleached MW glassis (in wt%): SiO2 = 46.7, B2O3 = 16.0, Na2O = 8.5, Al2O3
= 6.6, MgO = 5.9, Li2O = 3.9, REE2O3 = 3.4, Fe2O3 =3.1, MoO2 = 1.4, ZrO2 = 1.4, Cs2O = 1.1, Cr2O3 = 0.6,BaO = 0.5, NiO = 0.4, minor oxides = 0.5.
Immediately after removing the vessels from the oven,an aliquot of the aqueous solution was sampled, acidifiedwith 10 ll of concentrated HNO3 (Merck� Suprapur) andanalyzed by Atomic Emission Spectroscopy (ICP-AES) todetermine the aqueous concentrations of a number of ele-ments. For Ni and Cs, a second aliquot was centrifugedduring 1 h at 95,000 g. The supernatant was separatedand analyzed by ICP-AES together with the non-centri-
Fig. 1. SEM image of the altered MW glass, showing glass grains(GL) enveloped and cemented by flaky aggregates of corrosionproducts (CP), mostly clay minerals.
fuged aliquot. An additional solution sample was transferredin a glove-box flushed with N2 for pH measurement at roomtemperature (23 ± 1 �C). All aqueous concentration dataand pH measurements are reported in Table 1a. Errors as-signed to the ICP-AES analyses correspond to instrumentaluncertainties, which range from ±10% to ±30% dependingon the difference between measured concentration and ele-mental detection limit.
2.2. Aqueous speciation and saturation index calculations
Since many details of the kinetic data and wet chemicalanalyses collected for the MW glass were presented in anearlier publication (Curti et al., 2006), only a brief summarywill be given here with focus on the results directly relevantto the spectroscopic investigations. One of the main objec-tives of the ICP-AES analyses was to determine, throughspeciation calculations, saturation indices (SI) of potentialalteration phases.Table 1b and c report the calculated aque-ous speciation and saturation indices of simple solids forthe leaching solution collected after 12.2 years alterationtime.
The speciation calculations were carried out with theMINEQL code (Westall et al., 1976), using the Nagra-PSI01/01 thermodynamic database (Hummel et al. 2002; Thoe-nen and Curti, 2004) and Davies’ approximation for thecalculation of activity coefficients and ionic strength. Twoseparate Ni speciation calculations were carried out for atotal Ni concentration of 1.5 � 10�7 mol/l (centrifugedsample). The first relies exclusively on the thermodynamicdata selected in the Nagra-PSI 01/01 database, the secondadditionally includes estimated formation constants forsimple Ni borate and Ni silicate complexes (see Section4.4 for a discussion).
2.3. Data collection and reduction
The l-XRF maps were obtained by collecting the fluo-rescence signal emitted from the sample within appropriate(element-specific) energy windows. Element distributionmaps were generated by scanning the sample (stepwise orcontinuously) under a monochromatic X-ray beam. Ni-Ka
and Cs-La maps were collected at beamline 10.3.2, Ad-vanced Light Source (ALS), Berkeley, USA (Marcuset al., 2004) using beam sizes of about 5 � 5 lm. The fluo-rescence radiation was recorded in air using a 7-elementsGe solid state detector. Mg-Ka, Na-Ka and additional Cs-La l-XRF maps were obtained at beamline LUCIA, SwissLight Source (SLS), Villigen, Switzerland (Janousch et al.,2004; Lagarde et al., 2007) under mild vacuum and with abeam size of about 4 � 8 lm. The fluorescence signal wasdetected using a single element silicon drift diode. Sampleareas of up to 1000 � 1500 lm were probed using X-rayenergies of 1310 (Na and Mg), 5020 (Cs) and 10,000 eV(Ni).
The l-XAS spectra at the Ni K-edge (8333 eV) and atthe Cs LIII-edge (5012 eV) were collected for the alteredglass sample and selected reference compounds on beamline10.3.2 (ALS) using a Si(111) crystal monochromator.Moreover, l-XANES spectra at the K-edge of Mg

Table 1Ionic strength, pH, elemental concentrations (a), speciation (b) and saturation index calculations (c) for the MW glass leaching solutionsampled after 12 years corrosion time. The saturation index (SI) is defined as the decimal logarithm of the ratio of ion activity product (IAP)to thermodynamic solubility product (Ko
s) of the listed dissolution reactions. A two-term approximation (Van’t Hoff equation) was applied toderive solubility products at 90 �C, using the reported reaction enthalpies.
Elemental concentrations, ICP-AES (mol/l)
Measured Detection limit Measured Detection limit
(a)
Al (1.3 ± 0.2) � 10�4 2 � 10�7 Na (2.1 ± 0.3) � 10�2 5 � 10�7
B (6.5 ± 0.7) � 10�3 5 � 10�6 Nd (7.6 ± 0.8) � 10�6 1 � 10�7
Ba (6.3 ± 0.6) � 10�7 4 � 10�10 Ni (2.9 ± 0.3) � 10�6 5 � 10�8
Ca (2.2 ± 0.3) � 10�6 3 � 10�7 Ni� (1.5 ± 0.5) � 10�7 5 � 10�8
Ce (6.1 ± 0.6) � 10�6 4 � 10�8 P (3.4 ± 0.4) � 10�5 2 � 10�6
Cr (1.4 ± 0.2) � 10�4 5 � 10�8 Pr (2.3 ± 0.2) � 10�6 1 � 10�7
Cs (4.8 ± 0.5) � 10�5 4 � 10�7 S (8.1 ± 0.8) � 10�5 2 � 10�6
Cs� (3.8 ± 0.4) � 10�5 4 � 10�7 Si (4.7 ± 0.5) � 10�3 9 � 10�7
Fe (1.1 ± 0.1) � 10�5 2 � 10�7 Sm (9.3 ± 1.0) � 10�7 1 � 10�7
K (4.1 ± 0.4) � 10�4 2 � 10�7 Sr (1.4 ± 0.2) � 10�6 6 � 10�10
La (2.6 ± 0.3) � 10�5 1 � 10�8 Th <Detection limit 1 � 10�7
Li (2.9 ± 0.3) � 10�2 1 � 10�6 U <Detection limit 1 � 10�7
Mg (9.0 ± 0.9) � 10�5 3 � 10�8 Y (1.1 ± 0.1) � 10�6 3 � 10�9
Mn (2.6 ± 0.3) � 10�7 5 � 10�9 Zn (1.1 ± 0.1) � 10�7 4 � 10�8
Mo (6.9 ± 0.7) � 10�4 1 � 10�5 Zr (6.9 ± 0.7) � 10�6 6 � 10�8
pH and ionic strength (I) Inorganic carbon*
I 0.053 mol/l C(tot) 1.0 � 10�5 mol/l
pH (90 �C) 9.1 Calculated pCO2 6.7 � 10�7 atmpH (23 �C) 9.6 Measured CO3
2� 1.5 � 10�6 mol/l
Major species (mmol/l) Ni species (mol/l)
Ni species No Ni-B/Si complexes With Ni-B/Si complexes
(b)
Li+ 29.0 Si(OH)4,aq 1.9 Ni+2 1.5 � 10�8 5.5 � 10�10
Na+ 20.6 SiO(OH)3� 2.7 NiPO4
� 2.0 � 10�8 7.2 � 10�10
K+ 0.4 OH� 0.8 NiOH+ 1.1 � 10�7 4.1 � 10�9
B(OH)3,aq 19.7 MoO42� 0.7 NiBO(OH)2
+ — 1.0 � 10�7
B(OH)4� 45.3 HPO4
2� 0.02 NiSiO(OH)3+ — 4.4 � 10�8
Reaction data and SI calculationsa
Reaction log Kos (25 �C) DrH
om (kJ/mol) log Ko
s (90 �C) log IAP (90 �C) SI (90 �C)
(c)
b-Ni(OH)2(cr) + 2H+ = Ni2+ + 2H2O 10.5 �59.934 8.62b 9.85 1.2
8.41c �0.2c
NiCO3(cr) = Ni2+ + CO32� �11.2 63.930 �9.20 �14.45 �5.3
�15.88c �6.7c
NiSO4�7H2O(cr) = Ni2+ + SO42� + 7H2O �2.267 12.167 �1.89 �12.83 �10.9
�13.88c �12.0c
BaCO3(cr) + H+ = Ba2+ + HCO3� 1.767 �11.961 1.39 �2.94 �4.3
BaSO4(cr) = Ba2+ + SO42� �9.97 26.575 �9.14 �11.12 �2.0
SrCO3(cr) + H+ = Sr2+ + HCO3� 1.058 �16.576 0.54 �2.58 �3.1
SrSO4(cr) = Sr2+ + SO42� �6.632 �4.339 �6.77 �10.75 �4.0
Mg(OH)2(cr) + 2H+ = Mg2+ + 2H2O 16.84 �113.386 13.28 13.19 �0.1
MgCO3(cr) + H+ = Mg2+ + HCO3� 2.041 �45.819 0.60 �1.28 �1.9
MnCO3(cr) + H+ = Mn2+ + HCO3� �0.801 �20.884 �1.46 �3.68 �2.2
FeCO3(cr) + H+ = Fe2+ + HCO3� �0.561 �25.278 �1.35 �2.74 �1.4
FeSO4�7H2O(cr) = Fe2+ + SO42� + 7H2O �2.209 20.536 �1.57 �10.91 �9.3
Al(OH)3(cr) + 3H+ = Al3+ + 3H2O 7.756 �102.784 4.53 4.27 �0.3Al2Si2O5(OH)4(cr) + 6H+ = 2Al3+ + 2Si(OH)4 + H2O 7.435 �147.7 2.80 3.11 0.3MoO3(cr) + H2O = MoO4
2� + 2H+ �12.055 33.02 �11.02 �21.66 �10.6
SiO2(cr) + 2H2O(l) = Si(OH)4,aq �3.746 20.647 �3.10 �2.72 0.4SiO2(am) + 2H2O(l) = Si(OH)4,aq �2.714 14.594 �2.26 �2.72 �0.5
ZrO2(cr) + 4H+ = Zr4+ + 2H2O �1.9 10.845 �1.56 1.68 3.2
* Calculated assuming initial water equilibrated with air and subsequent closure of the vessel.� Supernatant after centrifugation.
a Thermodynamic data from Hummel et al. (2002) except italicized values (from Gamsjager et al., 2005).b Value consistent with logKo
s (90 �C) = 8.4 ± 0.3 derived from the experimental data of Gamsjager et al. (2002).c logIAP and SI values calculated assuming formation of Ni silicate and borate complexes.
2286 E. Curti et al. / Geochimica et Cosmochimica Acta 73 (2009) 2283–2298

Long-term alternation of nuclear waste glass 2287
(1303.0 eV) and additional l-XAS spectra at the Cs LIII-edge were recorded on the same glass sample and on se-lected reference compounds at the LUCIA beamline, usingpairs of beryl crystals (for Mg and Na K-edge measure-ments) and Si(111) crystals (for the Cs LIII-edge measure-ments). All l-XAS spectra were collected in fluorescencemode.
Reduction and modelling of the l-XAS data was per-formed with the ATHENA/ARTEMIS package (Raveland Newville, 2005). The statistical parameters used toevaluate the goodness of the EXAFS fits were the multiplecorrelation coefficient (R-factor) and the reduced v2 (chi-square) as calculated by ARTEMIS. The R-factor measuresthe misfit between modeled and experimental Fourier trans-formed (FT) spectra, whereas v2 expresses the same misfitscaled to the estimated data uncertainty and to the numberof free fit parameters (for rigorous definitions, see Beving-ton, 1969; Downward et al., 2007).
Energy conversion to wave vector units (A�1) was car-ried out by assigning the origin (E0) to the first inflectionpoint of the absorption edge. The monochromator angleat the 10.3.2 beamline was calibrated using a Ni metal foil(E0 = 8333 eV). At LUCIA, energy calibration for the berylcrystals was made by matching a NaCl (halite) referencespectrum measured during the beam time to the data ofNeuville et al. (2004) (Epeak_b = 1076.5 eV). For theSi(111) crystals, the K-edge inflection point of metallicAg (E0 = 3351 eV), which was brought on the sample inthe form of tiny orientation marks, was used. Fitting andmodelling of the Ni-K EXAFS spectra were carried outwith FEFF 8.20 (Rehr et al., 1991) using the XRD struc-tures of talc (Gruner, 1934) and trevorite (Subramanyam,1971) as starting models. Radial structure functions(RSF) of the Ni K-edge l-EXAFS spectra were obtainedby Fourier transformation (FT) of the k3-weighted v(k)functions over the range of 1.9-12.4 A�1 (location A2)and 1.9-11.2 A�1 (location T2) using a Kaiser–Bessel win-dow and a smoothing parameter of four. Multishell fit anal-yses were carried out in the range of 1.0–3.5 A (preliminarymodel) and of 1.0–5.0 A (refined model) for location A2. Arange of 1.0–6.0 A was set for the spectrum measured atlocation T2.
At the Cs LIII-edge, attempts to model the EXAFS spec-tra were unsuccessful due to the interference with the BaLIII-edge at E � E0 � 230 eV, which limited the usable k-range for the FT to 7 A�1. For the Mg spectra, a l-XANESanalysis was carried out through comparison with adequatereference spectra. EXAFS was not possible due to the inter-ference of the Al K-edge at 1560 eV.
Mineralogical investigations included X-ray diffractionmeasurements with conventional powder diffraction andwith a focused synchrotron beam, as well as scatteringand transmission electron microscopy (SEM, TEM). Themicro-analytical data obtained from the TEM measure-ments and the conventional powder diffraction data are de-scribed in detail elsewhere (Curti et al., 2006). Micro X-raydiffraction measurements were performed in transmissionmode on dry, altered MW glass powders at beamline10.3.2 (ALS) using a 14 keV beam of 5 � 5 lm size and aBruker CCD camera to detect the diffracted beam. Experi-
mental parameters, such as sample-detector distance anddetector plane orientation, were refined using the diffractionimage of a-Al2O3 reference powder. The two-dimensionaldiffraction images were then converted to 1-dimensional lat-tice plane distance (d) vs. intensity diagrams using theFIT2D package (Hammersley, 1995).
3. RESULTS
3.1. Aqueous chemistry
The calculated aqueous speciation (Table 1b) is complexdue to the large number of elements present in the glass.The leaching solutions are dominated by species of the sol-uble elements B, Li and Na, which also determine the ionicstrength. The pH remained remarkably constant (9.6 ± 0.2at 23 �C) during the entire duration of the experiment, ow-ing to the buffering capacity of the boric acid/borate system(pKa = 9.2). In the first Ni speciation calculation, basedexclusively on selected thermodynamic data (i.e. neglectingthe possible formation of Ni borate/silicate complexes),NiPO4
�, Ni2+ and particularly NiOH+ are the major Nispecies, whereas in the second calculation Ni borate andNi silicate complexes dominate.
Saturation indices were calculated using solubility prod-ucts and reaction enthalpies from Gamsjager et al. (2005)and Hummel et al. (2002) for a number of simple solids(Table 1c), including b-Ni(OH)2(cr), NiCO3(cr) and Ni-SO4�7H2O(cr). Other potentially relevant Ni solids werenot considered because either the solubility products wereunreliable or the available thermodynamic data insufficientfor an extrapolation to 90 �C. Our SI calculations indicatestrong undersaturation with respect to Mo(VI) oxide andall considered sulfate and carbonate minerals, including Ni-CO3(cr) and NiSO4�7H2O(cr). Strong oversaturation wasfound with respect to b-Ni(OH)2 and crystalline ZrO2,whereas the remaining minerals are all close to saturation(�0.3 6 SI 6 0.4). These results will be further commentedlater (Sections 4.4 and 4.5).
It is important to realize that the computed saturationindices critically depend on the thermodynamic data usedfor the prevailing Ni complexes, as these directly affectthe activity of the free Ni2+ ion (aNi2þ ).The formation con-stant and reaction enthalpy used for NiOH+, logKo
s
(25 �C) = �9.5 and DrHo
m = 51.8 kJ mol�1, can be consid-ered to be reliable as they practically coincide with the val-ues selected in a recent comprehensive review of Nithermodynamic data published by the Nuclear EnergyAgency (NEA) (Gamsjager et al., 2005). In contrast, thethermodynamic data used to calculate the concentrationsof Ni borate and silicate complexes have high uncertainties,since they were derived through empirical estimation tech-niques (Section 4.4).
Another important issue is related to the fact that mostSI were computed using ICP-AES data obtained from non-centrifuged solutions. Thus, except for Cs and Ni, we can-not rule out the possibility that the determined aqueousconcentrations are biased by the presence of colloids. Con-sequently, in cases where SI > 0 is calculated, solutionsmight in reality be undersaturated with respect to the solid

2288 E. Curti et al. / Geochimica et Cosmochimica Acta 73 (2009) 2283–2298
of interest. The presence of colloids in the leaching solutionwas indeed detected (compare Ni and Cs concentrations ofnon-centrifuged and centrifuged solutions in Table 1A). Onthe other hand, whenever undersaturation is calculatedusing concentration data of non-centrifuged solutions (asfor the large majority of the tested solids), the results are va-lid a fortiori because the real dissolved element concentra-tion would be even less than indicated by the ICP-AESmeasurements.
3.2. l-XRD investigations
Conventional X-ray diffraction measurements on the al-tered MW glass powder obtained in a previous study (Curtiet al., 2006) yielded reflections matching the powder diffrac-tion patterns of saponite, hectorite and montmorillonite,indicating that the major corrosion product of the alteredMW glass is a smectite.
Other Mg-rich clay minerals can be excluded based onthe interlayer spacing. The obtained value of 13.2 A is typ-ical for smectites with a single layer of interlayer water(Meunier, 2005), whereas palygorsite, sepiolite and vermic-ulite have well defined, either smaller or larger interlayerspacings (10.4 ± 0.1, 12.2 ± 0.2 and 14.2 ± 0.2 A, respec-tively). Moreover, these minerals generate additionalimportant reflections that are not detected in the powderdiffraction pattern of the MW glass sample.
In the present study, l-XRD data at lower d-spacings(d = �1.4–2.2 A) were obtained with a microfocused14 keV beam, revealing a number of additional reflections.Although most of them could be attributed to montmoril-lonite, at least two prominent reflections cannot be assignedto smectite minerals (Fig. 2). Our analysis revealed that thethree most intense reflections match the major lines in themagnetite–trevorite series (FeIIFeIII
2O4–NiIIFeIII2O4).
Thus, these results indicate the presence of a Ni-rich spinelphase in the investigated MW glass sample.
Fig. 2. Raw l-XRD pattern obtained from the magnetic fractionof the altered MW glass powder, compared with the indexedreflections of trevorite (bold) and montmorillonite (normal type-face, italicised). Only the most intense reflections contributing to agiven peak have been indexed for montmorillonite.
3.3. l-XRF investigations
Selected l-XRF elemental distribution maps of the MWglass sample are shown in Fig. 3. Fig. 3a is a two-color mapshowing Na (red) and Mg (green) distributions. The mapreveals the granular structure of the glass powder and pro-vides insights into the nature of the alteration process. Theorange-colored areas represent glass regions with uniformNa and Mg concentration, whereas the green-colored areasat the periphery of the glass fragments and partially fillingthe interstitial space are Mg-rich, but Na-depleted. Thedark areas are domains of low mineral density. Since Nais rapidly leached out during the aqueous alteration of sili-cate glasses via alkali-proton exchange (Wicks et al., 1993),the interface between orange and green areas marks thereaction front of the glass corrosion reaction. Thus, the or-ange areas represent pristine glass apparently unaffected bythe corrosion process, whereas the green-colored areas rep-resent altered regions. In a previous TEM study (Curtiet al., 2006), the altered zone was found to consist domi-nantly of Mg-rich smectites that envelope and partly ce-ment the glass grains (see also Fig. 1).
Fig. 3b and c are l-XRF elemental distribution maps ofNi and Cs, respectively, over the areas corresponding to theinserts shown in Fig. 3a. Whereas the Cs distribution withinthe glass grains appears to be fairly uniform (the variationsin intensity are smooth and can be ascribed to thickness orillumination effects), the Ni map reveals the presence of tiny‘‘hot spots” (10 lm max.) with high Ni concentration (e.g.white spot at location T2).
The l-XRF maps thus provide the structural–morpho-logical information necessary for selecting appropriatelocations for the l-XAS investigations, owing to the heter-ogeneity of the sample. For instance, they make it possibleto select spots within regions of apparently unaltered glassand within Mg-rich corrosion products. In many cases, l-XAS spectra of Mg, Ni and Cs could be collected at exactlythe same location, allowing inter-elemental correlations.
3.4. l-XANES investigations at the Mg K-edge
In Fig. 4a, normalized Mg K-edge l-XANES spectrafrom the altered MW glass are compared with experimentalspectra of reference compounds, including a spectrum col-lected on a pristine, unleached sample of the MW glass(top spectrum denoted ugl). The probed spots, shown onthe l-XRF maps of Fig. 3, can be divided into two distinctgroups: Those labelled C1, C2, . . . (‘‘set 1”) were measuredin the apparently unaltered core regions of the glass frag-ments (the orange-colored regions in Fig. 3), whereas thespectra labelled A1, A2, . . . (‘‘set 2”) were collected in theperipheral zones rich in alteration products (the green-col-ored regions in Fig. 3, mainly Mg-clay particles). Fig. 4areadily shows distinctive features in the Mg K-edge l-XANES spectra from the two mentioned domains. Thespectra at locations C1 and C2 (‘‘set 1”) are fairly smoothand show little structure, whereas the ‘‘set 2” spectra (A1,A2, A3) are characterized by three sharp resonances withinthe main absorption peak (labelled A–C), followed by twoadditional weak oscillations (D and E). Spectrum C3 has

Fig. 3. (a) Bicolor map of the combined Na-Ka and Mg-Ka fluorescence signals with locations and labeling of spots probed with l-XASmeasurements. The color coding given in the insert RG map represents relative Na and Mg concentrations in the sample. (b) Ni elementaldistribution map corresponding to the insert area (solid line) shown in Fig. 3a. (c) Cs elemental distribution map corresponding to the insertarea (dotted line) shown in Fig. 3a. The color scale bars indicate I0-normalized count rates.
Long-term alternation of nuclear waste glass 2289
features intermediate between the two sets of data, suggest-ing that a mixture of unaltered glass and corrosion productswas probed at that location.
A further look at Fig. 4a shows that the spectra collectedin the altered region (‘‘set 2”) are strikingly similar to thoseof diopside, glaucophane, talc and of the clay mineralslizardite and montmorillonite. Following spectral features
Fig. 4. Mg K-edge l-XANES (a), Ni K-edge l-XANES (b) and Ni Kugl = pristine, unleached MW glass, A1–A5 = altered regions of leachedglass, T1–T2 = Ni-rich micro-inclusions in leached MW glass. Mineralizardite; glc, glaucophane; grd, grandidierite; olv, olivine; nep, nepouite;nullaginite; aqs, Ni(NO3)2 aqueous solution.
characterize the ‘‘set 2” spectra: (a) the resonant energiesare invariant, although the relative intensities of peaks Aand C vary in the different probed spots (cf. spectra A2and A3); (b) the energies of peaks A–D closely match thoseof lizardite; (c) peak E is at an energy 1–2 eV higher thanfor lizardite and matches exactly the corresponding peakin diopside.
-edge l-EXAFS spectra (c). The spectra are labeled as follows:MW glass, C1–C4 = apparently unaltered regions of leached MWl references: dps = diopside; tlc, talc; mtm, montmorillonite; liz,wil, willemseite; tkv, takovite; the, theophrastite; pyr, pyrope; nlg,

2290 E. Curti et al. / Geochimica et Cosmochimica Acta 73 (2009) 2283–2298
3.5. l-XANES investigations at the Ni K-edge
Several l-XANES and l-EXAFS spectra were collectedat the Ni K-edge from the altered MW glass sample (Fig. 4band c). Some of them were obtained at the same locations(cf. Fig. 3a and b) of the previously described Mg K-edgespectra, thus enabling cross-correlations between Ni andMg l-XANES data. In Fig. 4b, Ni K-edge l-XANES spec-tra from the altered MW glass can be compared with thespectra of the unleached MW glass (ugl) and of several Nireference compounds. As for Mg, the Ni K-edge spectra ob-tained in the alteration zone and in regions apparentlyunaffected by the alteration have distinctive features. Forinstance, most absorption spectra from the altered zone(locations A2, A4, A5) have spectral features(F = 8347.2 eV, G = 8364.5 eV) which are absent, or weak-er, in the spectra recorded at the centre of glass grains (loca-tions C1 and C3). Among the reference compounds,inflection F (occurring just before the white line peak) ap-pears only in the spectra of the Ni-clay minerals nepouiteand willemseite (Ni-talc), whereas it is absent in all otherreference spectra. Therefore, in analogy to the Mg l-XANES, the Ni l-XANES spectra collected within the al-tered glass show features consistent with the spectra of clayminerals, which do not appear in the spectra collected in thecore regions of the glass fragments (locations C1, C3, C4).
For location A1, however, the analogy fails: Althoughthe Mg K-edge l-XANES spectrum at location A1 closelyresembles those collected at other locations rich in intersti-tial corrosion products, the corresponding Ni K-edge l-XANES bears more resemblances to those collected in theunaltered core zone of glass fragments. This inconsistencymay be a consequence of the largely different volumesprobed at the Mg K- and Ni K-edges, resulting from thedifferent penetration depths of the X-rays in the corre-sponding energy regions (1.3 keV at the Mg-K-edge,8.3 keV at the Ni K-edge). Possibly, the Ni K-edge l-XANES spectrum collected at location A1 (with a beam pe-netrating the entire sample thickness of 30 lm) might bedominated by spectral contributions originating from theunaltered glass buried below the surface of the thin section,whereas the corresponding Mg K-edge l-XANES spectrumshows only contributions originating from the alterationproducts present in the first 2–3 lm below the sample sur-face. A comparison of Fig. 3a and b seems to confirm thisinterpretation: In the Mg map (Fig. 3a) location A1 appearsto lie in an Mg-rich interstitial zone, whereas the same spotappears to be embedded in the core region of a glass grainin the Ni and Cs maps. Differences in the volumes probedby soft and hard X-rays are unavoidable and should alwaysbe considered when absorption spectra or XRF maps ofdifferent elements are correlated.
In analogy to Mg, the Ni l-XANES spectra from thecore regions of the glass fragments are very similar to thespectrum recorded for the unleached glass (ugl). This is aclear indication that the internal zones of the glass frag-ments remained unaffected by the aqueous corrosionprocess.
Fig. 4c shows selected k3-weighted v(k) functions of theNi K-edge l-EXAFS spectra, most of them corresponding
to the l-XANES spectra in Fig. 4b. It reveals two new as-pects, which will be discussed in Sections 4.2 and 4.3: (a) thespectra recorded for the high-Ni inclusions (T1 and T2)have oscillation patterns fundamentally different from allother MW-glass spectra, thus indicating the presence of athird Ni species in the altered MW sample; (b) none ofthe Ni reference spectra shown in Fig. 4c has oscillationpatterns matching any of the spectra collected from the al-tered MW glass sample.
3.6. Ni l-EXAFS investigations
Detailed Ni K-edge l-EXAFS analyses were carried outfor the spectra collected at location T2, a Ni-rich hot spot,and location A2, which lies in the interstitial zone rich insecondary Mg-clays. Based on the previously discussed l-XRD data, we attempted to fit the T2 l-EXAFS spectrumusing trevorite as model structure (Subramanyam, 1971).The results of our best fit, shown in Table 2 and Fig. 5, indi-cate a good agreement between the FT experimental spec-trum and the EXAFS model. The distances determinedfor the four nearest backscattering pairs (Ni–O, Ni–Ni1,Ni–Fe1, Ni–Ni2) coincide within the experimental uncer-tainties with those from the XRD structural data of trevor-ite. The low coordination numbers obtained for the Ni–Ni1and Ni–Fe1 shells (CNNi–Ni1 = 3.9 ± 0.3 instead of 6, CN
Ni–Fe1 = 4.3 ± 0.7 instead of 6) may be explained by exper-imental artefacts, (e.g. overabsorption), by structural disor-der, or by a cation defective structure. Non-stoichiometricspinels are common and may form through partial oxida-tion of magnetite (Fe3O4) to the isomorphous maghemite(Fe2O3) (Lagoeiro, 1998).
The l-EXAFS analysis carried out for the spectrum col-lected at location A2 is summarized in Table 3 and Fig. 6. Athree shell fit including Ni–O, Ni–Mg and Ni–Si backscat-tering pairs (Fig. 6a and b) was performed using talc as astarting structural model (Gruner, 1934) and assuming thata single central Ni2+ absorber replaces an octahedrallycoordinated Mg2+ ion. Thus, this model simulates the back-scattering from an isolated Ni absorber (trace element) inan Mg-rich silicate matrix (Ni–Ni pairs were not includedin this fit).
Our best fit yields Ni–O, Ni–Mg and Ni–Si distanceswithin the typical ranges of Mg-phyllosilicates. The fittedcoordination numbers for the Ni–O and Ni–Si shells arealso close to the ideal values for octahedral sites in phyllo-silicates, whereas the coordination number obtained for theNi–Mg backscattering pairs is only half the theoretical va-lue of six. Fixing CNNi–Mg to six always yielded unaccept-ably large uncertainties or unrealistic fit parameters. Wealso tested a refined model with additional shells aroundthe Ni absorber over the range R + DR = 1.2–5.0 A. In thismodel, the coordination numbers were fixed to values char-acteristic for trioctahedral clays, except for CNNi–Mg, whichwas set to three as in the previous 3-shell fit. We obtained inthis way a more accurate fit of the experimental k-space andFT spectra, with reasonable Debye–Waller factors andinteratomic distances close to the values determined withXRD methods for talc (Fig. 6c and d and Table 3b). Thefollowing alternative structural models with Ni, Fe or Al

Table 2Results of the l-EXAFS fit for the Ni-K-edge spectrum obtained at location T2. Fixed parameters are given in italics.
N (DN) R (A) (DR) r2 (A2)
Ni–O 5.3 ± 0.4 (�0.7) 2.03 ± 0.01 (�0.01) 0.005
Ni–Ni1 3.9 ± 0.3 (�2.1) 2.92 ± 0.01 (�0.03) 0.005
Ni–Fe1 4.3 ± 0.7 (�1.7) 3.47 ± 0.02 (+0.01) 0.007
Ni–Ni2 12 5.07 ± 0.03 (�0.04) 0.011 ± 0.002Ni–Fe2 8 5.63 ± 0.14 (+0.21) 0.021 ± 0.019Ni–Fe3 12 6.07 ± 0.14 (+0.17) 0.011 ± 0.004
DE0 = 2.8 ± 1.4 eV; S0 = 0.85; R-factor = 0.041, reduced v2 = 23.61.N, coordination number; R, interatomic distance; r2, Debye–Waller factors; DE0, energy shift; S0, amplitude reduction factor.DN, DR deviation from N, R in the XRD model structure of trevorite (Subramanyam, 1971).
Fig. 5. Fit of the Fourier transformed (FT) Ni K-edge l-EXAFSspectrum collected at location T2, using the structure of trevorite asstarting model.
Long-term alternation of nuclear waste glass 2291
backscatterers in the second shell were tested: (a) Ni–O, Ni–Al, Ni–Si, (b) Ni–O, Ni–(Mg + Ni), Ni–Si, (c) Ni–O, Ni–(Mg + Al), Ni–Si, (d) Ni–O, Ni–(Mg + Fe), Ni–Si. Allthese models yielded poor fits (either unacceptable parame-
Table 3Results of l-EXAFS fits for the Ni K-edge spectrum obtained for locatio8-shell fit with fixed coordination numbers.
N N phs.*
(a)
Ni–O 5.3 ± 0.3 6Ni–Mg 3.1 ± 1.6 6Ni–Si 4.5 ± 1.6 4
N N talc*
(b)
Ni–O 6 6Ni–Mg 3 6Ni–Si 4 4Ni–O 2 2Ni–O 4 4Ni–O 4 4Ni–Si 4 4Ni–O 16 16
DE0 = 2.8 ± 1.7 eV; S0 = 0.85; R-factor = 0.020; reduced v2 = 6.26.DE0 = 2.6 ± 2.1 eV; S0 = 0.85; R-factor = 0.018, reduced v2 = 5.37.N, coordination number; R, interatomic distance; r2, Debye–Waller fact* Interatomic distances and coordination numbers for Mg in phyllosilic(Bergerhoff and Brown, 1987).
ter values or exceedingly high uncertainties) and must there-fore be discarded. We conclude that the l-EXAFSspectrum collected at location A2 can be reasonably fittedonly assuming Ni–O, Ni-Mg and Ni-Si pairs.
3.7. Principal component analysis and linear combination fits
Due to the small particle size in the MW sample, collect-ing spectra resulting from the superposition of different Nispecies was unavoidable. Therefore, a principal componentanalysis (PCA) was carried out in order to determine num-ber and identity of the spectral components required toreproduce each single experimental absorption spectrum.Based on the results of the PCA analysis, linear combina-tions fits (LCF) were then calculated to determine the rela-tive contributions of the identified spectral components toeach single experimental spectrum. Our procedure closelyfollows the technique described in detail by Manceauet al. (2002), implemented in the programs available frombeamline 10.3.2 at ALS. For the LCF calculations the in-built utility in ATHENA was used.
n A2. Fixed parameters are given in italics. (a) 3-shell fit; (b) refined
R (A) R phs.* r2 (A2)
2.05 ± 0.01 2.05–2.09 0.006
3.08 ± 0.03 3.03–3.07 0.008
3.26 ± 0.02 3.16–3.26 0.008
R (A) R talc* r2 (A2)
2.05 ± 0.01 2.06 0.007 ± .00053.08 ± 0.05 3.03–3.04 0.008 ± 0.0043.25 ± 0.05 3.16–3.18 0.008 ± 0.0043.52 ± 0.13 3.38 0.007 ± 0.0173.80 ± 0.08 3.67 0.010 ± 0.0074.03 ± 0.04 4.00 0.004 ± 0.0044.42 ± 0.05 4.38–4.42 0.010 ± 0.0064.54 ± 0.18 4.53–4.76 0.042 ± 0.043
ors; DE0, energy shift; S0, amplitude reduction factor.ates (phs.) and talc structures, compiled from the ICSD database

Fig. 6. Fits of the Fourier transformed (FT) Ni K-edge l-EXAFS spectra collected at location A2, using the talc structure as starting model.Left: k3 weighted normalized spectra; right: magnitude and imaginary part of FT, uncorrected for phase shift: (a and b) 3-shell fit, (c and d)refined 8-shell fit.
2292 E. Curti et al. / Geochimica et Cosmochimica Acta 73 (2009) 2283–2298
The previously discussed l-EXAFS analysis showedthat at least three distinct Ni species occur in the alteredMW glass, exemplified by the spectra collected at locationA2 (Ni associated to secondary Mg-phyllosilicates), loca-tion C1 (Ni associated to the pristine glass) and locationT2 (trevorite inclusion). The PCA analysis confirmed thatthree components are necessary and sufficient to describeall experimental spectra, as the minimum of the ‘‘indicatorfunction” lies between 3 and 4 components. The ‘‘indicatorfunction” is related to the eigenvalues of the matrix used todecompose the experimental spectra in a given number ofcomponents, and reaches a minimum for the appropriatenumber of ‘‘abstract” components to use. The next stepwas to replace the ‘‘abstract” components with real candi-date ‘‘end-member” spectra and to compute for each ofthem the ‘‘spoil function” after carrying out a ‘‘target trans-formation” (Manceau et al., 2002). The ‘‘spoil function”
tests the likelihood that a given reference spectrum repre-sents a true component in a series of unknown multicompo-nent spectra: the lower its value, the more likely is theselected candidate ‘‘end-member” spectrum. Manceauet al. (2002) give an upper acceptance limit of 4.5 for a can-didate spectrum. As potential ‘‘end-members” we tested thespectra of Ni reference compounds as well as the MWexperimental spectra collected at locations A2, C1 andT2, which appeared as the most distinctive among all spec-
tra measured in the altered MW glass. The results (Table 4)show that the three MW spectra at locations A2, C1 and T2are indeed appropriate to carry out LCF calculations. Thespectrum of b-Ni(OH)2 also yields a good score but can beeliminated since the presence of a Ni hydroxide phase canbe ruled out (Ni–Ni pairs could be excluded in the EXAFSanalysis and the XRF maps did not reveal the presence ofconcentrated Ni phases in the altered zone). Ni-pyrope,which also has an acceptable score, can be ruled out as itcannot form at ambient conditions (stability in the high p,T range).
Based on the results of the PCA analysis, we carried outLCF calculations on a number of spectra collected in the al-tered MW glass sample. The results, presented in Table 5,show that the spectra can be interpreted as mixtures ofthe three selected ‘‘end-member” spectra identified in theMW glass. In most cases two components are sufficient tofit the experimental spectra, but in a few cases all three com-ponents are required.
3.8. Cs l-XAS investigations
Cs LIII-edge l-XAS spectra were measured for pollu-cite (Na0.3Cs0.7[H2O]0.3AlSi2O6), a secondary Cs-phasefound in altered simulated nuclear waste glasses (Ribetand Gin, 2004; Inagaki et al., 2006), and on representa-
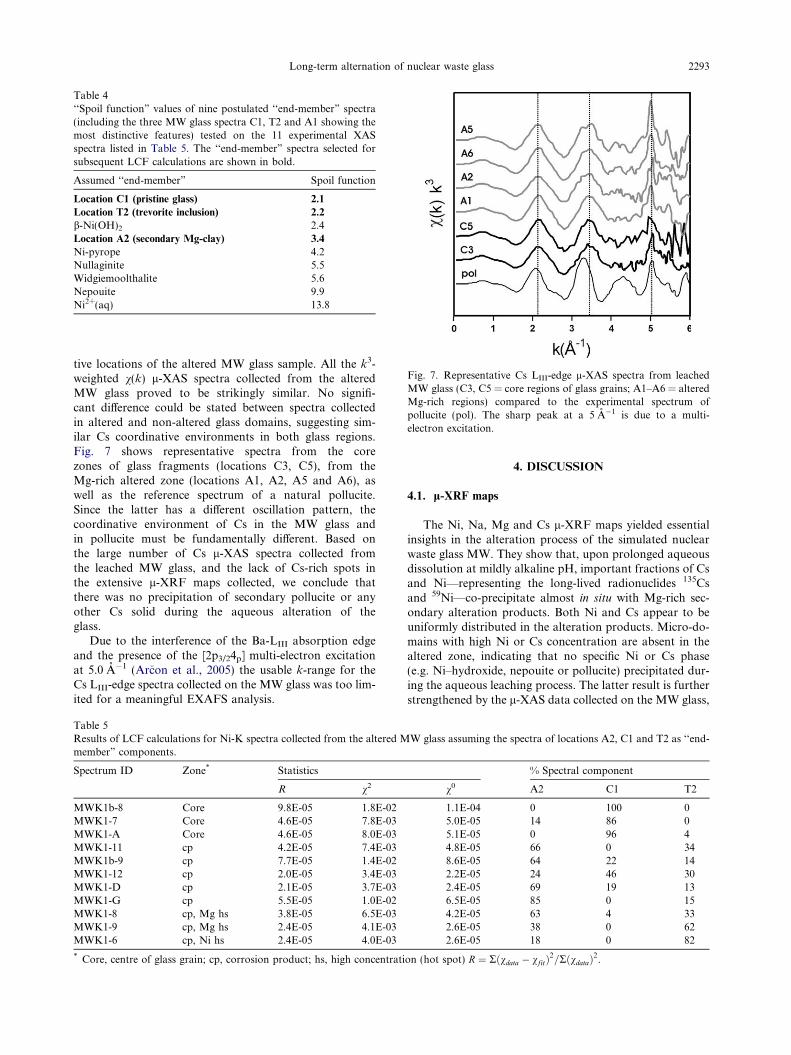
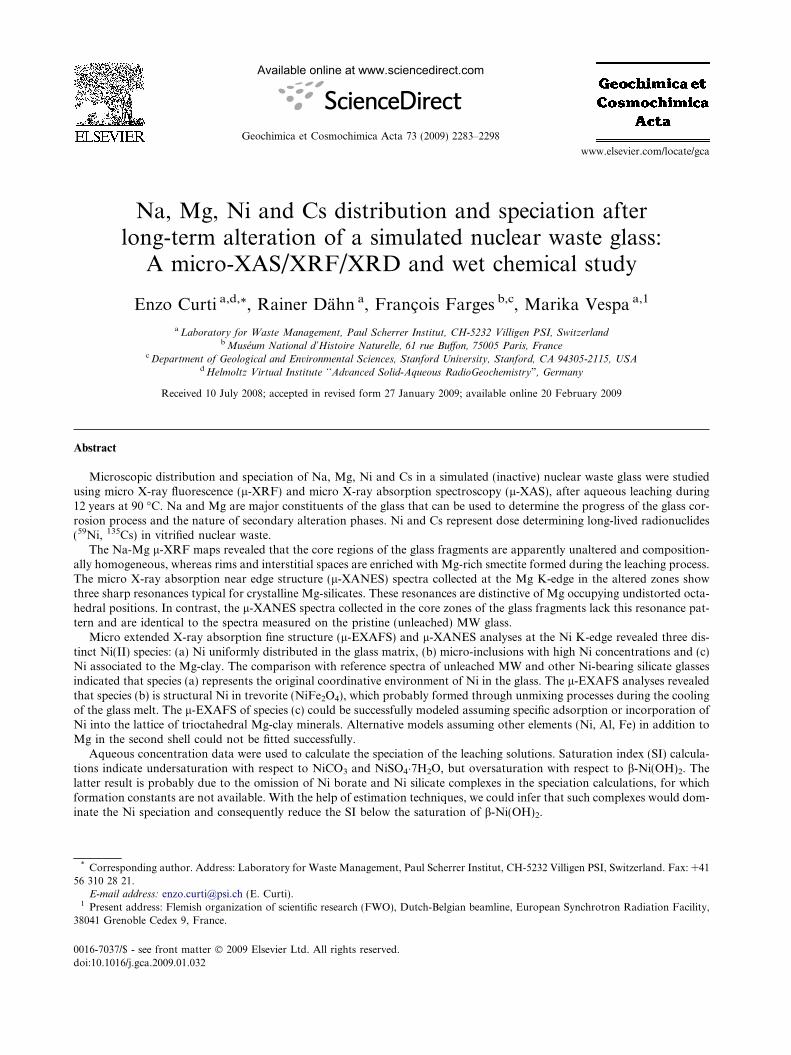
Table 4‘‘Spoil function” values of nine postulated ‘‘end-member” spectra(including the three MW glass spectra C1, T2 and A1 showing themost distinctive features) tested on the 11 experimental XASspectra listed in Table 5. The ‘‘end-member” spectra selected forsubsequent LCF calculations are shown in bold.
Assumed ‘‘end-member” Spoil function
Location C1 (pristine glass) 2.1
Location T2 (trevorite inclusion) 2.2
b-Ni(OH)2 2.4Location A2 (secondary Mg-clay) 3.4
Ni-pyrope 4.2Nullaginite 5.5Widgiemoolthalite 5.6Nepouite 9.9Ni2+(aq) 13.8
Fig. 7. Representative Cs LIII-edge l-XAS spectra from leachedMW glass (C3, C5 = core regions of glass grains; A1–A6 = alteredMg-rich regions) compared to the experimental spectrum ofpollucite (pol). The sharp peak at a 5 A�1 is due to a multi-electron excitation.
Long-term alternation of nuclear waste glass 2293
tive locations of the altered MW glass sample. All the k3-weighted v(k) l-XAS spectra collected from the alteredMW glass proved to be strikingly similar. No signifi-cant difference could be stated between spectra collectedin altered and non-altered glass domains, suggesting sim-ilar Cs coordinative environments in both glass regions.Fig. 7 shows representative spectra from the corezones of glass fragments (locations C3, C5), from theMg-rich altered zone (locations A1, A2, A5 and A6), aswell as the reference spectrum of a natural pollucite.Since the latter has a different oscillation pattern, thecoordinative environment of Cs in the MW glass andin pollucite must be fundamentally different. Based onthe large number of Cs l-XAS spectra collected fromthe leached MW glass, and the lack of Cs-rich spots inthe extensive l-XRF maps collected, we conclude thatthere was no precipitation of secondary pollucite or anyother Cs solid during the aqueous alteration of theglass.
Due to the interference of the Ba-LIII absorption edgeand the presence of the [2p3/24p] multi-electron excitationat 5.0 A�1 (Arcon et al., 2005) the usable k-range for theCs LIII-edge spectra collected on the MW glass was too lim-ited for a meaningful EXAFS analysis.
Table 5Results of LCF calculations for Ni-K spectra collected from the altered Mmember” components.
Spectrum ID Zone* Statistics
R v2
MWK1b-8 Core 9.8E-05 1.8E-02MWK1-7 Core 4.6E-05 7.8E-03MWK1-A Core 4.6E-05 8.0E-03MWK1-11 cp 4.2E-05 7.4E-03MWK1b-9 cp 7.7E-05 1.4E-02MWK1-12 cp 2.0E-05 3.4E-03MWK1-D cp 2.1E-05 3.7E-03MWK1-G cp 5.5E-05 1.0E-02MWK1-8 cp, Mg hs 3.8E-05 6.5E-03MWK1-9 cp, Mg hs 2.4E-05 4.1E-03MWK1-6 cp, Ni hs 2.4E-05 4.0E-03
* Core, centre of glass grain; cp, corrosion product; hs, high concentrati
4. DISCUSSION
4.1. l-XRF maps
The Ni, Na, Mg and Cs l-XRF maps yielded essentialinsights in the alteration process of the simulated nuclearwaste glass MW. They show that, upon prolonged aqueousdissolution at mildly alkaline pH, important fractions of Csand Ni—representing the long-lived radionuclides 135Csand 59Ni—co-precipitate almost in situ with Mg-rich sec-ondary alteration products. Both Ni and Cs appear to beuniformly distributed in the alteration products. Micro-do-mains with high Ni or Cs concentration are absent in thealtered zone, indicating that no specific Ni or Cs phase(e.g. Ni–hydroxide, nepouite or pollucite) precipitated dur-ing the aqueous leaching process. The latter result is furtherstrengthened by the l-XAS data collected on the MW glass,
W glass assuming the spectra of locations A2, C1 and T2 as ‘‘end-
% Spectral component
v0 A2 C1 T2
1.1E-04 0 100 05.0E-05 14 86 05.1E-05 0 96 44.8E-05 66 0 348.6E-05 64 22 142.2E-05 24 46 302.4E-05 69 19 136.5E-05 85 0 154.2E-05 63 4 332.6E-05 38 0 622.6E-05 18 0 82
on (hot spot) R ¼ Rðvdata � vfitÞ2=RðvdataÞ2.

2294 E. Curti et al. / Geochimica et Cosmochimica Acta 73 (2009) 2283–2298
which allowed us to exclude Ni–Ni pairs in the Ni-K l-EX-AFS analysis and failed to reveal oscillation patternsmatching the spectrum of pollucite, the only secondaryCs-phase detected so far in altered nuclear waste glasses.
4.2. Mg and Ni K-edge l-XANES
The Mg-K-edge l-XANES spectra collected in the al-tered domains of the MW glass show a triple resonance pat-tern typical of Mg-silicates (e.g. diopside, montmorillonite,lizardite, talc, glaucophane), which is lacking in the corezones of the glass fragments.
Some clues to the interpretation of these results are pro-vided by the work of Cabaret et al. (1998), who measuredMg K-edge absorption spectra for two Mg-pyroxenes(diopside and enstatite) and compared them with theoreti-cal full multiple-scattering (FMS) calculations. They de-duced that the resonances A, C and D (Fig. 4a) arerelated to medium order multiple-scattering effects, sincethese features disappeared when the radius of the modeledatomic cluster around the central Mg absorber was reducedto less than 6 A. In order to interpret their Mg K-edgeXANES spectra, Li et al. (1999) followed an empirical ap-proach based on the cross-comparison of a large number ofspectra of Mg-minerals, all well characterized in terms ofcrystal structure. They selected compounds with Mg–Ocoordination numbers of IV (spinel), V (grandidierite),V + VI (yoderite), VI (forsterite and several chain and sheetsilicates) and VIII (pyrope). A deconvolution analysis al-lowed these authors to determine that the position of peakA shifts to lower energies with decreasing coordinationnumber of the first Mg–O shell. These shifts are significantonly for Mg coordination changes from VIII to VI/V, orfrom VI/V to IV. A clear distinction between V-fold coor-dinated and VI-fold coordinated Mg can be made on thebase of peak B, which almost disappears in the V-fold coor-dinated compound grandidierite (Fig. 4a). The comparisonof the MW glass spectra A1, A2, A3 with those of the men-tioned reference compounds indicates that Mg has VI-foldcoordination in the secondary phase formed during theMW glass alteration. In addition, the correspondence ofthe A–D peak positions to the lizardite spectrum indicatesthat the main corrosion product is a clay mineral with tri-octahedral (brucite-type) sheet structure. This result is con-sistent with XRD and TEM data, which indicate that themain alteration product is an Mg–smectite (Curti et al.,2006).
On the other hand, the strong similarity between theMg-K spectrum obtained from the pristine unaltered glass(ugl) and the C1 and C2 spectra collected from the coresof glass fragments in the altered MW sample leaves nodoubt that Mg occurs there in its original coordinationenvironment, whereas for the C3 spectrum a componentoriginating from alteration products is evident. The C3spectrum was collected on a severely altered, small-sizedglass grain, so that the chance of including spectral contri-butions from the secondary clay was higher than for spotsC1 and C2.
In analogy to the Mg-XANES results, also the Ni l-XANES spectra collected in the core regions of the glass
fragments (locations C1, C3, C4) show smooth oscillationpatterns indicative of the low-order environment peculiarto vitreous materials. This interpretation is confirmed bythe similarity between the Ni K-edge spectra collected fromthe core regions of the MW glass fragments and the spec-trum of the unleached MW glass (Fig. 4b), as well as ofother Ni-bearing reference glasses (Farges et al., 2001a,b).Among the four glasses selected for the comparison(Fig. 8a), the glass ALB 0.004 has the spectrum and chem-ical composition most closely resembling to those of unal-tered domains in the MW glass. According to theempirical correlation set up in Farges et al. (2001a), theenergy position of the Ni-K pre-edge peak in the unalteredMW glass (8331.0 ± 0.2 eV, see Fig. 8b) is also characteris-tic of a pristine vitreous environment, indicating eitherV-fold coordinated or a mixture of IV and VI-fold coordi-nated Ni–O sites.
In conclusion, the Mg K-edge and Ni K-edge l-XANESspectra (Fig. 4a and b) are found to correlate well with thedegree of glass alteration. Whereas the Mg-K and Ni-Kspectra from the core zones of the MW glass fragmentshave features characteristic of pristine, unleached silicaglasses, those collected in the altered zones display patterns(particularly the resonance triplet in the Mg K-edge andinflection F in the Ni K-edge) consistent with Mg and Nicoexistence in an Mg-dominated, crystalline silicate. Thisphase has been identified by XRD and TEM investigationsas a smectite with composition midway between hectoriteand montmorillonite (Curti et al., 2006), whereas otherlow-temperature Mg-clay phases (palygorsite, talc, serpen-tine, vermiculite, sepiolite) could be ruled out based onincompatible XRD patterns.
4.3. Ni K-edge l-EXAFS
The Ni K-edge l-EXAFS spectra collected in the clay-rich regions of the altered MW glass could be successfullymodelled assuming Ni as isolated absorber surrounded byMg and Si atoms. The fits yielded interatomic distancesconsistent with the crystal structure of smectites, thus con-firming the XRD findings.
The low coordination number (about three) determinedfor the Ni–Mg pairs may be explained by assuming Niadsorption on the edge sites of the clay. In their P-EXAFSstudy, Dahn et al. (2003) found configurations with N(Ni–Al) � 2 and N(Ni–Si) � 4 for Ni adsorbed on montmoril-lonite edge sites, with distances similar to those obtainedfor Ni–Mg and Ni–Si pairs in our fit of the spectrum ob-tained at location A2. In a trioctahedral Mg-clay, analo-gous structural positions would yield N(Ni–Mg) = 3 andN(Ni–Si) = 4, as in our EXAFS analysis. Accordingly, thecoordination environment of Ni atoms associated to theMg-rich clay in the altered MW glass would be analogousto that of species Ni3 in Dahn et al. (2003) (see Fig. 12 inmentioned reference).
On the other hand, the low Ni–Mg coordination numbermay also be a consequence of structural disorder, experi-mental bias (e.g. overabsorption, see Heald, 1988), or incor-poration of Li+ (a light element with a very lowbackscattering power) in a hectorite structure (Ianovici

Fig. 8. Comparison of C1 spectrum (MW glass, non-altereddomain) with Ni K-edge spectra of unleached Ni-bearing glasses(from Farges et al., 2001a): (a) XANES spectra, (b) pre-edge.
Long-term alternation of nuclear waste glass 2295
et al., 1990). Therefore, lattice incorporation cannot be ex-cluded as the main Ni retention mechanism in the MW sec-ondary clay. This interpretation seems even moreappropriate, since all fitted distances and all other coordi-nation numbers agree with a lattice incorporation model.In the case of surface adsorption, Ni–Si coordination num-bers of about two are expected (cf. Table 2 in Dahn et al.,2003), whereas our fit yields a coordination number ofabout four.
The l-XRF maps also revealed the presence of Ni-rich‘‘hot spots” embedded in a homogeneous glass matrix withuniform Ni concentration, which were identified through l-EXAFS analyses and l-XRD measurements as trevorite(NiFe2O4) micro-inclusions. Such inclusions are not theproduct of low-temperature aqueous alteration, but pri-mary heterogeneities that form in Ni-bearing glasses duringcooling of the glass melt (Lutze, 1988). Therefore, two dis-tinct primary Ni species (Ni uniformly distributed in theglass matrix and trevorite inclusions) are present in theunleached MW glass. Such bimodal distribution in the pris-
tine glass suggests that two distinct release mechanisms mayoperate during the release of 59Ni from vitrified nuclearwaste.
4.4. Ni and Cs solubility
The aqueous concentration data obtained from theleaching solutions were used to calculate the chemical spe-ciation of dissolved Ni and saturation indices for potentialsecondary phases. For these calculations, we used only thecritically reviewed thermodynamic data reported by Hum-mel et al. (2002) and Gamsjager et al. (2005). As discussedby Hummel and Curti (2003) other data should not be useddue to severe internal inconsistencies. In the case of Cs, theavailable thermodynamic data were insufficient to carry outsuch calculations with an acceptable degree of confidence,and even for Ni this task proved to be difficult.
As noted previously, the results of our l-XRF/XASinvestigation failed to reveal the occurrence of concentratedNi phases in the secondary products formed during theaqueous alteration of the MW glass. This observation isin principle consistent with our analysis of the aqueoussolution data, since the calculated saturation indices forNi carbonate, hydrous Ni sulfate (both strongly undersatu-rated) and b-Ni(OH)2 (oversaturated) are all far from equi-librium (SI = 0). However, the latter result is surprising, asit implies that the solution is metastable with respect tocrystalline nickel hydroxide even after an ageing time of12 years at the relatively high temperature of 90 �C.Although more soluble forms of Ni(OH)2 exist with solubil-ity products up to 2.5 logunits higher than for the crystal-line form (Feitknecht and Schindler, 1963) one wouldexpect formation of b-Ni(OH)2 under such conditions, asdemonstrated in the solubility study carried out by Gamsja-ger et al. (2002) in the 30–80 �C temperature range.
A possible explanation for the calculated oversaturationis that potentially important Ni-borate and Ni-silicate com-plexes, for which no thermodynamic data are available inthe literature, had forcedly to be neglected in the speciationcalculations. The scarce data available on borate complexesof other transition metals like Cu, Cd and Zn (van denBerg, 1984), indicate that such complexes do indeed existand cannot be ignored at such high B and Si concentra-tions. In order to assess the potential role of Ni-borateand Ni-silicate complexes on the solubility of Ni hydroxide,we estimated the formation constants at 25 �C for the Ni-BO(OH)2
+ and NiSiO(OH)3+ complexes by applying the
correlation method of Schwarzenbach (1961). This estima-tion technique is based on the premise that H+ can be re-garded as a hard metal. Therefore, for any other metal,there should be a correlation between the stability constantsof its complexes and the strength of the correspondingacids. For instance, NiCl+ is expected to be weaker thanNiCO3(aq) because HCl dissociates much more easily(pKa << 0) than HCO3
� (pKa = 6.4). By plotting theknown Ni-ligand formation constants against the corre-sponding acid dissociation constants leads to a crude corre-lation, from which unknown formation constants of Niwith other ligands can be roughly extrapolated. BecauseB(OH)3 and Si(OH)4 are weak acids (pKa = 9.3. and 9.9,

2296 E. Curti et al. / Geochimica et Cosmochimica Acta 73 (2009) 2283–2298
respectively) large formation constants are expected for thecomplexes NiBO(OH)2
+ and NiSiO(OH)3+.
Such a correlation plot was constructed using the datacompiled in Gamsjager et al. (2005), yielding log-bo
1 = 3.5 ± 1.0 for NiBO(OH)2+ and log bo
1 = 3.6 ± 1.0for NiSiO(OH)3
+ (Fig. 9). Introducing these constants inour chemical speciation model led to a Ni speciation dom-inated by the Ni-borate and Ni-silicate complexes (sum-ming up to >95% of the total dissolved Ni) and adecrease of the Ni2+ activity by orders of magnitude. Asa consequence the SI for b-Ni(OH)2 was reduced to a valuebelow saturation (�0.2, see Table 1).
Due to its large cationic size and low charge, Cs+ is notexpected to form strong complexes with any of the majorligands present in the glass leaching solution. The thermo-dynamic database used in our calculations does not listany Cs complex or solid, resulting in 100% of the measuredCs-concentration as free Cs+ ion and no precipitation reac-tion. The ICP-AES analyses yielded Cs concentrations of(4.8 ± 1.9) � 10�5 M before centrifugation and (3.8 ±1.5) � 10�5 M after centrifugation. Using the latter concen-tration and the glass dissolution rates reported in Curtiet al. (2006) we calculated that about 95% of the Cs releasedfrom the glass is retained in the alteration products. Thisfigure is even higher for Ni (>96%). Such results demon-strate that the dissolution process was highly incongruentfor both radionuclides. As a consequence, only a minor
Fig. 9. Estimation of formation constants for the hypotheticalcomplexes NiBO(OH)2
+ and NiSiO(OH)3+ through correlation of
known Ni formation constants with the corresponding aciddissociation constants (pKa-values). The known formation con-stants (solid circles) were taken from Gamsjager et al. (2005),whereas pKa-values are from Lide (2007). The unknown constants(at 25 �C) were extrapolated linearly from the mono-sulfate andmono-hydroxo constants, yielding logbo
1 � 3.5 ± 1.0 forNiBO(OH)2
+ and logbo1 � 3.6 ± 1.0 for NiSiO(OH)3
+. The pKa
of water was converted for consistency with the reference statedefinition of the other constants: pKw
* = pKw + log(55.56 mol/kgH2O) = 14 + 1.74 = 15.74 (this is necessary because in pKw theactivity of water is defined in terms of mole fraction). The pKa
values for HCl (�7) and HNO3 (�2) are not known exactly and areonly rough approximations.
fraction of the Cs and Ni inventories released through glassdissolution is mobile.
Our results show that calculating the solubility of Cs andNi in the glass leaching environment is not a trivial task andrequires robust thermochemical data for all relevant chem-ical species (including the solid phases). Despite the key roleof boron during the dissolution of nuclear waste glasses,this issue has been largely ignored to date, making theoret-ical calculations of metal solubility in such environments anarduous task. Presently, we are not in a position to modelprecisely Ni and Cs aqueous concentrations in the complexnuclear waste glass system. Nevertheless, our data showthat even radionuclides like 135Cs, assumed to be entirelysoluble in safety assessment (Nagra, 2002) are efficiently re-tained in secondary alteration products during the corro-sion of nuclear glasses. Such beneficial effects arecurrently neglected in repository performance calculations.
4.5. Saturation index calculations
In addition to the previously discussed Ni phases, satu-ration indices were calculated also for a number of othersimple solids that could precipitate in the investigatedchemical system (Table 1C). All carbonates and sulfates,as well as the crystalline Mo(VI) oxide, are strongly under-saturated, so that precipitation of these solids in their pureform can be safely ruled out. In contrast, the calculated SI-values of brucite, gibbsite and kaolinite are close to satura-tion, implying that precipitation of these minerals duringthe alteration of the MW glass cannot be excluded.
In the case of SiO2, the activity of Si(OH)4 (10�2.72) ismidway between quartz and amorphous silica saturation.Such activities are typical of equilibrium with micro-crystal-line quartz (e.g. chalcedony). An indication for the presenceof micro-crystalline quartz in the alteration products of theMW glass is indeed provided by the powder-XRD data,which show a weak broad peak centred at d = 3.35 A (seeFig. 10 in Curti et al., 2006). In contrast, the XRD datayielded no evidence for the presence of brucite, gibbsite orkaolinite.
Finally, it is noted that the strong oversaturation withrespect to crystalline Zr oxide (baddeleyite) is possibly anindication that the leaching solution is in equilibrium withan amorphous form of Zr oxy-hydroxide. Experimentaldata show that amorphous, colloidal Zr(OH)4 readily pre-cipitates when a base is added to Zr-bearing solutions,yielding equilibrium concentrations several orders of mag-nitude higher than for crystalline ZrO2 (see Appendix Din Brown et al., 2005).
5. CONCLUSIONS
In this paper, we present the results of X-ray spectro-scopic investigations carried out at micrometric resolutionon a simulated nuclear waste glass (MW) that was subjectto aqueous alteration at 90 oC during more than 12 years.Our results show that the alteration of such glasses is a geo-chemically complex process involving dissolution and par-tial in situ re-precipitation of Ni and Cs radionuclides.Detailed l-XAS/XRF analyses in combination with other

Long-term alternation of nuclear waste glass 2297
techniques (XRD, l-XRD, TEM) allowed us to determinethat an important fraction of the dissolved Ni is immobi-lized as trace element in trioctahedral Mg-rich smectitesprecipitated during the aqueous alteration of the MW glass.As for Ni, a substantial part of the Cs released from theglass was also found to be trapped as trace element in thealteration products. However, the local atomic coordina-tion environment of Cs could not be determined due tothe limited k-range available for the EXAFS analysis. Inboth cases, no specific concentrated (Ni or Cs) phase wasformed during the glass alteration process.
The speciation model of the leaching solution indicatedunexpectedly oversaturation with respect to b-Ni(OH)2. Inconjunction with the X-ray spectroscopic data, which showthat no secondary Ni solid phase precipitated, this resultwould suggest metastability of the solution, which howeveris unlikely after a leaching time of 12 years at 90 �C. We couldargue that this apparent inconsistency is probably a conse-quence of the use of an incomplete thermodynamic datasetin the speciation calculation, since potentially important Niborate and silicate complexes—for which formation con-stants are unavailable—could not be taken into account.With the help of estimation techniques, it could be shownthat such complexes would dominate the aqueous speciationof Ni in the aqueous phase and drastically reduce the calcu-lated SI.
Our results also imply that pure phase saturation equilib-ria are not always adequate tools for predicting aqueousradionuclide concentrations in safety assessments for nuclearwaste repositories. This study suggests that solubility limitsfor Cs and Ni in the pore water permeating the nuclear wasteglass should be determined based on adsorption and/or solidsolution equilibria. Unfortunately, this task is currently notfeasible due to the lack of adequate thermodynamic data.
Finally, our study evidences once more the importantrole of clay minerals, notably smectites, as alteration prod-ucts of silicate glasses. As shown by Crovisier et al. (1992)crystalline smectites formed as major secondary phase ofIcelandic basalts altered by ice melting water. A recentstudy on the corrosion of historical Roman glasses (1800a) also shows the formation of Mg-smectite as major alter-ation product (Verney-Carron et al., 2008). Since in bothcases the alteration proceeded over millennia, smectite mustbe considered as a stable end-product of the aqueous leach-ing of Mg-bearing silica glasses.
ACKNOWLEDGMENTS
We thank the ALS (Advanced Light Source, Lawrence Liver-more National Laboratory at Berkeley, USA) and SLS (SwissLight Source, Paul Scherrer Institut, Villigen, Switzerland) for pro-viding the high-quality beamtime and infrastructure necessary forour synchrotron-based investigations. The ALS is supported bythe Director, Office of Science, Office of Basic Energy Sciences,Materials Sciences Division of the US Department of Energy underContract DE-AC03-76SF00098 at the Lawrence Berkeley NationalLaboratory. The authors gratefully acknowledge beamline scien-tists M. Marcus (10.3.2, ALS) and M. Janousch (LUCIA, SLS)for their invaluable support during data acquisition. DominikKunz (Paul Scherrer Institut, Laboratory for Waste Management)is warmly thanked for his help during the acquisition of l-XAS/
XRF experimental data. Partial financial support was providedby the National Cooperative for the Disposal of Radioactive Waste(Nagra), Wettingen, Switzerland.
REFERENCES
Arcon I., Kodre A., Padeznik Gomilsek J., Hribar M. and MihelicA. (2005) Cs L-edge EXAFS atomic absorption background.Phys. Scripta T115, 235–236.
Bergerhoff G. and Brown I. D. (1987) In CrystallographicDatabases (eds. F. H. Allen, G. Bergerhoff and R. Sievers),International Union of Crystallography, Chester, pp. 77–95.
Bevington Ph. R. (1969) Data Reduction and Error Analysis for the
Physical Sciences. McGraw-Hill, New York, 336 p.Brown P. L., Curti E. and Grambow B. (2005) In Chemical
Thermodynamics of Zirconium. Chemical Thermodynamics(eds. F. J. Mompean, J. Perrone and M. Illemassene). NuclearEnergy Agency (NEA), vol. 8. Organisation for Economic Co-operation and Development (OECD), 512p. ISBN 0-444-52125-9.
Cabaret D., Sainctavit Ph., Ildefonse Ph. and Flank A. M. (1998)Full multiple scattering calculations of the X-ray absorptionnear edge structure at the magnesium K-edge in pyroxene. Am.
Mineral. 83, 300–304.
Crovisier J. L., Honnorez J., Fritz B. and Petit J. C. (1992)Dissolution of sub glacial volcanic glasses from Iceland:laboratory study and modeling. Appl. Geochem. Suppl. Iss. 1,
55–81.
Curti E., Crovisier J. L., Karpoff A. M. and Morvan G. (2006)Long-term corrosion of two nuclear waste reference glasses(MW and SON68): a kinetic and mineral alteration study. Appl.
Geochem. 21, 1152–1168.
Dahn R., Scheidegger A. M., Manceau A., Schlegel M., BaeyensB., Bradbury M. H. and Chateigner D. (2003) Structuralevidence for the sorption of Ni(II) atoms on the edges ofmontmorillonite clay minerals: a polarized X-ray absorptionfine structure study. Geochim. Cosmochim. Acta 67(1), 1–15.
Downward L., Booth C. H., Lukens W. W. and Bridges F. (2007)A variation of the F-test for determining statistical relevance forparticular parameters in EXAFS analysis. In X-Ray Absorption
Fine Structure XAFS13: 13th International Conference, July 9–
13, 2006. AIP Conference Proceedings 882, 129 (2007), LBNL-62566.
Farges F., Brown, Jr., J. E., Petit P. E. and Munoz M. (2001a)Transition elements in water-bearing silicate glasses/melts. PartI: a high-resolution and anharmonic analysis of Ni coordina-tion environments in crystals, glasses, and melts. Geochim.
Cosmochim. Acta 65(10), 1665–1678.
Farges F., Munoz M., Siewert R., Malavergne V., Brown, Jr., G.E., Behrens H., Nowak M. and Petit P. E. (2001b) Transitionelements in water-bearing silicate glasses/melts. Part II: Ni inwater-bearing glasses. Geochim. Cosmochim. Acta 65(10), 1679–
1693.
Feitknecht W. and Schindler P. (1963) Solubility constants of metaloxides, metal hydroxides and metal hydroxide salts in aqueoussolution. Pure Appl. Chem. 1(2), 130–199.
Gamsjager H., Wallner H. and Preis W. (2002) Solid-solute phaseequilibria in aqueous solutions XVII. Solubility and thermo-dynamic data of nickel(II) hydroxide. Monatsh. Chem. (Chem-
ical Monthly). 133, 225–229.Gamsjager H., Bugajski, J., Gaida, T., Lemire, R. and Preis W.
(2005) In Chemical Thermodynamics of Nickel. Chemical
Thermodynamics (eds. F. J. Mompean and M. Illemassene).Nuclear Energy Agency (NEA), vol. 6. Organisation forEconomic Co-operation and Development (OECD), 617p.ISBN 0-444-51802-9.

2298 E. Curti et al. / Geochimica et Cosmochimica Acta 73 (2009) 2283–2298
Gruner J. W. (1934) The crystal structures of talc and pyrophyllite.Z. Kristallogr. Krist. 88, 412–419.
Hammersley A. P. (1995) FIT2D Reference Manual. ESRF
Internal Report, EXP/AH/95-01. European SynchrotronResearch Facility, Grenoble, France.
Heald S. M. (1988) Design of an EXAFS experiment. In X-Ray
Absorption: Principles, Applications, Techniques of exafs, sexafs
and xanes, (eds. D. C. Koningsberger and R. Prins), vol. 92.Chemical Analysis, Wiley, New York, pp. 87–118.
Hummel W., Berner U., Curti E., Pearson, Jr., F. J. and ThoenenT. (2002) Nagra/PSI Chemical Thermodynamic Data Base 01/01. Nagra Technical Report NTB 02-16, Nagra, Wettingen,Switzerland and Universal Publishers/uPublish.com, Parkland,Florida, 565p. ISBN 1-58112-620-4.
Hummel W. and Curti E. (2003) Nickel aqueous speciation andsolubility at ambient conditions: a thermodynamic elegy.Monatsh. Chem. (Chemical Monthly) 134, 941–973.
Ianovici V., Neacs�u G. and Neacs�u V. (1990) Li-bearing stevensitefrom Moldova Noua, Romania. Clays Clay Miner. 38(2), 171–
178.
Inagaki Y., Shinkai A., Idemistu K., Arima T., Yoshikawa H. andYui M. (2006) Aqueous alteration of Japanese simulated wasteglass P0798: effects of alteration-phase formation on alterationrate and cesium retention. J. Nucl. Mater. 354, 171–184.
Janousch M., Flank A.-M., Lagarde P., Cauchon G., Bac S.,Dubuisson J. M., Schmidt T., Wetter R., Grolimund D. andScheidegger A. M. (2004) LUCIA—a new1–7 keV l-XASbeamline. AIP Conf. Proc. 705, 312–315.
Lagarde P., Flank A. M., Vantelon D. and Janousch M. (2007)Micro-soft X-ray spectroscopy with the LUCIA beamline. AIP
Conf. Proc. 882, 852–857.
Lagoeiro L. E. (1998) Transformation of magnetite to hematite andits influence on the dissolution of iron oxide minerals. J.
Metamorph. Geol. 16, 415–423.
Li D., Peng M. and Murata T. (1999) Coordination and localstructure of magnesium silicate minerals and glasses: Mg K-edge XANES study. Can. Mineral. 37, 199–206.
Lide D. R. (2007) CRC Handbook of Chemistry and Physics. 88thed., 2640p. ISBN-10:0849304881.
Lutze W. (1988) Silicate glasses. In Radioactive Waste Forms for the
Future (eds. W. Lutze and R. C. Ewing). Amsterdam, North-
Holland, pp. 1–159.
Manceau A., Matthew A. M. and Tamura N. (2002) Quantitativespeciation of heavy metals in soils and sediments by synchro-tron X-ray techniques. In Applications of Synchrotron Radiation
in Low-Temperature Geochemistry and Environmental Science
(eds. P. Fenter, M. Rivers, N. Sturchio and S. Sutton), Reviewsin Mineralogy and Geochemistry, vol. 49, MineralogicalSociety of America, pp. 341–428.
Marcus M. A., MacDowell A. A., Celestre R., Manceau A., MillerT., Padmore H. A. and Sublett R. E. (2004) Beamline 10.3.2 atALS: a hard X-ray microprobe for environmental and materialssciences. J. Synchrotron Radiat. 11, 239–247.
Meunier A. (2005) Clays. Springer Verlag, 472p. ISBN 3-540-21667-7.
Nagra (2002) Project Opalinus Clay—Safety Report, Nagra,Technical Report NTB 02-05, Nagra, Wettingen, Switzerland.
Neuville D. R., Cormier L., Flank A. M., Prado R. J. and LagardeP. (2004) Na-K edge XANES spectra of minerals and glasses.Eur. J. Mineral. 16, 809–816.
Ravel B. and Newville M. (2005) ATHENA, ARTEMIS,HEPHAESTUS: data analysis for X-ray absorption spectros-copy using IFEFFIT. J. Synchrotron Radiat. 12, 537–541.
Rehr J. J., Mustre de Leon J., Zabinsky S. I. and Albers R. C.(1991) Theoretical X-ray absorption fine structure standards. J.
Am. Chem. Soc. 113, 5135–5140.
Ribet S. and Gin S. (2004) Role of neoformed phases onthe mechanisms controlling the resumption of SON68glass alteration in alkaline media. J. Nucl. Mater. 324, 152–
164.
Schwarzenbach G. (1961) The general, selective and specificformation of complexes by metallic cations. In Advances in
Inorganic Chemistry and Radiochemistry (eds. Emeleus H. J.and Sharpe A. G.), vol. 3. Academic Press, New York, pp. 275–285.
Subramanyam K. N. (1971) Neutron and X-ray diffraction studiesof certain doped nickel ferrites. J. Phys. C 4, 2266–2268.
Thoenen T., Berner U., Curti E., Hummel W. and Pearson F.J. Jr.(2004). Development and application of the Nagra/PSI chem-ical thermodynamic database 01/01. In Energy, Waste and the
Environment: a Geochemical Perspective (eds. R. Giere and P.Stille), vol. 236. Geological Society Special Publications,London, pp. 561–577.
van den Berg C. M. G. (1984) Speciation of boron with Cu2+,Zn2+, Cd2+ and Pb2+ in 0.7 M KNO3 and in sea-water.Geochim. Cosmochim. Acta 48(12), 2613–2617.
Vernaz E. Y. and Dussossoy J. L. (1992) Current state ofknowledge of nuclear waste glass corrosion mechanisms: thecase of R7T7 glass, Appl. Geochem. Suppl. Issue No. 1, 13–22.
Verney-Carron A., Gin S. and Libourel G. (2008) A fracturedroman glass block altered for 1800 years in seawater: analogywith nuclear waste glass in a deep geological repository.Geochim. Cosmochim. Acta 72(22), 5372–5385.
Westall J., Zachary J. L. and Morel F. M. M. (1976) MINEQL, acomputer program for the calculation of chemical equilibriumcomposition of aqueous systems. Mass. Inst. Tech. Dept. Civil
Eng. Tech. Note 18, 91.
Wicks G. G., Lodding A. R. and Molecke M. A. (1993) Aqueousalteration of nuclear waste glasses and metal package compo-nents. MRS Bull. XVIII (9), 32–39.
Witherspoon P.A. and Bodvarsson G.S. (2006) Geological Chal-
lenges in Radioactive Waste Isolation—Fourth Worldwide
Review. LBNL-59808, Lawrence Berkeley National Laboratoryand University of California, Berkeley, USA, 295p.
Associate editor: Eric H. Oelkers