naa economic update · coronavirus economic impacts • the 9-week total for initial jobless claims...
TRANSCRIPT

Covid-19 Economic Update
May 21, 2020
Coronavirus Economic Impacts
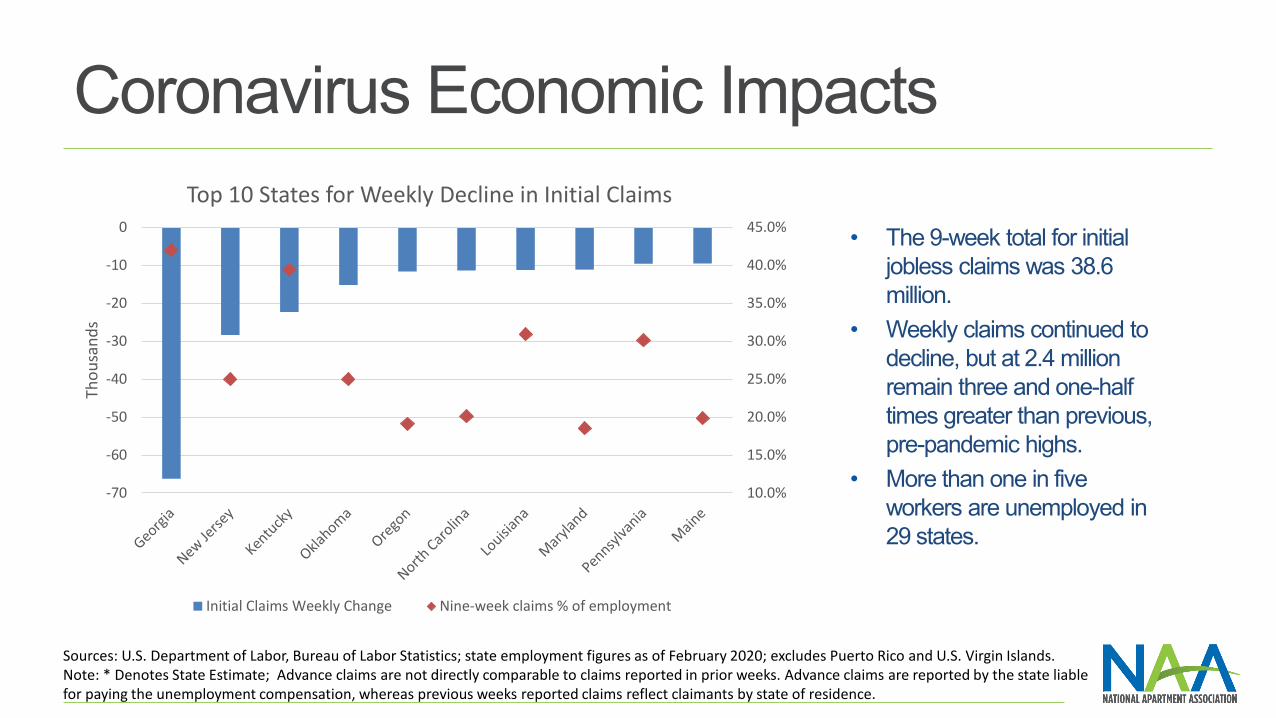
• The 9-week total for initial jobless claims was 38.6 million.
• Weekly claims continued to decline, but at 2.4 million remain three and one-half times greater than previous, pre-pandemic highs.
• More than one in five workers are unemployed in 29 states.
10.0%
15.0%
20.0%
25.0%
30.0%
35.0%
40.0%
45.0%
-70
-60
-50
-40
-30
-20
-10
0
Thou
sand
s
Top 10 States for Weekly Decline in Initial Claims
Initial Claims Weekly Change Nine-week claims % of employment
Sources: U.S. Department of Labor, Bureau of Labor Statistics; state employment figures as of February 2020; excludes Puerto Rico and U.S. Virgin Islands.Note: * Denotes State Estimate; Advance claims are not directly comparable to claims reported in prior weeks. Advance claims are reported by the state liable for paying the unemployment compensation, whereas previous weeks reported claims reflect claimants by state of residence.

Coronavirus Economic Impacts
0
0.1
0.2
0.3
0.4
0.5
0.6
0.7
0.8
0.9
1
0
200
400
600
800
1000
1200
1400
Thou
sand
s of U
nits
Sea
sona
lly A
djus
ted
Annu
al
Rate
s
Housing Starts
Single-family Multifamily
Source: U.S. Census Bureau and U.S. Department of Housing and Urban Development, Privately Owned Housing Starts: 5-Unit Structures or More and 1-Unit Structures retrieved from FRED, Federal Reserve Bank of St. Louis May 21, 2020.
• Single-family and multifamily housing starts continued their freefall in April, down 25 percent and 40 percent, respectively, from last month as projects were put on hold.
• Multifamily starts were at a near-seven-year low at 234,000.
April 2020
Coronavirus Economic Impacts
-35%
-30%
-25%
-20%
-15%
-10%
-5%
0%
< $100K $100K-$250K $250K-$500K $500K-$750K $750K-$1M > $1M
Perc
ent C
hang
e Ye
ar A
go
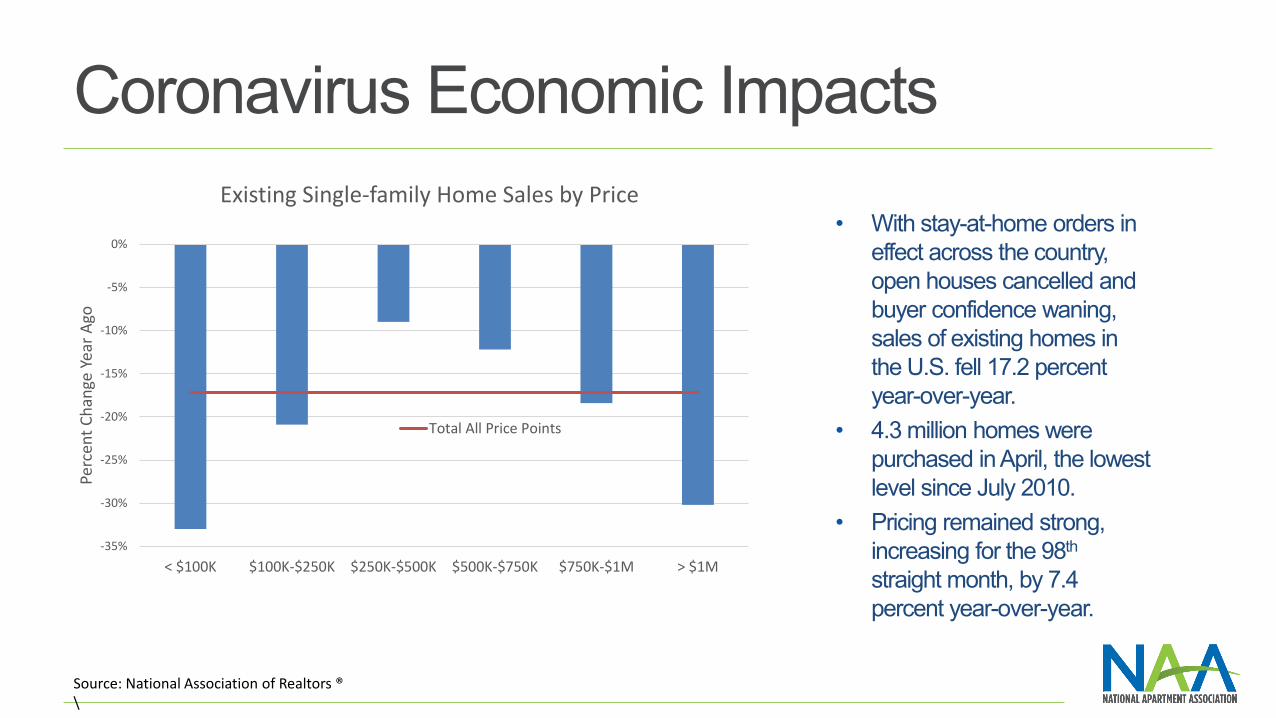
Existing Single-family Home Sales by Price
Total All Price Points
• With stay-at-home orders in effect across the country,open houses cancelled and buyer confidence waning, sales of existing homes in the U.S. fell 17.2 percent year-over-year.
• 4.3 million homes were purchased in April, the lowest level since July 2010.
• Pricing remained strong, increasing for the 98th
straight month, by 7.4 percent year-over-year.
Source: National Association of Realtors ®\
Apartment Industry Impacts
-8%
-6%
-4%
-2%
0%
2%
4%
6%
8%
2008 2009 2010 2011 2012 2013 2014 2015 2016 2017 2018 2019 2020F
2021F
2022F
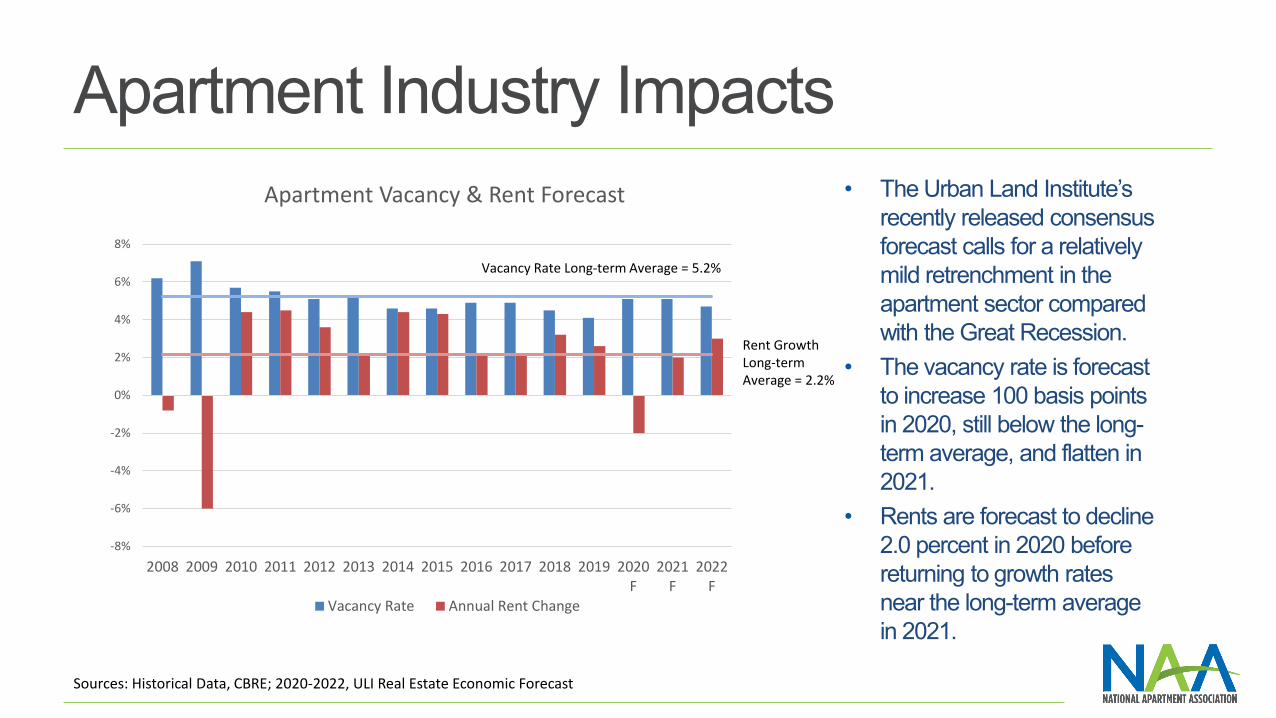
Apartment Vacancy & Rent Forecast
Vacancy Rate Annual Rent Change
Vacancy Rate Long-term Average = 5.2%
• The Urban Land Institute’s recently released consensus forecast calls for a relatively mild retrenchment in the apartment sector compared with the Great Recession.
• The vacancy rate is forecast to increase 100 basis points in 2020, still below the long-term average, and flatten in2021.
• Rents are forecast to decline 2.0 percent in 2020 before returning to growth rates near the long-term average in 2021.
Sources: Historical Data, CBRE; 2020-2022, ULI Real Estate Economic Forecast
Rent Growth Long-term Average = 2.2%

Apartment Industry Impacts
$0
$5
$10
$15
$20
$25
$30
2015-01-01 2016-01-01 2017-01-01 2018-01-01 2019-01-01 2020-01-01
$ Bi
llion
s
Apartment Transaction Volume
Source: Real Capital Analytics, Inc.
• Apartment property sales volume plummeted by 71 percent year-over-year in April.
• The $3.5 billion worth of deals which closed was the lowest monthly figure since February 2012.
• Prices rose 10.8 percent from a year ago, driven by 13.2 percent price growth in non-major metro areas.April 2020
5-year average monthly volume = $14B