nada for r a contributed package for censored ...lee.pdf · nada for r a contributed package for...
TRANSCRIPT

NADAforRAcontributedpackageforcensoredenvironmentaldata
DennisHelselPracticalStats
Lopaka(Rob)LeeU.S.GeologicalSurvey

Censoreddata
• Dataknownonlytobeaboveorbelowathreshold.Theexact,singlenumberisnotknown.• Inenvironmentalstudies,mostfrequentapplicationisto“nondetects”,valuesknownonlytobebelowreporting(detection)limits.• <10=avaluemeasuredsomewherebetween0and10
“Nondetects”occurinmanyfields
• Waterquality• Airquality• Soilchemistry• Geochemistry
• Astronomy• Occupationalhealth• Riskanalysis• Biocontaminants

TheProblem
• Substitutionisthemostcommonly-usedmethodforincorporatingcensoredenvironmentaldata
• timesRLarethemostcommonly-usedsubstitutions
• Using½,each<1becomes0.5,each<5becomes2.5,etc.
2
1or
2
1

Survivalanalysismethodsperformbetterthansubstitution
• Survivalanalysismethodsexplicitlyincorporatecensoreddata• Substitutedvalueisarbitrary• No‘invasivedata’addedtotheobservationsmeasured• Noreasontousesubstitutionexceptthatitischeapandeasy
NADAforRpackage
• Performsparametricandnonparametricmethodsforleft-censoreddata
• Consistentfunctionnamesandusage
• Almostallfunctionsbeginwiththeprefix“cen”--forexample,“cenfit”,and“cenmle”
• Genericfunctionssuchas“mean”,“quantile”,and“plot”canbeusedwithoutputobjectsfromanyoftheNADAforRfunctions

Examplecensoreddataset• Pyreneconcentrationsinbenthicsediments.56observations,11censoredat8DLs.FromShe(Journal.AWRA,1997)
HighestRL=174

Enteringandsummarizingdata> ShePyrene Pyrene PyreneCen1 28 TRUE2 31 FALSE3 32 FALSE...
> censummary(ShePyrene)all: n n.cen pct.cen min max 56.00000 11.00000 19.64286 28.00000 2982.00000
limits: limit n uncen pexceed limit n uncen pexceed1 28 1 3 0.9629191 5 117 1 2 0.33254372 35 2 3 0.8516764 6 122 1 5 0.29209183 58 1 10 0.7775146 7 163 3 1 0.19642864 86 1 11 0.5550292 8 174 1 10 0.1785714

PlottingCensoredData> cenboxplot(Pyrene, PyreneCen)
20
50
200
500
2000
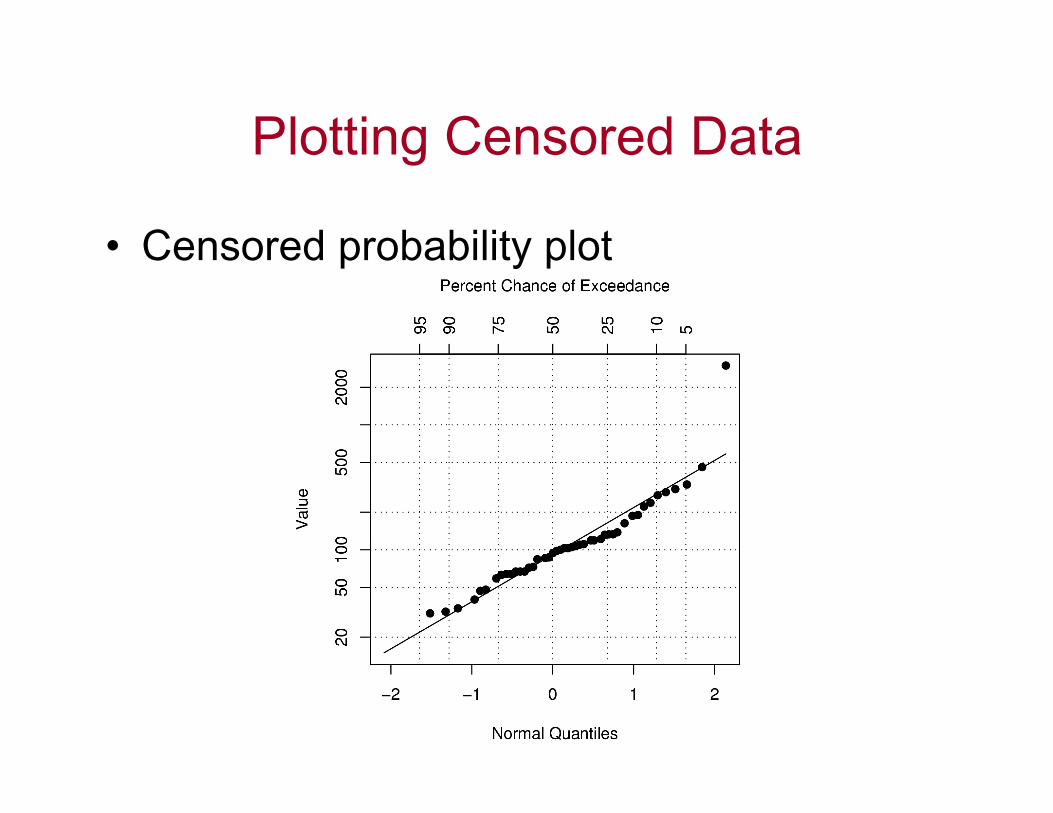
PlottingCensoredData
• Censoredprobabilityplot
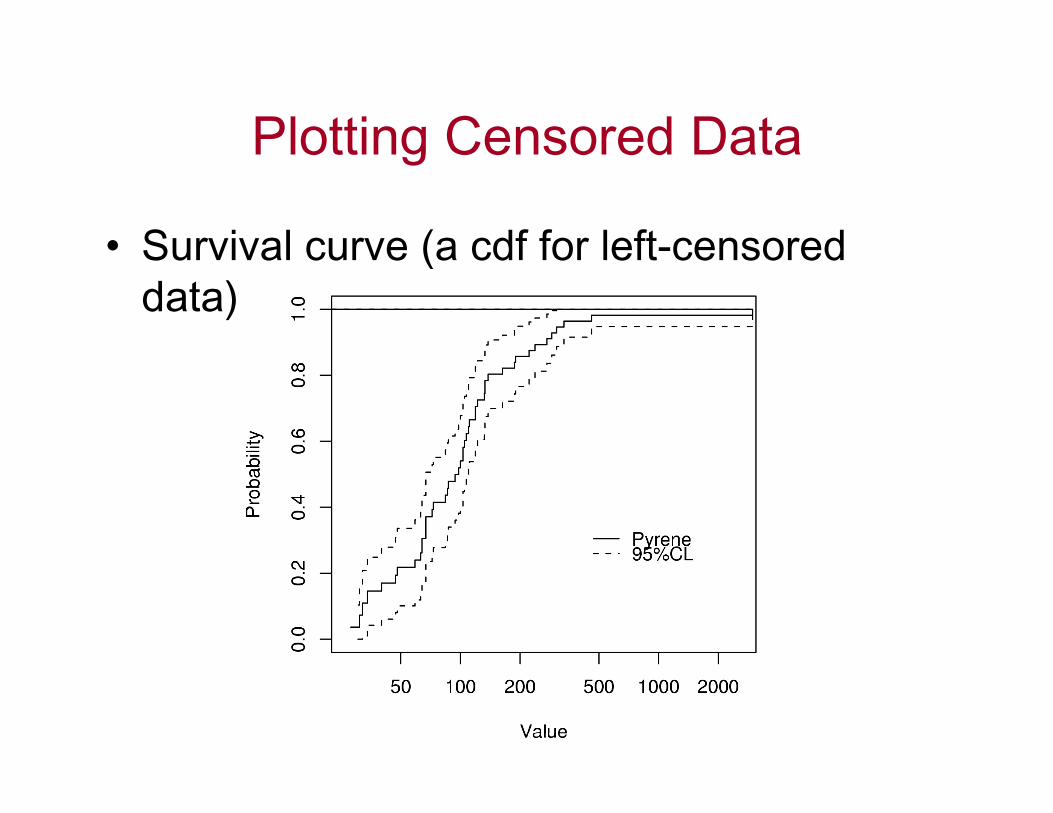
PlottingCensoredData
• Survivalcurve(acdfforleft-censoreddata)

ThreeValidApproachesfortheAnalysisofCensoredData
1. Parametricmethods.Assumedatafollowaspecificdistribution.• Maximumlikelihoodestimation(MLE)
2. “Robust”methods• RegressiononOrderStatistics(ROS)
3. Nonparametricmethods.Basedonpercentiles,ranks.• Kaplan-Meier• Wilcoxonscoretests• Kendall’stau

EstimatingDescriptiveStatisticsMLEforPyrenedata-usingcenmlefunction.Lognormaldistributionisassumedbydefault
> pymle = cenmle(Pyrene, PyreneCen)> pymle n n.cen median mean sd 56.0000 11.0000 90.5000 163.1531 393.1309
> summary(pymle) Value Std. Error z p(Intercept) 4.518 0.122 37.08 6.22e-301Log(scale) -0.138 0.106 -1.30 1.94e-01
Scale= 0.871
Log Normal distribution

ParametricMethod:MLECheckresidualstoseeiftheyfollowalognormaldistribution
> plot(pymle)

EstimatingDescriptiveStatistics
RobustRegressiononOrderStatistics(ROS)
ROSisnotstronglysensitivetochoiceofdistribution.Cancheckwithprobabilityplot.
> pyros = cenros(Pyrene, PyreneCen)> pyros
n n.cen median mean sd 56.0000 11.0000 90.5000 163.1531 393.1309

RegressiononOrderStatistics> plot(pyros)
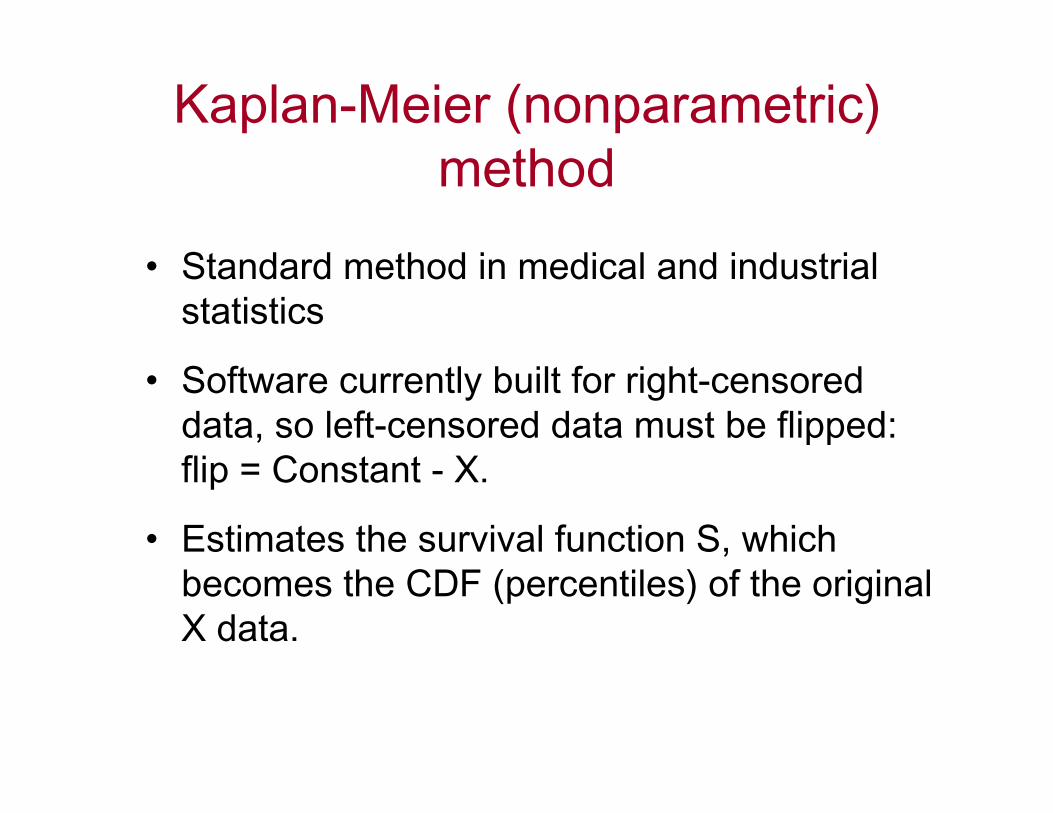
Kaplan-Meier(nonparametric)method
• Standardmethodinmedicalandindustrialstatistics
• Softwarecurrentlybuiltforright-censoreddata,soleft-censoreddatamustbeflipped:flip=Constant-X.
• EstimatesthesurvivalfunctionS,whichbecomestheCDF(percentiles)oftheoriginalXdata.
Conc
Pe
rce
nt
483624120
60
50
40
30
20
10
0
Nondetects in shaded bar
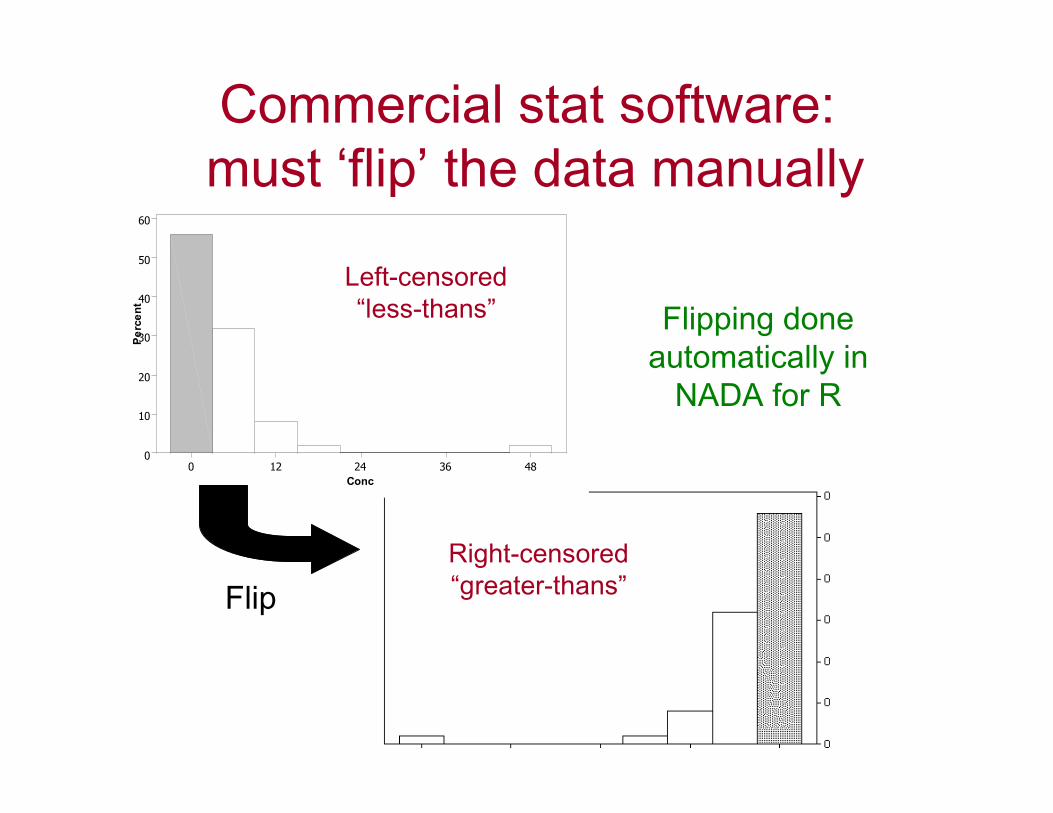
Commercialstatsoftware:must‘flip’thedatamanually
Left-censored“less-thans”
Right-censored“greater-thans”Flip
FlippingdoneautomaticallyinNADAforR

EstimatingDescriptiveStatistics
Kaplan-Meierusingcenfitcommand
Cenfitisisanalgoustothe"survfit"functioninthesurvivalpackage
pykm = cenfit(Pyrene, PyreneCen)
> pykm n n.cen median mean sd 56.0000 11.0000 98.0000 164.0945 389.5899

EstimatingDescriptiveStatisticsK-Msurvivalcurve
> Plot (pykm)

EstimatingDescriptiveStatistics
All3methodswithcenstats
Noneofthese3methodsrequiredsubstitution
> Pystats =censtats(Pyrene, PyreneCen)> pystats n n.cen pct.cen56.00000 11.00000 19.64286
median mean sdK-M 98.00000 164.0945 389.5899ROS 90.50000 163.1531 393.1309MLE 91.64813 133.9142 142.6698

ANOVAusingcensoredregressionArethese3distributionsthesame,ordifferent?
> cenboxplot(TCEConc, TCECen, Density)
%above5ug/L2009

ANOVAusingcensoredregression> tcemle = cenmle(TCEConc, TCECen, Density)> summary(tcemle) Value Std. Error z p(Intercept) -0.722 0.416 -1.73 8.28e-02DensityLow -3.060 1.138 -2.69 7.17e-03DensityMedium -1.656 0.553 -2.99 2.76e-03Log(scale) 1.048 0.111 9.41 4.76e-21Scale= 2.85
Log Normal distributionLoglik(model)= -308.7Loglik(intercept only)= -316.4Loglik-r: 0.2459125Chisq= Chisq= 15.41 on 2 degrees of freedom, p= 0.0004515.41 on 2 degrees of freedom, p= 0.00045

Wilcoxontestswithcensoreddata
Nonparametric
> cendiff(TCEConc, TCECen, Density)
N Observed Expected (O-E)^2/E (O-E)^2/V
Dens=High 92 30.45 18.2 8.26 15.65
Dens=Low 25 1.73 5.7 2.76 3.62Dens=Med 130 15.47 23.8 2.89 6.76
Chisq= 16.3 on 2 degrees of freedom, p= 0.000295

Wilcoxontestsforcensoreddata
Scoretestlooksfordifferencesamongsurvivalcurves(cdfs)forthethreeland-usegroups.
Differin80-99thpercentiles

Correlationandregressionwithcensoreddata
IsthereacorrelationbetweenDissolvedIronandYear?
Whatequationbestdescribesthetrend?
> cenxyplot(Year, YearCen, Summer, SummerCen)

ParametricCensoredRegression> cenreg(Cen(Summer, SummerCen)~Year)
Value Std. Error z p(Intercept) 507.472 106.3237 4.77 1.82e-06
Year -0.255 0.0537 -4.76 1.97e-06Log(scale) -1.118 0.4106 -2.72 6.48e-03
Scale= 0.327 cenreg is analogous to survreg in the survival package. Data areLog Normal distribution flipped within cenreg.Loglik(model)= -9.3 Loglik(intercept only)= -12.8Loglik-r: 0.7371631
Chisq= 7.06 on 1 degrees of freedom, p= 0.0079

ATSnonparametriclineforcensoreddata
Nonparametricapproach:ATSversionofThiel-Senrobustline(basedonKendall’stau)
> cenken(Summer, SummerCen, Year)
slope[1] -2.572113
intercept[1] 5103.5
tau[1] -0.3611111
p[1] 0.1315868

ATSnonparametriclineforcensoreddata
> cenxyplot(Year, YearCen, Summer, SummerCen)> lines(cenken(Summer, SummerCen, Year))

NondetectsAndDataAnalysisStatisticsforCensoredEnvironmentalData
byDennisR.HelselWiley(2005)
www.PracticalStats.com/nada
Moredetailisavailableinthetextbook: