nadi, fiji, 16-17 september 2009 measuring standardization capability of developing countries kang,...
TRANSCRIPT

Nadi, Fiji, 16-17 September 2009
Measuring Standardization Capability of developing countries
Kang, Shin-WonProfessor
Sunchon National University
ITU-T FORUM ON IMPLEMENTATION OF WTSA-08 DECISIONS
AND
WORKSHOP ON BRIDGING THE STANDARDIZATION GAP
(Nadi, Fiji, 16-17 September 2009)

Nadi, Fiji, 16-17 September 2009 2/16
Contents
1. Overview
2. Influential Factors on the Standardization Gap of Developing Countries
3. Standardization Capacity Measurement Model for Developing Countries
4. Method of Measurement of SCI (Standardization Capability Index) of Developing Countries
5. Conclusion

Nadi, Fiji, 16-17 September 2009 3/16
I. Overviewo The ITU-T is aware of the importance of bridging the standardization gap between developed and developing countries, and makes diverse efforts to address this problem. o It is imperative to strengthen the standardization capability of developing countries. It is also necessary to confirm activities for strengthening standardization capabilities and to propose the related improvement measures.
o This raises the need to identify various factors that influence standardization capabilities, and to devise a composite index reflecting all of these factors. o Thus, as part of the KCC-ITU joint project aimed at bridging the standardization gap, the ITU-TTA jointly developed indicators to measure the standardization capability of developing countries.
o This presentation aims to identify and measure the standardization capability of developing countries, and to efficiently bolster their standardization capability and bridge the
standardization gap.

Nadi, Fiji, 16-17 September 2009 4/16
II. Influential Factors on the Standardization Gap of Developing Countries
o As discussed at the ITU meetings, the key variables that influence the standardization gap of developing countries are outlined as follows.
□ Human Resourceso According to ITU Resolution 123, the standardization gap is the result of a lack of human resources, which leads to an imbalance in the application of interfaces between developed and developing countries.
□ ICT Infrastructure o According to ITU Resolution 123, the digital divide influences the causes of the standardization gap and its expansion. This digital divide can be measured in terms of an imbalance in the access to ICT.
□ Policy and Regulationo According to the presentation made by Patrick MASAMBU at the GSS (Global Standards Symposium), the standardization gap is influenced by
the government's regulation policy on standardization.

Nadi, Fiji, 16-17 September 2009 5/16
□ Implementation Systemo In its presentation at the GSS, ETRI emphasized the importance of the government's systematic efforts to bridge the standardization gap. - To execute standardization efficiently, the government is responsible for the standardization work, while the TTA is in charge of standardization activities carried out on the basis of standardization experts' contributions or of its own contributions to international standardization organizations. - Korea is providing systematic support for the development of ICT standards and ICT standardization activities.
□ International Standardization ActivityO ITU explains that, to bridge the standardization gap, gradual steps need to be taken according to each individual country's level of standardization; he explains such gradual steps by conceptualizing "the Standardization Development Ladder." - Step 1: Increase the application of recommendations and the use of websites.- Step 2: Encourage national training and capacity-building in use of R.- Step 3: Pursue ITU sector and associate membership. - Step 4: Participate in study groups and related meetings.- Step 5: Attracting ITU meeting/establish regional groups to foster participation.- Step 6: Giving contributions at study groups and related meetings.- Step 7: Nominate representatives as study group chairs, vice chairs, etc. - Step 8: Enter proposals at WTSA on future study questions and work programs.

Nadi, Fiji, 16-17 September 2009 6/16
III. Standardization Capability Measurement Model for Developing Countries
o As evidenced in many researches, a tool for analyzing a country's standardization capability objectively and systematically is needed, and it is deemed to be the standardization capability index (SCI).
□ Configuration System of SCIo Standardization capability components comprise those from the many existing researches conducted by the WEF, IDC, EIU, ITU, and the UN. - Namely, SCI, SCCI (Standardization Capability Component Index), and SCMI (Standardization Capability Measurement Indicators).
o The configuration of SCI components are follows as; - SCI is an index used to identify the overall standardization level of a developing country. It involves weighting SCCI. - SCCI is used to identify the standardization capability of each component, and they are calculated on the basis of SCMI. - SCMI comprises qualitative or quantitative measurement indicators that can explain the SCCI.
o Thus, the SCCI can be measured using SCMI, while the SCI can be
measured using the SCCI.

Nadi, Fiji, 16-17 September 2009 7/16
Standardization Capability Index
(SCI)
Standardization Capability
Component Indices
(SCCI)
Standardization Capability
Measurement Indicators (SCMI)
[Figure 1] Configuration System of SCI

Nadi, Fiji, 16-17 September 2009 8/16
□ Configuration System of SCCI (Standardization Capability Component Index) o This research reflected the existing ITU discussions in defining the indices and indicators designed to measure the levels of standardization capability.
o Also, the SCI development considered six components to measure
the overall levels of standardization capability holistically and accurately.
SCI
Government Standards
Policy National Standards Use and Adoption
Involvement with ITU
Standards Setting
ICT Infrastructure
Standards development
Capacity
Standardization Human
Resources
[Figure 2] Configuration of SCSI

Nadi, Fiji, 16-17 September 2009 9/16
□ Configuration of SCMI (Standardization Capability Measurement Indicators) o SCI could be generally measured by a government's investment in standardization, the level of standardization human resources, the level of established domestic standards, and the government's role and contribution to international standardization organizations.
o However, these quantitative indicators alone cannot accurately measure the standardization capability of developing countries. Therefore qualitative indicators are needed.
o Also, to measure standardization capability more accurately, and to examine standardization capability by sector, measurement components indices are needed.
o Thus, SCI was measured on the basis of quantitative and qualitative indicators, and the standardization capability sector was examined in six components.- Since standardization concerns numerous components, the six components were defined to measure their respective levels of standardization capability.

Nadi, Fiji, 16-17 September 2009 10/16
Standardization
Development Capacity
1) Existence of a national ICT standards body and/or standardization committee? (5-point scale)2) Participation in international ICT standards development processes (e.g. ITU, ISO, IEEE, IETF, W3C) (5-point scale)3) Participation in regional ICT standards development processes (5-point scale)4) Private industry involvement in ICT standards development (5-point scale) 5) Adequacy of technical infrastructure to participate in ICT standards development (5-point scale) 6) Number of domestic standards in past year (statistical data: SD)7) Number of patent applications filed in past year (SD)8) Number of ICT R&D institutions in country (SD)Standardizat
ion Human Resources
1) How many individuals are engaged in domestic standardization organizations? (SD)2) How many standards experts would you estimate your country has? (SD)3) How many standards experts in your country are from the business/private sector? (SD)4) Other ICT standards body training held in country in past year (SD)5) ICT standards conferences held in country in past year (SD)6) Access to electronic training courses and materials (5-point scale)7) Availability of government-sponsored ICT standards training (5-point scale)8) ICT standards courses and curricula in higher education (e.g. engineering courses), either in the country or region (5-point scale)
<Table 1> Configuration of Standardization Capability Component Indices and
Its Measurement Indicators

Nadi, Fiji, 16-17 September 2009 11/16
National Standardization Use and
Adoption
1) Government interoperability framework or ICT standards procurement policy (5-point scale)2) Adequacy of technical infrastructure for accessing standards for those involved in implementing standards (5-point scale) 3) National use of ITU Recommendations, either in product procurement or development (SD)4) Increasing development of technology products and market share based on international ICT standards (SD)
Government Standards
Policy
1) Existence of national procedures for developing standards by
government or standardization organization (5-point scale)
2) Existence of a national ICT standards agency, department, or
advisory council (5-point scale)3) Existence of a national ICT standards strategy (5-point
scale)4) Government Laws, regulation and policies on ICT
standards (5-point scale)5) Government funding and investment in ICT
standardization (SD)

Nadi, Fiji, 16-17 September 2009 12/16
ICT Infrastructur
e
◇ PC1) Number of PCs? (SD)
◇ Internet2) Number of Internet subscribers? (SD)3) Number of broadband Internet subscribers? (SD)4) Number of wireless Internet subscribers? (SD)5) Number of Internet security servers? (SD)6) Number of Internet hosts? (SD)7) International Internet bandwidth? (SD)8) Number of WiFi hotspots? (SD)
◇ Telecommunications9) Number of wire telephony subscribers? (SD)10) Number of mobile telephony subscribers? (SD)
◇ Broadcasting11) Number of TVs? (SD)12) Number of cable TV subscribers? (SD)
Involvement with ITU
Standards Setting
1) Number of ITU TIES accounts (SD)2) Total number of ITU sector members and associate members (SD)3) Number of ITU recommendations downloaded in past year (SD)4) Number of participation in ITU meetings, study groups, and focus groups (meeting) in past year (SD)5) Number of participants in ITU meetings, study groups, and focus groups (meeting) in past year (SD)6) Number of contributions submitted to the ITU in past year (SD)7) Number of ITU officials (chairpersons, vice chairpersons, rapporteurs, etc.) (SD)8) Total number of conferences (meeting) and workshops for ITU international standardization held in past year (SD)
Nadi, Fiji, 16-17 September 2009 13/16
IV. Method of Measurement of SCI of Developing Countries
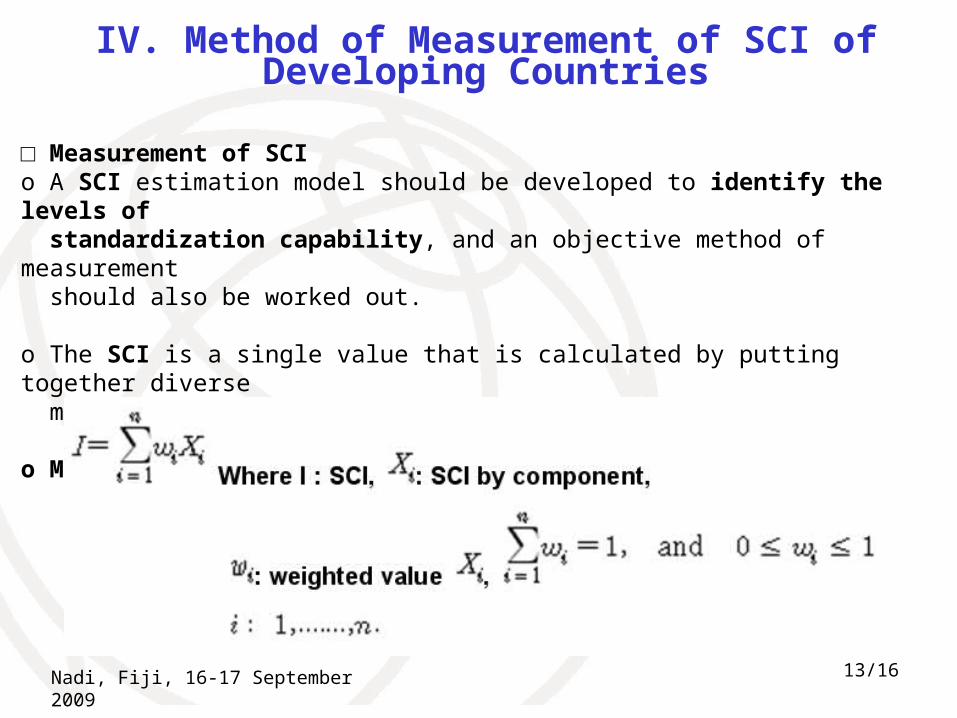
□ Measurement of SCI o A SCI estimation model should be developed to identify the levels of standardization capability, and an objective method of measurement should also be worked out.
o The SCI is a single value that is calculated by putting together diverse measurement indicators.
o Measurement of SCI

Nadi, Fiji, 16-17 September 2009 14/16
o SCMI: In the case of quantitative (statistical) data- In comparison with the developing country which has the highest capability level, or with the ITU's prescribed reference value, the values of other developing countries' standardization indicators are examined and these countries' standardization capability items are measured. - 100 * (Comparable Actual Value / Reference Maximum Value) o SCMI: In the case of qualitative data- Each detailed measurement indicator can be calculated using the following equation on the basis of the answers to a 5-point scale survey. - Indicator = (number of No. 1 answers ×100 + number of No. 2 answers×75 + number of No. 3 answers×50 + number of No. 4 answers×25 + number of No. 5 answers×0) / total number of answers - When the indicator is the reference value 50, this means that the number of both positive and negative answers to the questions is equal; more than 50 means a higher number of positive answers than negative
answers; under 50 means a higher number of negative answers.
Nadi, Fiji, 16-17 September 2009 15/16
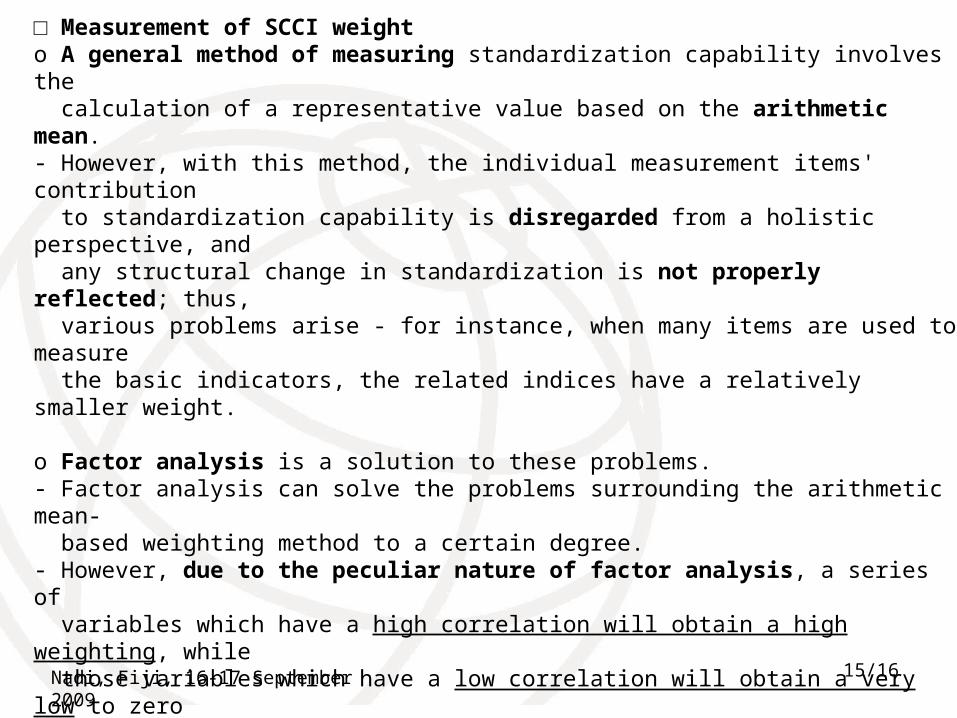
□ Measurement of SCCI weight o A general method of measuring standardization capability involves the calculation of a representative value based on the arithmetic mean. - However, with this method, the individual measurement items' contribution to standardization capability is disregarded from a holistic perspective, and any structural change in standardization is not properly reflected; thus, various problems arise - for instance, when many items are used to measure the basic indicators, the related indices have a relatively smaller weight.
o Factor analysis is a solution to these problems. - Factor analysis can solve the problems surrounding the arithmetic mean- based weighting method to a certain degree. - However, due to the peculiar nature of factor analysis, a series of variables which have a high correlation will obtain a high weighting, while those variables which have a low correlation will obtain a very low to zero weighting.
o Thus, in this report, the Delphi method, which is a method of weighting based on the judgment of ITU standardization experts, is proposed to minimize these problems and to rationalize the weighting of SCCI.
o The Delphi method - in the event there is a lack of generalized and standardized data on the current status - is a prediction technique which
can objectify expert tuition. It is widely used.

Nadi, Fiji, 16-17 September 2009 16/16
VI. Conclusiono This report aims to measure and identify developing countries' standardization capability levels, and thus to bolster their standardization capability efficiently and bridge the standardization gap.
o Six components indices by sector were introduced to identify which of the component is crucial or important to the SCI. - This segmentation enables a more efficient comparative analysis of the component indices, and thus is expected to play a significant role in bridging the gap between the components. - Current and future standardization capability can be measured using qualitative and quantitative indicators, and thus a more efficient and future-oriented standardization capability can be bolstered. - Since it is very important to secure reliable data in measuring the standardization of developing countries, 45 measurement indicators were strictly selected by considering the practicality and applicability of said indicators above all else.
o Further considerations/discussions are as follows: - In this report, 45 measurement indicators were established, but efforts should be made to increase the number of such indicators with a view to measuring standardization capability more accurately. - Qualitative data may differ according to the respondents, and efforts should be made to enhance the reliability of the survey results.

Nadi, Fiji, 16-17 September 2009 17/16
Thank You

Nadi, Fiji, 16-17 September 2009 18/16
Appendix: SCI Measurement
Q A B C D Q A B C D
SDC 1 5.0 4.0 2.5 1.0 SDC 1 100 80 50 20
2 4.5 4.0 2.5 2.0 2 100 89 56 44
3 4.5 4.0 3.0 1.0 3 100 89 67 22
4 4.0 4.0 2.0 1.0 4 100 100 50 25
5 4.5 3.0 2.0 1.0 5 100 67 44 22
6 5.0 4.0 0.0 1.0 6 100 80 0 20
7 5.0 3.0 0.0 1.0 7 100 60 0 20
8 4.0 0.0 0.0 0.0 8 100 0 0 0

Nadi, Fiji, 16-17 September 2009 19/16
SHR 1 2.0 2.0 0.0 3.0 SHR 1 100 100 0 150
2 2.0 3.0 3.0 1.0 2 100 150 150 50
3 4.0 3.0 0.0 1.0 3 100 75 0 25
4 3.5 4.0 0.0 1.0 4 100 114 0 29
5 4.5 3.0 0.0 4.0 5 100 67 0 89
6 3.5 4.0 0.0 1.0 6 100 114 0 29
7 4.0 4.0 0.0 1.0 7 100 100 0 25
8 4.0 4.0 0.0 1.0 8 100 100 0 25
Appendix: SCI Measurement

Nadi, Fiji, 16-17 September 2009 20/16
GSP 1 4.5 4.0 0.0 1.0 GSP 1 100 89 0 22
2 3.0 4.0 0.0 1.0 2 100 133 0 33
3 4.5 4.0 0.0 1.0 3 100 89 0 22
4 4.5 3.0 0.0 3.0 4 100 67 0 67
5 5.0 2.0 0.0 1.0 5 100 40 0 20
Appendix: SCI Measurement
Nadi, Fiji, 16-17 September 2009 21/16
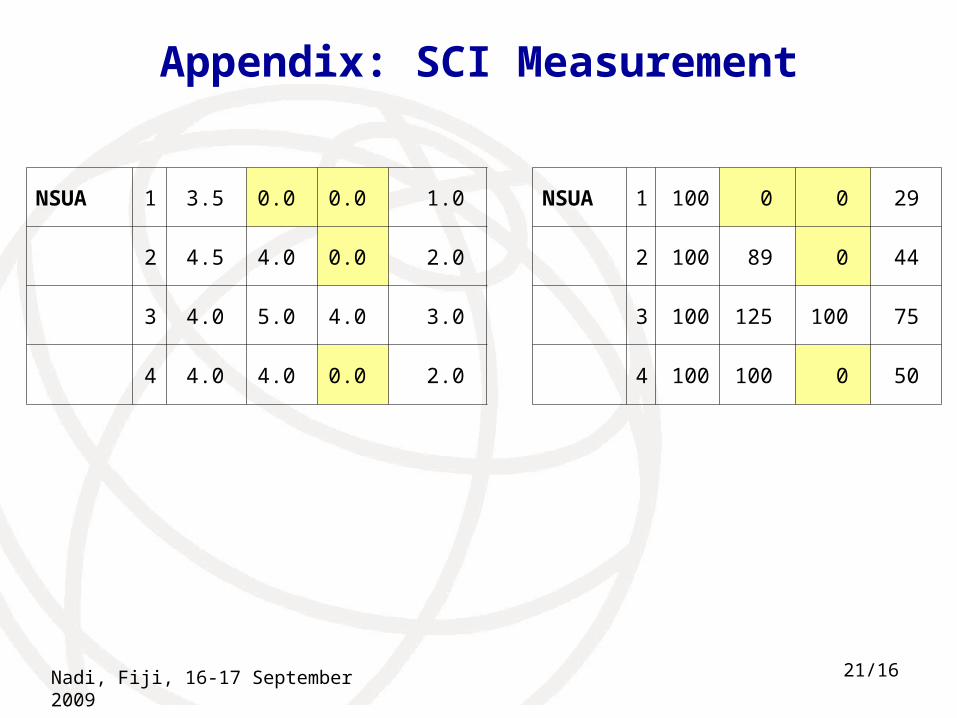
NSUA 1 3.5 0.0 0.0 1.0 NSUA 1 100 0 0 29
2 4.5 4.0 0.0 2.0 2 100 89 0 44
3 4.0 5.0 4.0 3.0 3 100 125 100 75
4 4.0 4.0 0.0 2.0 4 100 100 0 50
Appendix: SCI Measurement

Nadi, Fiji, 16-17 September 2009 22/16
ITU_SS 1 0.0 0.0 0.0 0.0 ITU_SS 1 0 0 0 0
2 2.9 0.2 0.9 1.6 2 100 6 31 54
3 0.0 0.0 0.0 0.0 3 0 0 0 0
4 0.0 0.0 0.0 0.0 4 0 0 0 0
5 0.0 0.0 0.0 0.0 5 0 0 0 0
6 0.0 0.0 0.0 0.0 6 0 0 0 0
7 0.0 0.0 0.0 0.0 7 0 0 0 0
8 0.0 0.0 0.0 0.0 8 0 0 0 0
Appendix: SCI Measurement

Nadi, Fiji, 16-17 September 2009 23/16
ICT
1 80.0 39.1 27.2 0.0 ICT 1 100 49 34 0
2 77.8 22.3 20.0 1.0 2 100 29 26 1
3 32.1 3.2 1.4 0.0 3 100 10 4 0
4 0.0 0.0 0.0 0.0 4 0 0 0 0
5 0.0 0.0 0.0 0.0 5 0 0 0 0
6 0.0 0.0 0.0 0.0 6 0 0 0 0
7 103377 27585 32754 0.0 7 100 27 32 0
8 0.0 0.0 0.0 0.0 8 0 0 0 0
9 139.0 68.7 89.6 26.4 9 100 49 64 19
10 94.7 18.6 92.0 25.7 10
100 20 97 27
11 0.0 0.0 0.0 0.0 11
0 0 0 0
12 57.9 1.4 0.0 0.0 12
100 2 0 0
Appendix: SCI Measurement
Nadi, Fiji, 16-17 September 2009 24/16
A B C D
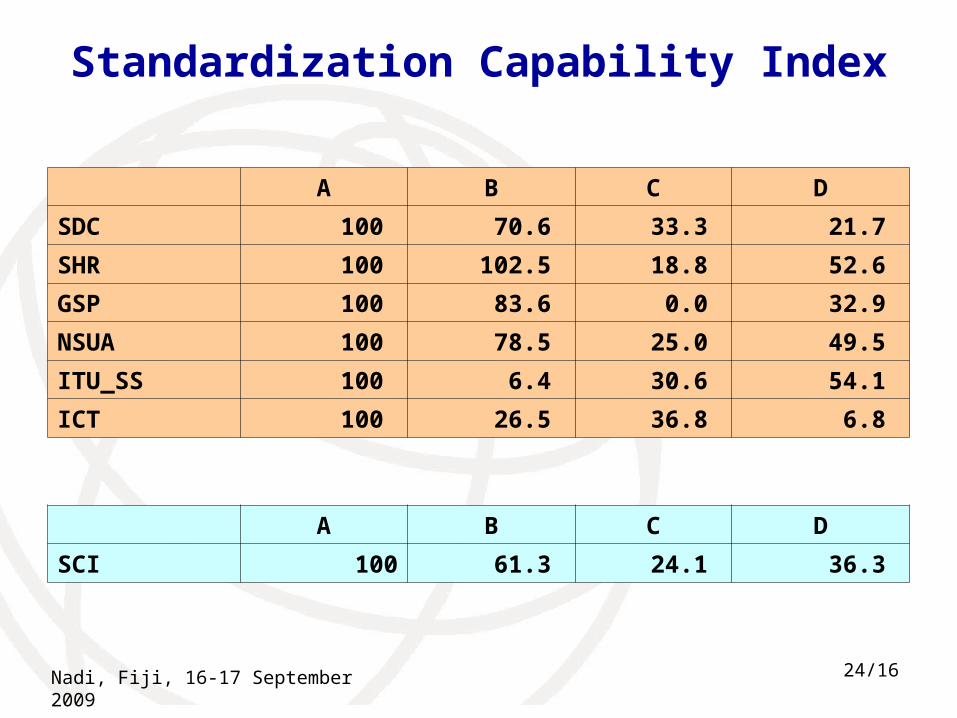
SDC 100 70.6 33.3 21.7
SHR 100 102.5 18.8 52.6
GSP 100 83.6 0.0 32.9
NSUA 100 78.5 25.0 49.5
ITU_SS 100 6.4 30.6 54.1
ICT 100 26.5 36.8 6.8
A B C D
SCI 100 61.3 24.1 36.3
Standardization Capability Index