naga city disaster mitigation plan - adpc.net · wealth of knowledge in the form of hazard maps,...
TRANSCRIPT
Naga City Disaster Mitigation Plan
Working Paper #5
August 2001
Prepared by the
Philippines Cities
Disaster Mitigation Project
under the
Asian Urban Disaster Mitigation Program
Bangkok, Thailand www.adpc.ait.ac.th
Asian Disaster Preparedness Center
Asia
n U
rba
n D
isa
ste
r M
itig
atio
n P
rog
ram
The Philippines Cities Disaster Mitigation Project was launched in January 1997 withthe objective of reducing the vulnerability of two cities to natural hazards, beginning withmitigation of floods in Naga city and followed by multi-hazard mitigation in San Carlos.In addition to hazard mapping and mitigation planning, the project will emphasize landuse planning, the formation of disaster management standards, and the training ofprofessionals from urban areas. The cascade city component will encourage replicationof lessons to other vulnerable cities in the Philippines.
This paper is published under the Asian Urban Disaster Mitigation Program for sharingknowledge and experiences from national demonstration projects on disaster mitigationin target countries of Asia. It is made available by the Asian Disaster PreparednessCenter, Bangkok, Thailand, with minimal editing. The opinions expressed herein arethose of the author and do not necessarily reflect the views of Asian DisasterPreparedness Center or the U.S. Agency for International Development. Publication ofthis paper was made possible through support provided by the Office of Foreign DisasterAssistance, United States Agency for International Development, under the terms ofCooperative Agreement No. 386-A-00-00-00068.
The contents of this paper may be freely quoted with credit given to the implementinginstitution, Asian Disaster Preparedness Center and to the Office of Foreign DisasterAssistance of the U.S. Agency for International Development.
Copyright © ADPC 2001
AUDMP Working Paper #5
Naga City Disaster MitigationPlan
August 2001
Prepared by
Naga City GovernmentPhilippines Business for Social Progress
under the
Philippines CitiesDisaster Mitigation Project
ii
Asian Disaster Preparedness CenterBangkok, Thailand www.adpc.ait.ac.th
Acknowledgements
It is with great pleasure that ADPC presents the working paper on Naga City DisasterMitigation Plan prepared by the Philippines Cities Disaster Mitigation Project (PCDMP).The PCDMP is one of the national demonstration projects under the Asian Urban DisasterMitigation Program (AUDMP). The AUDMP, which is currently being implemented inBangladesh, Cambodia, Laos, India, Indonesia, Nepal, Philippines, Sri Lanka, and Thailand,has demonstrated successful methodologies and approaches in mitigating the impact of thenatural disasters in the region. During implementation of the national demonstrationprojects by country partners, there has been continuous building of knowledge and experienceemanating from the country projects. The national demonstration projects have producedwealth of knowledge in the form of hazard maps, reports, proceedings, review of policies,documentation of various events and activities, etc.
The purpose of making this paper available is to share the knowledge and experiences withthose attempting to develop similar plans for disaster management in their respective cities.
The PCDMP is implemented by the Naga City Government and the Philippines Business forSocial Progress (PBSP). The project has successfully demonstrated an approach fordeveloping mitigation plan by identifying hazards and by analyzing and assessing risks. Inaddition to hazard mapping and mitigation planning, the project emphasizes on land useplanning and formation of disaster management standards for redcing the impacts ofdisasters.
ADPC congratulates both the Naga City Government and the PBSP for successfullyimplementing the activities under the demonstration phase. ADPC appreciates the effortsmade by the project in reducing the loss of lives and damage of properties from devastatingdisasters.
We hope that you will find this report useful and we look forward to receiving yourcomments.
Dr. Suvit YodmaniExecutive DirectorAsian Disaster Preparedness CenterBangkok, Thailand
August 2001
iii
Table of Contents
Page No.
LIST OF TABLES V
LIST OF FIGURES VI
LIST OF ACRONYMS VII
CHAPTER 1 – INTRODUCTION AND SCOPE OF THE STUDY
1.1 PROJECT BACKGROUND …………….………………………………… 1
1.2 SCOPE OF THE STUDY ………………….………………………………. 1
1.3. EXISTING STUDIES AND DATA COLLECTION EFFORTS ……….. 2
1.4 APPROACH AND METHODOLOGY FOR THE STUDY ……….……. 4
1.5 PLANNING ORGANIZATION AND STRATEGIES …………….…….. 7
CHAPTER 2 – PROJECT SETTING
2.1 PROJECT LOCATION …………………………………………………… 9
2.2 CLIMATE AND WEATHER …………………………………………….. 9
2.3 EXISTING LAND USE: WHYS AND WHERE FROMS ……………….. 11
2.4 GENERAL SOCIO-ECONOMIC FEATURES …………………………. 13
2.5 EXISTING FLOOD CONTROL STRUCTURES AND FACILITIES …. 18
2.6 EXISTING DISASTER MITIGATION ORGANIZATIONAND MANAGEMENT STRUCTURE ...……………………...…………. 19
2.7 EXISTING DISASTER MITIGATION MEASURES …………………... 21
iv
CHAPTER 3 – HAZARD IDENTIFICATION AND ASSESSMENT
3.1 FLOODING AND TYPHOON HAZARD OCCURRENCE ……………. 31
3.2 LAND USE AND FLOODING ……………………………………………. 40
CHAPTER 4 – RISK ASSESSMENT
4.1 CONSEQUENCE ANALYSIS …………………………………………… 67
4.2 VULNERABILITY AND RISK ANALYSIS ………………………….. 72
CHAPTER 5 – MITIGATION MEASURES AND MANAGEMENTPLAN
5.1 PLANNING ASSUMPTIONS ………………………………………….. 99
5.2 PHYSICAL/CIVIL WORKS DEVELOPMENT PROGRAM ……….. 99
5.3 LAND USE POLICY/LEGAL REFORMS PROGRAM ……………... 107
5.4 INSTITUTIONAL DEVELOPMENT PROGRAM ………………….. 122
5.5 ORGANIZATION AND MANAGEMENT …………………………… 138
5.6 PLAN EVALUATION ………………………………………………….. 139
v
List of TablesPage No.
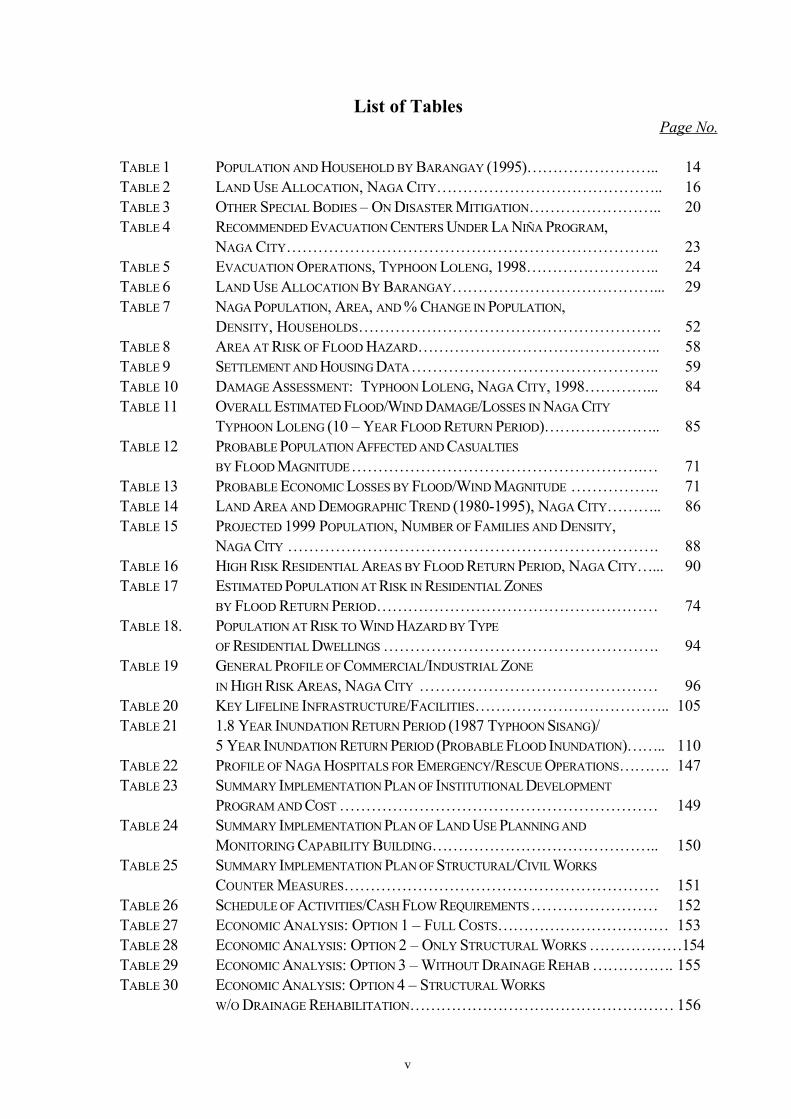
TABLE 1 POPULATION AND HOUSEHOLD BY BARANGAY (1995)…………………….. 14TABLE 2 LAND USE ALLOCATION, NAGA CITY…………………………………….. 16TABLE 3 OTHER SPECIAL BODIES – ON DISASTER MITIGATION…………………….. 20TABLE 4 RECOMMENDED EVACUATION CENTERS UNDER LA NIÑA PROGRAM,
NAGA CITY…………………………………………………………….. 23TABLE 5 EVACUATION OPERATIONS, TYPHOON LOLENG, 1998…………………….. 24TABLE 6 LAND USE ALLOCATION BY BARANGAY…………………………………... 29TABLE 7 NAGA POPULATION, AREA, AND % CHANGE IN POPULATION,
DENSITY, HOUSEHOLDS…………………………………………………. 52TABLE 8 AREA AT RISK OF FLOOD HAZARD……………………………………….. 58TABLE 9 SETTLEMENT AND HOUSING DATA……………………………………….. 59TABLE 10 DAMAGE ASSESSMENT: TYPHOON LOLENG, NAGA CITY, 1998…………... 84TABLE 11 OVERALL ESTIMATED FLOOD/WIND DAMAGE/LOSSES IN NAGA CITY
TYPHOON LOLENG (10 – YEAR FLOOD RETURN PERIOD)………………….. 85TABLE 12 PROBABLE POPULATION AFFECTED AND CASUALTIES
BY FLOOD MAGNITUDE……………………………………………….… 71TABLE 13 PROBABLE ECONOMIC LOSSES BY FLOOD/WIND MAGNITUDE …………….. 71TABLE 14 LAND AREA AND DEMOGRAPHIC TREND (1980-1995), NAGA CITY……….. 86TABLE 15 PROJECTED 1999 POPULATION, NUMBER OF FAMILIES AND DENSITY,
NAGA CITY ……………………………………………………………. 88TABLE 16 HIGH RISK RESIDENTIAL AREAS BY FLOOD RETURN PERIOD, NAGA CITY…... 90TABLE 17 ESTIMATED POPULATION AT RISK IN RESIDENTIAL ZONES
BY FLOOD RETURN PERIOD……………………………………………… 74TABLE 18. POPULATION AT RISK TO WIND HAZARD BY TYPE
OF RESIDENTIAL DWELLINGS ……………………………………………. 94TABLE 19 GENERAL PROFILE OF COMMERCIAL/INDUSTRIAL ZONE
IN HIGH RISK AREAS, NAGA CITY ……………………………………… 96TABLE 20 KEY LIFELINE INFRASTRUCTURE/FACILITIES……………………………….. 105TABLE 21 1.8 YEAR INUNDATION RETURN PERIOD (1987 TYPHOON SISANG)/
5 YEAR INUNDATION RETURN PERIOD (PROBABLE FLOOD INUNDATION)…….. 110TABLE 22 PROFILE OF NAGA HOSPITALS FOR EMERGENCY/RESCUE OPERATIONS………. 147TABLE 23 SUMMARY IMPLEMENTATION PLAN OF INSTITUTIONAL DEVELOPMENT
PROGRAM AND COST …………………………………………………… 149TABLE 24 SUMMARY IMPLEMENTATION PLAN OF LAND USE PLANNING AND
MONITORING CAPABILITY BUILDING…………………………………….. 150TABLE 25 SUMMARY IMPLEMENTATION PLAN OF STRUCTURAL/CIVIL WORKS
COUNTER MEASURES…………………………………………………… 151TABLE 26 SCHEDULE OF ACTIVITIES/CASH FLOW REQUIREMENTS…………………… 152TABLE 27 ECONOMIC ANALYSIS: OPTION 1 – FULL COSTS…………………………… 153TABLE 28 ECONOMIC ANALYSIS: OPTION 2 – ONLY STRUCTURAL WORKS ………………154TABLE 29 ECONOMIC ANALYSIS: OPTION 3 – WITHOUT DRAINAGE REHAB ……………. 155TABLE 30 ECONOMIC ANALYSIS: OPTION 4 – STRUCTURAL WORKS
W/O DRAINAGE REHABILITATION…………………………………………… 156
vi
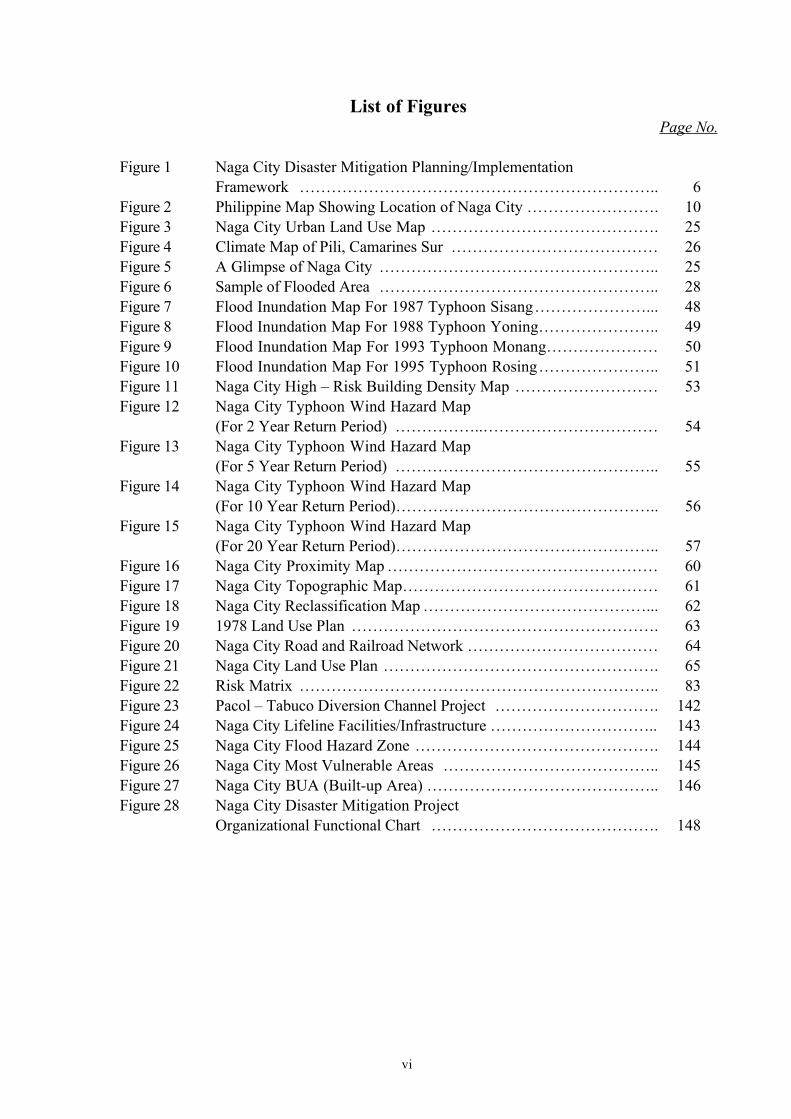
List of FiguresPage No.
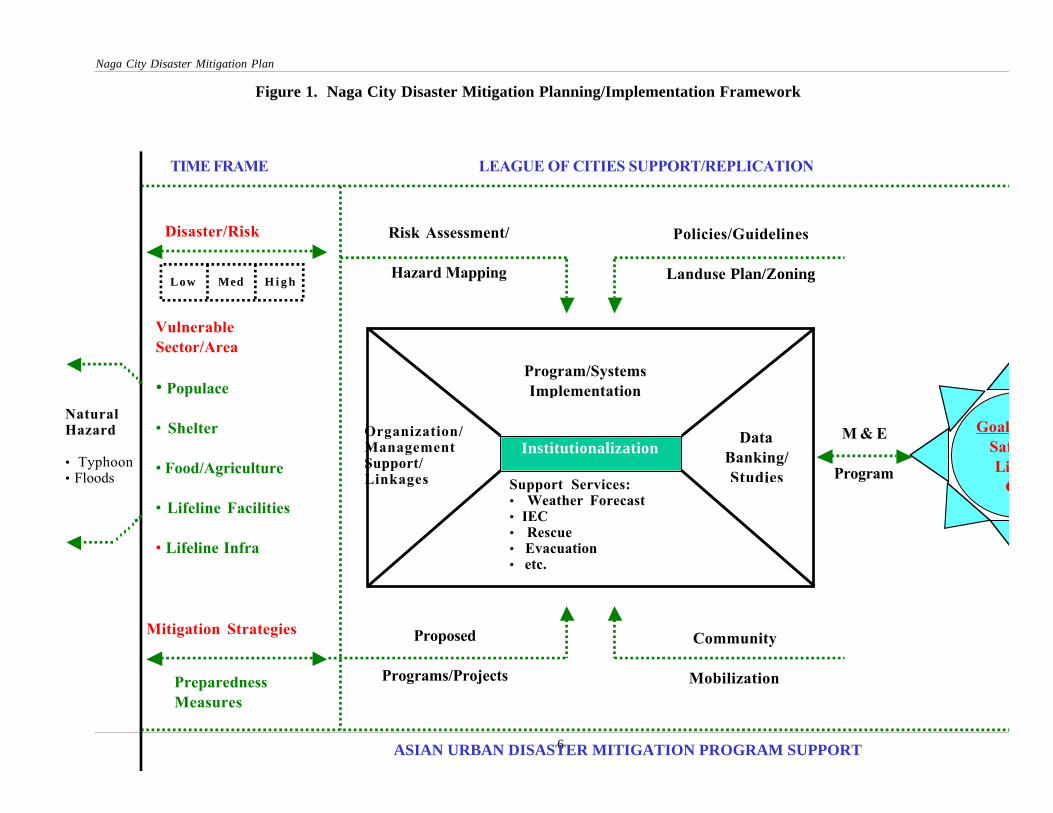
Figure 1 Naga City Disaster Mitigation Planning/ImplementationFramework ………………………………………………………….. 6
Figure 2 Philippine Map Showing Location of Naga City ……………………. 10Figure 3 Naga City Urban Land Use Map ……………………………………. 25Figure 4 Climate Map of Pili, Camarines Sur ………………………………… 26Figure 5 A Glimpse of Naga City …………………………………………….. 25Figure 6 Sample of Flooded Area …………………………………………….. 28Figure 7 Flood Inundation Map For 1987 Typhoon Sisang…………………... 48Figure 8 Flood Inundation Map For 1988 Typhoon Yoning………………….. 49Figure 9 Flood Inundation Map For 1993 Typhoon Monang………………… 50Figure 10 Flood Inundation Map For 1995 Typhoon Rosing………………….. 51Figure 11 Naga City High – Risk Building Density Map ……………………… 53Figure 12 Naga City Typhoon Wind Hazard Map
(For 2 Year Return Period) ……………..…………………………… 54Figure 13 Naga City Typhoon Wind Hazard Map
(For 5 Year Return Period) ………………………………………….. 55Figure 14 Naga City Typhoon Wind Hazard Map
(For 10 Year Return Period)………………………………………….. 56Figure 15 Naga City Typhoon Wind Hazard Map
(For 20 Year Return Period)………………………………………….. 57Figure 16 Naga City Proximity Map …………………………………………… 60Figure 17 Naga City Topographic Map………………………………………… 61Figure 18 Naga City Reclassification Map ……………………………………... 62Figure 19 1978 Land Use Plan …………………………………………………. 63Figure 20 Naga City Road and Railroad Network ……………………………… 64Figure 21 Naga City Land Use Plan ……………………………………………. 65Figure 22 Risk Matrix ………………………………………………………….. 83Figure 23 Pacol – Tabuco Diversion Channel Project …………………………. 142Figure 24 Naga City Lifeline Facilities/Infrastructure ………………………….. 143Figure 25 Naga City Flood Hazard Zone ………………………………………. 144Figure 26 Naga City Most Vulnerable Areas ………………………………….. 145Figure 27 Naga City BUA (Built-up Area) …………………………………….. 146Figure 28 Naga City Disaster Mitigation Project
Organizational Functional Chart ……………………………………. 148
vii
List of Acronyms
ADB Asian Development BankAUDMP Asian Urban Disaster Mitigation ProgramBHAs Barangay Health AidsBIR Bureau of Internal RevenueBRBFCIDP Bicol River Basin Flood Control and Irrigation Development
ProjectBUA Built-Up AreaCARP Comprehensive Agrarian Reform ProgramCBD Central Business DistrictCIPS Community Information Planning SystemCPDO City Planning and Development OfficeCSAT Camarines School of Arts and TradeDA Department of AgricultureDECS Department of Education, Culture and SportsDM Disaster ManagementDMMU Disaster Mitigation Management UnitDPWH Department of Public Works and HighwaysDSWD Department of Social Welfare and DevelopmentEDP Electronic Data ProcessingENRO Environmental and Natural Resources OfficeEO Executive OrderERN Emergency Rescue NagaFEMA Federal Emergency Management AuthorityFHZ Flood Hazard ZoneFIRR Financial Internal Rate of ReturnGIP Government Internship ProgramGIS Geographic Information SystemGOLD Governance and Local DemocracyHa HectaresHLURB Housing and Land Use Regulatory BoardHR High RiskIEC Information and Education CampaignIRR Internal Rate of ReturnJICA Japan International Cooperation Agencykph kilometer per hourLOC League of CitiesLR Low RiskLUPZ Land Use Plan and ZoningMBN Minimum Basic Needsmm millimeterMNWD Metro Naga Water DistrictMR Medium RiskMS Multi Storey
viii
MVA Most Vulnerable AreaNCDCC Naga City Disaster Coordinating CouncilNCDM Naga City Disaster MitigationNCDMC Naga City Disaster Mitigation CouncilNCDMEB Naga City Disaster Mitigation Executive BoardNCDMP Naga City Disaster Mitigation ProjectNCDMPU Naga City Disaster Mitigation Project UnitNGOs Non-Governmental OrganizationsNIA National Irrigation AdministrationNPV Net Present ValueNR No RiskNSO National Statistics OfficeOCD Office of Civil DefenseOIDCI Orient Integrated Development Consultants, Inc.OJT On-the-Job TrainingPAGASA Philippine Atmospheric, Geophysical and Astronomical Services
AdministrationPAR Philippine Area of ResponsibilityPBSP Philippine Business for Social ProgressPD Presidential DecreePNP Philippine National PolicePNR Philippine National RailwayPREMIUM Program for Essential Municipal Infrastructure Utilities
MaintenancePTB Pulmonary Tuberculoses
SEC Securities and Exchange CommissionSL Split LevelS S Single StoreySURP School of Urban and Regional PlanningTA Technical AssistanceTS Two StoreyUP University of the PhilippinesUSAID United States Agency for International Development
CHAPTER I
INTRODUCTION AND SCOPE OF THE STUDY
1.1 PROJECT BACKGROUND
The Naga City Disaster Mitigation Project (NCDMP) is under the umbrella program calledPhilippine Cities Disaster Mitigation Project being implemented by the League of Cities(LOC) and the Philippine Business for Social Progress (PBSP). The Project has financialsupport from the USAID through the Asian Urban Disaster Mitigation Program (AUDMP)implemented by the Asian Disaster Preparedness Center in Bangkok, Thailand.
The Project represents the LOC’s efforts to build safer and more livable cities. The Projectwill help establish awareness on the need for disaster mitigation among cities and promotenew standards at the national and city levels through information campaigns anddemonstration projects, formal education courses, and policy reforms. A major concern ofthe Project will be to identify mitigating measures that will help the urban poor, whilepromoting the importance of awareness and city planning for all potential hazards. As thefirst Model City, the Naga City Project will focus on the need to mitigate disastersparticularly cyclones and flooding. In general, the Project aims to develop Naga as a modelCity for mitigating cyclones and floods. The Project will help strengthen capacity of NagaCity to develop and implement disaster mitigation programs and increase their awareness ondisaster mitigation standards and practices.
1.2 SCOPE OF THE STUDY
The City Government, through its Naga City Disaster Mitigation Project Unit (NCDMPU)and with the assistance of the PBSP, has initiated a massive information and educationcampaign about the project, and in the process generate community participation in gatheringinformation necessary for the formulation of a disaster mitigation plan. It was at this pointthat the Consultancy Services of the Orient Integrated Development Consultants, Inc.(OIDCI) was solicited by the PBSP to assist the City Government of Naga undertake thefollowing:
a) Analyze current situation which involves an assessment of various developmentpolicies, plans and studies, and characterization of risk barangays and populationgroups;
b) Undertake hazard mapping and vulnerability assessment involving a review,updating/validation and analysis/correlation of available hydrological and riverengineering studies and damage assessment data/reports, and hazard map preparation;and
c) Formulate Disaster Mitigation Plan.1.3 EXISTING STUDIES AND DATA COLLECTION EFFORTS
Naga City Disaster Mitigation Plan
1.3.1 Completed Studies in the Bicol River Basin Area
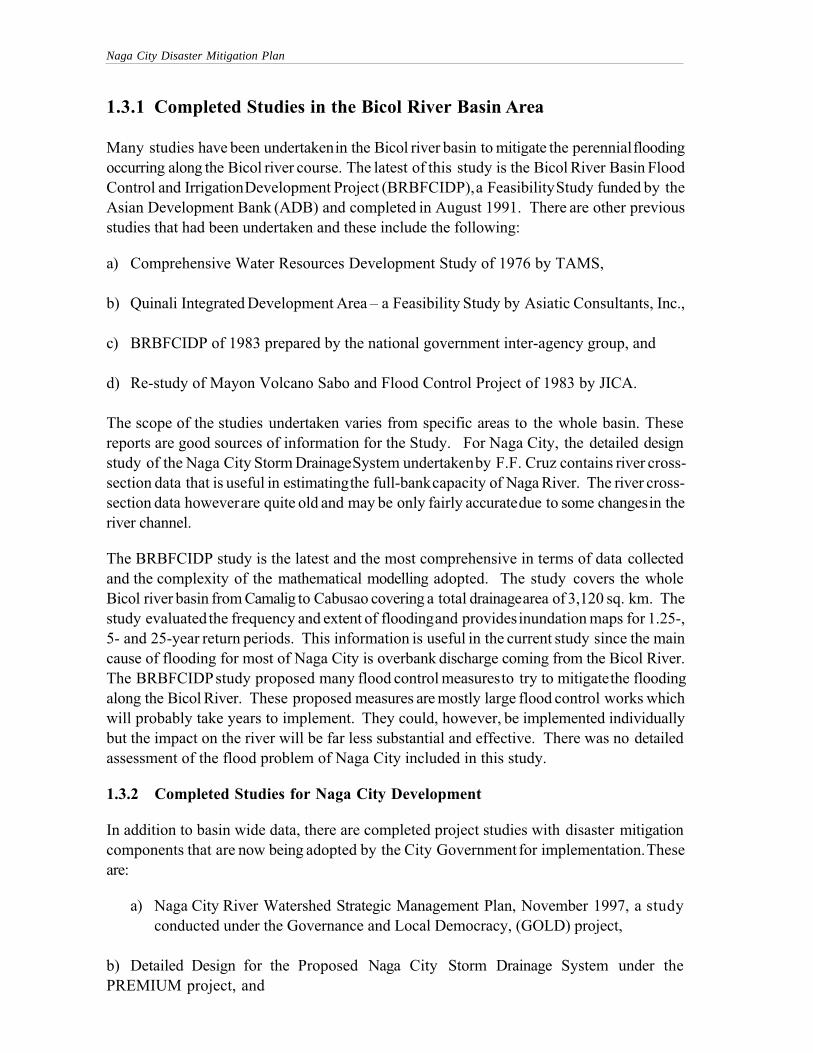
Many studies have been undertaken in the Bicol river basin to mitigate the perennial floodingoccurring along the Bicol river course. The latest of this study is the Bicol River Basin FloodControl and Irrigation Development Project (BRBFCIDP), a Feasibility Study funded by theAsian Development Bank (ADB) and completed in August 1991. There are other previousstudies that had been undertaken and these include the following:
a) Comprehensive Water Resources Development Study of 1976 by TAMS,
b) Quinali Integrated Development Area – a Feasibility Study by Asiatic Consultants, Inc.,
c) BRBFCIDP of 1983 prepared by the national government inter-agency group, and
d) Re-study of Mayon Volcano Sabo and Flood Control Project of 1983 by JICA.
The scope of the studies undertaken varies from specific areas to the whole basin. Thesereports are good sources of information for the Study. For Naga City, the detailed designstudy of the Naga City Storm Drainage System undertaken by F.F. Cruz contains river cross-section data that is useful in estimating the full-bank capacity of Naga River. The river cross-section data however are quite old and may be only fairly accurate due to some changes in theriver channel.
The BRBFCIDP study is the latest and the most comprehensive in terms of data collectedand the complexity of the mathematical modelling adopted. The study covers the wholeBicol river basin from Camalig to Cabusao covering a total drainage area of 3,120 sq. km. Thestudy evaluated the frequency and extent of flooding and provides inundation maps for 1.25-,5- and 25-year return periods. This information is useful in the current study since the maincause of flooding for most of Naga City is overbank discharge coming from the Bicol River.The BRBFCIDP study proposed many flood control measures to try to mitigate the floodingalong the Bicol River. These proposed measures are mostly large flood control works whichwill probably take years to implement. They could, however, be implemented individuallybut the impact on the river will be far less substantial and effective. There was no detailedassessment of the flood problem of Naga City included in this study.
1.3.2 Completed Studies for Naga City Development
In addition to basin wide data, there are completed project studies with disaster mitigationcomponents that are now being adopted by the City Government for implementation. Theseare:
a) Naga City River Watershed Strategic Management Plan, November 1997, a studyconducted under the Governance and Local Democracy, (GOLD) project,
b) Detailed Design for the Proposed Naga City Storm Drainage System under thePREMIUM project, and
AUDMP Working Paper
c) Comprehensive Water Resources Study for the Naga City’s Water District.
1.3.3 Community Survey and Hazard Mapping
Beside the previous technical studies undertaken for the Bicol River, the NCDM ProjectOffice initiated the gathering of additional data through a community-based survey. Sectoralrepresentatives (i.e., youth, professional, women, etc) were invited to participate in thecommunity survey. This special type of survey was undertaken to gather basic informationon the social and economic background of the 27 barangays of Naga City and otherinformation related to the occurrence of previous storms. Additional support informationthat have been processed by the project office include maps such as city map, topographicmap, land use map, ground slope map, flood inundation maps and others that are stored inthe Geographic Information System (GIS) installed at the Electronic Data Processing (EDP)Center of the city government.
On the basis of the community survey, data on the depth and duration of flooding werecollected for four storms, namely: Typhoon Yoning (1988), Typhoon Monang (1993),Typhoon Rosing (1995) and Typhoon Sisang (1997). Typhoon Rosing produced the mostrainfall while Typhoon Yoning registered the highest wind velocity. Flood inundation mapwas prepared by the Project Office using the average water level in each barangay and thenclassified the areas into 3 categories, namely: zero level, alarm level (1-2 feet), alert level (2.1-3.5 feet) and critical level (3.6 feet). The categories follow the one used by PAGASA.
1.3.4 Naga City GIS Data
An important aspect of the study is the GIS-assisted mapping and analysis of spatial data. The city government is already equipped with an ARC/INFO GIS package at its EDPCenter. Maps that had been digitized include the following:
i. Naga City Base Map - featuring rivers and waterways, road network, topographiccontours, barangay and zone boudaries,
ii. Land Use Map - Existing and proposed land use map,
iii. Flood Inundation Map - for four (4) selected storms and features the generalizedwater levels and barangay/zone boundaries, and
iv. Other thematic maps, such as slope, land capability, zoning, and 1996 Naga Citydetailed map at scale 1:4,000 m. showing building footprints, and other features.
1.3.5 Hydrometeorological Data
Hydrometeorological information are available in the PAGASA stations at Pili andCamaligan. The project office has collected the required data to the form specified by theConsultant, as follows:
Naga City Disaster Mitigation Plan
• Annual maximum one day (24 hours) rainfall at Pili and Camaligan station;• Annual maximum wind speed or by storm at Pili and Camaligan;• Annual maximum water level and discharge at Camaligan;• Typhoon tracts of relevant storm events affecting Naga City;• Typhoon signal/max wind speed, with reference point at Naga City; and• Wind speed threshold that will topple trees, uplift roofs and collapse lightly
constructed houses.
1.3.6 Land Use and Ordinances
Existing and proposed land uses in the city are available for evaluation. In addition, existingpolicies and ordinances, including the zoning ordinance and building code, were made availablefor review and assessment. A cursory review of the available documents and maps, as wellas those that the consultant understands to be in the process of being prepared or completed,seems to indicate that there are enough data (both in document form and in maps) for use inthe analysis and planning activities of the project.
1.3.7 Socio-Economic Profile
The project office has compiled socio-economic data, flood damage data, and otherinformation generated during the community surveys conducted by the project office. Basedon the preliminary assessment of the available secondary information, data obtained are notat-all interrelated since each agency came up with figures related to their respective objectives(MBN surveys are for each barangay in general while stakeholders’ profile done by the Cityis by zone). Since the MBN surveys are quite extensive and were only recently completedin 1996, this information serve as indicative measures of the socio-economic characteristicsof households in the barangays directly affected by typhoon and flooding.
1.4 APPROACH AND METHODOLOGY FOR THE STUDY
1.4.1 The Naga City Disaster Mitigation Planning/Implementation Framework
In areas where natural hazard occurs, like the perennial typhoon and floods in Naga City, themajor concern for the city to become safer and liveable is the safety and protection of somemajor sectors, such as the population, shelter, food/agriculture, lifeline facilities, and thelifeline infrastructure. The lifeline facilities are the communication, electricity,hospitals/clinics, airports, evacuation centers, warehouses, etc., while the lifelineinfrastructures are roads leading to lifeline facilities, levees, drainage, etc. This became thebasis for formulating the Naga City Disaster Mitigation Planning/Implementation Framework(see Figure 1).The Framework shows that overtime, the reduction of the vulnerability of the identifiedmajor sectors from high to low, if not totally removed, would depend on how the mitigationstrategies could be implemented by the combined efforts of concerned institutions involvedin the disaster mitigation program implementation. Since typhoon and flooding are naturaloccurrences that could not be prevented from happening in Naga City, the institutionalizationof some key elements in the Disaster Mitigation Program is a must to reduce the vulnerability
AUDMP Working Paper
of the major sectors of the community at risk due to natural hazards. These elements are asfollows:
a) Strengthening of organizational management support and linkages;
b) Enhancement of support services of weather forecasting, information and educationdissemination, rescue and evacuation, relief operation, etc.;
c) Establishing regular collection of data during and after typhoon and floods, whichcould be systematically stored into a data bank. The same could be used in thecontinued studies on disaster mitigation which could identity and update mitigationstrategies; and
d) Generation and/or optimizing resources in implementing proposed programs andprojects.
Once the above key elements become operational, the mitigation strategies could be furtherrefined to continuously, reduce the vulnerability of the identified key sectors of thecommunity. This could be realized through:
• Enhanced risk assessment and hazard mapping;• Adoptable landuse and zoning plans supported with dynamic policies and
ordinances;• Updated programs and projects; and• Strong community participation in planning and implementation of disaster mitigation
programs.
1.4.2 Other Key Features of the Framework
A strong Monitoring and Evaluation program shall be established to assess the variouscontributions to the attainment of the goals/vision of the program. This would include theevaluation of the continuous risk assessment and hazard mapping, implementation ofpolicies/guidelines and the land use plan and zoning, implementation of proposed programsand projects, and the community mobilization and participation. The other key elementsthat would contribute to the attainment of the program goals/vision are the support of theLOC and the AUDMP. Hopefully, this exercise could be replicated in other members of theLOC.
Naga City Disaster Mitigation Plan
6
InstitutionalizationOrganization/ManagementSupport/Linkages
DataBanking/Studies
Program/SystemsImplementation
Support Services:• Weather Forecast• IEC• Rescue• Evacuation• etc.
Risk Assessment/
Hazard Mapping
Policies/Guidelines
Landuse Plan/Zoning
Proposed
Programs/Projects
Community
Mobilization
M & E
Program
GoalSafLi
C
LEAGUE OF CITIES SUPPORT/REPLICATION
ASIAN URBAN DISASTER MITIGATION PROGRAM SUPPORT
Disaster/Risk
Low Med H i g h
Figure 1. Naga City Disaster Mitigation Planning/Implementation Framework
VulnerableSector/Area
• Populace
• Shelter
• Food/Agriculture
• Lifeline Facilities
• Lifeline Infra
Mitigation Strategies
PreparednessMeasures
TIME FRAME
NaturalHazard
• Typhoon• Floods
AUDMP Working Paper
1.5 PLANNING ORGANIZATION AND STRATEGIES
1.5.1 Participatory Approach
In terms of process, the conduct of the study adopted a participatory approach recognizingthe primacy of what the stakeholders want and need. The political leadership, otherconcerned government agencies and private sector groups involved in disaster-relatedprograms and more importantly, the local communities concerned were consulted, throughseries of consultation meetings and workshops, in all phases of the project study. Theywere able to provide the values and ideas from which the assessment, the disaster mitigationplan and consequent actions were appropriately developed. The purpose is to ensure greateracceptance, commitment and support to the plan and eventual sustainability of the planningefforts initiated under this project. This was done by working closely with the Naga CityMitigation Council, chaired by the City Mayor of Naga, and the organization of the StudyTeam, comprising the Counterpart Staff and the TA Team.
1.5.2 Use of Existing Data
The NCDMPU, as mentioned earlier, has undertaken community-based survey and hazardmapping. Through this process a lot of data were collected and stored in anticipation for thisstudy. Given this situation, and considering the limited time and resources for collectingprimary data, it was agreed to fully utilize the available data and other secondary informationthat are available in other agencies. Since most of the data were not compiled in proper formsand format for analytical purposes, a lot of effort was taken by the Study Team torestructure the available data. As needed, validation surveys through rapid appraisal and fieldassessments were undertaken to confirm and supplement existing data.
1.5.3 Working Arrangement
The Study Team composition, comprising of the Technical Counterpart Team from the CityGovernment and the Technical Assistance Team, was designed to formulate a more adoptableDisaster Mitigation Plan. The arrangement was for the Technical Counterpart Team tofacilitate access to all needed information, collection of additional data as required, andcoordination with other units and institutions for their participation in the review andplanning formulation through consultation meetings and workshops. In the process of theirparticipation, the counterpart staff has undergone On-the-Job Training (OJT). On the otherhand, the TA Team’s main concern was to analyze and interpret the data for use in theplanning process. These include the risk and vulnerability assessment, and the formulationthe disaster mitigation plan based on the data interpretation and recommendations of allconcerned sectors in Naga City.
The City Government has designated the office of the NCDMPU as the coordinating centerof the Study Team, particularly in the collection and compilation of data and otheradministrative requirements. To facilitate the analysis portion of the study, the TA Team hasundertaken the analysis and plan formulation in their respective offices, using the OIDCI’soffice as the main service center in the Manila operation of the study.
Naga City Disaster Mitigation Plan
1.5.4 Technical Approach of the Study
Following the Naga City Disaster Mitigation Planning/Implementation Framework, theproject study was divided into four (4) major phases as follows:
i. Risk Assessment and Hazard Mapping
ii. Vulnerability Assessment
iii. Mitigation Measures Strategy Formulation
iv. Disaster Mitigation Plan Formulation
CHAPTER 2
PROJECT SETTING
2.1 PROJECT LOCATION
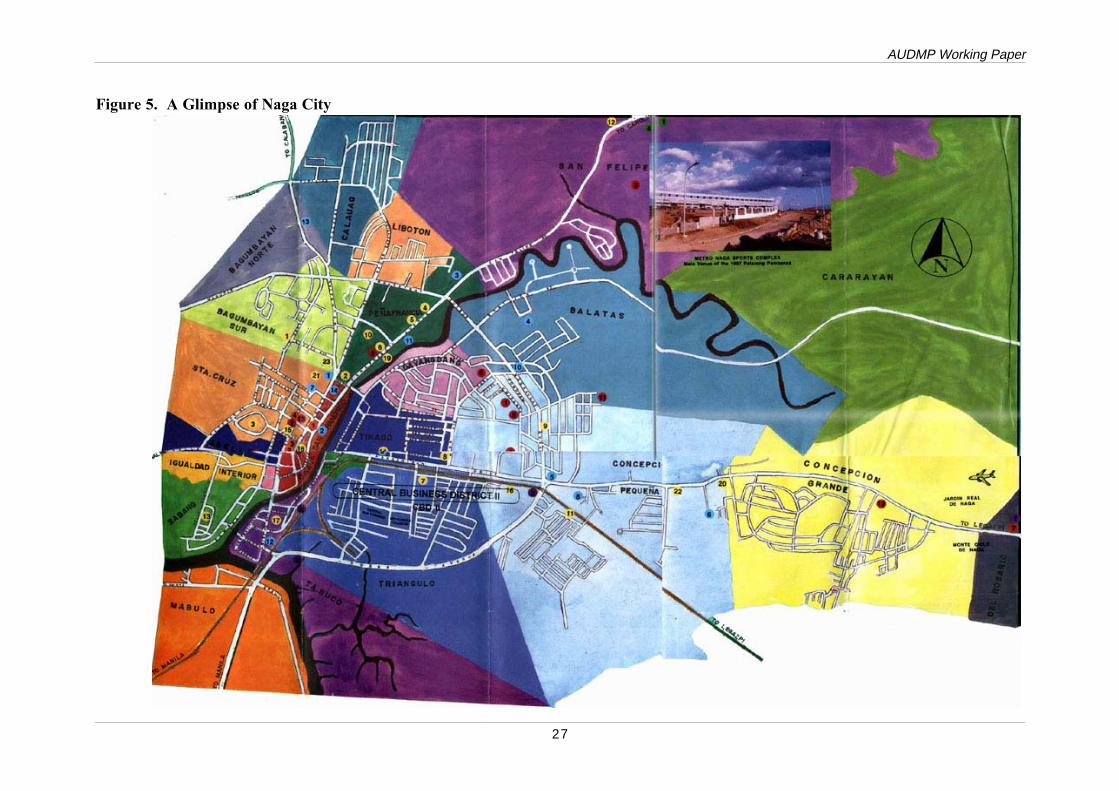
Naga City is centrally located in the province of Camarines Sur and nestles at the foot of Mt.Isarog. It is about 377 kilometers south of Manila and about 100 kilometers north of Legaspi.Naga is placed on the Philippine Map between 13 to 14 degrees North Latitude and between123 to 124 degrees East Longitude. It is bounded on the north by the municipalities ofCanaman and Magarao, on the east by Mt. Isarog and the Municipality of Pili, the capitaltown of Camarines Sur, on the south by Milaor, and on the west by the Municipality ofCamaligan (Figure 2). These municipalities and Naga City comprise the Metro Naga Council.
Naga is classified as a first class city with 126,972 residents (1995 census) that expands tomore than 180,000 during the day. It has 27 barangays on a land area of 7,748 hectares.About 54 percent of the land area is devoted to agriculture, 29 percent to residential and only7.23 percent remains as forest parks and reserves.
Naga City is the door to the Bicol Region. When typhoons flood the city and inundate itsmain national highways, a major lifeline for commerce and delivery of services is shut down.As the catch basin of Region 5, flood waters from Mt. Mayon in Albay, Iriga of Rinconadaarea, and other areas rush towards the city on its way to San Miguel Bay. Naga City and alarge portion of its nearby municipalities known as Metro Naga are situated within the floodplains of the Bicol River Basin. The Naga River which straddles the city is a tributary of theBicol River that accumulates floodwaters largely from the provinces of Albay, CamarinesSur, and Camarines Norte, and conveys excess runoff into San Miquel Bay. The urban centerof Naga City, comprising 17 barangays, lies between 1.00 to 5.00 meters above mean sealevel. Sudden atmospheric and meteorological changes during typhoons makes it vulnerableto tide levels and storm surges from Naga River’s confluence with the Bicol River up to itsoutlet at San Miguel Bay.
2.2 CLIMATE AND WEATHER
Naga falls within the Type II climate under the Modified Coronas Classification. This ischaracterized by a definite absence of dry season and a very pronounced maximum rainy periodfrom November to January. The normal annual average rainfall for Pili, Camarines Sur (therecording station closest to Naga City) is 1,166 mm; and the normal annual average temperatureis 27.1oC.
Figure 3 shows the climate map of Pili, using Walter’s Climate Diagram method. In thismethod, both rainfall and air temperature were used. In this climate map, the period duringthe year with a monthly rainfall more than 100 mm is shown (i.e., May to December). Duringthis period, the soil is believed to be saturated, whereby any soil disturbing activities in thehigher slope will greatly enhance soil erosion. As shown, the rainfall curve has always beenhigher than the temperature curve implying that there is no severe drought within Naga.
Naga City Disaster Mitigation Plan
10
Figure 2. Location Map
AUDMP Working Paper
11
This also indicates that under normal climatic conditions, there is sufficient moisture in thesoil to support some upland crops during the period from January to May.
The highest average monthly rainfall is 323 mm (November) and the lowest average rainfallis 37 mm (April). The highest monthly temperature is 29oC (May and June), and the lowestmonthly temperature is 25oC (January).
An average of 20 tropical cyclones of various strength pass through the Philippines’ area ofresponsibility every year. The Bicol Region including Naga City is visited by an average of5 typhoons annually. The region in fact falls within the typhoon belt.
2.3 EXISTING LAND USE: WHYS AND WHERE FROMS
Viewed from above, the land area of Naga City is formed like a ship with its bow facing easttowards Mt. Isarog, and its stern sitting west just about the junction of the Bicol and Nagarivers. It is at this westernmost tip of Naga where its urban area is located. It is an old cityby Philippine standards having been founded in 1578 by a conquistador (Pedro de Chavez),not yet two decades since the arrival in force of the Spanish colonizers.
From Manila, the CBD (Central Business District) at Once:
From Manila along the Pan Philippine Friendship Highway, one enters Naga City from theSouth, specifically from the direction of the town of Milaor. The approach to Naga Cityfrom Milaor is marked by the appearance of a string of a number of commercial structuresalong both sides of the Pan Philippine Highway. In between these structures are farmer hutswhose households obviously tend to the rice lands beyond the warehouses, mills, buyingstations and other commercial units along the highway. As one crosses the Bicol River, therotunda indicates the entry to the City's built up area. Around are the unmistakable patternsof urbanization: contiguous residences interspersed with commercial activity. Drivingfarther, one is suddenly confronted with the city’s urban core. On both sides of the road,commercial activities proceed oblivious of anyone’s movement. Having crossed one river,the Bicol River, now one must cross another, the Naga River.
The Naga River is where the famous translacion fluvial parade of the region wide festival ofPeñafrancia is held. Crossing this river, one becomes aware that the area is the entry to thecentral business district of the city. The CBD is concentrated in about a dozen and a halfsmall blocks and one could walk briskly around it and inside in an hour and a half. Almostat its center are two parks and one multi-purpose covered stage facing an open court. One ofthese parks, called Rizal park, is acclaimed as the Hyde park of Bicol because of the freedomof activity within it as well as its popularity as a spontaneous debating court. Beyond thesepublic parks, after a smattering of light commercial activities, one will discover the reasonwhy the city likes to call itself the educational and religious center of the Bicol region.
Naga City Disaster Mitigation Plan
12
2.3.1 Naga is Bicol's Center of Institutions and Traditions
Turning into one of the interior roads from the Northern end of the park, one runs into thegate of the University of Nueva Caceres. Backtracking then walking along the city's mainartery, one can see a huge cathedral and the ancient walls of the oldest major seminary in thecountry. To the rear of the cathedral and the major seminary is the Jesuit run Ateneo deNaga, acclaimed as one of the region's best schools. Across the road from the cathedral is thehigh wall of the Catholic Archbishop's residence, which occupies practically an entire cityblock. Next to the Archbishop’s residence is one of the oldest schools for young women inthe entire Far East, the Colegio de Sta. Isabel. Along the street of the Colegio is theCamarines School of Arts and Trade (CSAT), one of the biggest public school of its kind inthe country. Still farther but proximate to the CSAT is Naga College, a private college. Asone walks on, he will get to the Shrine of the Virgin of Peñafrancia where, until recent times,the statue of Our Lady of Peñafrancia was lodged. These institutions are just a few of themany that give Naga City its character as a university town and religious center.
Like old cities established by the Spaniards, the urban core of Naga was established not onlyaround the trading area, but more so around its Catholic cultural cluster which was theheadquarters of Spanish missionaries proselytizing throughout Southern Luzon, includingislands around it, in the 16th and 17th centuries. In fact, Naga at one time was the seat of theHoly See in the Philippines and was the center of the most extensive archdiocese, NuevaCaceres, which practically covered all territories South of Manila up to the San BernardinoStraight at one time.
Indeed the city is really known for the great festival of the Peñafrancia which finds therevered statue being brought out of its shrine northeast of the city, carried in a fluvial paradealong the Naga river and transferred to the Naga Cathedral in the center of the city for theduration of the festival. At the end of the fiesta, the Lady of Peñafrancia is brought back tothe shrine in the same manner as before. These features: the statue of the Virgin, the shrine,the river, the Cathedral are the historical and current composites of the memory of those whohave known Naga. Subordinate only is the recollection that the city has the biggest publiccovered market in the country called "supermarket" by the locals. Curiously, it is Rizal Park,the Hyde Park of Bicol, that is also retained in the memory of visitors after the Peñafrancia.
2.3.2 Naga City Development: Roots and Land Use Pattern
The central business district of Naga in the sense of being the trading area of the city hasapparently remained locationally unchanged since Spanish times. It has of course expandednortheast beyond its original area near the Naga River and occupied the sites of the originalprovincial government headquarters and the old provincial jail. It has also widened. Most ofit lies within the Barangays of Dinaga and Igualdad, although it has spilled over to theBarangay of Sabang, in the triangular area carved by the Bicol and Naga rivers, and Abella, onboth sides of the road artery all the way to the boundary of Camaligan. Thin strips of lightcommercial activities also appear from the bank of the Bicol River in Barangay Tabucotowards Milaor. Light to medium commercial activities also dots both sides of PeñafranciaAvenue from San Francisco up to the walls of the Archbishop's place. At this point, the
AUDMP Working Paper
13
institutional cluster remains where it was established since the 17th century.
The historical pattern is the market area was by the river (in the 16th, 17th and 18th century,the Bicol River was the foremost transportation artery) near where the public "supermarket"is now and the religious cluster was some distance from it and directly on the topographicline delineating an elevation of 5 meters. In other words, the religious cluster was not onlysome distance from the hustle and bustle of worldly activities; it was also built in relativelyhigher ground. In between the place of commerce and the Cathedral, the governmentadministrative cluster with its police headquarters and jail located itself as if to mediatebetween the affairs of the market and pronouncements from the pulpit.
It is, therefore, not surprising that to this day the center of Naga's built-up area is shared bya robust business district on one hand, and a conservative cluster of religious and educationalinstitutions on the other. From this dual core, the city stretches out in five directions. Tothe north, from the Cathedral complex, the Ateneo and Colegio, it moves along Bagumbayanroad among old houses until it approaches the boundary with the separate municipality ofCanaman, whereupon residential subdivisions occupy the spaces on both sides of the roadgoing beyond Naga. To the northeast, the built-up area hugs the Naga River almost up to itsheadwaters. Here can be found several new developments including the new Basilica ofPeñafrancia. To the west, the central business district, having expanded and spilled overresidential areas over the years, does business alongside the Bicol river town of Camaligan,which is already a contiguous part of a Metro-Naga conurbation. To the south, on the otherside of the Bicol River, some new commercial establishments lining the highway up to theboundary of Milaor town pockmark the flood plain.
To the east, the CBD bursts out in the direction of the national road named Panganiban Driveuntil the road merges with the Pan Philippine highway as it proceeds towards the provincialcapital town of Pili on the way to far away Albay. In this area, an urban strip developmentis in the making from the beginning of and all along Panganiban Drive then along the PanPhilippine highway up to the city boundary with Pili. Housing, many of them recent, andnew light commercial establishments fill up interstices north of the Panganiban Drive. Thesemerge with movements in the higher eastern portion of the city where developments inhousing have started moving vigorously from the Dayangdang area going east into hithertoagricultural areas.
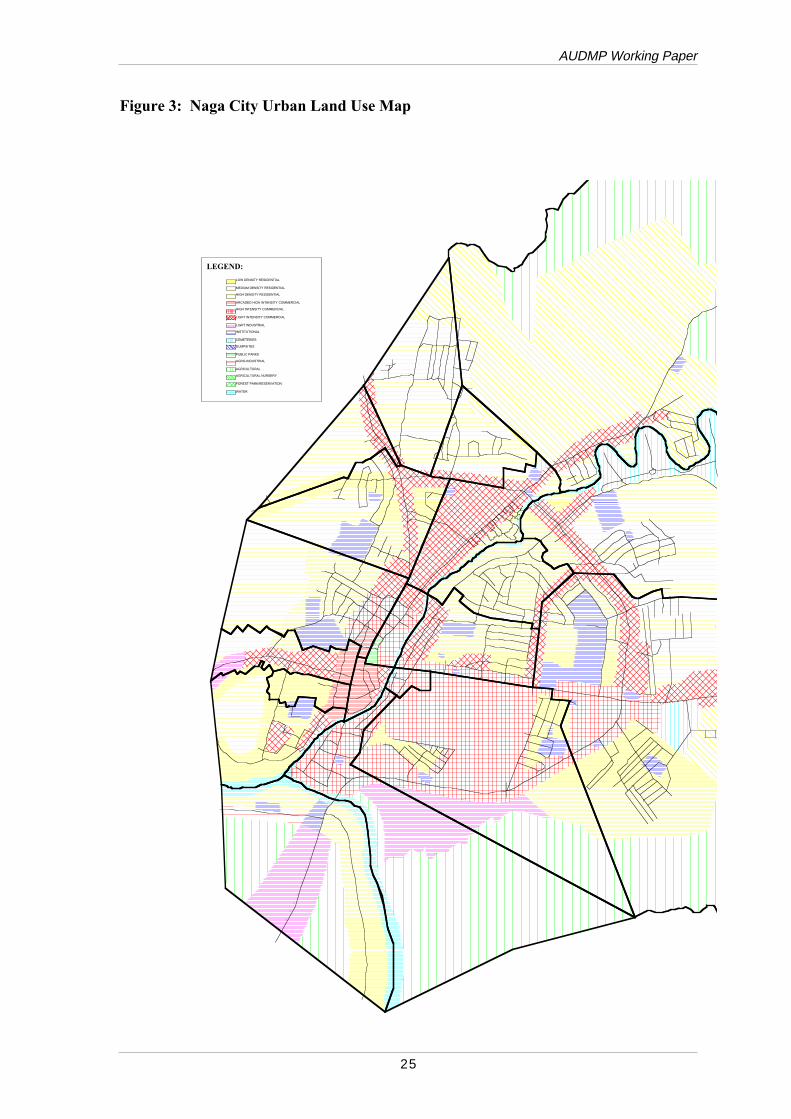
The urban area (see Figure 3, Urban Land Use) is concentric in orientation. Its built-up areaoccupies roughly ten percent of the City jurisdiction. Within this ten percent area, 58 percent ofits 126,972 population (1995 Census) work, rest, pray, study, play, shop, and sleep. That is,until it floods.
2.4 GENERAL SOCIO-ECONOMIC FEATURES
Naga City is among the 3 major cities in the Bicol Region centrally located in the province ofCamarines Sur. It is the smallest city in the region occupying an aggregate land area of 7,748ha., about 1.5 percent of the entire province of Camarines Sur.
Naga City Disaster Mitigation Plan
14
2.4.1 Demographic Pattern
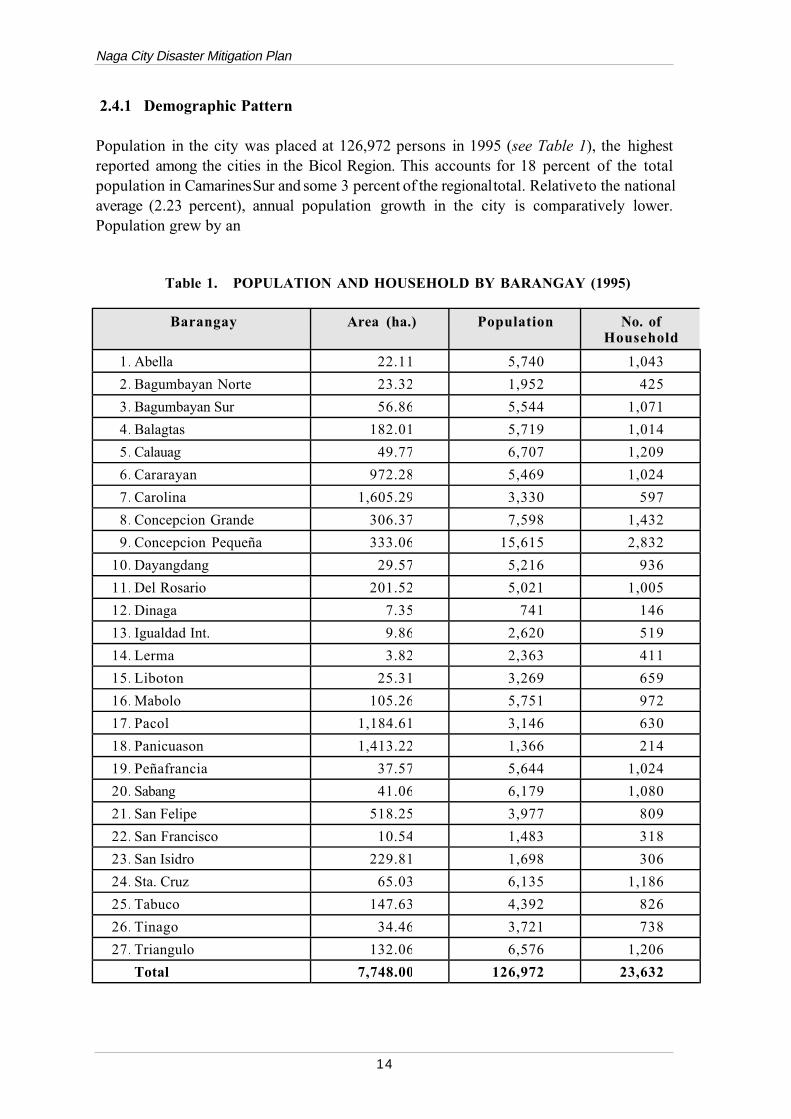
Population in the city was placed at 126,972 persons in 1995 (see Table 1), the highestreported among the cities in the Bicol Region. This accounts for 18 percent of the totalpopulation in Camarines Sur and some 3 percent of the regional total. Relative to the nationalaverage (2.23 percent), annual population growth in the city is comparatively lower.Population grew by an
Table 1. POPULATION AND HOUSEHOLD BY BARANGAY (1995)
Barangay Area (ha.) Population No. ofHousehold
1. Abella 22.11 5,740 1,043
2. Bagumbayan Norte 23.32 1,952 425
3. Bagumbayan Sur 56.86 5,544 1,071
4. Balagtas 182.01 5,719 1,014
5. Calauag 49.77 6,707 1,209
6. Cararayan 972.28 5,469 1,024
7. Carolina 1,605.29 3,330 597
8. Concepcion Grande 306.37 7,598 1,432
9. Concepcion Pequeña 333.06 15,615 2,832
10. Dayangdang 29.57 5,216 936
11. Del Rosario 201.52 5,021 1,005
12. Dinaga 7.35 741 146
13. Igualdad Int. 9.86 2,620 519
14. Lerma 3.82 2,363 411
15. Liboton 25.31 3,269 659
16. Mabolo 105.26 5,751 972
17. Pacol 1,184.61 3,146 630
18. Panicuason 1,413.22 1,366 214
19. Peñafrancia 37.57 5,644 1,024
20. Sabang 41.06 6,179 1,080
21. San Felipe 518.25 3,977 809
22. San Francisco 10.54 1,483 318
23. San Isidro 229.81 1,698 306
24. Sta. Cruz 65.03 6,135 1,186
25. Tabuco 147.63 4,392 826
26. Tinago 34.46 3,721 738
27. Triangulo 132.06 6,576 1,206
Total 7,748.00 126,972 23,632
AUDMP Working Paper
15
average of 1.94 percent annually from 1990-1995. This is more or less the same growthpattern registered by Camarines Sur and the region as a whole.
Average population density is 16 persons per ha.; the highest density registered relative tothe other cities and the entire Bicol Region. By NSO definition, Naga is classified as entirelyurban having a population density of at least 10 persons per hectare.
Of the total population, some 84 percent are concentrated in the poblacion while the rest aresparsely distributed in the outlying areas of the city. The urban population density of about49 persons/ha. is three times higher than the city average indicating an overcrowding in theurban side of Naga. The rural areas of Naga however only registered an average populationdensity of about 4 persons per hectare.
The increase in the city’s population is 1.5 percent attributed to migrants from other areas.This shows that the city is an in-migration area.
2.4.2 Demographic Characteristics
The city’s population is composed of some 23,632 families in 1995 with an averagehousehold size of 5.37. The female population is slightly higher than the male with a ratioof 105 females for every 100 male population. It has a relatively young populace with 67.2percent under 30 years of age.
Ethnic composition of the population shows an intermixed community of Bicolanos andmigrants mainly composed of Tagalogs. However, Bicolanos are still the dominant ethnicgroup comprising some 92 percent of the total population.
Naguenos are predominantly Roman Catholics, Naga being the seat of the Archdiocese ofCaceres since the Spanish time. It is also the center of religious festivities in the Region withthe annual feast of our Lady of Peñafrancia as the highlight of the biggest Marian devotionin the country, gathering the Bicolanos together in religious celebration.
Literacy rate is very high at 98 percent. The city serves as the center of education in Bicolwith the preponderance of schools offering pre-school, elementary, secondary and tertiaryeducation. There are 133 day care centers, 32 and 16 public and private schools offeringelementary and secondary education, respectively, 7 vocational schools and 13 colleges anduniversities, 2 of which are government-run.
The leading causes of mortality and morbidity in the city are mostly diarrhea and respiratory-related illnesses (pneumonia, influenza, PTB). These are largely water-borne diseases, whichare indicative of water quality and sanitation condition in the city. Health services andfacilities are more than adequate to serve the city’s population with a high bed to populationratio of 3.9 per 1,000 population and surpassing the health manpower standard of 1doctor/dentist per 20,000 population (current ratio is 1:684 for physician and 1:1,294 fordentist).
Naga City Disaster Mitigation Plan
16
Some 72 percent of the city’s population own houses and the rest are either renting orsquatting. Naga’s urban poor population that is mostly squatters was estimated in 1997 tocomprise some 5,000 families. This group is the target of the city government’s resettlementprogram.
2.4.3 Labor Force and Family Income
The city’s labor force (population 15 years and over) comprises some 68,771 persons or 60percent of the entire population. Of the total labor force, about 57 percent are consideredeconomically active. Unemployment rate is around 5.4 percent.
The average monthly income of families with a mean household size of 5 members isestimated at P3,532. Poverty threshold level in the region in 1995 based on income wasestimated at P8,319 annually. Urban poverty incidence in the region is estimated at 39percent of the urban population. This corresponds to about 40,000 people or 7,400households of the city falling within the poverty line.
2.4.4 Economic Base
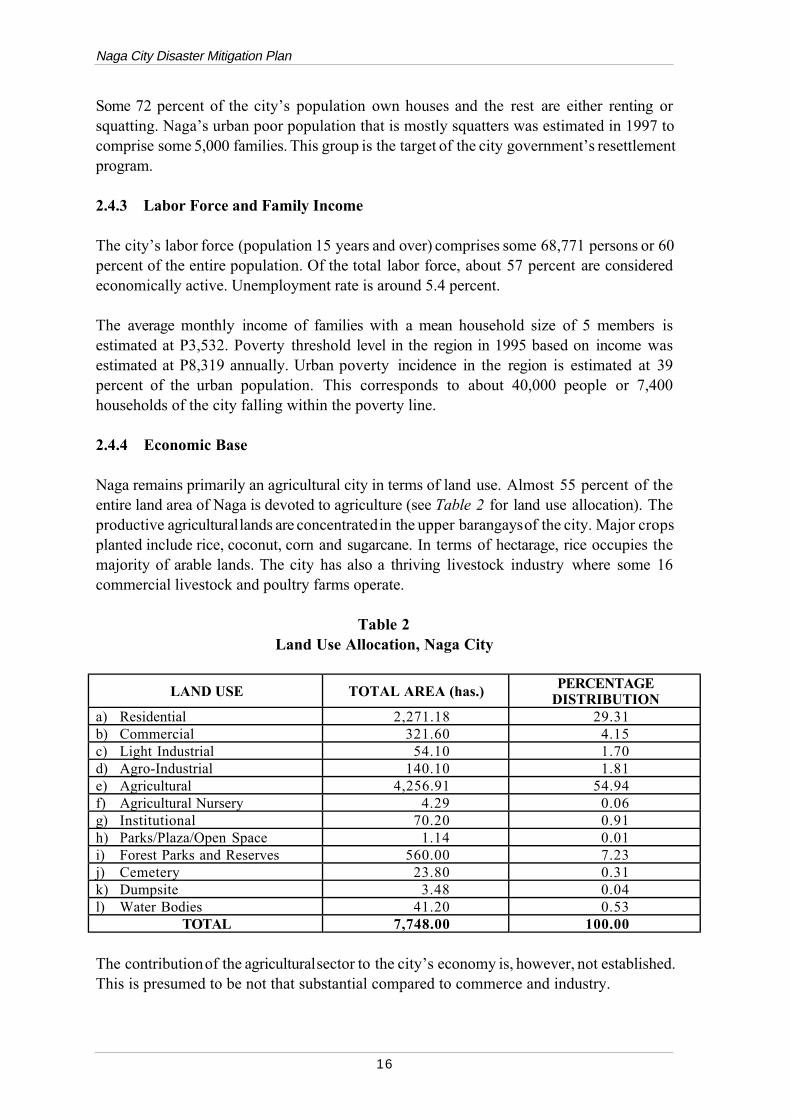
Naga remains primarily an agricultural city in terms of land use. Almost 55 percent of theentire land area of Naga is devoted to agriculture (see Table 2 for land use allocation). Theproductive agricultural lands are concentrated in the upper barangays of the city. Major cropsplanted include rice, coconut, corn and sugarcane. In terms of hectarage, rice occupies themajority of arable lands. The city has also a thriving livestock industry where some 16commercial livestock and poultry farms operate.
Table 2Land Use Allocation, Naga City
LAND USE TOTAL AREA (has.) PERCENTAGEDISTRIBUTION
a) Residential 2,271.18 29.31b) Commercial 321.60 4.15c) Light Industrial 54.10 1.70d) Agro-Industrial 140.10 1.81e) Agricultural 4,256.91 54.94f) Agricultural Nursery 4.29 0.06g) Institutional 70.20 0.91h) Parks/Plaza/Open Space 1.14 0.01i) Forest Parks and Reserves 560.00 7.23j) Cemetery 23.80 0.31k) Dumpsite 3.48 0.04l) Water Bodies 41.20 0.53
TOTAL 7,748.00 100.00
The contribution of the agricultural sector to the city’s economy is, however, not established.This is presumed to be not that substantial compared to commerce and industry.
AUDMP Working Paper
17
In terms of the service sector, Naga is considered as the undisputed center of trade andcommerce in the province and in the region. It boasts of most of the large businesses fromretailing to wholesaling, entertainment, and financing and other services. Records show thatit has a total of 4,950 business establishments registering a growth rate of a little over 100percent since 1987. Revenue contribution of the service sector amounted to some P70 millionin 1997 from only about P30 million in 1994.
The main business center of the city however covers only about 30 hectares correspondingto about 16 commercial blocks. In view of the limited commercial space, land value in theCBD is skyrocketing with the recent selling price of an average of about P40,000 per sq.meter. A new CBD is being developed along the Panganiban Diversion Road area to addressthe congestion problem in the main CBD. Other interventions to disperse development awayfrom the main CBD include development of idle lands such as those of the PNR lands alongPanganiban Drive and development of satellite markets.
The industry sector of Naga is still at a nascent stage. This comprises of some 378manufacturing industries, which are mostly cottage type. These include food processing,metal works, furniture, body building/auto shops, warehousing and storage concentratedmainly in Concepcion Pequeña, Concepcion Grande, Del Rosario, Abella and Mabolo.
The tourism sector, except for the Peñafrancia fiesta, is still to be developed to attractsubstantial share in the tourism market for both domestic and foreign tourists.
2.4.5 Basic Infrastructures and Utilities
The city’s road infrastructures are already well developed exceeding the national standardroad-area density ratio of 1 km per 100 ha. Other modes of transport available include boatsto reach neighboring riverine towns, by train through PNR’s southline railway and by airthrough the Naga airport.
The city’s domestic water requirement is serviced by 4 waterworks systems, the largest ofwhich is operated by the Metro Naga Water District (MNWD) with service area coverageextending to neighboring towns of Canaman, Pili, Camaligan and Magarao. Three smallersystems service the upper barangays of the city. The MNWD water sources include 2springs in Pili and 7 deep wells located mostly in the low-lying areas of Naga, except that ofSan Felipe. Average daily production of MNWD is 20,110 cu.m. There is no data on theaggregate water demand of residential and commercial users in urban Naga to compare existingsupply.
Solid waste management in the city is handled solely by the General Services Division of thecity government. Garbage generated in 1997 was about 94 metric tons with reportedcollection efficiency of 80-85 percent. The garbage disposal area of Naga is a dumpsite whichis already loaded. A new site is being negotiated to establish a sanitary landfill.
Naga City Disaster Mitigation Plan
18
2.5 EXISTING FLOOD CONTROL STRUCTURES AND FACILITIES
2.5.1 Existing Drainage System
Most of the natural waterways and drainage creeks in the city have been silted or built-overwith structures blocking the natural flow of flood waters. The absence of any naturaldrainageways subject the low-lying areas to prolong flooding even during moderate rainfall.
A storm drainage master plan has been prepared for the city in 1981. This was not howeverevaluated because the plan was destroyed during one of the major floods that inundated theCity Engineer’s Office. In the absence of such master plan and corresponding updating,drainage improvement becomes difficult especially considering the rapid changes in the landuse of the city.
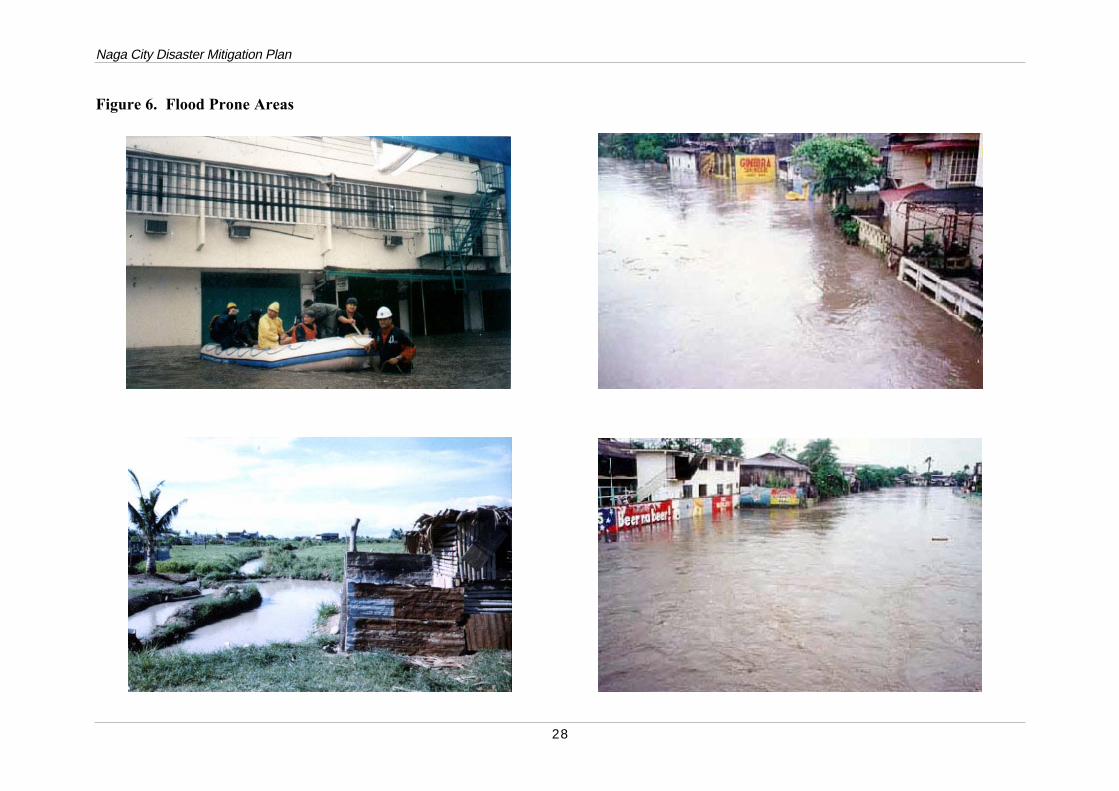
Based on available maps and rapid field assessment undertaken by the study team, the poorcondition and inadequacy of existing drainage system have been found to further exacerbateflooding in the city. While drainage facilities are constructed, localized flooding continues tobe a major problem. In the general layout of the existing waterways, most of the storm run-off is directly discharged towards Naga River which is the nearest main waterway. Undernormal condition when the water level is low, the street run-off is drained into the river.When the water level rises, the floodwater reverses direction, enters the open outfall, flowsinto the drains and eventually spreads floodwater into the streets. As Naga River overflowsits banks, the floodwater travels above ground and follows the ground gradient which is awayfrom the river and into the natural depressions located in Bgys. Triangulo, Abella andIgualdad. Failure to consider the backflow effect causes more flooding. In addition, theconstruction of street drainage facilities have been found to be unsystematic and inconsistentwith the capacity requirement. Moreover, poor maintenance of the existing drainage systemalso contributes to the occurrence of localized flooding. Figure 6 shows the areas, mostlynear the low riverbank, that are prone to flooding.
2.5.2 Naga Tidal Structure
A tidal gate structure that also serves as a bridge has been constructed along Naga River(connecting Tabuco and Sabang) near the confluence with Bicol River. One of the purposesof the tidal gate structure is to control the flow of Naga River during the annual Peñafranciafluvial parade. The structure has 8 bays with a two 4.0 x 1.0-meter gates each. The facilityseems to have no clear guidelines on gate operation. The structure is not equipped with anymanual or mechanical lifting mechanism except for a standby crane. The construction of thefacility could affect the flow capacity of the river especially with very small clear gateopening. During flood flows, these bridges usually accumulate debris which providedamming effects, causing the increase of flood levels upstream which aggravate the inundationof the low lying areas near the river banks.
AUDMP Working Paper
19
2.5.3 Camaligan Flood Forecasting Station
PAGASA has established a flood-forecasting network for the whole Bicol river basin. Rainfall and river stage data are collected by telemetry system that send the data to the FloodForecasting Center in Manila. Part of this hydrometeorological telemetry system is theCamaligan Station that observes in real-time the river stage and rainfall depth. The Camaliganstation also receives the weather and domestic bulletin prepared in Manila for disseminationto the local radio and TV stations, while the flood bulletin is prepared in the CamaliganStation. The equipment of the station are quite old including the computer system. Thereis no real flood forecasting being undertaken but more of monitoring since no prediction ismade on the occurrence of the flood level.
2.5.4 Typhoon 99 Website
A special website was created and maintained by Michael Padua, an amateur meteorologistin Naga City, that features current information on storms and typhoons occurring in thePhilippine Area of Responsibility (PAR). The website address ishttp://geocities.com/capecanaveral/6825. The weather data and satellite images are compiledfrom international weather offices of the United States and Hawaii, Japan, Philippines andother countries. Beside the current weather forecast, the website also contains data on paststorms that includes the typhoon tracks, storm warning or category, maximum 1 min.sustained wind speed, lowest atmospheric pressure and rainfall depth. There are also linksto other websites that have similar information and interest. Another interesting website isthe Federal Emergency Management Authority (FEMA) whose address ishttp://www.fema.gov. FEMA has data and information on the effects of significant stormson building and infrastructures.
2.6 EXISTING DISASTER MITIGATION ORGANIZATION ANDMANAGEMENT STRUCTURE
2.6.1 Existing Special Bodies on Disaster Mitigation Implementation
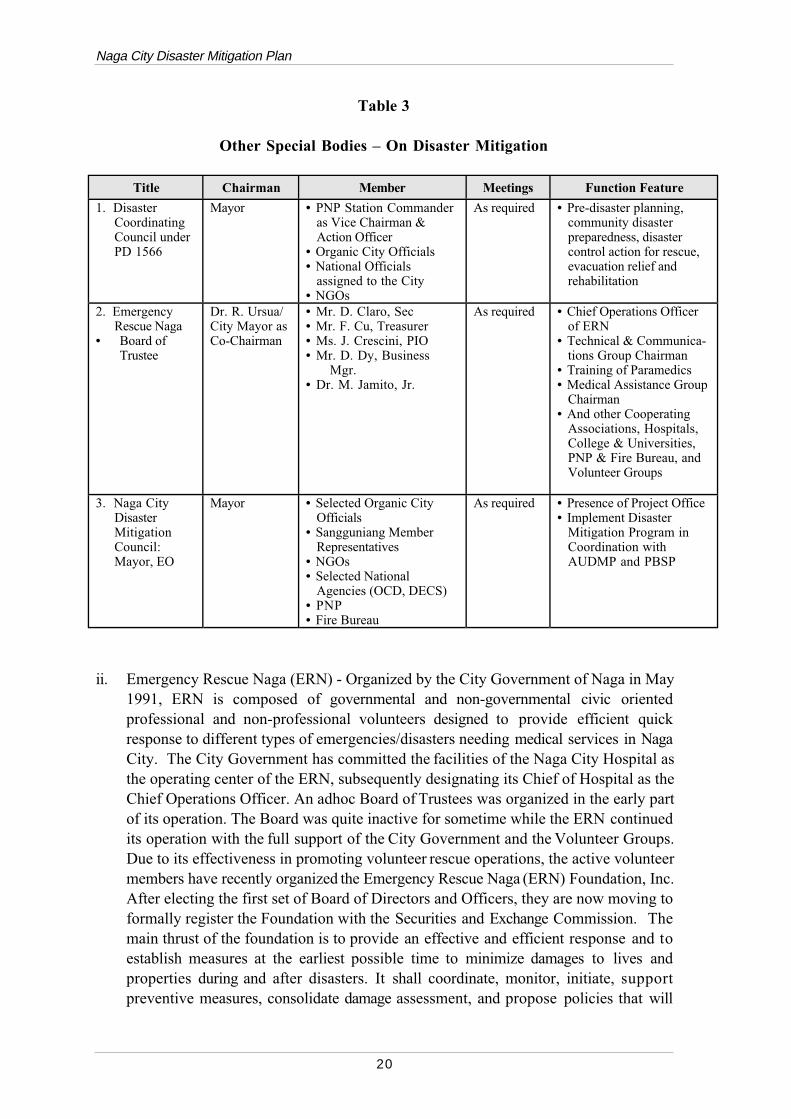
There are three (3) major special bodies involved in disaster mitigation management operatingin Naga City. The City Mayor chairs all these special bodies and the main features andfunctions are shown in Table 3 and summarized as follows:
i. Naga City Disaster Coordinating Council (NCDCC) - Organized under PD 1556, it is partof the network of the National Disaster Coordinating Council Chaired by the Secretary ofDefense. The Council is being supported by the Office of Civil Defense (OCD). TheCouncil is, however, perceived as a body for disaster rescue operation and post disasterassistance operation only. No regular activities have been undertaken for disaster mitigation.
Naga City Disaster Mitigation Plan
20
Table 3
Other Special Bodies – On Disaster Mitigation
Title Chairman Member Meetings Function Feature
1. DisasterCoordinatingCouncil underPD 1566
Mayor • PNP Station Commanderas Vice Chairman &Action Officer
• Organic City Officials• National Officials
assigned to the City• NGOs
As required • Pre-disaster planning,community disasterpreparedness, disastercontrol action for rescue,evacuation relief andrehabilitation
2. EmergencyRescue Naga
• Board ofTrustee
Dr. R. Ursua/City Mayor asCo-Chairman
• Mr. D. Claro, Sec• Mr. F. Cu, Treasurer• Ms. J. Crescini, PIO• Mr. D. Dy, Business
Mgr.• Dr. M. Jamito, Jr.
As required • Chief Operations Officerof ERN
• Technical & Communica-tions Group Chairman
• Training of Paramedics• Medical Assistance Group
Chairman• And other Cooperating
Associations, Hospitals,College & Universities,PNP & Fire Bureau, andVolunteer Groups
3. Naga CityDisasterMitigationCouncil: Mayor, EO
Mayor • Selected Organic CityOfficials
• Sangguniang MemberRepresentatives
• NGOs• Selected National
Agencies (OCD, DECS)• PNP• Fire Bureau
As required • Presence of Project Office• Implement Disaster
Mitigation Program inCoordination withAUDMP and PBSP
ii. Emergency Rescue Naga (ERN) - Organized by the City Government of Naga in May1991, ERN is composed of governmental and non-governmental civic orientedprofessional and non-professional volunteers designed to provide efficient quickresponse to different types of emergencies/disasters needing medical services in NagaCity. The City Government has committed the facilities of the Naga City Hospital asthe operating center of the ERN, subsequently designating its Chief of Hospital as theChief Operations Officer. An adhoc Board of Trustees was organized in the early partof its operation. The Board was quite inactive for sometime while the ERN continuedits operation with the full support of the City Government and the Volunteer Groups.Due to its effectiveness in promoting volunteer rescue operations, the active volunteermembers have recently organized the Emergency Rescue Naga (ERN) Foundation, Inc.After electing the first set of Board of Directors and Officers, they are now moving toformally register the Foundation with the Securities and Exchange Commission. Themain thrust of the foundation is to provide an effective and efficient response and toestablish measures at the earliest possible time to minimize damages to lives andproperties during and after disasters. It shall coordinate, monitor, initiate, supportpreventive measures, consolidate damage assessment, and propose policies that will
AUDMP Working Paper
21
facilitate smooth and effective operation of the City Government in the event of naturaland man-made disasters.
iii. Naga City Disaster Mitigation Council (NCDMC) - Organized as the Naga CityDisaster Management Team under Executive Order No.98-005 signed by the CityMayor on June 02, 1998. The Team was organized primarily to coordinate with theAUDMP-LOC-PBSP in the implementation of the Disaster Mitigation Program. Through series of meetings, the Team has evolved into what is known today as the NagaCity Disaster Mitigation Council. No formal document was issued for this evolution. According to some key officers, this change was based on the popular decision of themembership, which has increased from 15 to 29. The council in collaboration with thePBSP has organized the planning workshop last July 16-17, 1998 as its first majoreffort, since the inception of the Project in November 1996, in pursuing vigorously theproject activities. The output of the planning workshop became the basis for theactivities of the Project Office in the community orientation cum socio-economic survey,and flood hazard mapping.
2.6.2 Naga City Disaster Mitigation Project Unit (NCDPMU)
An Adhoc unit organized by the City Government under the Office of the City Mayor as itscounterpart to PBSP’s effort in implementing the decision of the NCDMC. The unit is actingas the coordinating center in the implementation of the Disaster Mitigation Program. TheUnit is headed by a designated Project Officer from the Office of the City Mayor, andmanned by six (6) Government Internship Program (GIP) Trainees, and Youth/studentVolunteers. A local consultant was hired by the City to augment the technical capability ofthe project staff. An office space was also provided. In addition, the EDP unit, with GIScapability, was committed to provide all digitized maps of the project. On the part of thePBSP, a full time Project Coordinator was assigned to work closely with the project staff.The project office is being managed jointly by the Project Officer and the ProjectCoordinator. However, the absence of a formal agreement between the PBSP and the CityGovernment on the counterparting arrangement has set some misunderstanding in theadministrative and financial operations of the project office.
2.7 EXISTING DISASTER MITIGATION MEASURES
Most of the programs on disaster mitigation measures presented by Line Agencies during theJune 7-8 Workshop were on disaster preparedness, rescue operation and post disaster reliefassistance operations. The agencies who are directly involved in these operations are theOffice of Civil Defense; Social Welfare and Development Office; Department of Education,Culture and Sports; Philippine National Police; and the Naga City Fire Station.
2.7.1 Naga City Disaster Mitigation Program
The City Government has adopted several programs to reduce the vulnerability of Naga Cityfrom flooding and typhoon hazard. These major programs are as follows:
Naga City Disaster Mitigation Plan
22
i. Drainage Improvement Program
The drainage improvement program has been a continuing activity of the City EngineersOffice in an attempt to reduce flooding duration in the area. In the early part of 1981, a stormdrainage master plan was prepared under the Program for Essential Municipal InfrastructureUtilities Maintenance (PREMIUM), a World Bank Assisted Program. The whole study waslost during one of the major floods that inundated the office of the City Engineer. Given thecurrent situation, without any guide for drainage development, the construction of drainagefacilities are not systematically implemented. Much worst is that the capacities of thedrainage facilities to evacuate flood waters are not quantified.
ii. Adoption of the Naga City River Watershed Strategic Management Plan
This program includes the following components: river park development, relocation ofsquatters, easement recovery and development, revetments, and restoration and maintenanceof vegetative cover. The City Government has started the easement recovery anddevelopment program in some portion of the Naga River. This has, however, spawned someproblems that include the occupation of the easement area by squatters.
iii. The La Niña Task Force
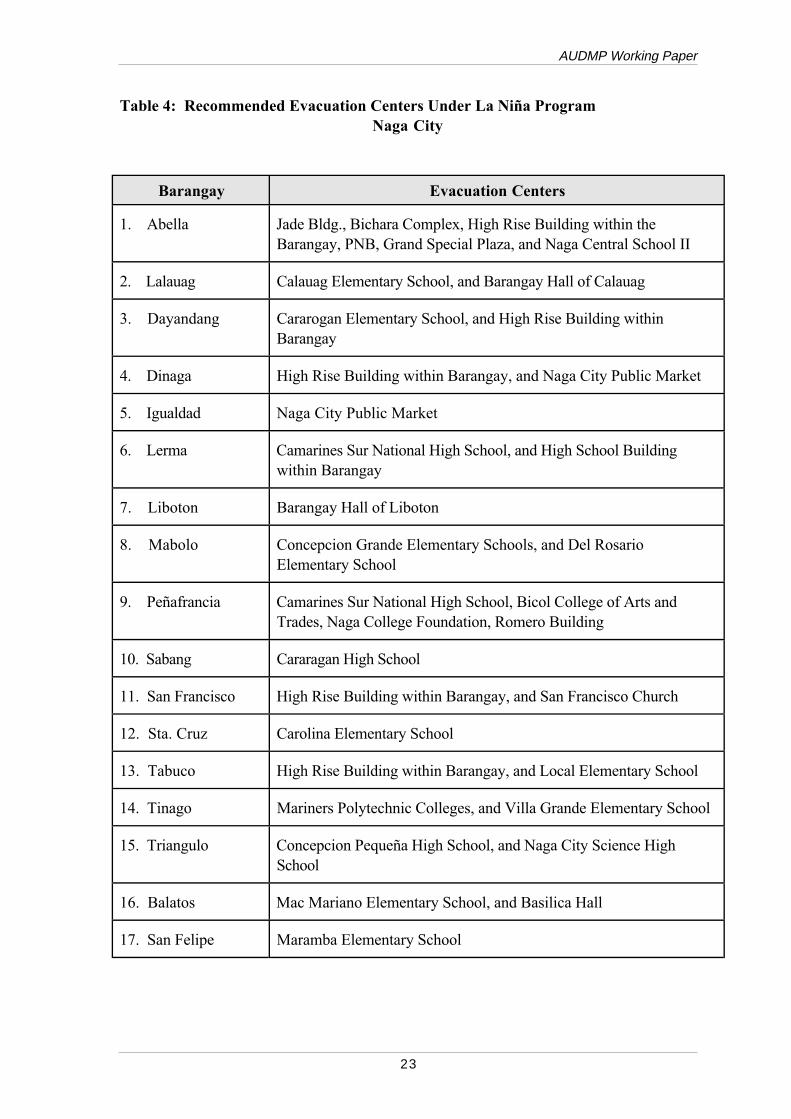
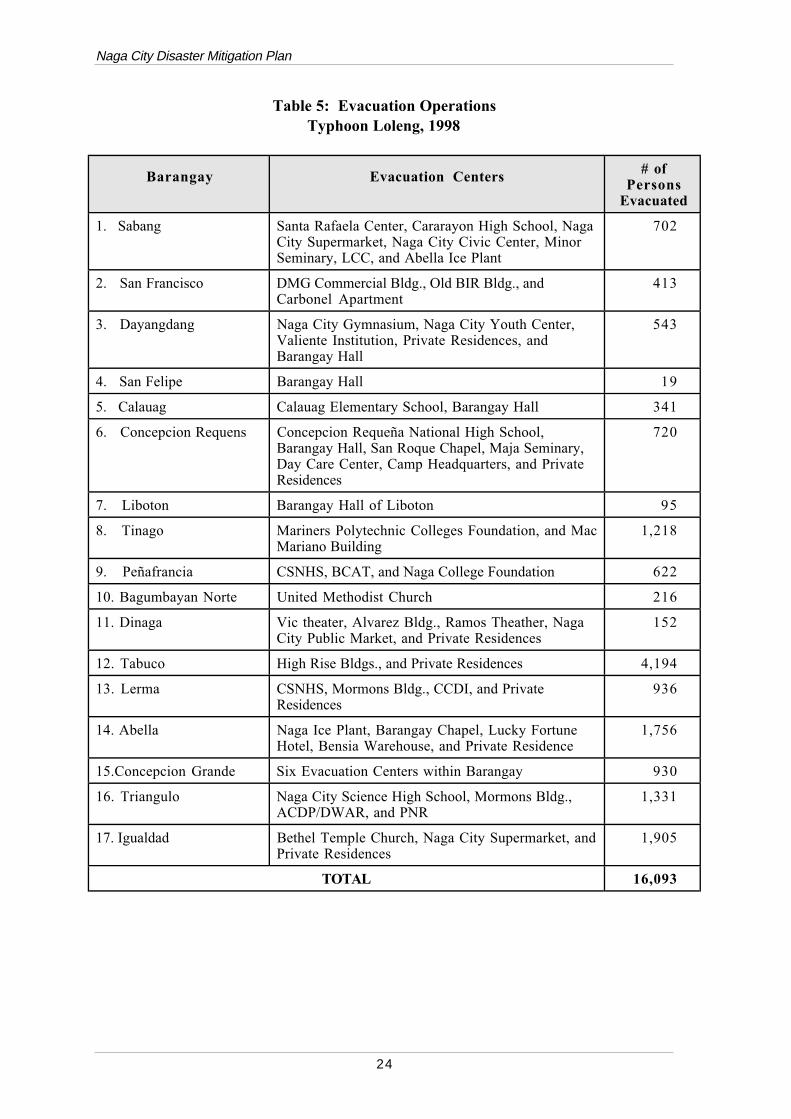
In anticipation to the occurrence of La Niña, the City Government has organized a La NiñaTask Force, with the City Health Office taking the lead. There are 17 barangays out of the27 barangays that are identified as flood-prone areas (see Table 6). A massive informationcampaign in coordination with the Barangay Councils was undertaken. A Plan of evacuationwas formulated with the concerned barangays. Evacuation centers were also identified foreach flood prone barangay, as shown in Table 4. The plan was put to test during typhoonLoleng in 1998. Although the evacuation centers allocation per barangay was not totallyfollowed, the plan facilitated the evacuation of about 16,093 persons in various evacuationcenters within and outside their respective barangays (see Table 5). It was observed that theevacuees preferred to evacuate on safe buildings within their barangays, or near theirresidence. This preference is quite understandable. First, they can easily transfer with lessrisk due to strong wind, and secondly, proximity of the evacuation center to their residencegive them some confidence and security that their houses will not be ransacked by thievessince they can oversee their area at any point of time.
iv. Private Initiative.
The common practice of some residents in Naga, for those who can afford the cost of landfilling, is to elevate their buildings above the recorded flood levels. This has, however, createdpockets of low lying areas without drainage, making their situation worse than before.
AUDMP Working Paper
23
Table 4: Recommended Evacuation Centers Under La Niña ProgramNaga City
Barangay Evacuation Centers
1. Abella Jade Bldg., Bichara Complex, High Rise Building within theBarangay, PNB, Grand Special Plaza, and Naga Central School II
2. Lalauag Calauag Elementary School, and Barangay Hall of Calauag
3. Dayandang Cararogan Elementary School, and High Rise Building withinBarangay
4. Dinaga High Rise Building within Barangay, and Naga City Public Market
5. Igualdad Naga City Public Market
6. Lerma Camarines Sur National High School, and High School Buildingwithin Barangay
7. Liboton Barangay Hall of Liboton
8. Mabolo Concepcion Grande Elementary Schools, and Del RosarioElementary School
9. Peñafrancia Camarines Sur National High School, Bicol College of Arts andTrades, Naga College Foundation, Romero Building
10. Sabang Cararagan High School
11. San Francisco High Rise Building within Barangay, and San Francisco Church
12. Sta. Cruz Carolina Elementary School
13. Tabuco High Rise Building within Barangay, and Local Elementary School
14. Tinago Mariners Polytechnic Colleges, and Villa Grande Elementary School
15. Triangulo Concepcion Pequeña High School, and Naga City Science HighSchool
16. Balatos Mac Mariano Elementary School, and Basilica Hall
17. San Felipe Maramba Elementary School
Naga City Disaster Mitigation Plan
24
Table 5: Evacuation OperationsTyphoon Loleng, 1998
Barangay Evacuation Centers # ofPersons
Evacuated
1. Sabang Santa Rafaela Center, Cararayon High School, NagaCity Supermarket, Naga City Civic Center, MinorSeminary, LCC, and Abella Ice Plant
702
2. San Francisco DMG Commercial Bldg., Old BIR Bldg., andCarbonel Apartment
413
3. Dayangdang Naga City Gymnasium, Naga City Youth Center,Valiente Institution, Private Residences, andBarangay Hall
543
4. San Felipe Barangay Hall 19
5. Calauag Calauag Elementary School, Barangay Hall 341
6. Concepcion Requens Concepcion Requeña National High School,Barangay Hall, San Roque Chapel, Maja Seminary,Day Care Center, Camp Headquarters, and PrivateResidences
720
7. Liboton Barangay Hall of Liboton 95
8. Tinago Mariners Polytechnic Colleges Foundation, and MacMariano Building
1,218
9. Peñafrancia CSNHS, BCAT, and Naga College Foundation 622
10. Bagumbayan Norte United Methodist Church 216
11. Dinaga Vic theater, Alvarez Bldg., Ramos Theather, NagaCity Public Market, and Private Residences
152
12. Tabuco High Rise Bldgs., and Private Residences 4,194
13. Lerma CSNHS, Mormons Bldg., CCDI, and PrivateResidences
936
14. Abella Naga Ice Plant, Barangay Chapel, Lucky FortuneHotel, Bensia Warehouse, and Private Residence
1,756
15.Concepcion Grande Six Evacuation Centers within Barangay 930
16. Triangulo Naga City Science High School, Mormons Bldg.,ACDP/DWAR, and PNR
1,331
17. Igualdad Bethel Temple Church, Naga City Supermarket, andPrivate Residences
1,905
TOTAL 16,093
AUDMP Working Paper
25
Figure 3: Naga City Urban Land Use Map
LOW DENSITY RESIDENTIAL
MEDIUM DENSITY RESIDENTIAL
HIGH DENSITY RESIDENTIAL
ARCADED HIGH INTENSITY COMMERCIAL
HIGH INTENSITY COMMERCIAL
LIGHT INTENSITY COMMERCIAL
AGRO-INDUSTRIAL
DUMPSITES
PUBLIC PARKS
AGRICULTURAL
AGRICULTURAL NURSERY
FOREST PARK/RESERVATION
LIGHT INDUSTRIAL
INSTITUTIONAL
CEMETERIES
WATER
LEGEND:
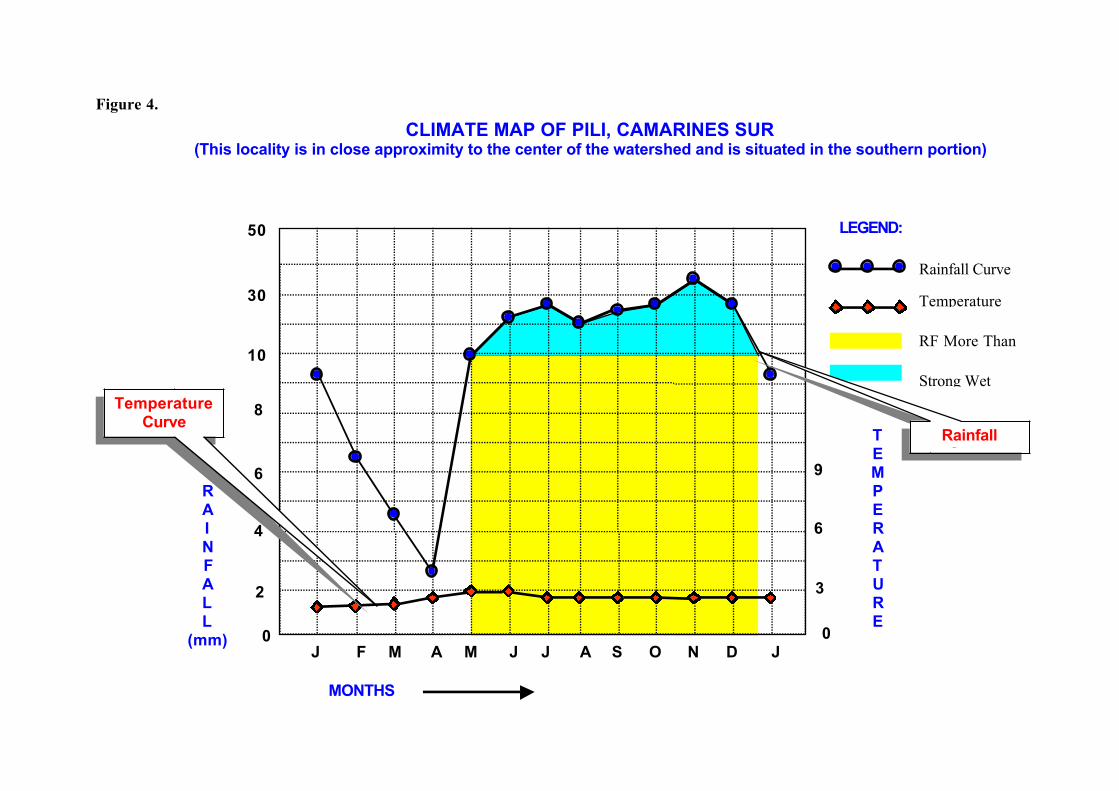
Figure 4.
0
2
4
6
8
10
30
50
J F M A M J J A S O N D J
RAINFALL
(mm)
TEMPERATURE
0
3
6
9
MONTHS
LEGEND:
Rainfall Curve
Temperature
RF More Than
Strong Wet
TemperatureCurve
CLIMATE MAP OF PILI, CAMARINES SUR(This locality is in close approximity to the center of the watershed and is situated in the southern portion)
RainfallC
AUDMP Working Paper
27
Figure 5. A Glimpse of Naga City
Naga City Disaster Mitigation Plan
28
Figure 6. Flood Prone Areas
AUDMP Working Paper
29
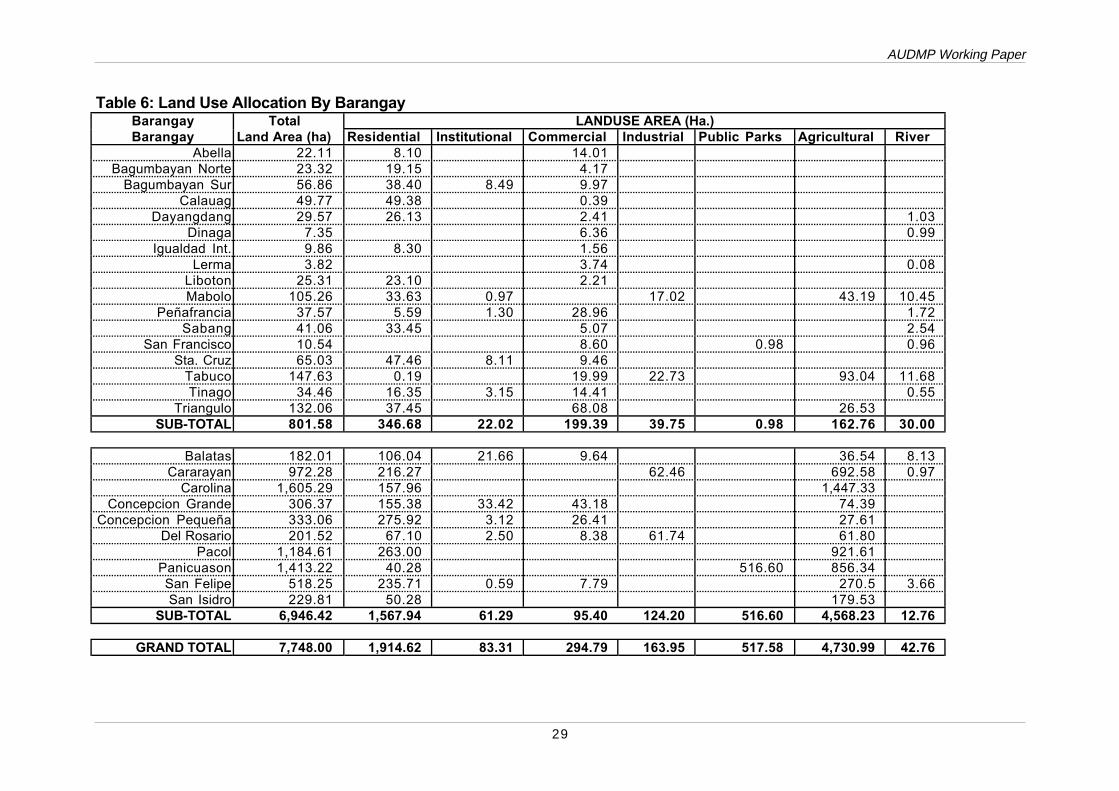
Table 6: Land Use Allocation By BarangayBarangay Total LANDUSE AREA (Ha.)Barangay Land Area (ha) Residential Institutional Commercial Industrial Public Parks Agricultural River
Abella 22.11 8.10 14.01Bagumbayan Norte 23.32 19.15 4.17
Bagumbayan Sur 56.86 38.40 8.49 9.97Calauag 49.77 49.38 0.39
Dayangdang 29.57 26.13 2.41 1.03Dinaga 7.35 6.36 0.99
Igualdad Int. 9.86 8.30 1.56Lerma 3.82 3.74 0.08
Liboton 25.31 23.10 2.21Mabolo 105.26 33.63 0.97 17.02 43.19 10.45
Peñafrancia 37.57 5.59 1.30 28.96 1.72Sabang 41.06 33.45 5.07 2.54
San Francisco 10.54 8.60 0.98 0.96Sta. Cruz 65.03 47.46 8.11 9.46
Tabuco 147.63 0.19 19.99 22.73 93.04 11.68Tinago 34.46 16.35 3.15 14.41 0.55
Triangulo 132.06 37.45 68.08 26.53SUB-TOTAL 801.58 346.68 22.02 199.39 39.75 0.98 162.76 30.00
Balatas 182.01 106.04 21.66 9.64 36.54 8.13Cararayan 972.28 216.27 62.46 692.58 0.97
Carolina 1,605.29 157.96 1,447.33Concepcion Grande 306.37 155.38 33.42 43.18 74.39
Concepcion Pequeña 333.06 275.92 3.12 26.41 27.61Del Rosario 201.52 67.10 2.50 8.38 61.74 61.80
Pacol 1,184.61 263.00 921.61Panicuason 1,413.22 40.28 516.60 856.34San Felipe 518.25 235.71 0.59 7.79 270.5 3.66San Isidro 229.81 50.28 179.53
SUB-TOTAL 6,946.42 1,567.94 61.29 95.40 124.20 516.60 4,568.23 12.76
GRAND TOTAL 7,748.00 1,914.62 83.31 294.79 163.95 517.58 4,730.99 42.76
Naga City Disaster Mitigation Plan
30
CHAPTER 3
HAZARD IDENTIFICATION AND ASSESSMENT
3.1 FLOODING AND TYPHOON HAZARD OCCURRENCE
3.1.1 Methodology for Hazard Identification and Mapping
A hazard map classifies the affected areas based on the magnitude of the hazard and thepotential physical damage inflicted on the area. It defines the physical extent of the areas atrisk. Hazard assessment is carried out for different probabilities of occurrence or returnperiods. In this study, the hazard assessment was done for a 5, 10 and 20 year return periodcovering hazards attributed to flooding and storm winds.
3.1.2 Flood Hazard Mapping
In the preparation of the flood hazard map, the magnitude of flooding was assessed using thedepth of flooding or inundation while the physical damage was assessed using the land usefunction. These two parameters were integrated and classified into the flood hazard map.
The steps involved in preparing the flood hazard maps are as follows:.i. Undertake a maximum one-day probability analyses and determine the equivalent
return period of the four storms.
ii. Prepare the flood inundation map using the flood depths at each zone and adjust thedepths using the topographic map.
iii. Classify the inundated areas according to the range of flooding depth (low, moderateand high).
iv. Prepare a land use map and classify the area according to its main functions(residential, commercial, industrial, agricultural and others).
v. Prepare the flood hazard map by integrating the flood inundation map and land usemap, and classifying the area according to its probable risk (low, moderate andhigh).
Naga City Disaster Mitigation Plan
32
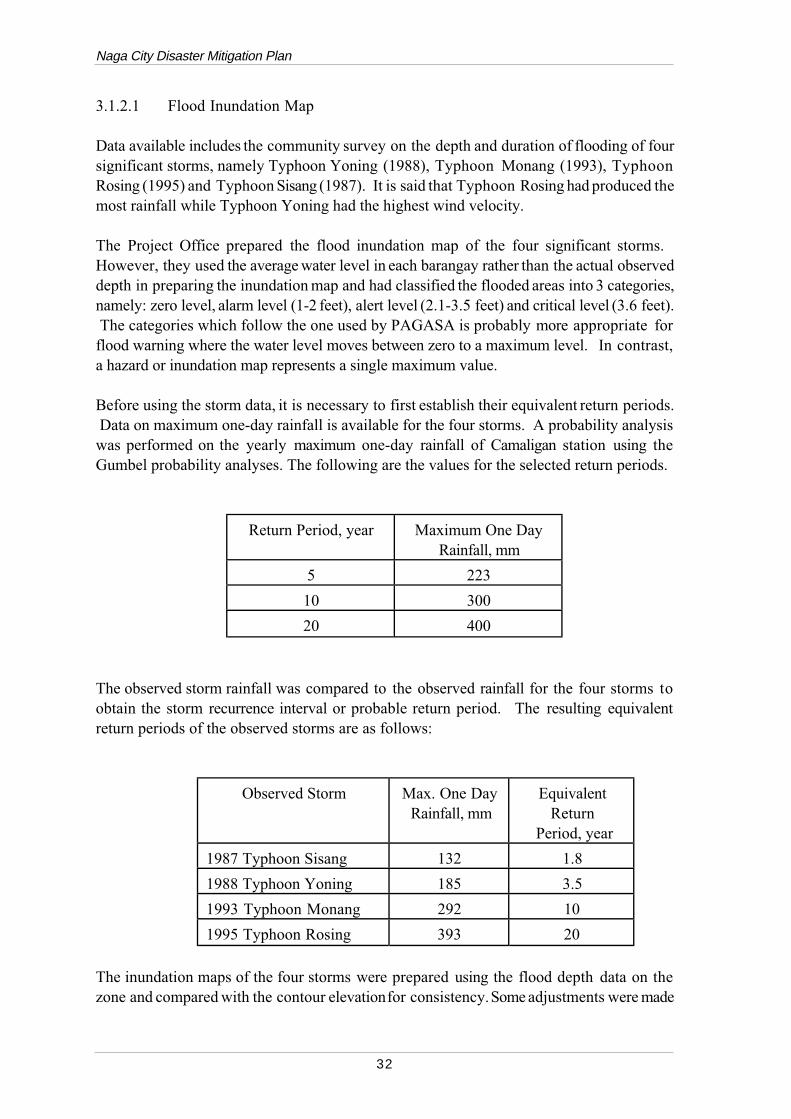
3.1.2.1 Flood Inundation Map
Data available includes the community survey on the depth and duration of flooding of foursignificant storms, namely Typhoon Yoning (1988), Typhoon Monang (1993), TyphoonRosing (1995) and Typhoon Sisang (1987). It is said that Typhoon Rosing had produced themost rainfall while Typhoon Yoning had the highest wind velocity.
The Project Office prepared the flood inundation map of the four significant storms. However, they used the average water level in each barangay rather than the actual observeddepth in preparing the inundation map and had classified the flooded areas into 3 categories,namely: zero level, alarm level (1-2 feet), alert level (2.1-3.5 feet) and critical level (3.6 feet). The categories which follow the one used by PAGASA is probably more appropriate forflood warning where the water level moves between zero to a maximum level. In contrast,a hazard or inundation map represents a single maximum value.
Before using the storm data, it is necessary to first establish their equivalent return periods. Data on maximum one-day rainfall is available for the four storms. A probability analysiswas performed on the yearly maximum one-day rainfall of Camaligan station using theGumbel probability analyses. The following are the values for the selected return periods.
Return Period, year Maximum One DayRainfall, mm
5 223
10 300
20 400
The observed storm rainfall was compared to the observed rainfall for the four storms toobtain the storm recurrence interval or probable return period. The resulting equivalentreturn periods of the observed storms are as follows:
Observed Storm Max. One Day Rainfall, mm
EquivalentReturn
Period, year
1987 Typhoon Sisang 132 1.8
1988 Typhoon Yoning 185 3.5
1993 Typhoon Monang 292 10
1995 Typhoon Rosing 393 20
The inundation maps of the four storms were prepared using the flood depth data on thezone and compared with the contour elevation for consistency. Some adjustments were made
AUDMP Working Paper
33
when the water levels on adjacent zones are significantly higher or lower and in instances,when the water level does not conform to the flood return period. The flooded area wasclassified into the following flood depth categories:
i. Low Flooding - less than 0.5 meter,
ii. Moderate Flooding - 0.51 to 1.0 meter, and
iii. Severe Flooding - greater than 1.0 meter.
These ranges of flooding were selected based on the potential physical damage that the floodcould inflict. Low flooding means that there will be minor damages, which will mostlyinvolve general cleaning. Moderate flooding means that damages will be limited to some homefurnishing, minor repair of houses and voluntary evacuation of some families. Severe floodingmeans that there will be significant damages to houses and evacuation of residents might benecessary.
Two storms have a return period equivalent to a 10-year and a 20-year magnitude. Theinundation maps of these two storms were adopted for the 10-year and 20-year returnperiod. For the 5-year return period, the flood inundation map was prepared by interpolatingthe flood depths of the observed storm with the 3.5-year and 10-year return period using theextreme value probability and compared with the contour elevation for consistency. Theflooding of the four typhoons documented by the Project Office has the following equivalentreturn period:
i. Typhoon Sisang (1987) - 1.8-year return period, see Figure 7,
ii. Typhoon Yoning (1988) - 3.5-year return period, see Figure 8,
iii. Typhoon Monang (1993) - 10-year return period, see Figure 9, and
iv Typhoon Rosing (1995) - 20-year return period, see Figure 10.
3.1.2.2 Land Use Map
The city government had recently approved the city’s land use that allocates the differentareas into different functions. The new land use map generally follows the present land useand categorizes the areas into the following main classification: agricultural, residential,commercial, industrial, institutional and parks/reservations. In terms of potential physicaldamage, the residential, commercial and industrial areas would be the most vulnerable whilethe parks, reservation and agricultural areas would be the least vulnerable.
Naga City Disaster Mitigation Plan
34
3.1.2.3 Flood Hazard Map
The flood inundation and land use maps were integrated to obtain the flood hazard map withthe area exposed to flooding classified according to the level of risk. The flood hazard wasclassified into the following categories:
Low Risk Area - Flood levels below 0.5 meters and all types of land use.
Moderate Risk - Flood depths of between 0.5 to 1 meter and classified asresidential, Area commercial and industrial.
High Risk Area - Flood depths greater than 1 meter and classified as residential,commercial and industrial
Using the above parameters and superimposing the flood inundation map over the land usemap, the flood hazard maps were formulated on different flood inundation as follows:
i. Flood Hazard Map for 5-Year Return Period,
ii. Flood Hazard Map for 10-Year Return Period, and
iii. Flood Hazard Map for 20-Year Return Period.
3.1.3 Wind Hazard Mapping
The assessment of the wind hazard was found to be more challenging compared to floodhazard due to the lack of information on the wind distribution during typhoon and theunpredictable response of the buildings to random wind gust. In obtaining the wind hazardmaps, the maximum wind gust was used in measuring the magnitude of the wind hazard whilethe relative density of high-risk building was used in gauging the potential physical damageto the standing structures. The steps involve in deriving the wind hazard map are as follows:
i. Undertake probability analyses to determine the probable wind gust speed for 2-year, 5-year, 10-year and 20-year return period;
ii. Prepare a topographic map (see Figure 17) and determine the wind correctionfactor for difference in elevation of each contour line;
iii. Prepare the wind intensity map by applying the probable wind gust speed to thecorrection factor and draw the wind speed isoline using the topographic contouras guide;
iv. Classify the area in the wind speed map into moderate, gale, and typhoonstrength;
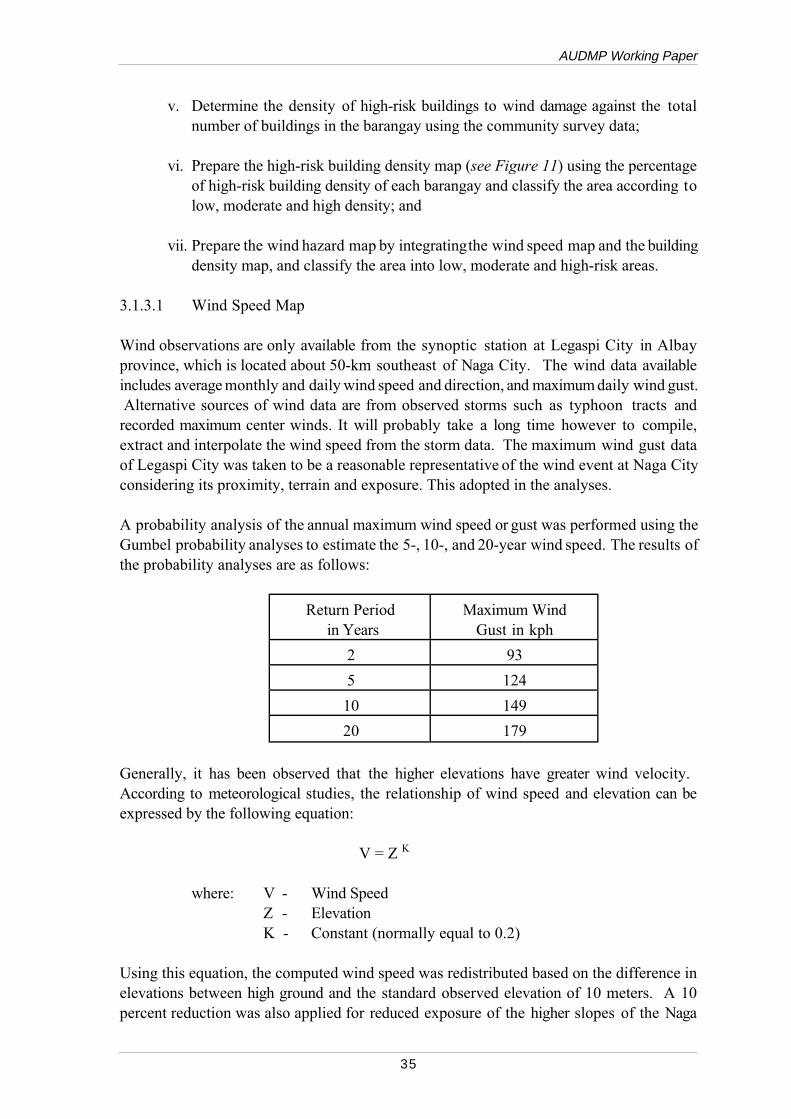
AUDMP Working Paper
35
v. Determine the density of high-risk buildings to wind damage against the totalnumber of buildings in the barangay using the community survey data;
vi. Prepare the high-risk building density map (see Figure 11) using the percentageof high-risk building density of each barangay and classify the area according tolow, moderate and high density; and
vii. Prepare the wind hazard map by integrating the wind speed map and the buildingdensity map, and classify the area into low, moderate and high-risk areas.
3.1.3.1 Wind Speed Map
Wind observations are only available from the synoptic station at Legaspi City in Albayprovince, which is located about 50-km southeast of Naga City. The wind data availableincludes average monthly and daily wind speed and direction, and maximum daily wind gust. Alternative sources of wind data are from observed storms such as typhoon tracts andrecorded maximum center winds. It will probably take a long time however to compile,extract and interpolate the wind speed from the storm data. The maximum wind gust dataof Legaspi City was taken to be a reasonable representative of the wind event at Naga Cityconsidering its proximity, terrain and exposure. This adopted in the analyses.
A probability analysis of the annual maximum wind speed or gust was performed using theGumbel probability analyses to estimate the 5-, 10-, and 20-year wind speed. The results ofthe probability analyses are as follows:
Return Period in Years
Maximum WindGust in kph
2 93
5 124
10 149
20 179
Generally, it has been observed that the higher elevations have greater wind velocity. According to meteorological studies, the relationship of wind speed and elevation can beexpressed by the following equation:
V = Z K
where: V - Wind SpeedZ - ElevationK - Constant (normally equal to 0.2)
Using this equation, the computed wind speed was redistributed based on the difference inelevations between high ground and the standard observed elevation of 10 meters. A 10percent reduction was also applied for reduced exposure of the higher slopes of the Naga
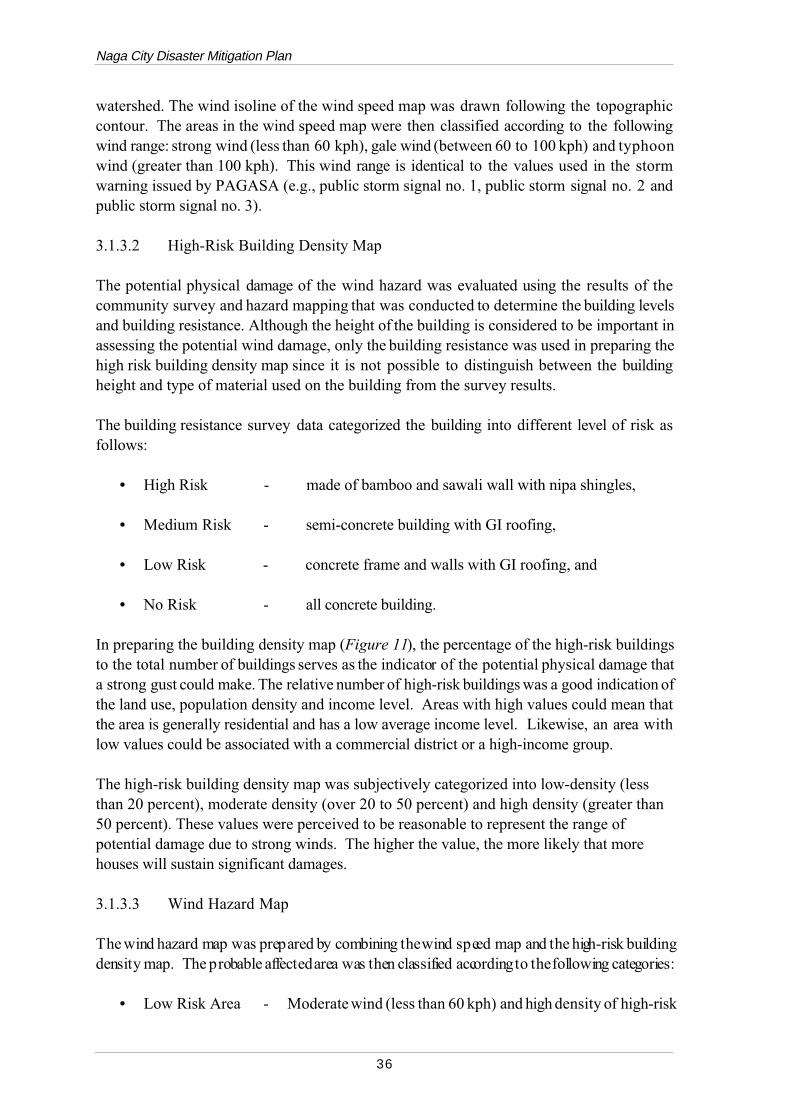
Naga City Disaster Mitigation Plan
36
watershed. The wind isoline of the wind speed map was drawn following the topographiccontour. The areas in the wind speed map were then classified according to the followingwind range: strong wind (less than 60 kph), gale wind (between 60 to 100 kph) and typhoonwind (greater than 100 kph). This wind range is identical to the values used in the stormwarning issued by PAGASA (e.g., public storm signal no. 1, public storm signal no. 2 andpublic storm signal no. 3). 3.1.3.2 High-Risk Building Density Map
The potential physical damage of the wind hazard was evaluated using the results of thecommunity survey and hazard mapping that was conducted to determine the building levelsand building resistance. Although the height of the building is considered to be important inassessing the potential wind damage, only the building resistance was used in preparing thehigh risk building density map since it is not possible to distinguish between the buildingheight and type of material used on the building from the survey results.
The building resistance survey data categorized the building into different level of risk asfollows:
• High Risk - made of bamboo and sawali wall with nipa shingles,
• Medium Risk - semi-concrete building with GI roofing,
• Low Risk - concrete frame and walls with GI roofing, and
• No Risk - all concrete building.
In preparing the building density map (Figure 11), the percentage of the high-risk buildingsto the total number of buildings serves as the indicator of the potential physical damage thata strong gust could make. The relative number of high-risk buildings was a good indication ofthe land use, population density and income level. Areas with high values could mean thatthe area is generally residential and has a low average income level. Likewise, an area withlow values could be associated with a commercial district or a high-income group.
The high-risk building density map was subjectively categorized into low-density (lessthan 20 percent), moderate density (over 20 to 50 percent) and high density (greater than50 percent). These values were perceived to be reasonable to represent the range ofpotential damage due to strong winds. The higher the value, the more likely that morehouses will sustain significant damages.
3.1.3.3 Wind Hazard Map
The wind hazard map was prepared by combining the wind speed map and the high-risk buildingdensity map. The probable affected area was then classified according to the following categories:
• Low Risk Area - Moderate wind (less than 60 kph) and high density of high-risk
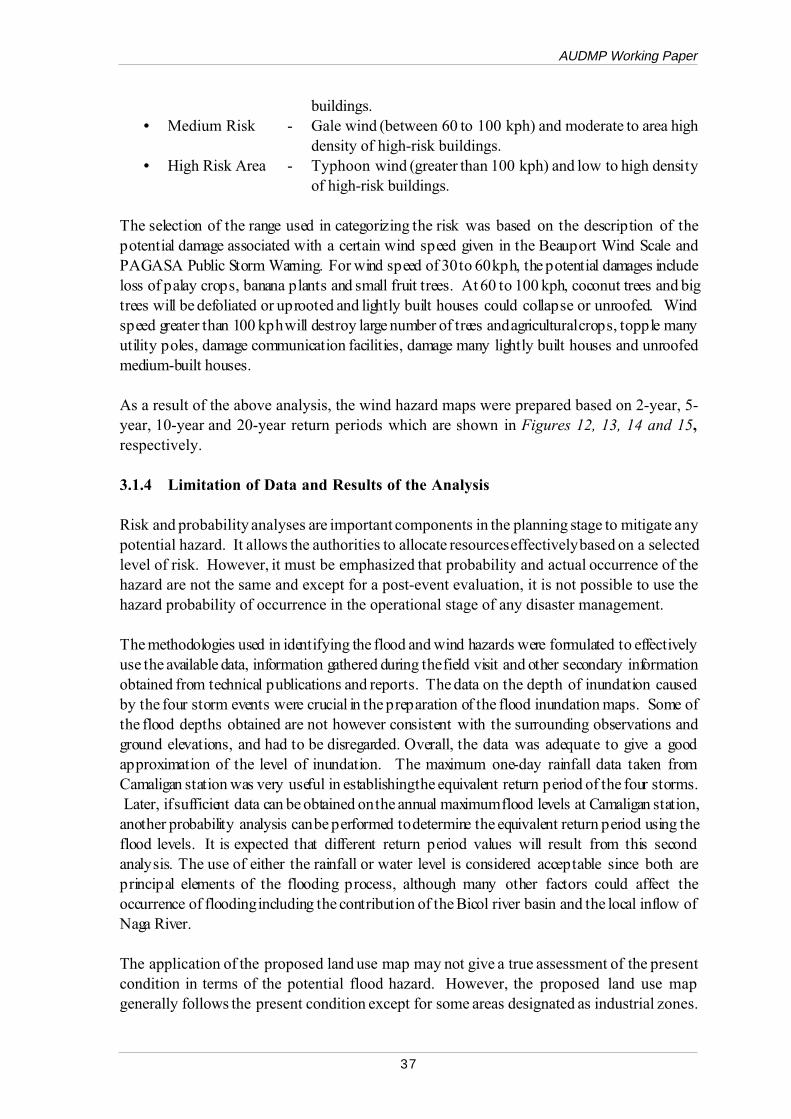
AUDMP Working Paper
37
buildings.• Medium Risk - Gale wind (between 60 to 100 kph) and moderate to area high
density of high-risk buildings.• High Risk Area - Typhoon wind (greater than 100 kph) and low to high density
of high-risk buildings.
The selection of the range used in categorizing the risk was based on the description of thepotential damage associated with a certain wind speed given in the Beauport Wind Scale andPAGASA Public Storm Warning. For wind speed of 30 to 60 kph, the potential damages includeloss of palay crops, banana plants and small fruit trees. At 60 to 100 kph, coconut trees and bigtrees will be defoliated or uprooted and lightly built houses could collapse or unroofed. Windspeed greater than 100 kph will destroy large number of trees and agricultural crops, topple manyutility poles, damage communication facilities, damage many lightly built houses and unroofedmedium-built houses.
As a result of the above analysis, the wind hazard maps were prepared based on 2-year, 5-year, 10-year and 20-year return periods which are shown in Figures 12, 13, 14 and 15,respectively.
3.1.4 Limitation of Data and Results of the Analysis
Risk and probability analyses are important components in the planning stage to mitigate anypotential hazard. It allows the authorities to allocate resources effectively based on a selectedlevel of risk. However, it must be emphasized that probability and actual occurrence of thehazard are not the same and except for a post-event evaluation, it is not possible to use thehazard probability of occurrence in the operational stage of any disaster management.
The methodologies used in identifying the flood and wind hazards were formulated to effectivelyuse the available data, information gathered during the field visit and other secondary informationobtained from technical publications and reports. The data on the depth of inundation causedby the four storm events were crucial in the preparation of the flood inundation maps. Some ofthe flood depths obtained are not however consistent with the surrounding observations andground elevations, and had to be disregarded. Overall, the data was adequate to give a goodapproximation of the level of inundation. The maximum one-day rainfall data taken fromCamaligan station was very useful in establishing the equivalent return period of the four storms. Later, if sufficient data can be obtained on the annual maximum flood levels at Camaligan station,another probability analysis can be performed to determine the equivalent return period using theflood levels. It is expected that different return period values will result from this secondanalysis. The use of either the rainfall or water level is considered acceptable since both areprincipal elements of the flooding process, although many other factors could affect theoccurrence of flooding including the contribution of the Bicol river basin and the local inflow ofNaga River.
The application of the proposed land use map may not give a true assessment of the presentcondition in terms of the potential flood hazard. However, the proposed land use mapgenerally follows the present condition except for some areas designated as industrial zones.
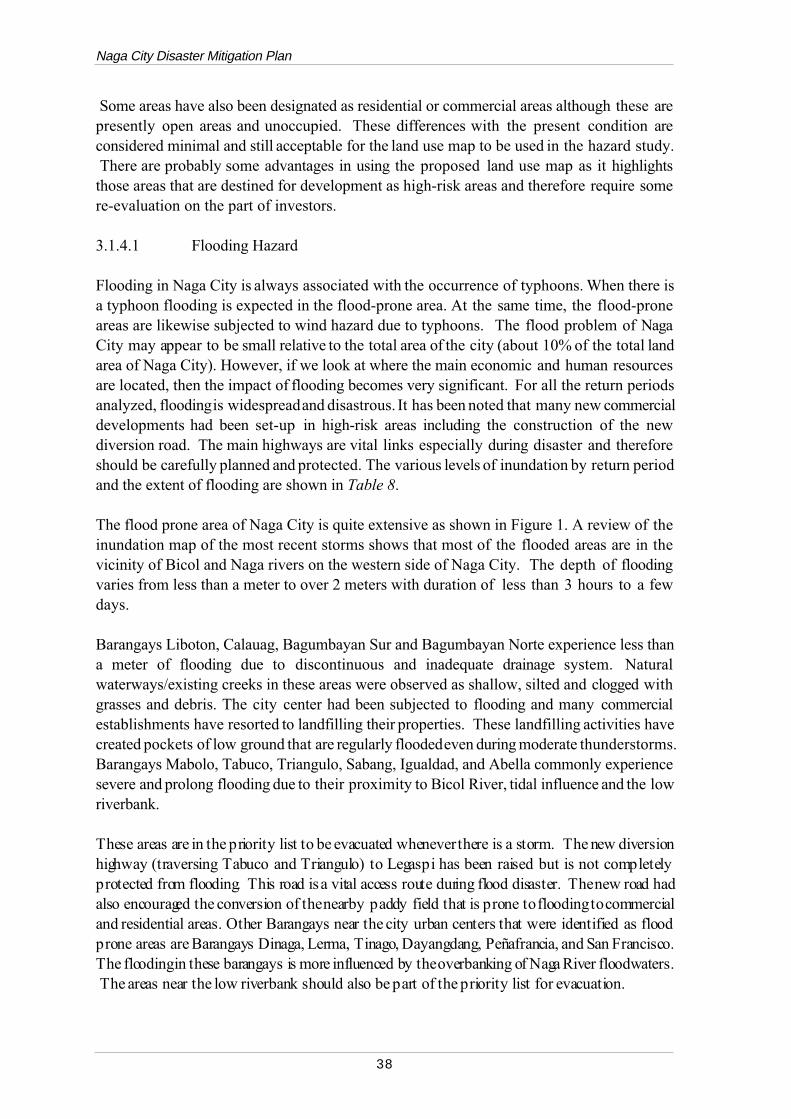
Naga City Disaster Mitigation Plan
38
Some areas have also been designated as residential or commercial areas although these arepresently open areas and unoccupied. These differences with the present condition areconsidered minimal and still acceptable for the land use map to be used in the hazard study. There are probably some advantages in using the proposed land use map as it highlightsthose areas that are destined for development as high-risk areas and therefore require somere-evaluation on the part of investors.
3.1.4.1 Flooding Hazard
Flooding in Naga City is always associated with the occurrence of typhoons. When there isa typhoon flooding is expected in the flood-prone area. At the same time, the flood-proneareas are likewise subjected to wind hazard due to typhoons. The flood problem of NagaCity may appear to be small relative to the total area of the city (about 10% of the total landarea of Naga City). However, if we look at where the main economic and human resourcesare located, then the impact of flooding becomes very significant. For all the return periodsanalyzed, flooding is widespread and disastrous. It has been noted that many new commercialdevelopments had been set-up in high-risk areas including the construction of the newdiversion road. The main highways are vital links especially during disaster and thereforeshould be carefully planned and protected. The various levels of inundation by return periodand the extent of flooding are shown in Table 8.
The flood prone area of Naga City is quite extensive as shown in Figure 1. A review of theinundation map of the most recent storms shows that most of the flooded areas are in thevicinity of Bicol and Naga rivers on the western side of Naga City. The depth of floodingvaries from less than a meter to over 2 meters with duration of less than 3 hours to a fewdays.
Barangays Liboton, Calauag, Bagumbayan Sur and Bagumbayan Norte experience less thana meter of flooding due to discontinuous and inadequate drainage system. Naturalwaterways/existing creeks in these areas were observed as shallow, silted and clogged withgrasses and debris. The city center had been subjected to flooding and many commercialestablishments have resorted to landfilling their properties. These landfilling activities havecreated pockets of low ground that are regularly flooded even during moderate thunderstorms.Barangays Mabolo, Tabuco, Triangulo, Sabang, Igualdad, and Abella commonly experiencesevere and prolong flooding due to their proximity to Bicol River, tidal influence and the lowriverbank.
These areas are in the priority list to be evacuated whenever there is a storm. The new diversionhighway (traversing Tabuco and Triangulo) to Legaspi has been raised but is not completelyprotected from flooding. This road is a vital access route during flood disaster. The new road hadalso encouraged the conversion of the nearby paddy field that is prone to flooding to commercialand residential areas. Other Barangays near the city urban centers that were identified as floodprone areas are Barangays Dinaga, Lerma, Tinago, Dayangdang, Peñafrancia, and San Francisco.The flooding in these barangays is more influenced by the overbanking of Naga River floodwaters. The areas near the low riverbank should also be part of the priority list for evacuation.
AUDMP Working Paper
39
3.1.4.2 Wind Hazard
Wind hazard is quite different to flood, as the latter is more physical, stable and lasting. Strong wind accompanying a typhoon varies in time, location and exposure. Wind occurrenceis also more difficult to evaluate and predict. Storm winds come in short burst or gust andchange direction frequently. Wind observations are taken from a few synoptic stationsrepresenting a small sample thus, leaving many areas with no data at all. The effects of thestorm winds also vary. Strong wind could pass through an area and not all of the houses ofthe same material will be affected to the same degree. The wind could be deflected anddispersed by sloping ground, tall trees and buildings.
The maximum wind gust speed was used in measuring the magnitude of the storm winds. Aprobability analysis was performed to determine the probable wind gust speeds. The windspeed maps for the 5-year, 10-year and 20-year return period show that the whole city willhave a maximum wind gust greater than 100 kph. Another wind speed map was prepared fora 2-year return period to illustrate the effects of lower wind speed.
The high wind speed shown in the maps is alarming but does not mean that all the houseswill be destroyed and crops damaged. A wind gust is only a short bust of strong wind andit takes a prolonged and consistent strike to unroof a house. The wind effect on the housesand other standing structures will not be the same throughout and other factors affect thewind flow and intensity. The maximum wind gust seems not to be an effective measure ofthe hazard’s magnitude as it takes many wind gusts to have an impact. The maximum windrun for 1 hour or more could be a better alternative but this type of data is not available anddifficult to obtain. A relationship between the maximum wind gust and the maximum onehour wind run could be prepared and applied but again it will probably require a lot of timeand effort to prepare such an equation. In the meantime, the maximum wind gust is the bestparameter to use in the hazard study and considering further that the maximum wind gust isonly a small sample of the wind values in the surrounding area and throughout the day, thenmany wind gust of the same or even stronger magnitude could have occurred and had not beenrecorded.
The physical damages attributed to storm winds were measured using the density of high-riskbuilding in a barangay. It is a good parameter to measure the threshold of potential damage.A moderate wind will damage crops but will have only a minimal effect on a lightly builthouse. With gale wind, the same type of houses will be severely damaged or destroyed whilea typhoon wind could partially damage even stronger built houses.
The wind hazard map was prepared by integrating the wind speed map and the high-riskbuilding density map and categorizing the level of risk. Looking at the wind hazard maps, itmay seem strange that the agricultural areas are categorized as high hazard map although inthe flood hazard map it is classified as low hazard. The reason for the difference is that inflooding the number of houses affected is important while in the wind hazard mapping thestrength of houses is the principal consideration. Table 9 (Settlement and Housing Data)shows that about 24% of houses or 7,270 out of 29,208 houses, are at high risk due to windhazards at various return periods.
Naga City Disaster Mitigation Plan
40
3.2 LAND USE AND FLOODING
3.2.1 Flood Hazard: Natural Propensity
The Naga Proximity Map (see Figure 16) illustrates the fact that Naga is located in thefloodplain of Camarines Sur province. Moreover, it has been often asserted that the city'surban area was part of San Miguel Bay itself thousands of years ago. The Topographic Map(see Figure 17) clearly shows that the urban core of Naga is in the lowest lying end of thecity's land area. All of the built up area of the city is within the 0 to less than 5-meterelevation. The fact is a major part of presently urbanized Naga is naturally prone to flooding. It is asserted, however, that historically the city did not experience floods as frequently, asdeeply and as long as in recent times.
Official studies point to a combination of factors on top of its natural propensity to floodingas the reason for more extensive flooding. These are: the denudation of the Mt. Isarogwatershed, flooding problems upstream of the Bicol river all the way to Albay province, thecurrent incapacity of the Naga river to efficiently absorb storm rainwaters and the serioussiltation of the San Miguel estuary. This combination of problems obviously cannot beaddressed piecemeal and until these are addressed comprehensively and systemically,flooding will continue to be a seasonal part of present Naga cityscape. When it floods, particularly a 5-year return period magnitude and higher, the southern partof the built up area including the city's urban core suffers severely. Commerce stands still.Transportation from North to South is cut and transportation terminals do not operate.Recreational and shopping activities in and around the central business district cease. Schoolsand offices are naturally closed. Hospitals in the flood zone become isolated.
Moreover, historical data on flooding seem to indicate a progressively increasing level andcoverage of flooding. Based on this experience, new construction invariably involves landfilling such that buildings are now elevated several meters above street level. Such recentpractices in turn tend to induce new patterns of flooding in proximate areas. For instance,the higher areas of Bagumbayan Norte and Sur and Peñafrancia are now inundated when upto 1987 they were not. The Dinaga area is also now more severely flooded than before.
3.2.2 Flood Hazards: Human Faults
Previous studies already point to certain old unhealthy practices and recent developments thatexacerbate Naga's flooding problems. Certain practices have been identified to be simply harmfulto the common good, and these practices were mandated to be brought to a halt. However,enforcement has been unsustained and hence ineffective. Moreover, certain private and publicactions have independently and/or in combination led to sub-patterns of land uses that haveunwittingly brought more harm than good to the general welfare. In certain cases, thesedevelopments served to mitigate the flooding problem in a particular area but adversely affectedcommunities in other areas.
One of the most environmentally sensitive ecosystems is rivers and streams. In these cases, it
AUDMP Working Paper
41
is imperative to assert an open strip of land on each side of the river or stream to maintain theintegrity of the system. These strips of land called stream environmental zones have a width thatis determined by ground investigation based on soil type and how surface water filters into theground, the types and amount of vegetative cover and how it stabilizes the soils, the slope of theland within the zone and how significant it is for retaining sediment from reaching the streams.The intent is to preserve the natural environmental qualities and functions of the land to purifywater before it reaches the stream.
In the case of Naga, an environment zone in the Bicol and Naga river systems was determinedto be at least three meters in width. This policy of maintaining a three-meter buffer zonealong the riverbanks was also seen as a way of preventing solid wastes and sewage to bethrown into the river, which result in clogging and heavier sedimentation. The policy wasapproved by the city and ordered enforced but with little success to this day due toresistance by homeowners along the riverbanks and outright squatters.
The age old practice of squatting on riverbanks and sensitive stream areas have continueddespite a focused effort to rid the Naga and Bicol rivers of squatters. The same situation hasdogged programs prohibiting waste disposal into the river systems. These are clearlyproblems of enforcement will rather than law and policy.
The rise of flooding levels and increase in duration in the Dinaga area has been attributed to theflood compounding effect of the flaw in drainage design of the "Panganiban Ugrading andBeautification Project" which saw the construction of duplexes and rowhouses for lightcommercial use on the PNR right of way strip in the Southern side of Panganiban Drive. The oldalignment of the drainage system, which had rainwater flowing through culverts acrossPanganiban and the railroad tracks, allowed floodwaters to drain southwards towards the BicolRiver. The filling-in of the culverts redirected flood water run-off along Panganiban Drive itself(i.e., the road became the drainage vehicle and thus becomes an artificial creek during typhoonseason) towards the Naga river which because of undercapacity ends up throwing back thewaters over its banks particularly onto the Dinaga side of the river.
A more recent development that was the offshoot of a policy, was the decision to promote acommercial growth area in the Triangulo and Tabuco districts. The growth area, estimated atabout 275 hectares, is centered on the development of the erstwhile agricultural and open marsharea at the center of Barangay Triangulo.
3.2.2.1 The CBD II
A large stadium built on landfilling that raised the structure at least three meters from theoriginal ground level is already nearing completion. Moreover, an expansive bus terminalcomplex has been practically completed within the same location and is awaiting finishingtouches and occupancy. East of the bus terminal complex, concrete roads mark an area wherefurther construction is soon due. The development approved and supported by the City isdubbed the Central Business District II (CBD II) project and is designed to become exactlythat - a new central business district on the other side of the Naga river somewhatperpendicular to the original CBD.
Naga City Disaster Mitigation Plan
42
Part of the area of CBD II, although privately owned, had naturally functioned before as aflood retention basin for Naga floodwaters. Even today, one can watch children take a swimin the natural depression that turns into a "swimming pool" after the rains. There is a realneed to investigate the characteristics of the CBD II project site to determine without doubtwhether its conversion into high intensity commercial use will not generate undesirableeffects elsewhere. Already, proximate communities are complaining of severe flooding wherebefore flooding was marginal. Another has complained of longer duration flooding andincreased depths. It should be noted that allocation of the natural hydrology is always boundto create prolonged of flooding either within or adjacent to the affected area.
The predicted pattern usually involves undesirable effects in the ground water table also. Itis in the nature of natural water catchment basins to serve as an aquifer to recharge theunderground water table. The planned CBD II area might be integral to the sustainability offresh water aquifers in Naga and the wholesale conversion of this 279-hectare area mightnegatively impact on such sustainability. At this time, the basic source of water supply ofmany areas in Naga is ground water and the aforesaid scenario deserves looking into andaddressing.
Additionally, the compacting and building over of this former marshland will increase thevelocity of water run-off. Since the CBD II will obviously be raised, water that historicallyaccumulates in the Triangulo basin will fan out probably east and West. If this happensflooding could compound the Concepcion corridor in the East and exacerbate flooding in theoriginal CBD. Otherwise, flooding will spread out of CBD II and transfer elsewhere withinthe urban area.
The CBD II project exemplifies a policy development that has made a fundamental impactof Naga's land use pattern and threatens to bring increased flooding. The 1978 Naga LandUse Plan, wittingly or unwittingly, preserved the natural depressions as floodwatercatchment and drainage areas when they were delineated agricultural (green) areas and formedthem into a rough band encircling the CBD and high-density residential areas of the city. This band, which included the present CBD II area, acted as a buffer for potentialfloodwaters rushing down from higher ground and continued to be natural retention areas.
While these areas were privately owned, they remained compatibly agricultural in use due tothe high investment costs of alternative uses i.e. commercial or residential subdivisions. Thehigh cost of filling and construction plus history of floods were not only disincentives forproperty owners to build, they were also unattractive to real estate buyers. Hence, thesespaces remained open and green and agricultural in use and remained as such because asagricultural lands within an urban setting, they were not essential for urban access and hencewere not systematically integrated into the urban circulation network. Another crucial factorwas the government’s failure to provide effective flood mitigation measures in those areas. In fact, they were apparently recognized as natural water catchment areas and city drainagesystems were oriented to empty into them. Incentives to develop these marsh areas wereunheard of.
Thus, these green areas remained open interstices within the urban spread of Naga City both
AUDMP Working Paper
43
by market neglect and by 1978 urban land use policy. But benign neglect in the market doesnot continue indefinitely. The real estate boom in Naga in the late 80s forced owners of largelandholdings to review the utility of their lands versus potential income if these wereconverted to urban uses. Costs were still high, flooding had not gone away but the newelement was the override of the 1978 land use plan and its corresponding zoning.
Where before the government did not pay attention to the open interstices, in the early1990's, the city promoted real estate-led development and effectively induced realtydevelopment in the green areas and vacant spaces. The 1978 Land use Plan was pronouncedto be no longer in effect and zoning liberalization effectively proceeded and land use on thegreen buffer zones were reclassified as residential or commercial.
3.2.3 Review of Naga Land Use Plan
Land capability involves a judgement of land for its highest and best value. For some time,it was thought that the market value for land would be the best objective criterion for its bestuse based of course on the principle of economic efficiency. Historical experience, however,has illustrated that a judgement of a particular location's land use based on economicefficiency alone (i.e., without a bold understanding of the land’s natural processes), usuallyleads to tragic social costs. In the specific case of Naga City, which is located on a floodplain, is at the junction of two major rivers, and is naturally vulnerable to flooding. It iscritical that land use planning takes primary consideration of the flooding hazard and thenatural processes of the land and the water bodies within the city’s land uses. 3.2.3.1 The 1978 Land Use Plan
In looking into the present Land Use Plan, it would be fruitful to first examine itspredecessor, the 1978 Land Use Plan (see Figure 19). The records of the planning processinvolved in Naga's 1978 Land Use Plan have reportedly been lost to the scourge of termites. However, it is obvious that the 1978 planners were conscious of the flooding problem. Inthe 1978 Comprehensive Zoning Ordinance, a category of "flood zone" had been provided.The ring of agricultural (green) areas that was mandated around the built-up area of the cityincluded spaces that had long acted as natural water catchment areas. It could be argued thatthe 1978 planners did not mean to restrict the urban area's expansion but sought to helpdivert flooding from the urban core to natural floodwater catchment areas, around the city. The wide green bands (agricultural use) delineated in the East was to serve as a buffer tomitigate the threat of flooding due to heavy water run-off from Naga's higher ground. Thefact that these spaces were still actively utilized as agricultural areas or were idle marshlandmade the land use delineation convenient and non-contentious at that time.
The population of Naga in 1977 was about 83,400 with a density of 10.75 per hectare acrossthe entire land area. Urban center population was estimated at about 58,000. Assuming itsgrowth rate at that time of about 1.5 percent per annum, it was projecting a population ofabout 63,400 in 1983 and about 68,300 people in 1988. Considering these indicators, the1978 Land Use Plan, for the timeframe that it was planned for, addressed the projected needsof Naga's urban area. It had allowed sufficient space for expansion for both population change
Naga City Disaster Mitigation Plan
44
and increase in economic activities based on the current growth rate at that time. Prudently,it mandated the retention of agriculture in the upper Eastern reaches and the development offorest cover in Naga's Mt. Isarog watershed area.
However, by 1980 it became obvious that a previous estimate of the population growth wasgrossly inaccurate. In that year, the population of the urban area had grown to 63,181, whichwas already equal to the projected urban population in 1983. Density in the urban area injust about three years had increased to about 79 from 72 persons per hectare. The increasein Naga's population and urban activities was simply running way ahead of the projections. This should have been a good time to review the Plan and make adjustments for the highergrowth rates than what was anticipated.
3.2.3.2 Context of the Present Land Use Plan
As noted by present city planners, the 1978 Plan has been "already outpaced by rapidurbanization." They further observed that by 1995, "the scope of urbanization has so widelyexpanded that new types of urban functions and commercial activities ... alien to (1978)zoning regulations have sprouted. Determining the right zoning for such activities hasbecome a problem." The last cited statement underlined the approach to the formulation ofNaga's new land use plan.
Urban Function:
All parts of the urban area are easily accessible. Indeed, the urban road system is highlyarticulated resulting in a circulation system that gives easy access to all residents. There are155.9 kilometers of road (see Figure 20) which is over the standard of 1 kilometer per 100hectares, public intra-city transportation is well served by motorcycle cabs called"trimobiles" (71%), jeepneys (12%), buses (1%), of average daily traffic. Private modes oftransport account for other transport within the city. Inter-regional travel is also efficientlyprovided by bus (15 bus companies), car rental and train on land, by plane on two airtransport firms, and motorized banca by river. These firms needed support facilities and thusterminals started proliferating. Of the seventeen formal bus terminals, at least 10 are in theFlood Hazard Zone (FHZ).
Every part of the city is locationally accessible to a lifeline facility. Its medical personnel andfacilities ratio are higher than standard. Bed to population ratio is 3.8 per 1,000 (nationalstandard is 1:1,000). There is one doctor per 684 persons and one dentist per 1,294 (thenational ratio is one doctor and one dentist: 20,000). However, at least half of the hospitalsare in the flood hazard zone and only one (St. John hospital) is isolated during floods. Upto one third of all day care centers are in the flood zone.
The growth of business establishments in Naga for the last ten years is unprecedented. Several shopping centers, malls, "satellite" markets have mushroomed. Similarly, hotels andbanks also increased or expanded. In Naga, there are 74 educational institutions. However,the majority or most of these are located in the FHZ.
AUDMP Working Paper
45
Population and Density:
Population density per hectare was 92 at its urban core in 1995 (most dense ten percent ofthe urban area) which compares to Manila's 123 per hectare. A glance at Table 7 (PercentChanges in Population) underlines the recent shifts in land uses and their impact onpopulation movements. Conversion from residential dwellings in the Abella area to businessestablishments has resulted in negative population growths. New housing in the Calauag andCararayan area has resulted in great increases in density. But perhaps the most dramaticincrease in density and number of households is in Barangay Del Rosario towards Pili. Here,between 1990 and 1995, the annual growth rate was 35 %. Nevertheless, in terms of absolutedensity, the communities within the CBD and urban core are still the densest.
3.2.3.3 Present Land Use and Zoning Objectives
The present Land Use Plan and Zoning (LUPZ) for Naga City (Figure 21) was crafted in1996 specifically with the following objectives:
a. To maximize the city's potentials for urban growth by opening up new areas forurban use without prejudice to the policy of the government to preserve primeagricultural lands and promote sustainable ecological balance;
b. To further strengthen the city's role as the regional center of commerce, trade,services, education, religion and culture;
c. To further enhance the functional character of the Central Business District (CBD)by continually undertaking redevelopment and urban renewal programs;
d. To designate new areas as growth centers by integrating functional areas into acomprehensive whole by establishing a more coherent relationship among places ofresidence, work, recreation, shopping, and education;
e. To strengthen the character or identity of each functional area by eliciting privateinitiatives; and
f. To improve accessibility, transport and road network system.
3.2.3.4 Urban Development Strategy
The strategy for pursuing these development objectives has been described as a "compacturban development strategy" which seeks to maximize the utilization of urban services withinthe built up area, sustain the "vitality of its present central business district", and minimize"dead" lands within the urban area of Naga. That is to say that it was decided to consolidateurbanization within the built up area by inducing the development of all vacant and greenspaces within it and simply enhance existing urban services for the intensifying activitieswithin the CBD and the added requirements ensuing from the aforesaid decision. Theintention was to complete the concentric development pattern within the historical urban
Naga City Disaster Mitigation Plan
46
area.
This strategy rationalized previous initiatives involving the commercial strip developmentalong the PNR right of way along Panganiban Drive, the "satellite market" program whichallowed the establishment and provided incentives for private markets within the presenturban area, and, lastly, the decision to develop a new central business district called CBD IIin the Triangulo-Tabuco area straddled by the Naga Diversion road.
In addition, the Approved Land Use Map (see Figure 21), made it also clear that theplanners anticipated and legitimized strip development along the Pacol portion of the SanFelipe-Carolina road to the junction with the San Isidro-Carolina road, strip developmentalong the middle portion of the Cararayan road, and corridor development from theMagsaysay crossing all the way to the boundary of Pili along Panganiban Drive and thenational highway. It also promotes a San Isidro "agro-industrial zone" on the southeasternside of Naga’s land area.
3.2.3.5 Design Oversight in the Particular Context of Flooding Hazard. From the perspective, however, of the flooding hazard, it cannot but be observed that certainoversights in the design of the present Land Use Plan might have occurred. Its strategy ofexplicitly converting into commercial and residential zones the agricultural and open spaceswithin the built up area delineated by the 1978 Plan as green areas fails, to give due regard tothe flood mitigation functions of these lands. The deliberate development of the Trianguloand Tabuco areas into high intensity commercial zone, i.e., a new central business district, didnot take cognizance of the probable vulnerability of these and outlying areas to flooding andtherefore the possible risk of economic and social losses. Discussions on the current plansand an ocular inspection of the CBD II area did not reveal a drainage system designed for atleast a five year return period flood level and provisions for staving-off the spread of floodwaters to outlying areas.
Obviously the current Land Use Plan follows the principle that built-up areas should belocated where urban density and full urban services already exists. However, it needs toconsider that conservation areas such as open space systems that contain beneficial naturalprocesses may pierce developed areas. Moreover, the urban transition areas should NOT belocated in hazardous zones, or in highly vulnerable natural systems, or land needed forcatchment area for waters. That the flood prone area that is the current site of CBD II wasnot subjected to hydrological studies first may indicate an oversight in planning.
Furthermore, the other "dead" lands anticipated to be converted to medium densityresidential areas within the urban area on its western side are within the zonal valuations thatare very expensive for the middle class Naga family and even more prohibitive for lowerincome groups. These areas close to Camaligan may also not appeal to would-be homeownersas they are in severe flood hazard zones and development costs could, therefore, be higherthan average. On the other hand, high rise buildings that could make developmentinvestments more viable are technically at risk since the liquefaction factor in the areaprohibits high rise buildings or allows them at very high costs of construction.
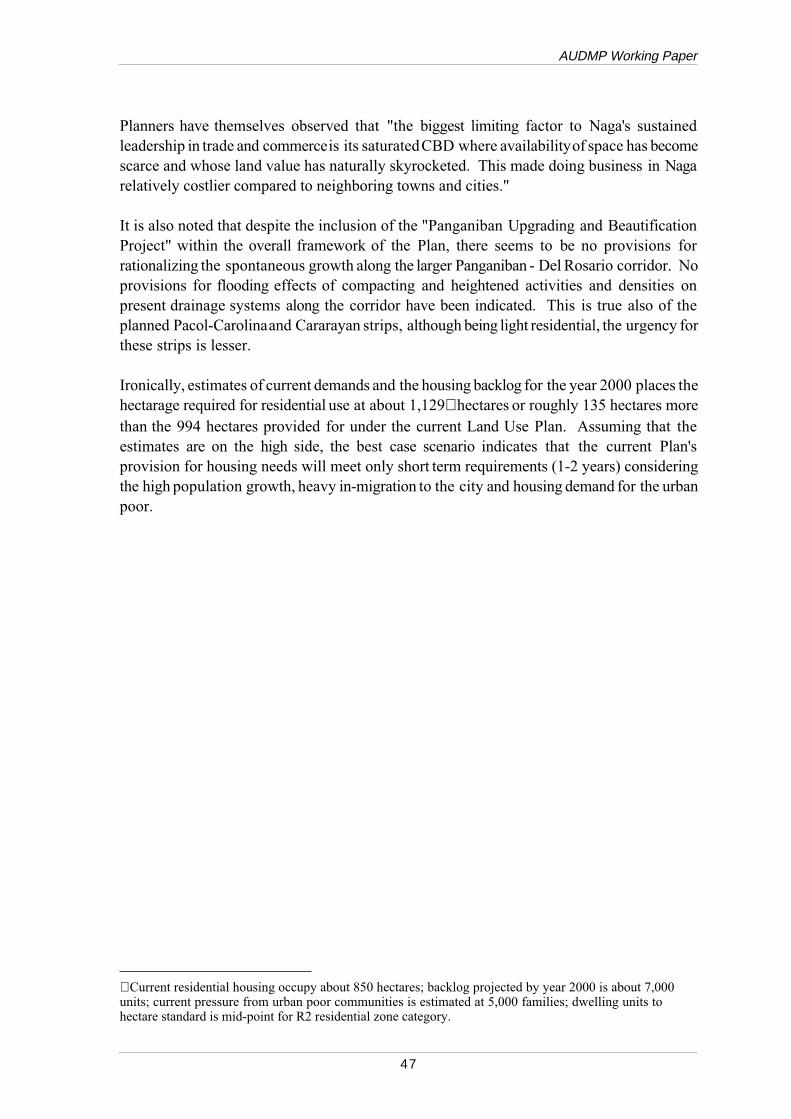
AUDMP Working Paper
47
Planners have themselves observed that "the biggest limiting factor to Naga's sustainedleadership in trade and commerce is its saturated CBD where availability of space has becomescarce and whose land value has naturally skyrocketed. This made doing business in Nagarelatively costlier compared to neighboring towns and cities."
It is also noted that despite the inclusion of the "Panganiban Upgrading and BeautificationProject" within the overall framework of the Plan, there seems to be no provisions forrationalizing the spontaneous growth along the larger Panganiban - Del Rosario corridor. Noprovisions for flooding effects of compacting and heightened activities and densities onpresent drainage systems along the corridor have been indicated. This is true also of theplanned Pacol-Carolina and Cararayan strips, although being light residential, the urgency forthese strips is lesser.
Ironically, estimates of current demands and the housing backlog for the year 2000 places thehectarage required for residential use at about 1,129∗ hectares or roughly 135 hectares morethan the 994 hectares provided for under the current Land Use Plan. Assuming that theestimates are on the high side, the best case scenario indicates that the current Plan'sprovision for housing needs will meet only short term requirements (1-2 years) consideringthe high population growth, heavy in-migration to the city and housing demand for the urbanpoor.
∗ Current residential housing occupy about 850 hectares; backlog projected by year 2000 is about 7,000units; current pressure from urban poor communities is estimated at 5,000 families; dwelling units tohectare standard is mid-point for R2 residential zone category.
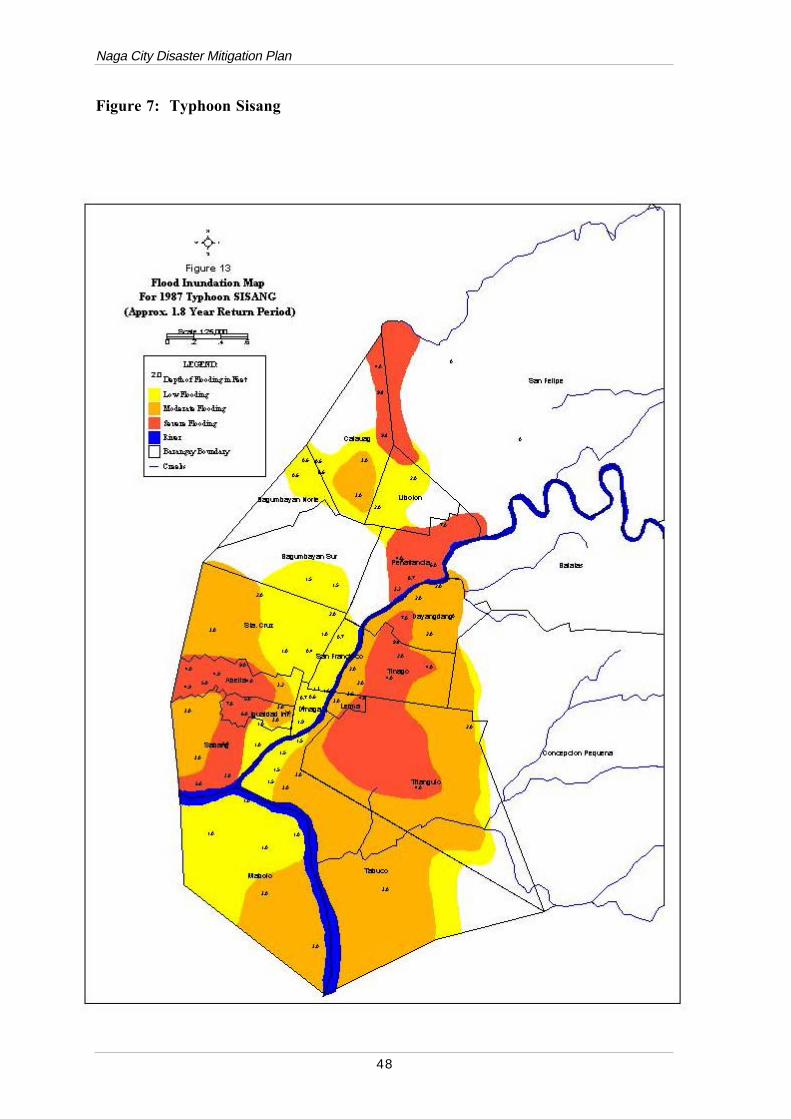
Naga City Disaster Mitigation Plan
48
Figure 7: Typhoon Sisang
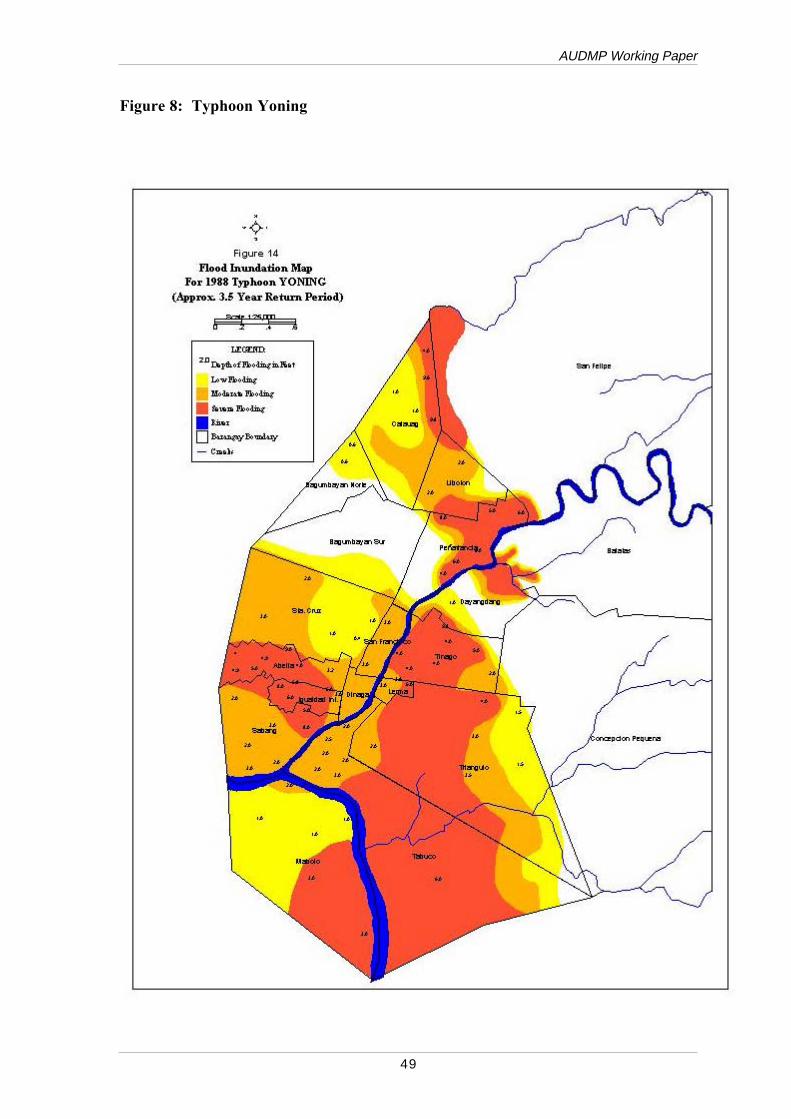
AUDMP Working Paper
49
Figure 8: Typhoon Yoning
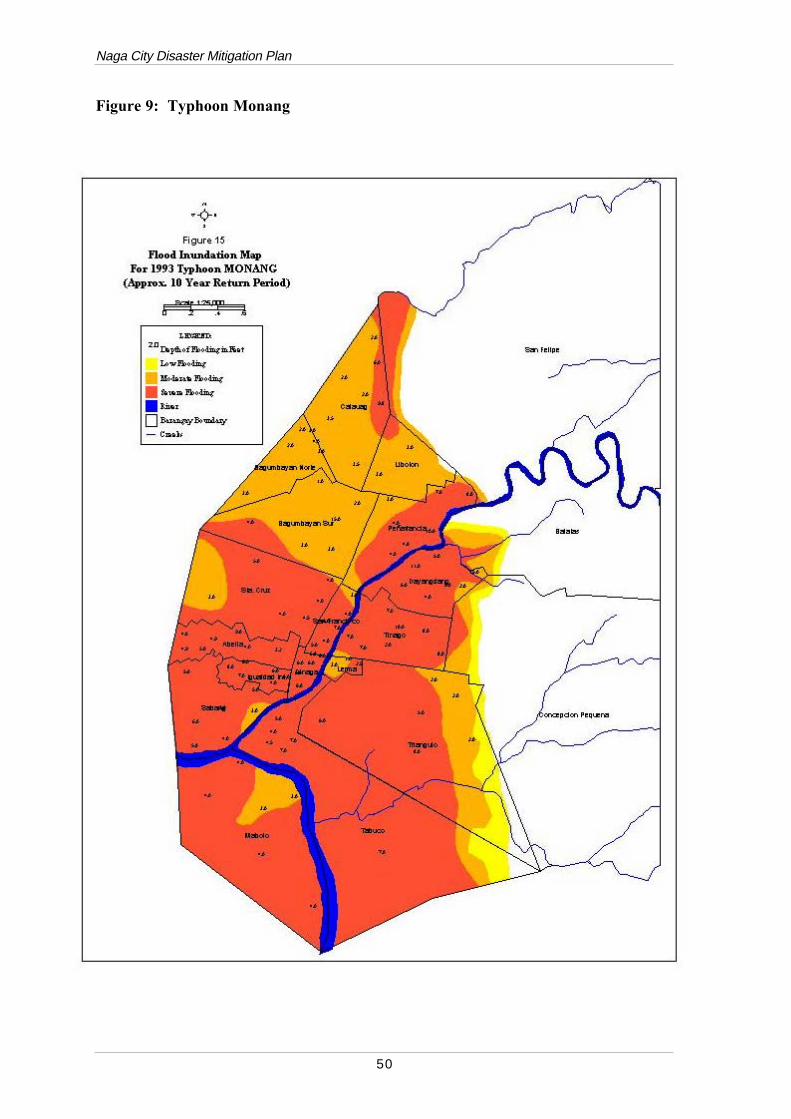
Naga City Disaster Mitigation Plan
50
Figure 9: Typhoon Monang
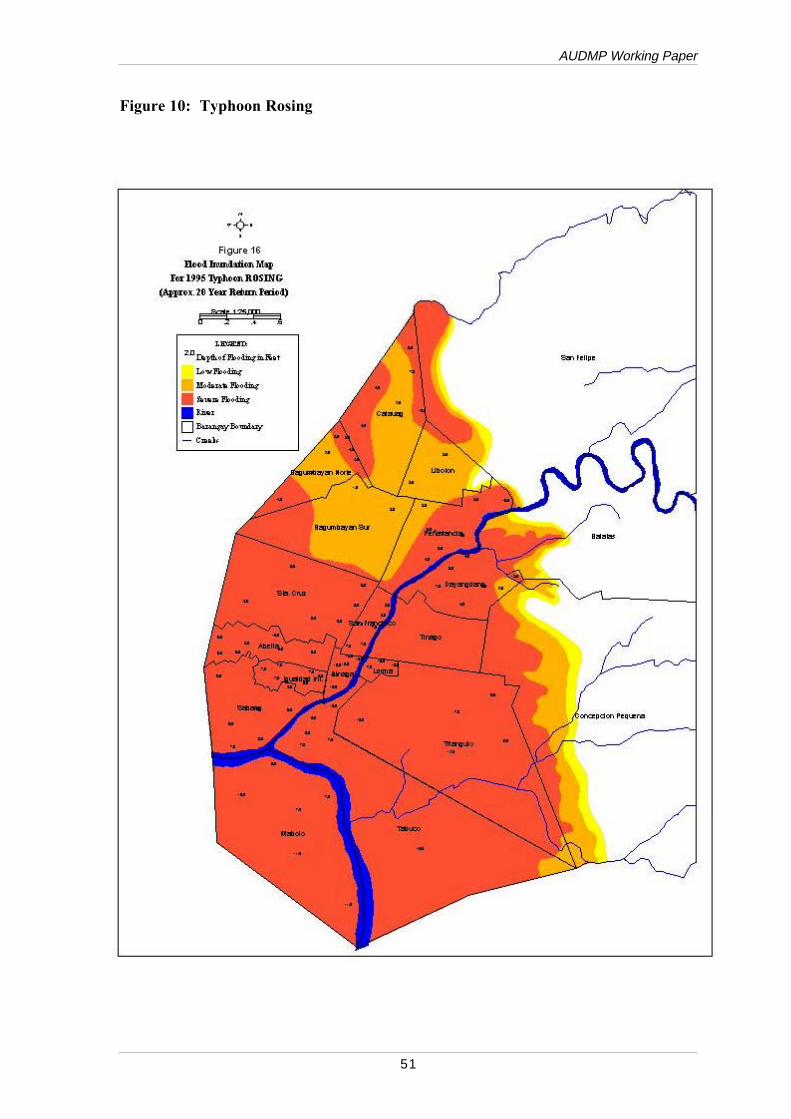
AUDMP Working Paper
51
Figure 10: Typhoon Rosing
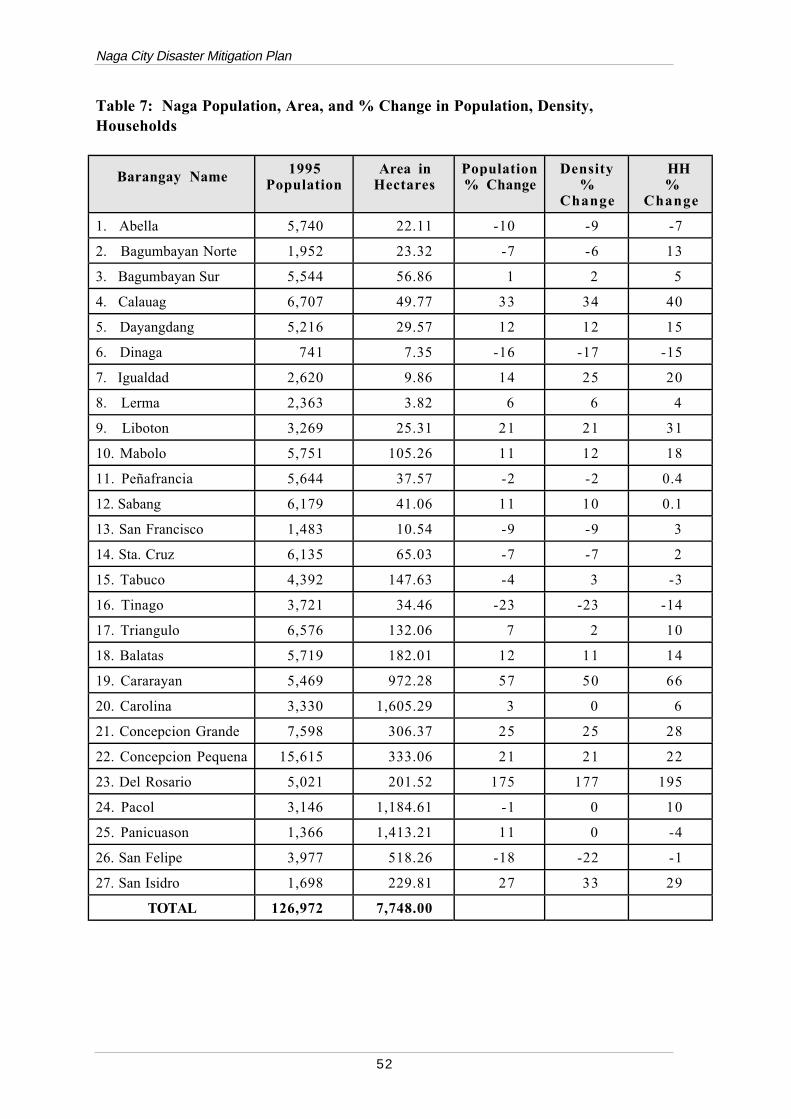
Naga City Disaster Mitigation Plan
52
Table 7: Naga Population, Area, and % Change in Population, Density,Households
Barangay Name 1995Population
Area inHectares
Population% Change
Density%
Change
HH %
Change
1. Abella 5,740 22.11 -10 -9 -7
2. Bagumbayan Norte 1,952 23.32 -7 -6 13
3. Bagumbayan Sur 5,544 56.86 1 2 5
4. Calauag 6,707 49.77 33 34 40
5. Dayangdang 5,216 29.57 12 12 15
6. Dinaga 741 7.35 -16 -17 -15
7. Igualdad 2,620 9.86 14 25 20
8. Lerma 2,363 3.82 6 6 4
9. Liboton 3,269 25.31 21 21 31
10. Mabolo 5,751 105.26 11 12 18
11. Peñafrancia 5,644 37.57 -2 -2 0.4
12. Sabang 6,179 41.06 11 10 0.1
13. San Francisco 1,483 10.54 -9 -9 3
14. Sta. Cruz 6,135 65.03 -7 -7 2
15. Tabuco 4,392 147.63 -4 3 -3
16. Tinago 3,721 34.46 -23 -23 -14
17. Triangulo 6,576 132.06 7 2 10
18. Balatas 5,719 182.01 12 11 14
19. Cararayan 5,469 972.28 57 50 66
20. Carolina 3,330 1,605.29 3 0 6
21. Concepcion Grande 7,598 306.37 25 25 28
22. Concepcion Pequena 15,615 333.06 21 21 22
23. Del Rosario 5,021 201.52 175 177 195
24. Pacol 3,146 1,184.61 -1 0 10
25. Panicuason 1,366 1,413.21 11 0 -4
26. San Felipe 3,977 518.26 -18 -22 -1
27. San Isidro 1,698 229.81 27 33 29
TOTAL 126,972 7,748.00
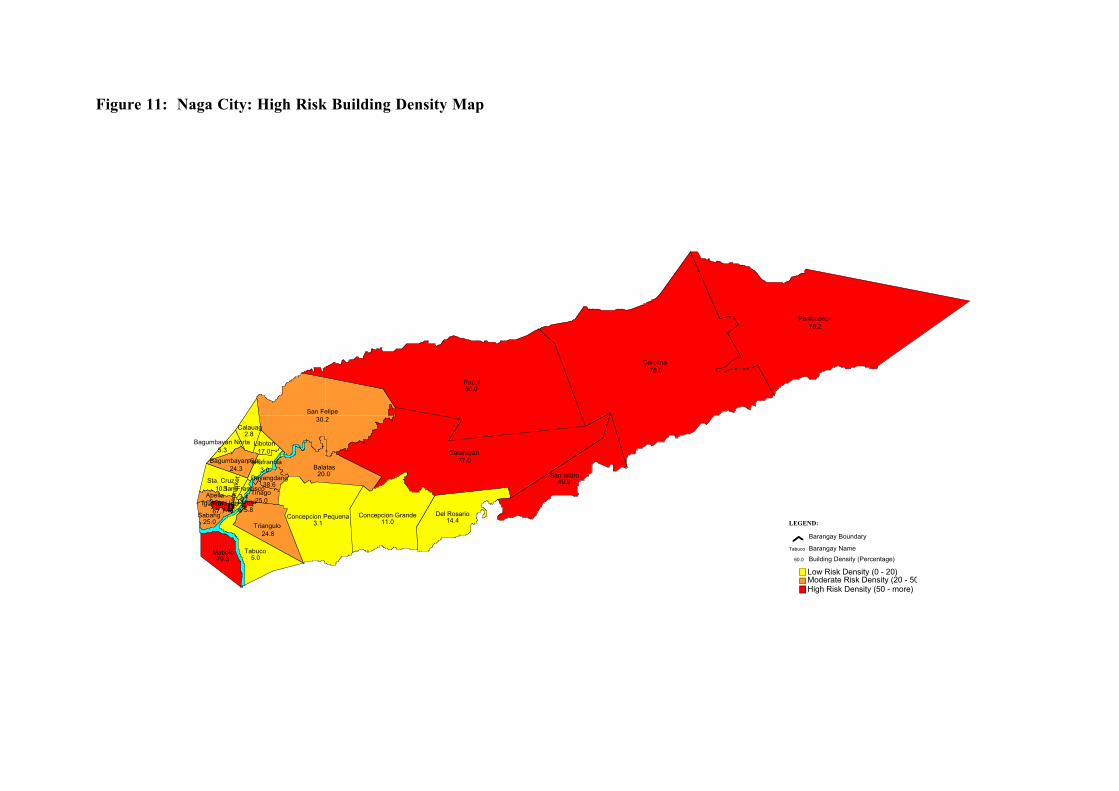
Figure 11: Naga City: High Risk Building Density Map
Balatas20.0
Dayangdang38.6
Peñafrancia3.0
Liboton17.0
Dinag
a9.
5
Sup
erm
arke
t
Igualdad Int.67.7
San Francisco3.4Lerma75.8
Abella27.8
Sabang25.0
Tinago25.0
Bagumbayan Sur24.3
Triangulo24.8
Sta. Cruz10.1
Concepcion Pequena3.1
Bagumbayan Norte5.3
Mabolo79.3
Tabuco5.0
Calauag2.8
Concepcion Grande11.0
San Felipe30.2
Del Rosario14.4
Cararayan77.0
Pacol60.0
San Isidro49.9
Carolina75.0
Panicuason75.2
Low Risk Density (0 - 20)Moderate Risk Density (20 - 50High Risk Density (50 - more)
LEGEND:
Tabuco
60.0
Barangay Boundary
Barangay Name
Building Density (Percentage)
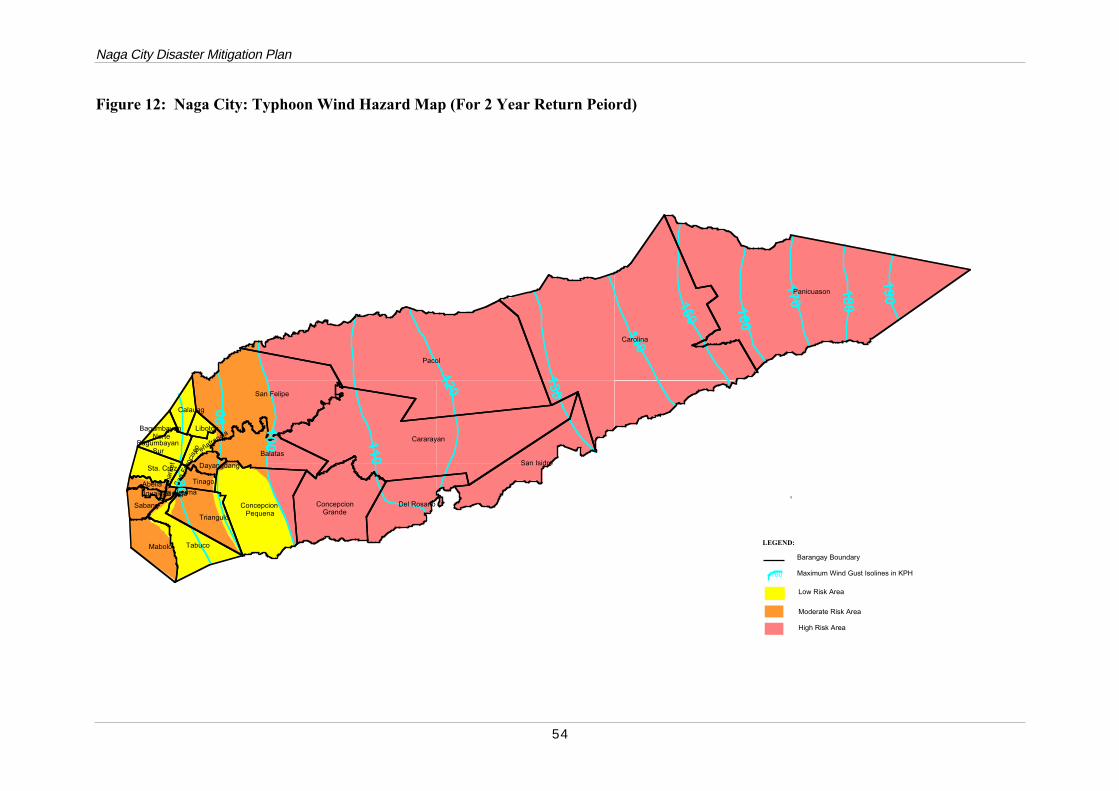
Naga City Disaster Mitigation Plan
54
Figure 12: Naga City: Typhoon Wind Hazard Map (For 2 Year Return Peiord)
100
ConcepcionGrande
Concepcion Pequena
Peñafrancia
BagumbayanSur
Bagumbayan Norte
San
Fra
ncis
co
Sup
erm
arke
t
80
110
90
120
130
140
150
160
170
180
190
Mabolo
Triangulo
Del Rosario
San Isidro
Sabang
AbellaIgualdad Int.Lerma
Tabuco
Dinaga
Calauag
Tinago
DayangdangSta. Cruz
Liboton
Balatas
San Felipe
Pacol
Cararayan
Carolina
Panicuason
0
LEGEND:
160
Barangay Boundary
Maximum Wind Gust Isolines in KPH
Low Risk Area
Moderate Risk Area
High Risk Area
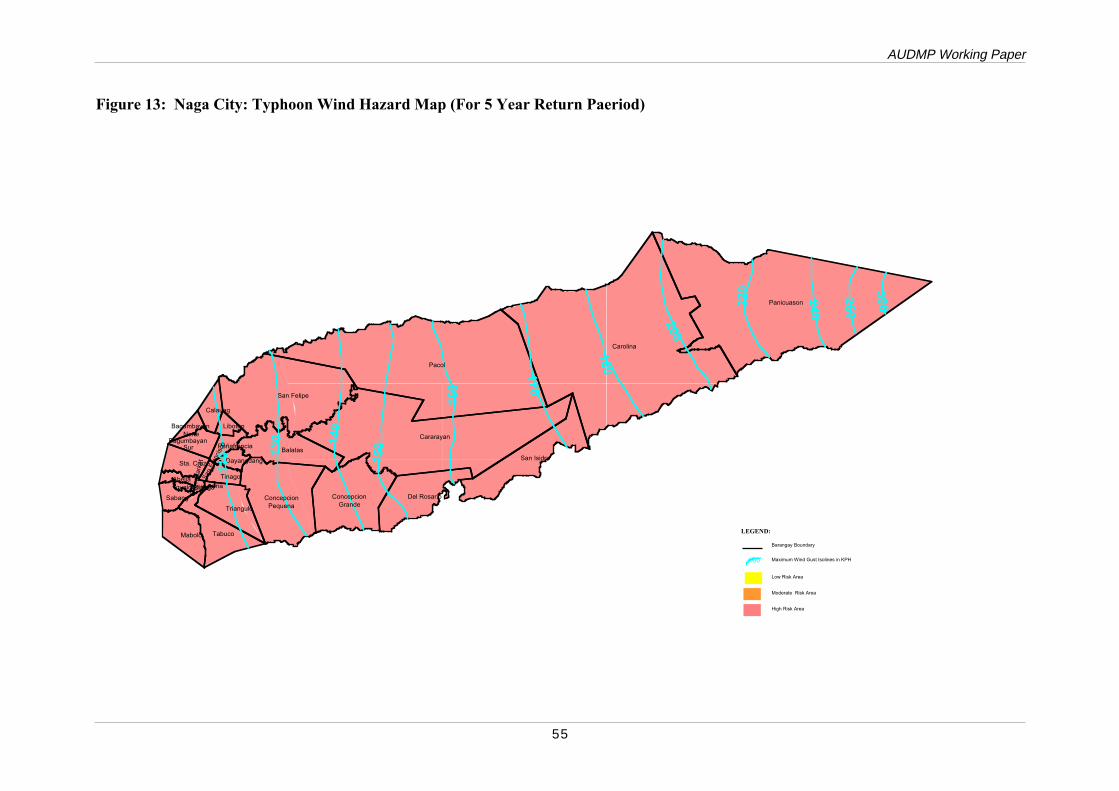
AUDMP Working Paper
55
Figure 13: Naga City: Typhoon Wind Hazard Map (For 5 Year Return Paeriod)
ConcepcionGrande
ConcepcionPequena
BagumbayanSur
San
Fra
ncis
co
Bagumbayan Norte
Sup
erm
arke
t
Peñafrancia
Mabolo
Triangulo
Del Rosario
San Isidro
Sabang
AbellaIgualdad Int.Lerma
Tabuco
Dinaga
Calauag
Tinago
DayangdangSta. Cruz
Liboton
Balatas
San Felipe
Pacol
Cararayan
Carolina
Panicuason
110 130 140
150
160
170
180
200
220
240
260
300
LEGEND:
160
Barangay Boundary
Maximum Wind Gust Isolines in KPH
Low Risk Area
Moderate Risk Area
High Risk Area
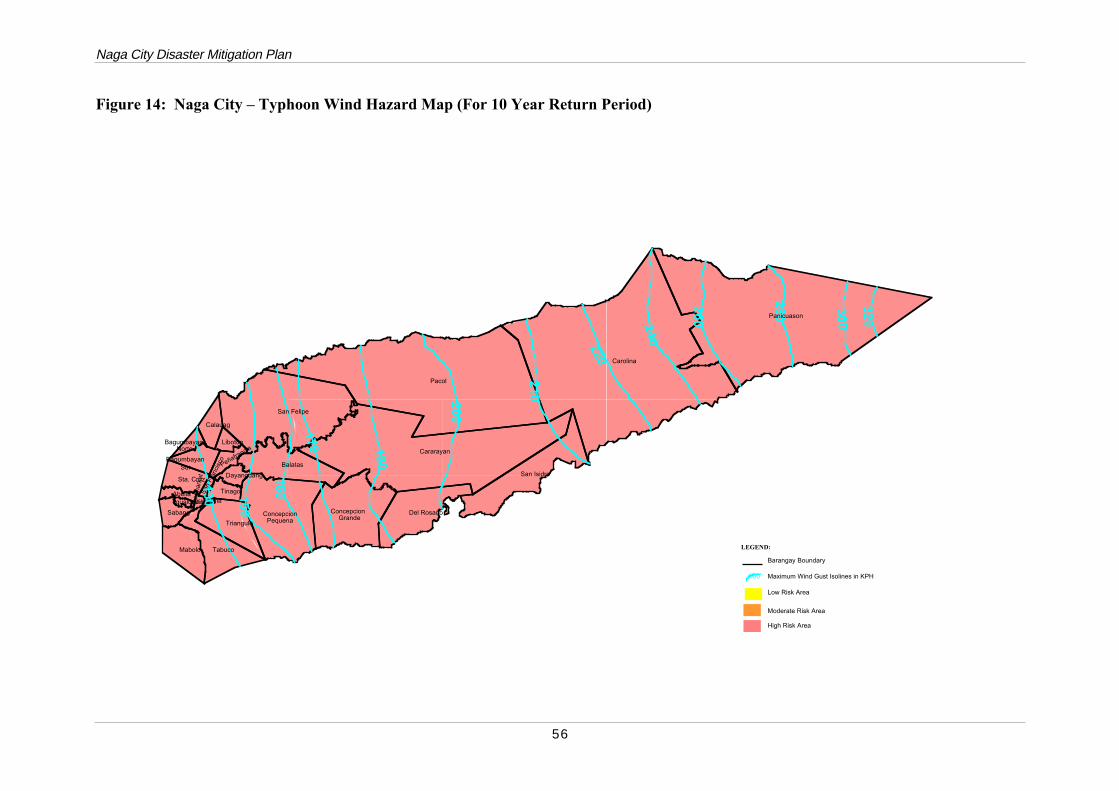
Naga City Disaster Mitigation Plan
56
Figure 14: Naga City – Typhoon Wind Hazard Map (For 10 Year Return Period)
Concepcion Grande
Concepcion Pequena
San
Fra
ncis
co
Sup
erm
arke
t
Peñafrancia
BagumbayanSur
Bagumbayan Norte
150
160
220
260
320
280
Mabolo
Triangulo
Del Rosario
San Isidro
Sabang
AbellaIgualdad Int.Lerma
Tabuco
Dinaga
Calauag
Tinago
DayangdangSta. Cruz
Liboton
Balatas
San Felipe
Pacol
Cararayan
Carolina
Panicuason
130
170 180
200
210
240
300
LEGEND:
160
Barangay Boundary
Maximum Wind Gust Isolines in KPH
Low Risk Area
Moderate Risk Area
High Risk Area
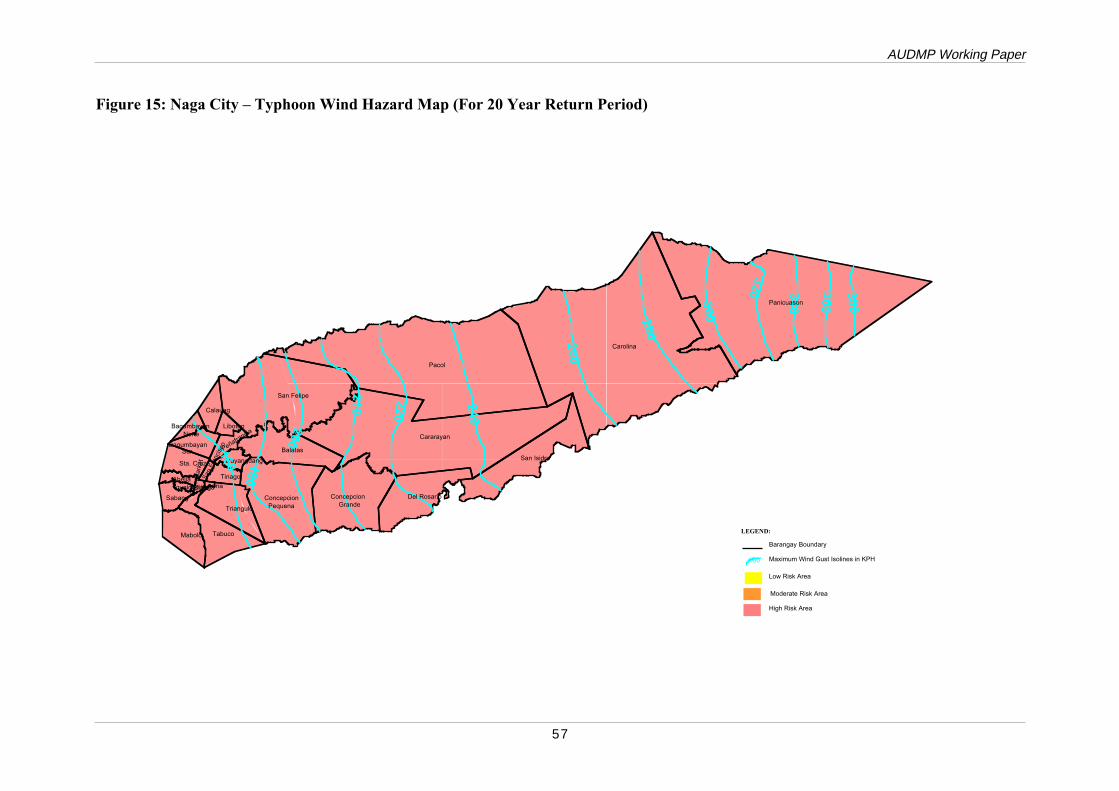
AUDMP Working Paper
57
Figure 15: Naga City – Typhoon Wind Hazard Map (For 20 Year Return Period)
Concepcion Grande
ConcepcionPequena
Peñafrancia
BagumbayanSur
San
Fra
ncis
co
Bagumbayan Norte
Sup
erm
arke
t 180
200
210
220
240
320 340
360
Mabolo
Triangulo
Del Rosario
San Isidro
Sabang
AbellaIgualdad Int.Lerma
Tabuco
Dinaga
Calauag
Tinago
DayangdangSta. Cruz
Liboton
Balatas
San Felipe
Pacol
Cararayan
Carolina
Panicuason
160
260
280
300
380
LEGEND:
160
Barangay Boundary
Maximum Wind Gust Isolines in KPH
Low Risk Area
Moderate Risk Area
High Risk Area
Naga City Disaster Mitigation Plan
58
Table 8: Area at Risk of Flood Hazard
AUDMP Working Paper
59
Table 9 – Settlement and Housing Data
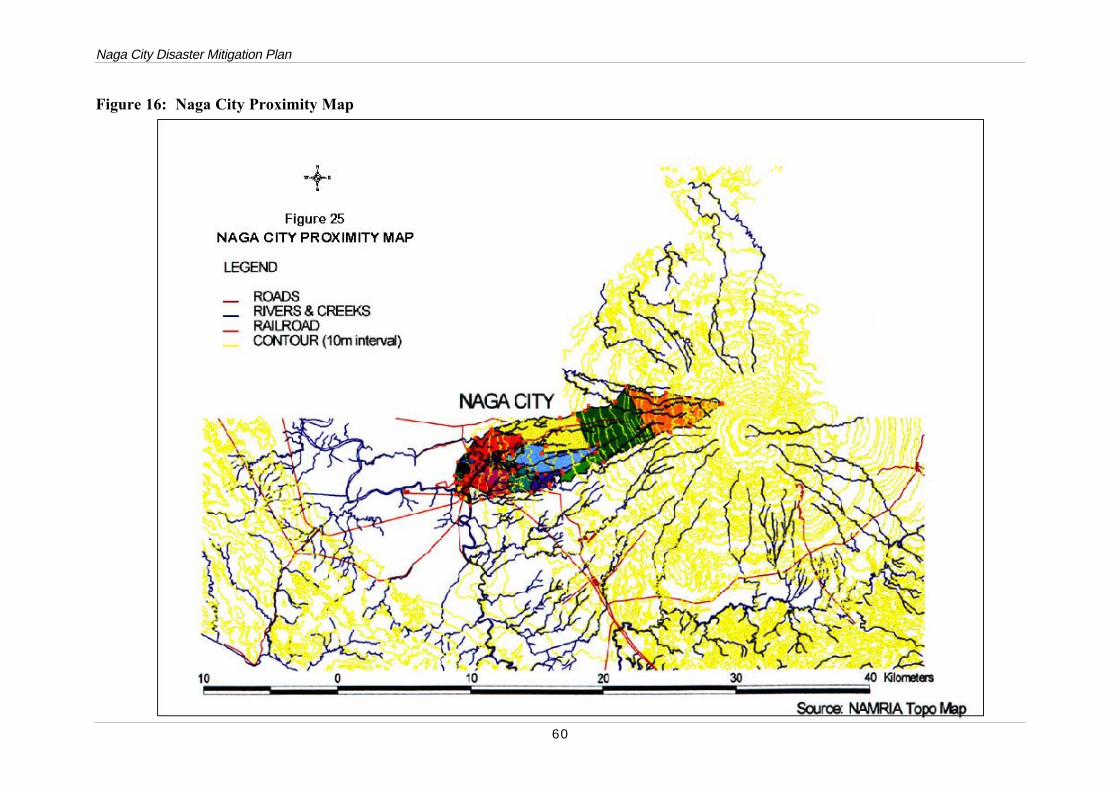
Naga City Disaster Mitigation Plan
60
Figure 16: Naga City Proximity Map
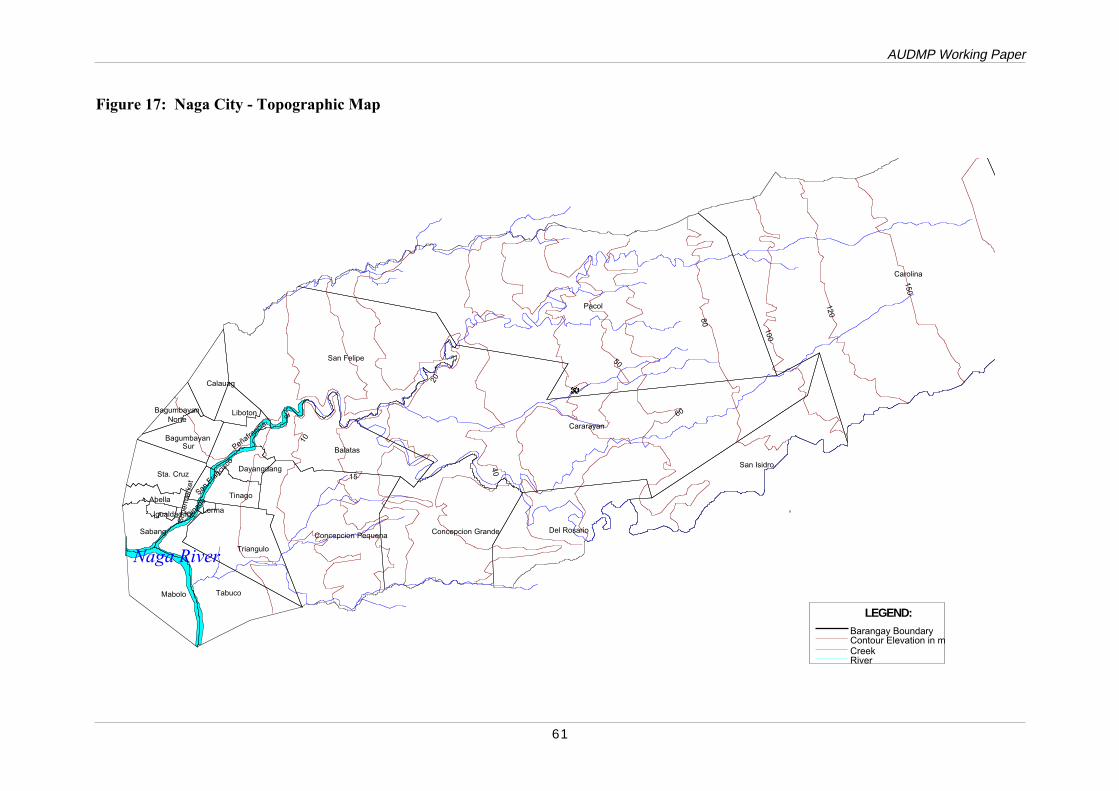
AUDMP Working Paper
61
Figure 17: Naga City - Topographic Map
Peñafrancia
BagumbayanSur
BagumbayanNorte
San F
ranc
isco
Dinaga
Sup
erm
arke
t
Naga River
Mabolo
Triangulo
Concepcion PequenaDel Rosario
San Isidro
Sabang
Abella
Igualdad Int. Lerma
Tabuco
Calauag
Tinago
DayangdangSta. Cruz
Liboton
Concepcion Grande
Balatas
San Felipe
Pacol
Cararayan
Carolina
5
10
15
20
30
40
50
6080
100
120
150
LEGEND:Barangay BoundaryContour Elevation in mCreekRiver
0
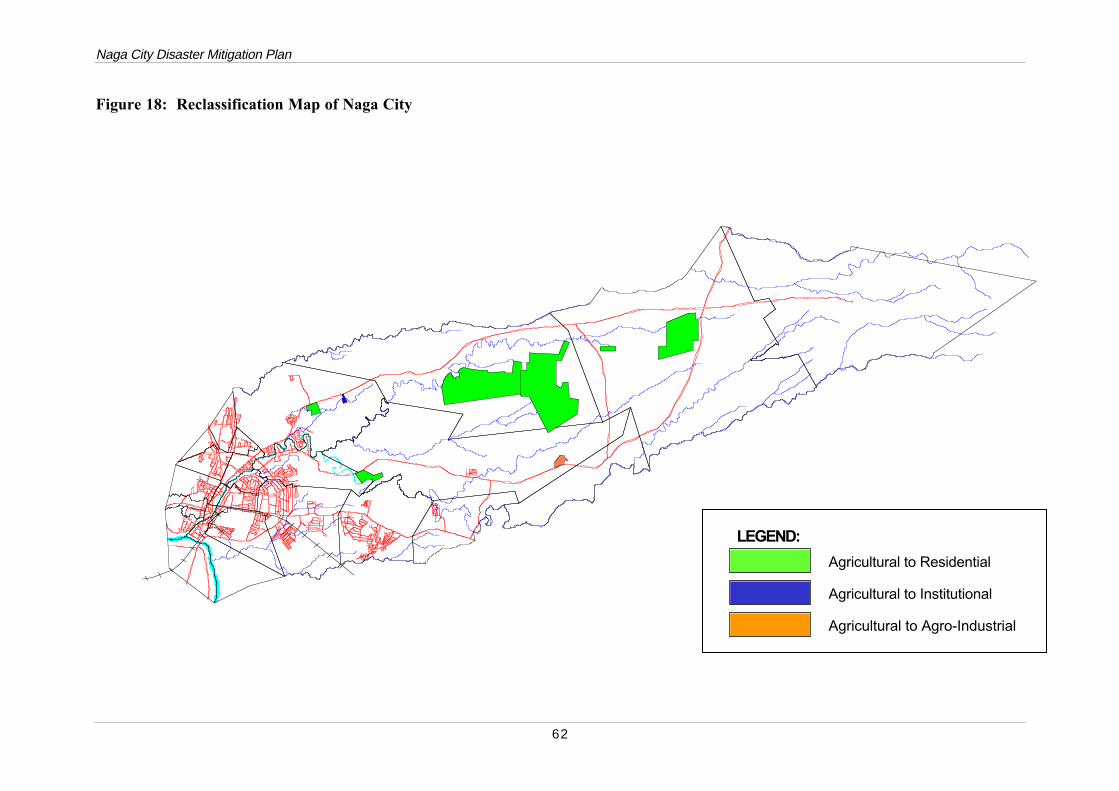
Naga City Disaster Mitigation Plan
62
Figure 18: Reclassification Map of Naga City
Agricultural to Residential
Agricultural to Institutional
Agricultural to Agro-Industrial
LEGEND:
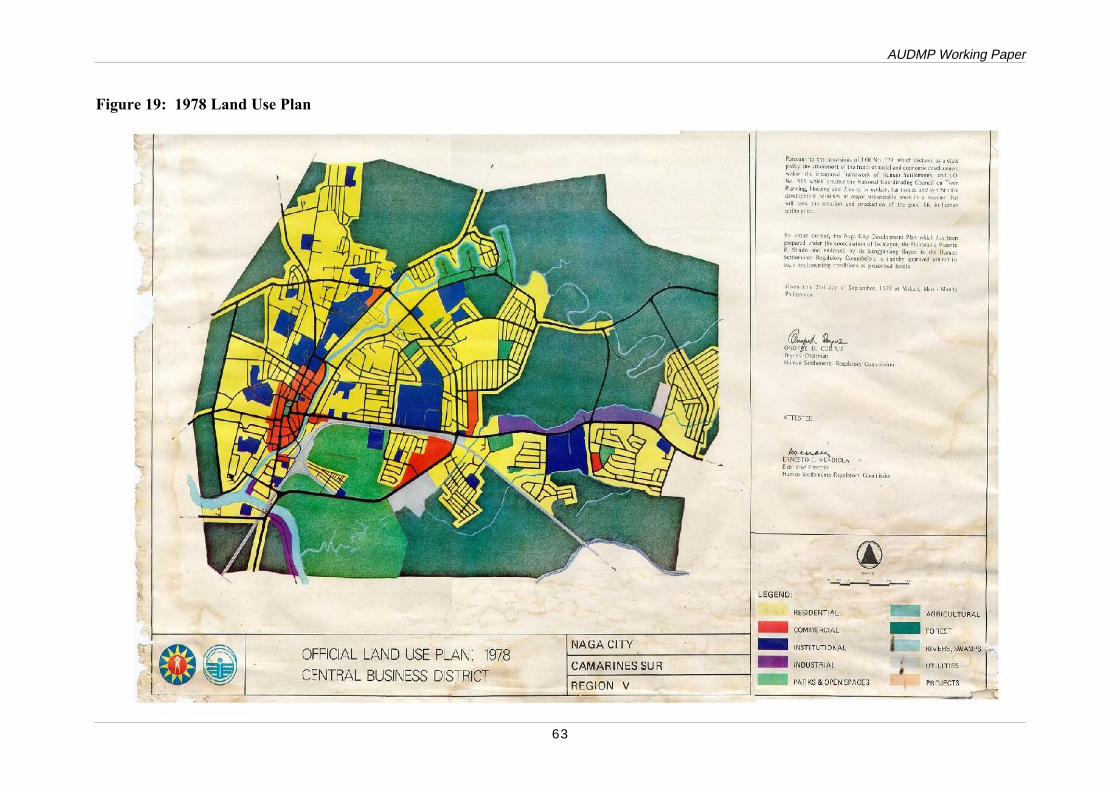
AUDMP Working Paper
63
Figure 19: 1978 Land Use Plan
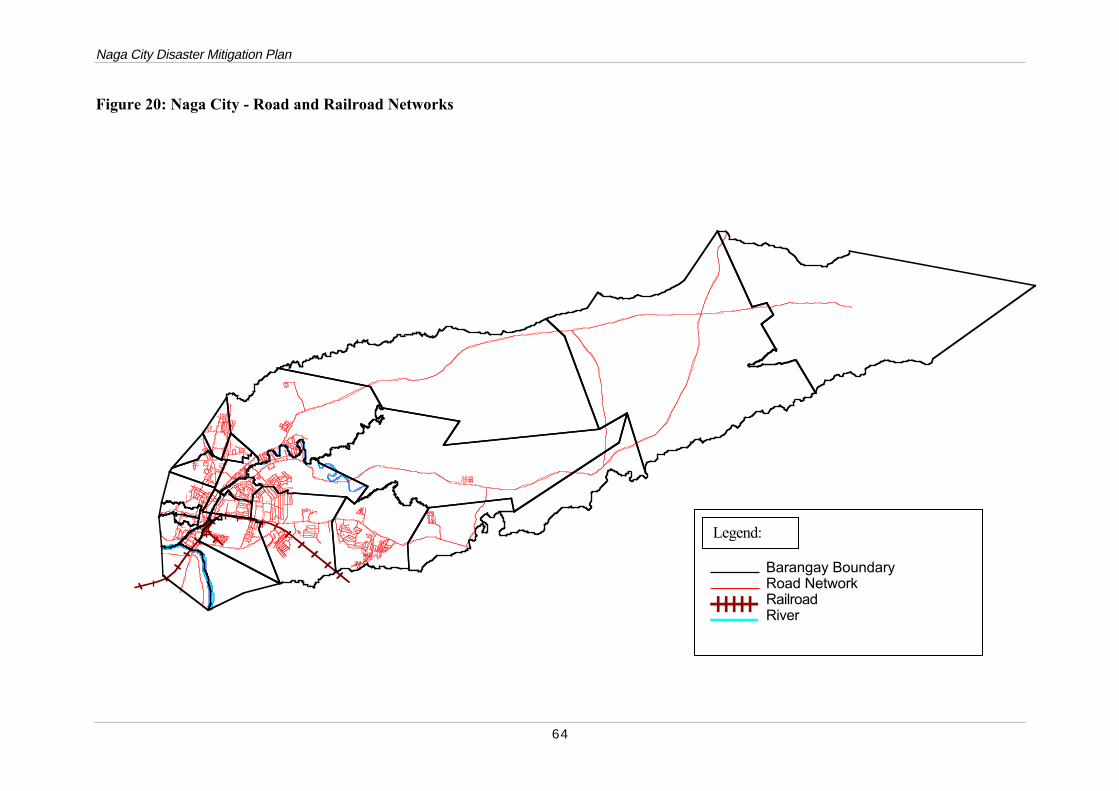
Naga City Disaster Mitigation Plan
64
Figure 20: Naga City - Road and Railroad Networks
Barangay BoundaryRoad NetworkRailroadRiver
Legend:
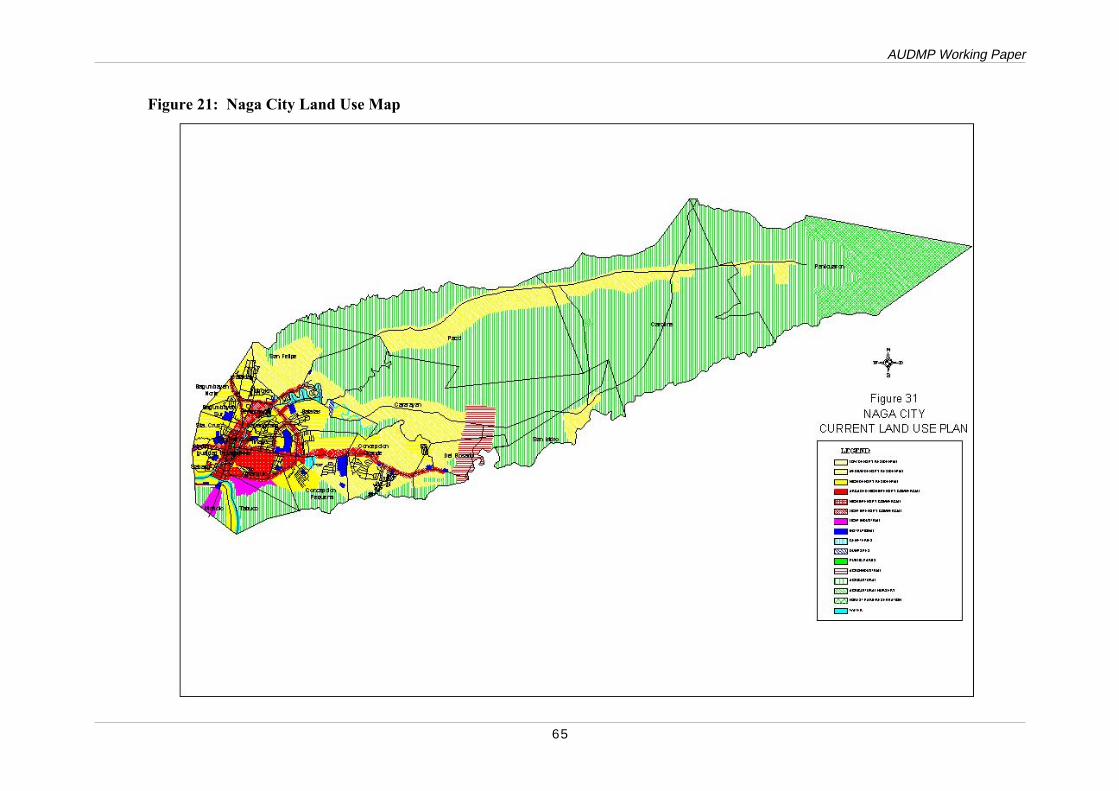
AUDMP Working Paper
65
Figure 21: Naga City Land Use Map
CHAPTER 4
RISK ASSESSMENT
4.1 CONSEQUENCE ANALYSES
The frequency of typhoons visiting Naga and their magnitude at different return periods posevarying degrees of flooding and wind hazards to the city. The risks and consequences offlooding can be of such magnitude as to threaten public health and safety as well as disruptthe overall socioeconomic environment of the city. Depending on the type of risk andvulnerabilities of the socioeconomic sectors at risk, a disaster by situation can either beavoided, reduced to an acceptable level or further aggravated.
4.1.1 Risk Characterization
Societal risks associated with flooding and wind hazards involve primarily public health andsafety as well as economic losses from various livelihood enterprises.
4.1.1.1 Risk to Public Health and Safety
Risks to public health and safety include mainly the following:
• fatality or death due to drowning, extreme injuries (e.g., from typhoon debris andelectrocution), hypothermia and disease complications arising from long exposure toflood waters;
• morbidity cases from injuries (wounds) and illnesses related to wind and flood-waterexposure, such as colds and other respiratory diseases;
• indirect effects on environmental health from contamination of water sources andexposure to polluted waters, liquid effluents and solid wastes carried by flood waters;and
• damage to housing and personal properties and consequent dislocation of families.
The number of fatalities is the penultimate indicator of the gravity of the risk to publicsafety. Death of individuals is an irreplaceable loss to society, especially among children andproductive members of the community, who could have otherwise contributed substantiallyto the social and economic well being of their community had they lived their full productivelives. In addition, death has unquantifiable social and economic consequences to survivingfamilies who have to suffer from the loss of a loved one.
Morbidity cases, depending on the type of illness/injury and recovery period, represent atemporary loss of opportunity and income to productive individuals and at the same time acost to families who have to carry the burden of providing for the medical needs of sickfamily members.
Naga City Disaster Mitigation Plan
68
Environmental health problems associated with flooding, while in most cases not immediatelydiscernible, can often be recurrent and chronic and affect a larger segment of the populationexposed. The pain and cost of continuous treatment and work disruption could amount tosome significant income and opportunity losses over an indefinite period of time.
The damages to residential dwellings are often related to cases of morbidity and mortality.The type of construction materials and location of housing units may predispose a family toflooding and wind risks. Damage to housing and personal properties represents losses ofinvestment that might prove difficult to recover or rehabilitate for the marginal sector ofsociety. Moreover, the effects of dislocation of families affected for a certain period of timecan create uncertainties and sometimes lead to social problems.
The health and safety of the population is not only a concern of individual families affectedbut the local and national government as well. The city government and local agencies carrythe responsibility for ensuring the safety of affected communities by mobilizing the city’sresources to evacuate families within danger zones and attend to casualties. Moreover, theyhave to provide for food assistance and other needs of evacuees/other affected members ofthe community. Government resources spent for ensuring the safety of its populace intyphoon events could reach some significant amount, which could otherwise be channeled tomore productive endeavors and other pressing needs of the city government.
4.1.1.2 Economic Risks
The economic risks to wind and flooding hazards involve losses in investment, productionand income from the following economic activities:
• occupational losses to daily wage earners of those occupations interrupted byflooding, such as those in the transport industry (e.g., tricycle, jeepney and busdrivers), factory workers and ambulant vendors.
• business losses from damage to goods and income foregone from disruption ofbusiness operation (e.g., due to closure and power interruption), and
• agricultural losses from crop damage, loss of investment and income.
4.1.1.3 Physical Risk
In addition, risks to lifeline infrastructures and facilities could include damages to criticalfacilities and infrastructures, such as roads/bridges, water, power and health facilities, whichare themselves crucial to disaster management (e.g., evacuation and relief operation) as wellas daily socioeconomic activities (livelihood and business maintenance). The cost of damageto lifeline infrastructures and facilities involves repair/rehabilitation, social and economiclosses from lack of access and/or disruption of operation. For instance, damage to power lineswill affect operation of the business and social sectors largely dependent on the use ofelectricity (e.g., food business, hospitals). Severe damage to roads will render many areasunpassable causing access problems and affecting the flow of goods and mobility of people.
AUDMP Working Paper
69
4.1.2 Consequence Analysis
Consequence analysis involves the quantification of probable impacts/effects or damagescaused by flooding and wind hazards during typhoon events that regularly visit Naga City.In as much as these hazardous events are naturally occurring, their predictive magnitudes atdifferent return periods vis-a-vis anthropogenic interventions in areas naturally-prone to suchhazards determine the extent of socioeconomic effects. This analysis however is constrainedby very limited data on flood damages at various flood magnitudes. The only basis for theanalysis is the flood damage survey undertaken by DSWD and the Office of the City Mayorduring the 1998 Typhoon Loleng which more or less corresponds to a 10-year flood returnperiod. Probable estimates for other flood magnitudes are difficult to quantify in the absenceof any historical data. Nevertheless, the limited data is analyzed to illustrate the magnitudeof impacts and consequent social and economic losses to the city as a means of generatingawareness and broad support to avert and/or reduce to the minimum disaster conditions.
Table 10 summarizes the result of the damage assessment survey during Typhoon Loleng in1998 as far as population affected, casualties and housing damage are concerned. Additionaldamage estimates were also assumed or inferred from other available information.
4.1.2.1 Mortality and Morbidity Cases
On a flood magnitude equivalent to a 10-year return period with a typhoon wind of greaterthan 100 kph as represented by Typhoon Loleng, the entire Naga reported a total death of10 persons, 8 of which happened in the flood-prone barangays and 2 in the upper barangaysprone to wind hazard. Reported causes of death include drowning, hypothermia, cardiacarrest and fetal death.
Morbidity cases reported involved 14 persons who suffered various types of injuries. Thecasualties were mostly (12) from the flood-prone areas. There were no data generated onother cases of illnesses/morbidity after the flood event from exposure to flood waters and inrelation to ensuing environmental sanitation condition in the area. Considering the pollutionlevel of river water inundating residential areas, uncollected garbage and possiblecontamination of well water sources, the likelihood of incidence of water-borne diseases ishigh. In fact, diarrhea and respiratory diseases are the most common causes of morbidity andto some extent mortality in the city.
In the absence of the profile of casualties reported including age, occupation, number of dayssick, medication cost and others, it is difficult to quantify the opportunity losses frommortality and morbidity cases. It is also safe to assume that there were many unreportedcases especially on those who got sick as a result of the flood event. In the overall, theconsequences to public health and safety at this magnitude of flooding could be verysubstantial to warrant serious attention.
4.1.2.2 Damage to Housing/Properties
Some 8,634 housing units have been damaged by Typhoon Loleng, 16 percent of which
Naga City Disaster Mitigation Plan
70
incurred total damage while 84 percent was partially damaged. Housing/property damage inthe flood-prone barangays accounted for 407 units totally damaged and 2,793 units partiallydamaged. In the upper barangays of Naga there were more houses damaged primarily due tostrong typhoon winds: 984 totally damaged and 5,434 partially damaged.
Losses in property investments were estimated at an aggregate of P29,450,000 for the entireNaga. The flood-prone barangays accounted for the bulk of the damage amounting to someP20.05 million. Some P9.4 million property damages were registered in the upper barangays.
4.1.2.3 Cost of Government Assistance for Relief Operation
Government resources (City Government, DSWD, OCD, etc.) channeled to relief operationand assistance to affected families covered/served some 81,000 persons incurring an estimatedcost outlay of P654,206. Sixty eight percent of government assistance was provided to theflood-prone barangays and the rest to the upper barangays. This cost does not include thecompensation of government personnel who have been mobilized for several days to renderrelief assistance. Considering personnel and equipment cost, the resources spent could easilyamount to over a million pesos.
4.1.2.4 Occupational and Business Losses.
Workers involved in occupations sensitive to flooding/wind hazards loss daily earnings of about P180 per day. With a rough estimate of about 2,000 workers involved in theseoccupations, income equivalent to some P360,000 is lost in a day. Assuming a 2-day workdisruption in any flood event, income foregone is about P720,000.
Based on the 1998 data on commercial/industrial establishments in the entire Naga thebusiness sector generates an aggregate of some P7 billion revenues annually. Assumingbusinesses operate for an average of 300 days per year, the aggregate income losses onbusinesses in the flood-prone barangays at a 10-year flood was roughly estimated at P10.5million per day. Assuming a 3-day closure, income losses could amount to around P31.5million. If a one-day disruption in the rest of Naga is further considered from wind risk, thedaily business losses for the entire city could reach some P 44.6 million a day. Thisrepresents a rather conservative estimate considering that the data was based on consolidatedBIR reported annual sales by business establishments.
4.1.2.5 Agricultural Losses
Damage and income losses from agricultural crops, essentially from strong typhoon winds,amounted to some P39.6 million in 1998. The upper barangays of Naga where majority ofthe productive agricultural areas are located were the most hardly hit.
4.1.2.6 Damage to Infrastructures and Utilities
Damage to key public infrastructures (such as roads and bridges, school buildings,government facilities and drainage) was estimated at P18.8 million during Typhoon Loleng.
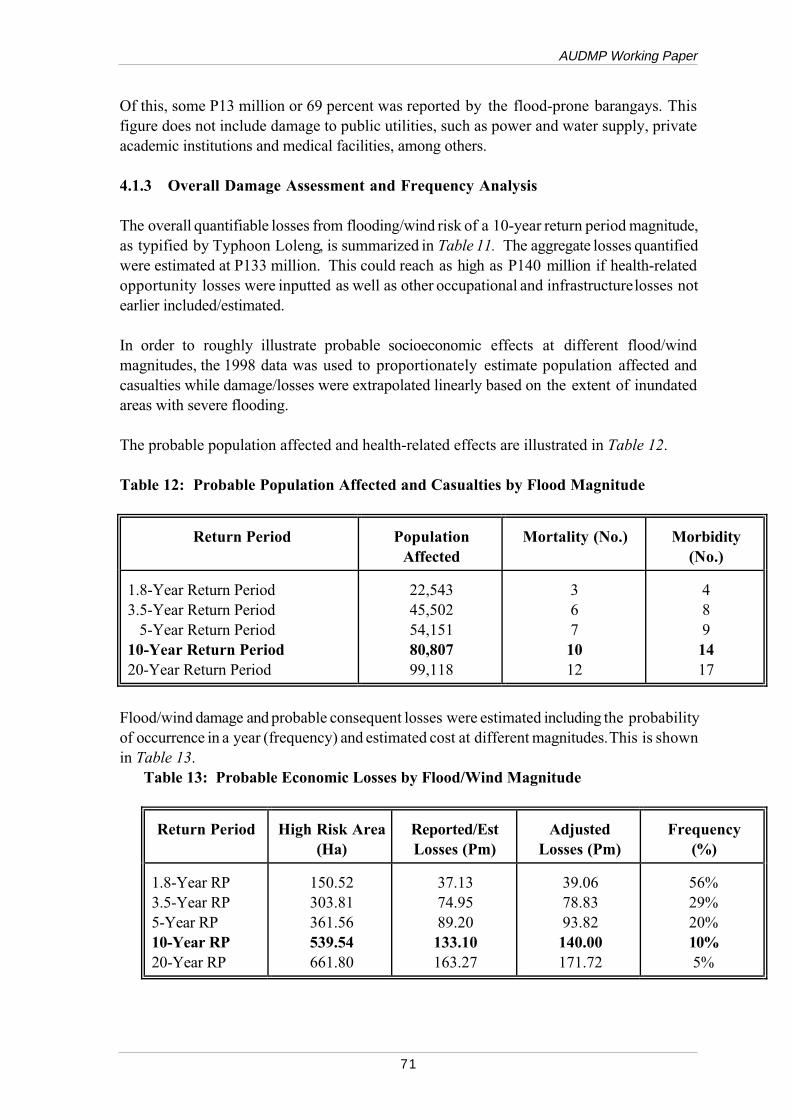
AUDMP Working Paper
71
Of this, some P13 million or 69 percent was reported by the flood-prone barangays. Thisfigure does not include damage to public utilities, such as power and water supply, privateacademic institutions and medical facilities, among others.
4.1.3 Overall Damage Assessment and Frequency Analysis
The overall quantifiable losses from flooding/wind risk of a 10-year return period magnitude,as typified by Typhoon Loleng, is summarized in Table 11. The aggregate losses quantifiedwere estimated at P133 million. This could reach as high as P140 million if health-relatedopportunity losses were inputted as well as other occupational and infrastructure losses notearlier included/estimated.
In order to roughly illustrate probable socioeconomic effects at different flood/windmagnitudes, the 1998 data was used to proportionately estimate population affected andcasualties while damage/losses were extrapolated linearly based on the extent of inundatedareas with severe flooding.
The probable population affected and health-related effects are illustrated in Table 12.
Table 12: Probable Population Affected and Casualties by Flood Magnitude
Return Period PopulationAffected
Mortality (No.) Morbidity(No.)
1.8-Year Return Period3.5-Year Return Period 5-Year Return Period10-Year Return Period20-Year Return Period
22,54345,50254,15180,80799,118
3671012
4891417
Flood/wind damage and probable consequent losses were estimated including the probabilityof occurrence in a year (frequency) and estimated cost at different magnitudes. This is shownin Table 13.
Table 13: Probable Economic Losses by Flood/Wind Magnitude
Return Period High Risk Area(Ha)
Reported/EstLosses (Pm)
AdjustedLosses (Pm)
Frequency(%)
1.8-Year RP3.5-Year RP5-Year RP10-Year RP20-Year RP
150.52303.81361.56539.54661.80
37.1374.9589.20133.10163.27
39.0678.8393.82140.00171.72
56%29%20%10%5%
Naga City Disaster Mitigation Plan
72
4.2 VULNERABILITY AND RISK ANALYSIS
Vulnerability assessment was undertaken primarily within the physical and socioeconomiccontext. The spatial distribution and characterization of population and settlements as wellas economic activities across hazardous areas in relation to the degree of flooding/wind risksdetermine the vulnerable groups/sectors within Naga.
4.2.1 Area and Spatial Distribution of Barangays
Naga City is composed of 27 barangays encompassing an aggregate land area of some 7,748ha. and with a total population of 126,972 in 1995. Seventeen (17) out of 27 barangays of the city are located in the flood plains. However, theyoccupy only some 10% of the total land area of the city (802 ha) as against the remaining 10barangays with a combined area of 6,946 hectares. The 17 barangays are naturally flood-prone in view of their nearly level elevation and their proximity to the Bicol River and NagaRiver that become inundated during typhoon events. Barangays that are affected by the BicolRiver include Mabolo, Tabuco, Triangulo, Sabang, Igualdad and Abella. Directly located alongthe river are the barangays of Mabolo, Tabuco and Sabang. On the other hand, those that aredirectly traversed/affected by the Naga River are the barangays of Dinaga, Lerma, Tinago,Dayangdang, Peñafrancia and San Francisco.
The 17 barangays comprise today the heart and center of business and commerce of the city.The existing Central Business District (CBD-I) which is composed of the barangays ofAbella, Dinaga, Igualdad, Sabang and San Francisco occupy an aggregate area of 91 ha. orabout 11% of the flood-prone barangays. The proposed CBD expansion area (CBD-II)includes the barangays of Triangulo and Tabuco. These barangays, which have a combinedarea of 280 ha., are likewise located in the flood-prone areas. They occupy a much larger areaof about 35% of the 17 barangays.
The 10 barangays outside of the flood plain, on the other hand, are located in higher elevation.This renders them relatively protected from flooding but more susceptible to wind hazard. Barangays located in higher areas are mostly agricultural areas that are still relatively sparselypopulated.
4.2.2 Population Trend, Density and Spatial Distribution
Population and growth patterns in the city generally indicate increasing trend and movementof population within the city. Over the last 15 years (1980-1995), the city’s population grewat an average annual rate of 2.27%. It was noted however that average annual growth ratewas faster from 1980-1990 at 2.43% annually compared to the period from 1990-1995 whichslowed down to 1.94% per year (see Table 14).
The spatial distributions of population across the different barangays indicate that majorityof the population then and now are concentrated in the flood plains. In 1995, 58% of thepopulation inhabit the flood-prone areas which only corresponds to 10% of the total area of
AUDMP Working Paper
73
the city.
However, population movement within the city had been noted during the last 15 years. Thepercentage of population occupying the flood-prone areas had decreased from 70% in 1980,62% in 1990 to 58% in 1995. Negative growth rates have been registered in 1995 by 8barangays in the flood-prone areas, such as Abella, Bagumbayan Norte, Dinaga, SanFrancisco and Tinago. On the other hand, Calauag (6.59%) and Liboton (4.11%) registeredvery significant annual population growth. Moreover, the pattern showed a tremendous shiftin population distribution to barangays located in higher areas. From 1980-1990, annualpopulation growth in these barangays reached an average of 5.71% and 4.48% from 1990-1995. Highly significant increases in population have been reported, particularly inConcepcion and Del Rosario (going towards Pili) and towards Cararayan and San Isidro. Themovement of population away from the CBD areas may be largely attributed to the growingcommercialization of the area. Converting residential areas to commercial uses makes sensefrom an economic standpoint. Moreover, subdivision development has flourished and becamefashionable, attracting many households to relocate in new subdivisions. To some extentprobably, flooding may also be a factor for relocating residential dwellings to higher areas.
Density wise, the flood-prone barangays already exhibit overcrowding with an averagepopulation density of 92 persons per ha. in 1995 as against the rest of Naga which registeredonly an average of 8 persons per ha. and the city average of 16 persons per ha. for the sameperiod. Areas in the flood plains with overwhelmingly high population density include Lerma(619 P/ha), Igualdad (266P/ha) and Abella (260 P/ha). Dayangdang, Peñafrancia, Sabang andSan Francisco likewise registered high population densities. Only Tabuco followed byTriangulo, Mabolo and Bagumbayan Norte have densities lower than the average of the 17barangays. In the rest of Naga, the highest registered density was only 47 persons/hectare.This covers the barangay of Concepcion Pequena. In the existing CBD, average populationdensity registered a high of 184 persons per ha. compared to the CBD expansion area thatposted only 39 persons/ha. Using the average annual growth rate of population from 1990-1995 of 1.94%, the population today in Naga is projected to reach some 137,127 personscomprising of about 26,000 households (see Table 15).
4.2.3 Population at Risk
4.2.3.1 Flooding Hazard
The city’s population directly exposed to flooding risks are generally those that inhabit the17 flood-prone barangays. The level of risk to the population is associated with their spatialdistribution in the barangays affected. For purposes of identifying the magnitude of the riskacross population centers, density factors were matched against identified high-riskresidential areas by flood return period. Projected 1999 population data was used to illustrateand define spatially the highly at risk population.
Table 16 shows the residential areas and population exposed to high risk due to floodinundation at different return periods. This is summarized in Table 17.
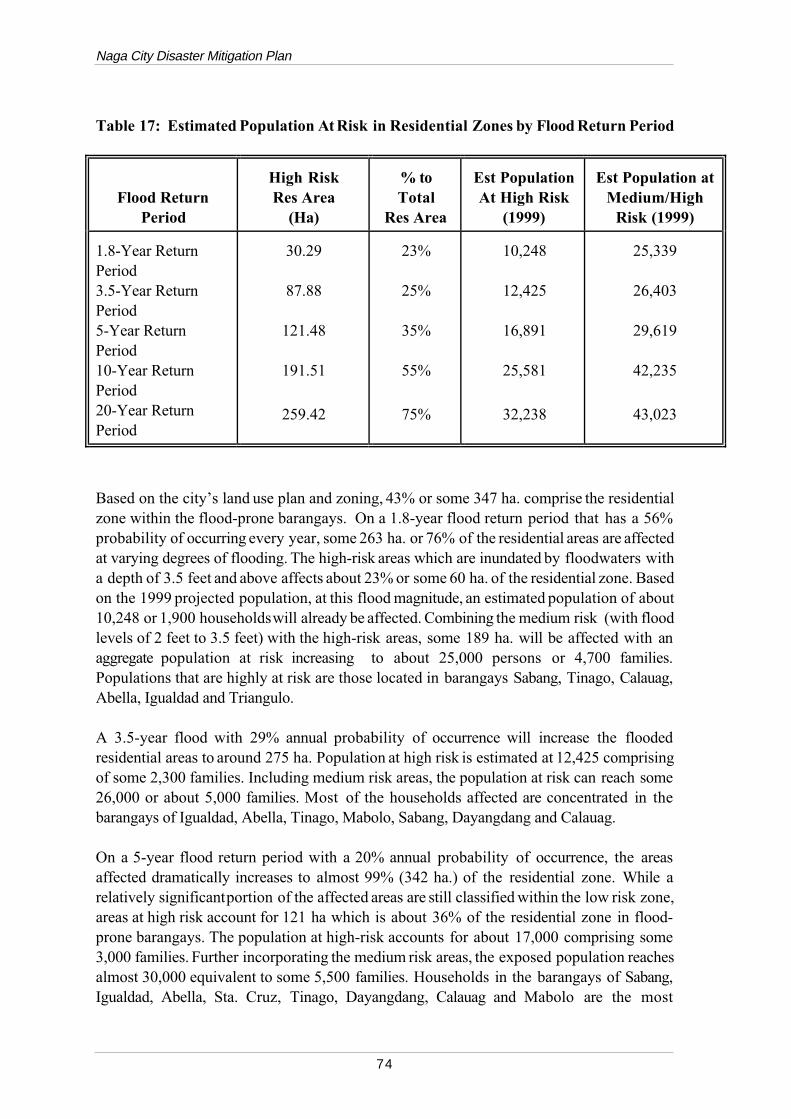
Naga City Disaster Mitigation Plan
74
Table 17: Estimated Population At Risk in Residential Zones by Flood Return Period
Flood ReturnPeriod
High RiskRes Area
(Ha)
% toTotal
Res Area
Est PopulationAt High Risk
(1999)
Est Population atMedium/High
Risk (1999)
1.8-Year ReturnPeriod3.5-Year ReturnPeriod5-Year ReturnPeriod10-Year ReturnPeriod20-Year ReturnPeriod
30.29
87.88
121.48
191.51
259.42
23%
25%
35%
55%
75%
10,248
12,425
16,891
25,581
32,238
25,339
26,403
29,619
42,235
43,023
Based on the city’s land use plan and zoning, 43% or some 347 ha. comprise the residentialzone within the flood-prone barangays. On a 1.8-year flood return period that has a 56%probability of occurring every year, some 263 ha. or 76% of the residential areas are affectedat varying degrees of flooding. The high-risk areas which are inundated by floodwaters witha depth of 3.5 feet and above affects about 23% or some 60 ha. of the residential zone. Basedon the 1999 projected population, at this flood magnitude, an estimated population of about10,248 or 1,900 households will already be affected. Combining the medium risk (with floodlevels of 2 feet to 3.5 feet) with the high-risk areas, some 189 ha. will be affected with anaggregate population at risk increasing to about 25,000 persons or 4,700 families.Populations that are highly at risk are those located in barangays Sabang, Tinago, Calauag,Abella, Igualdad and Triangulo.
A 3.5-year flood with 29% annual probability of occurrence will increase the floodedresidential areas to around 275 ha. Population at high risk is estimated at 12,425 comprisingof some 2,300 families. Including medium risk areas, the population at risk can reach some26,000 or about 5,000 families. Most of the households affected are concentrated in thebarangays of Igualdad, Abella, Tinago, Mabolo, Sabang, Dayangdang and Calauag.
On a 5-year flood return period with a 20% annual probability of occurrence, the areasaffected dramatically increases to almost 99% (342 ha.) of the residential zone. While arelatively significant portion of the affected areas are still classified within the low risk zone,areas at high risk account for 121 ha which is about 36% of the residential zone in flood-prone barangays. The population at high-risk accounts for about 17,000 comprising some3,000 families. Further incorporating the medium risk areas, the exposed population reachesalmost 30,000 equivalent to some 5,500 families. Households in the barangays of Sabang,Igualdad, Abella, Sta. Cruz, Tinago, Dayangdang, Calauag and Mabolo are the most
AUDMP Working Paper
75
vulnerable.
On a 10-year to 20-year flood return periods with 10% and 5% probability of annualoccurrence, respectively, the areal extent of flooding risk will reach almost a hundred percentof the residential zone. Correspondingly, the high-risk residential areas can shoot up to 192ha. (10-year RP) and 259 ha. (20-year RP). Almost 100% of the barangays are at high risk,including residential areas. The population at high-risk range from 26,000 to 32,000corresponding to about 4,700 to 6,000 families. Including medium risk areas, the populationaffected by a 10-year flood will comprise some 42,000 persons or about 7,800 families. Ona 20-year flood, the combined medium and high-risk areas can affect some 43,000 persons oralmost 8,000 households. Hardly hit areas are the same as those in the 5-year return flood.
Regardless of the magnitude of flooding, it is the population in the barangays of Sabang,Igualdad, Abella, Sta Cruz, Dayangdang, Calauag, Tinago, Mabolo and Triangulo thatare prominently at risk. These barangays ironically are mostly within the existing CBD.
Based on the reported average flooding duration by return-period in all flood-pronebarangays, the number of days flooded ranges from an average of 7 days on 1.8-year returnflood to 13 days on a 20-year return flood. Population exposed to very highly significantrisk of long exposure to flood waters are those residing in Triangulo where flooding can lastup to a one month on any flood return period. Igualdad, Abella, Calauag, Mabolo, Tabucoalso reported longer flooding duration of more or less one week.
The above analysis does not cover households or settlements found along commercial zoneswhich are also highly at risk. The likelihood therefore that more people are exposed tosignificant risk is still high especially if they live on single detached dwelling unitsconstructed with light materials.
4.2.3.2 Wind Hazard
Risks due to strong typhoon winds affect primarily the population whose residentialdwellings are made of light materials. The settlement and housing data of Naga showed thatof some 29,000 residential buildings in the city, 25% is considered highly at risk. Theseresidential units are home to about 40,000 persons or 7,400 families. In addition, about 24%of houses are considered as medium risk buildings with some 38,000 persons or 7,000resident families (see Table 18).
The flood-prone barangays have more residential dwellings classified as high risk comparedto the upper barangays. This is in view of the concentration of residential zones in urbanNaga. In the flood-prone barangays, about 4,000 houses are in greater risk from wind hazardas against some 3,000 units in the upper barangays. Medium risk buildings account for anestimated 4,000 units in the low lying areas and almost 3,000 units in the upper areas. Basedon the number of residential buildings classified as high risk, the following barangays havethe most number of population highly at risk:
- Mabolo - San Felipe - Igualdad - Triangulo
Naga City Disaster Mitigation Plan
76
- Cararayan - Dayangdang - Carolina
On a 2-year return period with 50% probability of occurring every year, storm winds posesalready significant risk to the upper barangays of the city. The low-lying areas are exposedfrom low to moderate risk. On a 5-year to 20-year return period, the whole area andpopulation of Naga become highly susceptible to wind risks posed by strong storm winds.
4.2.4 Social Vulnerability
While the city’s populations at risk have been generally identified based on spatial location,their vulnerability to risks associated with flooding and wind hazard is contingent on severalfactors. Sectors or groups of people become vulnerable on account of their demographicsetting, socioeconomic status and characteristics including their perceptions and attitudestowards flooding/wind risks.
4.2.4.1 Vulnerable Sector : Urban and Rural Poor.
In any disaster situation, it is always the marginal sector of society that is most vulnerablebecause they have relatively little means to prepare and protect themselves for sucheventuality. In fact, most poor people are not alarmed by flooding/wind hazards and wouldrather concentrate their efforts on day-to-day economic endeavors to provide for their basicneeds.
In the context of Naga, the marginal groups comprising the urban poor communities of thecity are considered as the most highly vulnerable sector to flooding and wind risks. Withlimited economic resources, urban poor households are typically characterized as follows:
• Do not own residential lots and either squatting on open lands or renting small rooms/houses in crowded areas.
• They tend to settle or occupy areas, which are relatively proximate to the center ofeconomic activities, regardless of site flooding condition, where they are accessible totheir livelihood.
• Housing units are typically made of light materials and poorly constructed (e.g.,shanties, makeshift houses) which are often highly susceptible to wind and floodingdamage.
• Subsistence to low income level families with one or two family members working.
While the rural poor population of Naga located in upper barangays are relatively safe fromflooding hazards, they are more exposed to wind risks. Their dwelling units are mostly notresistant to strong winds. Moreover, their location in higher elevation within relativelysparsely populated open areas/fields and/or wooded areas pre-dispose them to wind risks.
AUDMP Working Paper
77
Records at the Urban Poor Affairs Office indicate that there are about 10,528 urban and ruralpoor households registered as potential socialized housing beneficiaries in 1995. Of this 55%or some 6,000 families are located in the flood-prone barangays and the rest are from theupper barangays. The distribution of urban poor settlements in the city are largelyconcentrated in the CBD areas which experience in many cases severe flooding. These includethe following barangays with the estimated number of urban poor families:
Triangulo - 734 familiesSabang - 568 familiesAbella - 557 familiesCalauag - 549 familiesTabuco - 389 familiesIgualdad - 332 families
Within these high risk population, the most vulnerable to flooding risk among the urban poorsector are those residing in the following:
• along or adjacent to the Bicol River and Naga River,
• pockets of settlement areas built within or interspersed with commercial areas, and
• resettlement sites in low-lying areas.
Settlements/Communities Along or Adjacent to the Bicol River and Naga River
About 30 ha. of river area traverse 9 barangays of the flood plain. These include Tabuco,Mabolo and Sabang along the Bicol River and Dinaga, Lerma, Tinago, Dayangdang,Peñafrancia and San Francisco along the Naga River. During typhoon events, these riversoverflow and inundate areas beyond those barangays along the rivers. The Bicol Riverparticularly affects the adjacent areas of Igualdad, Abella and Triangulo.
The Strategic Watershed Management Plan of Naga City has identified about 500 householdswhose settlements or houses are located in the river easements. Majority of families residingalong the rivers lives in shanties or dwelling units made of light materials which are oftentimes poorly constructed. They are therefore most vulnerable to casualty from both floodingand wind hazards. During typhoon Loleng in 1998, 2 people from Mabolo and Triangulodied of drowning while 5 fatalities from Tabuco, Sabang and Mabolo suffered fromhypothermia/cardiac arrest. Twelve (12) persons were also reported to have suffered varioustypes of injuries in Tabuco, Sabang and Mabolo.
Reported damages to residential houses (total and partial damage) were also significant,especially in Sabang, Triangulo, Calauag and Mabolo. Many families were evacuated fromthese areas by DSWD with the largest number of evacuees residing in Triangulo.
Pockets of Urban Poor Settlements Within and Around Commercial/Developed Areas
Naga City Disaster Mitigation Plan
78
Commercial establishments in the flood prone barangays have increased tremendously overthe years replacing what used to be dominantly residential areas. Many families who haveconverted their residential lots to commercial uses have moved to other locations in the cityleaving behind squatter families and new migrants to occupy pockets of small open areasalong commercial zones. The practice of land filling of new commercial and/or industrialestablishments and even some residential buildings to raise the ground level (approximatingthe flood height) has shifted flood waters and/or increased flooding on low-lying areassurrounding them. Squatters or indigent families who cannot afford land filling of theirsettlements often occupy these sites. While multi-storey commercial/industrial buildingsprovide some kind of buffer which relatively protect them from wind hazard, floodwaterstend to concentrate in these areas exposing the urban poor to greater risk. These vulnerablecommunities are highly evident in areas along Igualdad, Abella and Sabang.
Resettlement Areas
Naga has embarked on a massive resettlement program for urban poor communities of thecity. This program primarily provides on-site and off-site resettlement areas to qualifiedurban poor applicants. To date, a total of some 91 ha. of land had been acquired by the cityfor distribution to urban poor families. It was noted however that out of 33 resettlementsites, more than half (19 sites) are located along flood-prone areas. Eight of these earlierresettlements are sited in high-risk areas experiencing severe flooding such as those inIgualdad, Abella, Sabang, Calauag, Triangulo and Tabuco. Since most resettled urban poorhouseholds in these areas cannot afford to fill and build houses resistant to wind and flooding,they remain vulnerable to risks. Benefits from the program is somehow negated by suchcondition and by the fact that the city has to provide resources once again to the same sectorevery flood event for evacuating them to safer grounds and caring for their needs.
The overall reported casualty and damage mostly to urban poor households in the flood-prone areas during typhoon Loleng include some 52,000 persons affected, 8 persons dead,12 persons injured and some 3,200 houses totally and partially damaged. Property damagewas estimated at P20 million. Likewise, government spent some P444,000 in various formsof assistance to affected families.
Rural Poor Households in Upper Barangays
In the upper barangays of Naga, the most vulnerable population is similarly the poor familieswhose houses are made mostly of very light materials and are found largely in sparselypopulated and open areas. Highly at risk are the poor families located in the barangays ofCararayan, Carolina, San Felipe, Pacol and Balatas. Two wind-related deaths have beenreported in Cararayan during Typhoon Loleng as well as 2 injured in Pacol. Populationaffected by strong storm winds accounted for some 28,000 households with some 5,000houses either totally or partially damaged. The most number of houses damaged werereported by the barangay of Pacol followed by Concepcion Pequeña, Cararayan and Carolina.Total reported property damage amounted to around P9 million. In addition, cost ofgovernment assistance to affected families in these areas amounted to about P153,000.
AUDMP Working Paper
79
4.2.4.2 Vulnerable Population Group: Elderly, Children /Infants
Among population group comprising the urban/rural poor sector, those vulnerable tocasualties are mainly the elderly and infants/children. Children with ages under 1 to 14comprise some 38% of the city’s population in 1995. They are more susceptible to injuriesand sickness from exposure to strong winds and floodwaters. Cases of respiratory and water-borne related illnesses are often high after a typhoon event, especially among pre-schoolersand grade school children exposed to the bad weather and floodwaters. Cases of infant deathsalso occur. Moreover, children hit by flying debris (due to strong winds) also suffer injuries.
The elderlies (age group 60 and over) accounting for 5% of the total city population are alsopredisposed to risks, especially those suffering from existing illness or those that are alreadygenerally very old and weak. Death cases during Typhoon Loleng were mostly elderlies whohave either drowned or suffered hypothermia and eventually death by cardiac arrest.
Other vulnerable groups are the mentally and physically handicapped in the high-risk areaswho will need assistance to be evacuated to high grounds. Women, especially pregnantmothers, are likewise vulnerable to flood water exposure because of their condition. One caseof fetal death has been reported during Typhoon Loleng due to premature delivery.
4.2.5 Economic Vulnerability
The impact of flooding and wind risks on the economy comes in the form of direct andindirect damages and income losses affecting the following vulnerable groups:
• daily wage earners of occupations that are sensitive to interruptions imposed byflooding, such as those of the transport industry,
• business sector (commercial and industrial), and• agricultural sector.
Direct losses affect owners of enterprises (business and farms) whose investments maysuffer damages or losses including income foregone from interruption in operation. This alsoincludes income losses of workforce, either temporarily or permanently, who are engaged invulnerable occupations. Indirect losses applies generally to retailers and relevant economicsectors whose operation and income are dependent or tied-up to the supply and operationof big business establishments such as those in the food business.
4.2.5.1 Vulnerable Occupation
During flooding events, the most vulnerable groups to income losses are the daily wageearners who generate income and/or get paid on a day-to-day work. These comprise mostlyof the workforce in the transport industry, such as tricycle, jeepney and bus drivers;factory/sales workers and agricultural labor. In the flood-prone areas of Naga, it is the tricycleand jeepney drivers who are mostly affected because they can no longer operate in manyareas which are already flooded. Factory and/or sales workers on the other hand suffer losses
Naga City Disaster Mitigation Plan
80
from work stoppage of their factories/businesses or have access problems to work sites.Losses in daily income or wages of equivalent to an average of about P180/day is alreadysubstantial to families mainly dependent on such sources for their daily subsistence.Moreover, if work interruption occurs for several days, it could at the worst result instarvation of poor families.
4.2.5.2 Vulnerable Businesses
As earlier indicated, the center of trade and commerce in Naga is located along the flood-pronezone, most of which are located in identified high-risk areas. A summary profile of high-riskareas, number of establishment and estimated annual gross sales by barangay is shown inTable 19.
The combined commercial and industrial zone area constitutes some 30% of the total area ofthe flood-prone barangays with the biggest commercial/industrial lands found in Triangulo,Tabuco, Peñafrancia, Mabolo, Tinago and Abella. Densitywise, the number ofestablishments per hectare is highest in Igualdad (494 establishments/ha) which hosts around771 establishments including those located in the Naga City Public Market. This is followedby Calauag with 73 establishments per ha., Dinaga (50 est/ha), Sta Cruz (33 est/ha.), Lerma(28 est/ha) and San Francisco (19 est/ha). The least number of establishments relative to thearea can be found in Triangulo, Mabolo, Tinago and Bagumbayan Sur.
The existing CBD occupies only about 15% of total commercial lands in the flood plains.However, 59% of total establishments are found in CBD-I with 89% of total gross salescoming from this area. On the other hand, the proposed CBD-II is more than twice the areaof CBD-I. Business establishments however are still comparatively few with a total of 156firms generating an aggregate revenue of only P31.2 M as against P2.8 B in CBD-I.
In terms of gross sales, Igualdad posted the highest revenue in 1998 followed by Dinaga, StaCruz, Abella and Sabang. Many small establishments which are largely into generalmerchandise retail can be found in Igualdad (Public Market), Calauag, Dinaga and Liboton.Large commercial establishments are found mainly in Igualdad, Abella, Lerma and SanFrancisco.
About 75 ha. of the commercial zone in the flood-prone barangays or 31% suffer from severeflooding on a 1.8-year flood return period. The areas severely inundated increase with themagnitude of flood reaching 91% of the total commercial zone on a 20-year flood returnperiod. A significant portion of the commercial zones of barangays Abella, Triangulo,Peñafrancia, Tinago, Sabang and Lerma are almost always flooded, regardless of flood returnperiod. It should be noted however that severe flooding is more pronounced in the CBDswith almost 100% of the commercial zone of these barangays at high risk especially on a 10to 20-year flood return period.
Most business establishments in the city have learned to cope with flooding risks. Newcommercial buildings have been elevated and many have also been renovated to raise theground floor level. As such, damage to goods as a direct consequence of flooding is often
AUDMP Working Paper
81
minimal.
Damage to perishable items is attributed more often to power failure due to power linedamage because of the typhoon. The impact on business is more attributed to disruption inoperation because of flooding/wind risks.
4.2.5.3 Vulnerable Agriculture Areas
Naga City is still predominantly agricultural in terms of land use. Around 55% or some 4,300ha. of the entire lands of Naga is classified as agricultural areas. Only 4% of this is found inthe flood-prone barangays and these are either idle or utilized for subsistence-type ofagriculture. Remaining agricultural lands in the flood-prone barangays are found in Mabolo,Tabuco and Triangulo.
Majority or 96% of the agricultural lands are found in the upper barangays of the city. Theseare mostly cultivated to rice, corn, sugar and a mix of agroforestry uses. The more productiveand extensive agricultural areas which are highly at risk from strong winds are those found inPacol, Carolina, Panicuason and San Felipe.
In the recent Typhoon Loleng, agricultural losses, largely from wind damage, amounted toabout P39.6 million for the entire Naga. Almost 100% of the damage were reported by theupper barangays. The highly at risk barangays suffered the greatest damage/losses.
4.2.6 Perception of Risk
Flooding and wind hazards are a regular occurrence in Naga. People have generally adjustedand accepted them as a fact of life in the city. The proliferation of settlements and businessestablishments along flood-prone areas gives an indication that flooding is not reallyperceived as a serious problem and much more a risk to reckon with. Even the localgovernment does not seem to accord priority concern to flooding hazard, judging by itsexisting and planned development thrusts.
People in the city have come to live with this situation and learned to cope with floodinghazards. Coping mechanisms of affected sectors/groups vary by socioeconomic status.Measures to alleviate or prevent the occurrence of casualties and losses are largely takenindividually in accordance with ones financial capability. Relocation is often not resorted toas a means of avoiding the problem. Instead, business establishments and relatively well-offresidents generally construct new buildings and/or remodeled old ones by raising the groundlevel (by land fill) to conform with the flood level. While this relatively protect theirpremises/properties from floodwaters, it is at the disadvantage of unfilled areas whereflooding is further aggravated. This situation affects mostly the poor population settledwithin and around developed areas. The coping mechanism for the urban poor communitiesis either to build houses on stilts or just simply live with the situation when it occurs. Thereare in fact some communities whose dwelling units are almost always under water.
From 1980 up to the present there are indications of a significant number of families
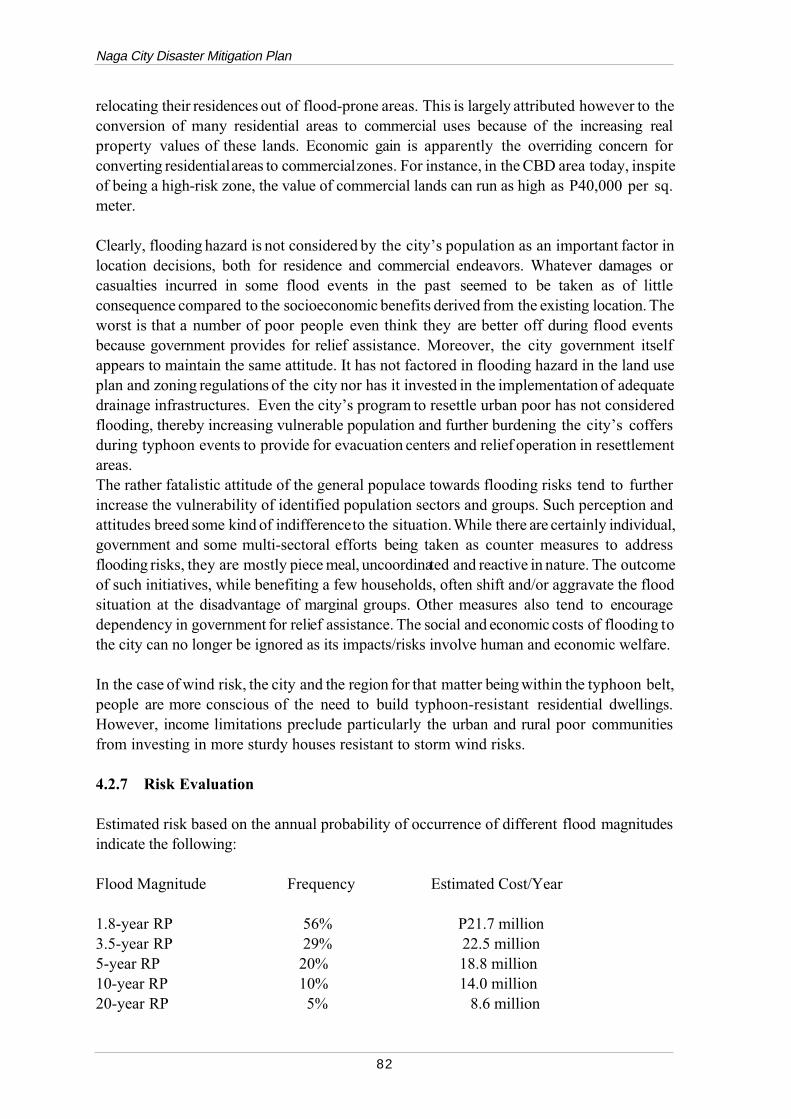
Naga City Disaster Mitigation Plan
82
relocating their residences out of flood-prone areas. This is largely attributed however to theconversion of many residential areas to commercial uses because of the increasing realproperty values of these lands. Economic gain is apparently the overriding concern forconverting residential areas to commercial zones. For instance, in the CBD area today, inspiteof being a high-risk zone, the value of commercial lands can run as high as P40,000 per sq.meter.
Clearly, flooding hazard is not considered by the city’s population as an important factor inlocation decisions, both for residence and commercial endeavors. Whatever damages orcasualties incurred in some flood events in the past seemed to be taken as of littleconsequence compared to the socioeconomic benefits derived from the existing location. Theworst is that a number of poor people even think they are better off during flood eventsbecause government provides for relief assistance. Moreover, the city government itselfappears to maintain the same attitude. It has not factored in flooding hazard in the land useplan and zoning regulations of the city nor has it invested in the implementation of adequatedrainage infrastructures. Even the city’s program to resettle urban poor has not consideredflooding, thereby increasing vulnerable population and further burdening the city’s coffersduring typhoon events to provide for evacuation centers and relief operation in resettlementareas. The rather fatalistic attitude of the general populace towards flooding risks tend to furtherincrease the vulnerability of identified population sectors and groups. Such perception andattitudes breed some kind of indifference to the situation. While there are certainly individual,government and some multi-sectoral efforts being taken as counter measures to addressflooding risks, they are mostly piece meal, uncoordinated and reactive in nature. The outcomeof such initiatives, while benefiting a few households, often shift and/or aggravate the floodsituation at the disadvantage of marginal groups. Other measures also tend to encouragedependency in government for relief assistance. The social and economic costs of flooding tothe city can no longer be ignored as its impacts/risks involve human and economic welfare.
In the case of wind risk, the city and the region for that matter being within the typhoon belt,people are more conscious of the need to build typhoon-resistant residential dwellings.However, income limitations preclude particularly the urban and rural poor communitiesfrom investing in more sturdy houses resistant to storm wind risks.
4.2.7 Risk Evaluation
Estimated risk based on the annual probability of occurrence of different flood magnitudesindicate the following:
Flood Magnitude Frequency Estimated Cost/Year
1.8-year RP 56% P21.7 million3.5-year RP 29% 22.5 million5-year RP 20% 18.8 million10-year RP 10% 14.0 million20-year RP 5% 8.6 million
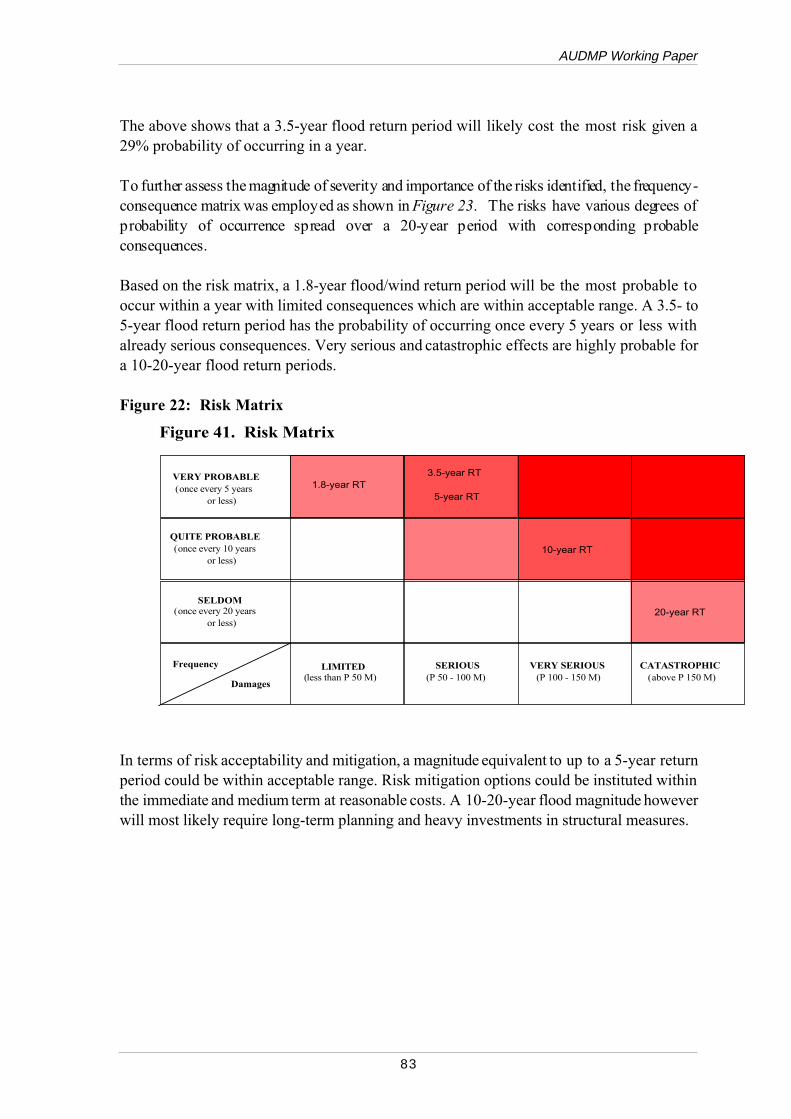
AUDMP Working Paper
83
The above shows that a 3.5-year flood return period will likely cost the most risk given a29% probability of occurring in a year. To further assess the magnitude of severity and importance of the risks identified, the frequency-consequence matrix was employed as shown in Figure 23. The risks have various degrees ofprobability of occurrence spread over a 20-year period with corresponding probableconsequences.
Based on the risk matrix, a 1.8-year flood/wind return period will be the most probable tooccur within a year with limited consequences which are within acceptable range. A 3.5- to5-year flood return period has the probability of occurring once every 5 years or less withalready serious consequences. Very serious and catastrophic effects are highly probable fora 10-20-year flood return periods.
Figure 22: Risk Matrix
In terms of risk acceptability and mitigation, a magnitude equivalent to up to a 5-year returnperiod could be within acceptable range. Risk mitigation options could be instituted withinthe immediate and medium term at reasonable costs. A 10-20-year flood magnitude howeverwill most likely require long-term planning and heavy investments in structural measures.
VERY PROBABLE(once every 5 years
or less)
QUITE PROBABLE(once every 10 years
or less)
SELDOM(once every 20 years
or less)
LIMITED(less than P 50 M)
SERIOUS(P 50 - 100 M)
VERY SERIOUS(P 100 - 150 M)
CATASTROPHIC(above P 150 M)
Frequency
Damages
Figure 41. Risk Matrix
1.8-year RT3.5-year RT
10-year RT
20-year RT
5-year RT
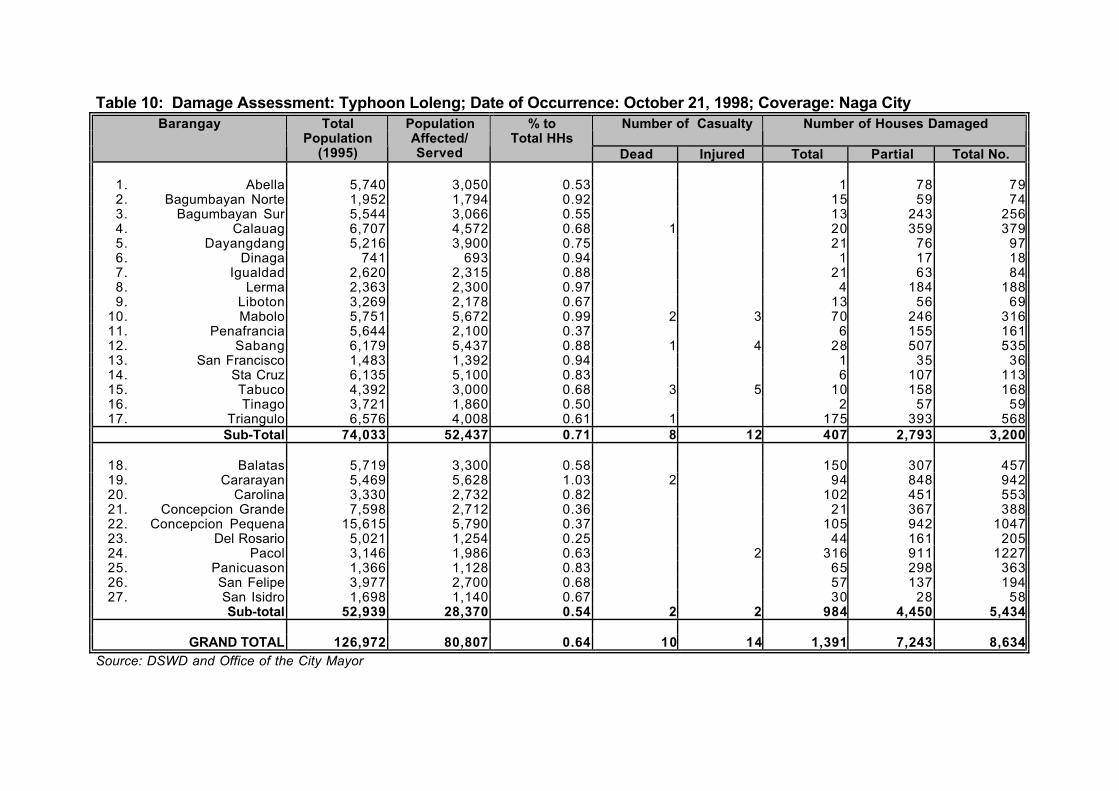
Table 10: Damage Assessment: Typhoon Loleng; Date of Occurrence: October 21, 1998; Coverage: Naga City Number of Casualty Number of Houses DamagedBarangay Total
Population(1995)
PopulationAffected/Served
% toTotal HHs
Dead Injured Total Partial Total No.
1. Abella 5,740 3,050 0.53 1 78 792. Bagumbayan Norte 1,952 1,794 0.92 15 59 743. Bagumbayan Sur 5,544 3,066 0.55 13 243 2564. Calauag 6,707 4,572 0.68 1 20 359 3795. Dayangdang 5,216 3,900 0.75 21 76 976. Dinaga 741 693 0.94 1 17 187. Igualdad 2,620 2,315 0.88 21 63 848. Lerma 2,363 2,300 0.97 4 184 1889. Liboton 3,269 2,178 0.67 13 56 69
10. Mabolo 5,751 5,672 0.99 2 3 70 246 31611. Penafrancia 5,644 2,100 0.37 6 155 16112. Sabang 6,179 5,437 0.88 1 4 28 507 53513. San Francisco 1,483 1,392 0.94 1 35 3614. Sta Cruz 6,135 5,100 0.83 6 107 11315. Tabuco 4,392 3,000 0.68 3 5 10 158 16816. Tinago 3,721 1,860 0.50 2 57 5917. Triangulo 6,576 4,008 0.61 1 175 393 568
Sub-Total 74,033 52,437 0.71 8 12 407 2,793 3,200
18. Balatas 5,719 3,300 0.58 150 307 45719. Cararayan 5,469 5,628 1.03 2 94 848 94220. Carolina 3,330 2,732 0.82 102 451 55321. Concepcion Grande 7,598 2,712 0.36 21 367 38822. Concepcion Pequena 15,615 5,790 0.37 105 942 104723. Del Rosario 5,021 1,254 0.25 44 161 20524. Pacol 3,146 1,986 0.63 2 316 911 122725. Panicuason 1,366 1,128 0.83 65 298 36326. San Felipe 3,977 2,700 0.68 57 137 19427. San Isidro 1,698 1,140 0.67 30 28 58
Sub-total 52,939 28,370 0.54 2 2 984 4,450 5,434
GRAND TOTAL 126,972 80,807 0.64 10 14 1,391 7,243 8,634Source: DSWD and Office of the City Mayor
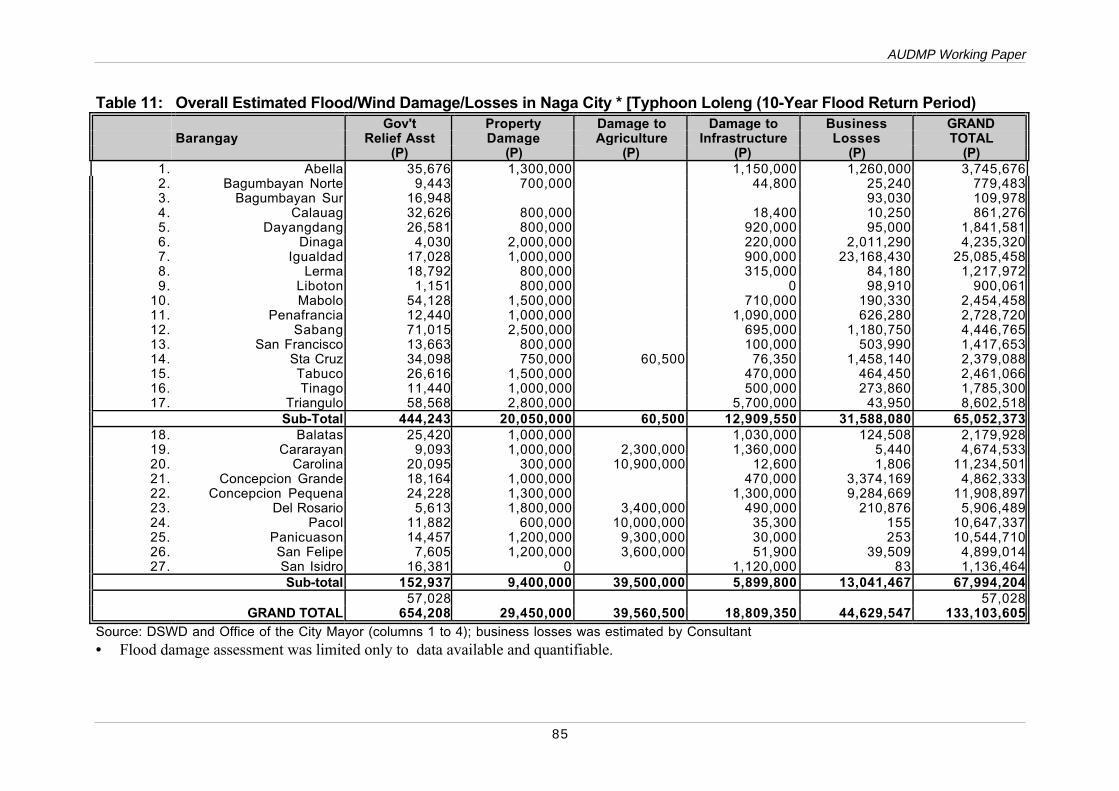
AUDMP Working Paper
85
Table 11: Overall Estimated Flood/Wind Damage/Losses in Naga City * [Typhoon Loleng (10-Year Flood Return Period)Gov't Property Damage to Damage to Business GRAND
Barangay Relief Asst Damage Agriculture Infrastructure Losses TOTAL(P) (P) (P) (P) (P) (P)
1. Abella 35,676 1,300,000 1,150,000 1,260,000 3,745,6762. Bagumbayan Norte 9,443 700,000 44,800 25,240 779,4833. Bagumbayan Sur 16,948 93,030 109,9784. Calauag 32,626 800,000 18,400 10,250 861,2765. Dayangdang 26,581 800,000 920,000 95,000 1,841,5816. Dinaga 4,030 2,000,000 220,000 2,011,290 4,235,3207. Igualdad 17,028 1,000,000 900,000 23,168,430 25,085,4588. Lerma 18,792 800,000 315,000 84,180 1,217,9729. Liboton 1,151 800,000 0 98,910 900,061
10. Mabolo 54,128 1,500,000 710,000 190,330 2,454,45811. Penafrancia 12,440 1,000,000 1,090,000 626,280 2,728,72012. Sabang 71,015 2,500,000 695,000 1,180,750 4,446,76513. San Francisco 13,663 800,000 100,000 503,990 1,417,65314. Sta Cruz 34,098 750,000 60,500 76,350 1,458,140 2,379,08815. Tabuco 26,616 1,500,000 470,000 464,450 2,461,06616. Tinago 11,440 1,000,000 500,000 273,860 1,785,30017. Triangulo 58,568 2,800,000 5,700,000 43,950 8,602,518
Sub-Total 444,243 20,050,000 60,500 12,909,550 31,588,080 65,052,37318. Balatas 25,420 1,000,000 1,030,000 124,508 2,179,92819. Cararayan 9,093 1,000,000 2,300,000 1,360,000 5,440 4,674,53320. Carolina 20,095 300,000 10,900,000 12,600 1,806 11,234,50121. Concepcion Grande 18,164 1,000,000 470,000 3,374,169 4,862,33322. Concepcion Pequena 24,228 1,300,000 1,300,000 9,284,669 11,908,89723. Del Rosario 5,613 1,800,000 3,400,000 490,000 210,876 5,906,48924. Pacol 11,882 600,000 10,000,000 35,300 155 10,647,33725. Panicuason 14,457 1,200,000 9,300,000 30,000 253 10,544,71026. San Felipe 7,605 1,200,000 3,600,000 51,900 39,509 4,899,01427. San Isidro 16,381 0 1,120,000 83 1,136,464
Sub-total 152,937 9,400,000 39,500,000 5,899,800 13,041,467 67,994,20457,028 57,028
GRAND TOTAL 654,208 29,450,000 39,560,500 18,809,350 44,629,547 133,103,605Source: DSWD and Office of the City Mayor (columns 1 to 4); business losses was estimated by Consultant• Flood damage assessment was limited only to data available and quantifiable.
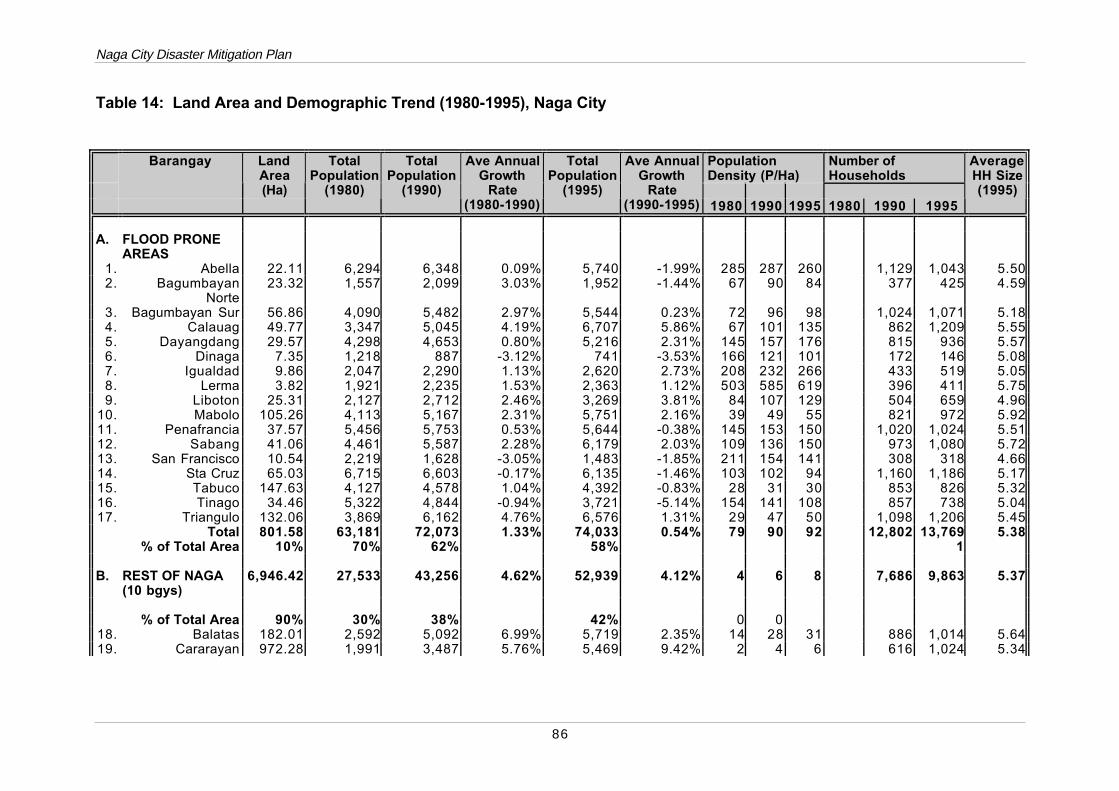
Naga City Disaster Mitigation Plan
86
Table 14: Land Area and Demographic Trend (1980-1995), Naga City
PopulationDensity (P/Ha)
Number ofHouseholds
Barangay LandArea(Ha)
TotalPopulation
(1980)
TotalPopulation
(1990)
Ave AnnualGrowth
Rate(1980-1990)
TotalPopulation
(1995)
Ave AnnualGrowth
Rate(1990-1995) 1980 1990 1995 1980 1990 1995
AverageHH Size(1995)
A. FLOOD PRONEAREAS
1. Abella 22.11 6,294 6,348 0.09% 5,740 -1.99% 285 287 260 1,129 1,043 5.502. Bagumbayan
Norte23.32 1,557 2,099 3.03% 1,952 -1.44% 67 90 84 377 425 4.59
3. Bagumbayan Sur 56.86 4,090 5,482 2.97% 5,544 0.23% 72 96 98 1,024 1,071 5.184. Calauag 49.77 3,347 5,045 4.19% 6,707 5.86% 67 101 135 862 1,209 5.555. Dayangdang 29.57 4,298 4,653 0.80% 5,216 2.31% 145 157 176 815 936 5.576. Dinaga 7.35 1,218 887 -3.12% 741 -3.53% 166 121 101 172 146 5.087. Igualdad 9.86 2,047 2,290 1.13% 2,620 2.73% 208 232 266 433 519 5.058. Lerma 3.82 1,921 2,235 1.53% 2,363 1.12% 503 585 619 396 411 5.759. Liboton 25.31 2,127 2,712 2.46% 3,269 3.81% 84 107 129 504 659 4.96
10. Mabolo 105.26 4,113 5,167 2.31% 5,751 2.16% 39 49 55 821 972 5.9211. Penafrancia 37.57 5,456 5,753 0.53% 5,644 -0.38% 145 153 150 1,020 1,024 5.5112. Sabang 41.06 4,461 5,587 2.28% 6,179 2.03% 109 136 150 973 1,080 5.7213. San Francisco 10.54 2,219 1,628 -3.05% 1,483 -1.85% 211 154 141 308 318 4.6614. Sta Cruz 65.03 6,715 6,603 -0.17% 6,135 -1.46% 103 102 94 1,160 1,186 5.1715. Tabuco 147.63 4,127 4,578 1.04% 4,392 -0.83% 28 31 30 853 826 5.3216. Tinago 34.46 5,322 4,844 -0.94% 3,721 -5.14% 154 141 108 857 738 5.0417. Triangulo 132.06 3,869 6,162 4.76% 6,576 1.31% 29 47 50 1,098 1,206 5.45
Total 801.58 63,181 72,073 1.33% 74,033 0.54% 79 90 92 12,802 13,769 5.38% of Total Area 10% 70% 62% 58% 1
B. REST OF NAGA(10 bgys)
6,946.42 27,533 43,256 4.62% 52,939 4.12% 4 6 8 7,686 9,863 5.37
% of Total Area 90% 30% 38% 42% 0 018. Balatas 182.01 2,592 5,092 6.99% 5,719 2.35% 14 28 31 886 1,014 5.6419. Cararayan 972.28 1,991 3,487 5.76% 5,469 9.42% 2 4 6 616 1,024 5.34
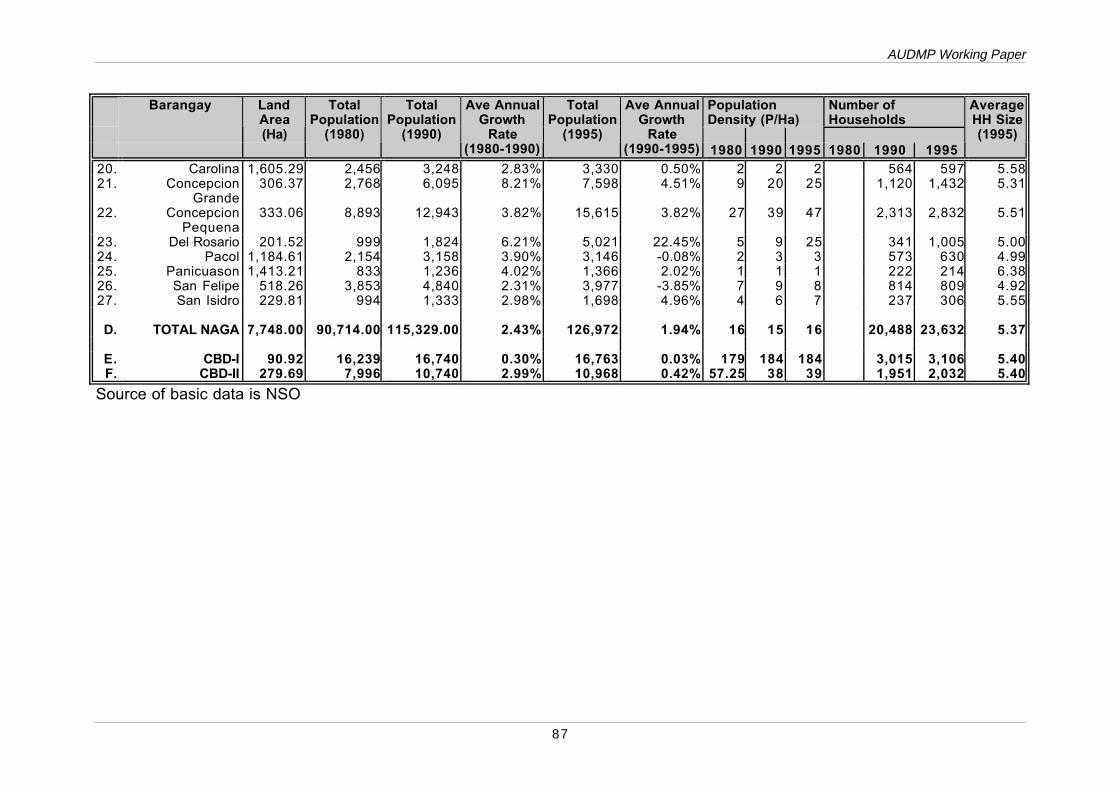
AUDMP Working Paper
87
PopulationDensity (P/Ha)
Number ofHouseholds
Barangay LandArea(Ha)
TotalPopulation
(1980)
TotalPopulation
(1990)
Ave AnnualGrowth
Rate(1980-1990)
TotalPopulation
(1995)
Ave AnnualGrowth
Rate(1990-1995) 1980 1990 1995 1980 1990 1995
AverageHH Size(1995)
20. Carolina 1,605.29 2,456 3,248 2.83% 3,330 0.50% 2 2 2 564 597 5.5821. Concepcion
Grande306.37 2,768 6,095 8.21% 7,598 4.51% 9 20 25 1,120 1,432 5.31
22. ConcepcionPequena
333.06 8,893 12,943 3.82% 15,615 3.82% 27 39 47 2,313 2,832 5.51
23. Del Rosario 201.52 999 1,824 6.21% 5,021 22.45% 5 9 25 341 1,005 5.0024. Pacol 1,184.61 2,154 3,158 3.90% 3,146 -0.08% 2 3 3 573 630 4.9925. Panicuason 1,413.21 833 1,236 4.02% 1,366 2.02% 1 1 1 222 214 6.3826. San Felipe 518.26 3,853 4,840 2.31% 3,977 -3.85% 7 9 8 814 809 4.9227. San Isidro 229.81 994 1,333 2.98% 1,698 4.96% 4 6 7 237 306 5.55
D. TOTAL NAGA 7,748.00 90,714.00 115,329.00 2.43% 126,972 1.94% 16 15 16 20,488 23,632 5.37
E. CBD-I 90.92 16,239 16,740 0.30% 16,763 0.03% 179 184 184 3,015 3,106 5.40F. CBD-II 279.69 7,996 10,740 2.99% 10,968 0.42% 57.25 38 39 1,951 2,032 5.40
Source of basic data is NSO
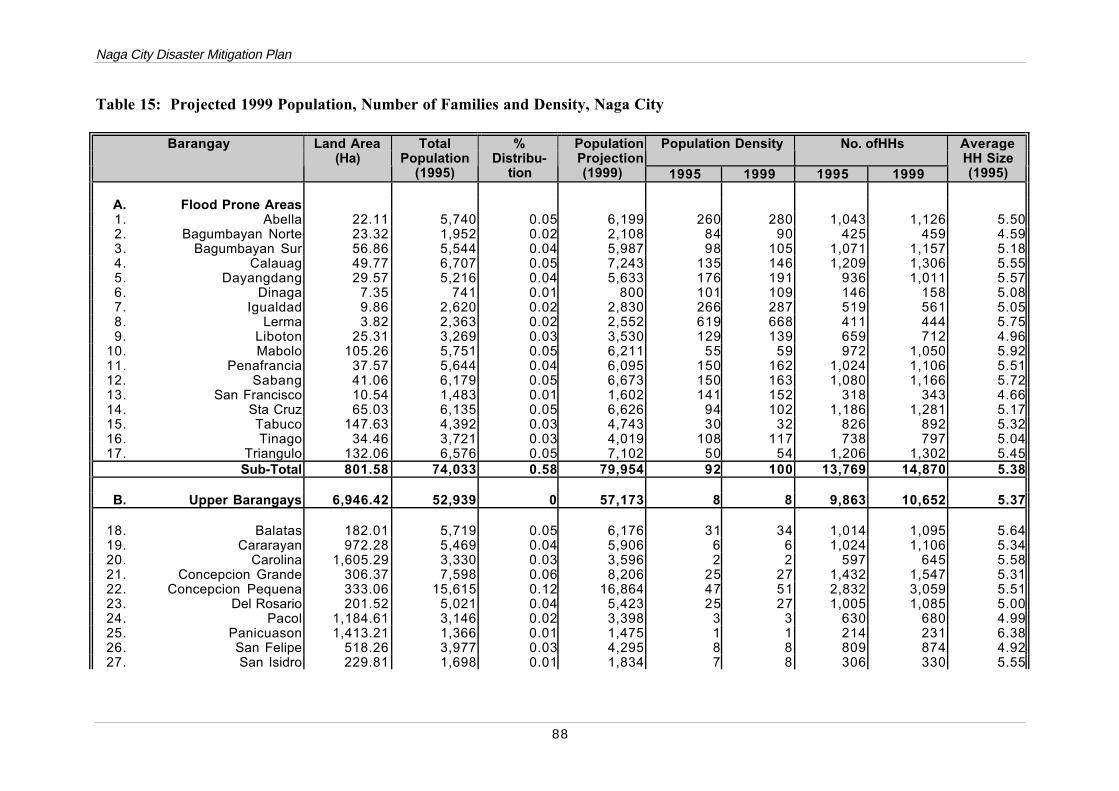
Naga City Disaster Mitigation Plan
88
Table 15: Projected 1999 Population, Number of Families and Density, Naga City
Population Density No. ofHHsBarangay Land Area(Ha)
TotalPopulation
(1995)
%Distribu-
tion
PopulationProjection(1999) 1995 1999 1995 1999
AverageHH Size(1995)
A. Flood Prone Areas1. Abella 22.11 5,740 0.05 6,199 260 280 1,043 1,126 5.502. Bagumbayan Norte 23.32 1,952 0.02 2,108 84 90 425 459 4.593. Bagumbayan Sur 56.86 5,544 0.04 5,987 98 105 1,071 1,157 5.184. Calauag 49.77 6,707 0.05 7,243 135 146 1,209 1,306 5.555. Dayangdang 29.57 5,216 0.04 5,633 176 191 936 1,011 5.576. Dinaga 7.35 741 0.01 800 101 109 146 158 5.087. Igualdad 9.86 2,620 0.02 2,830 266 287 519 561 5.058. Lerma 3.82 2,363 0.02 2,552 619 668 411 444 5.759. Liboton 25.31 3,269 0.03 3,530 129 139 659 712 4.96
10. Mabolo 105.26 5,751 0.05 6,211 55 59 972 1,050 5.9211. Penafrancia 37.57 5,644 0.04 6,095 150 162 1,024 1,106 5.5112. Sabang 41.06 6,179 0.05 6,673 150 163 1,080 1,166 5.7213. San Francisco 10.54 1,483 0.01 1,602 141 152 318 343 4.6614. Sta Cruz 65.03 6,135 0.05 6,626 94 102 1,186 1,281 5.1715. Tabuco 147.63 4,392 0.03 4,743 30 32 826 892 5.3216. Tinago 34.46 3,721 0.03 4,019 108 117 738 797 5.0417. Triangulo 132.06 6,576 0.05 7,102 50 54 1,206 1,302 5.45
Sub-Total 801.58 74,033 0.58 79,954 92 100 13,769 14,870 5.38
B. Upper Barangays 6,946.42 52,939 0 57,173 8 8 9,863 10,652 5.37
18. Balatas 182.01 5,719 0.05 6,176 31 34 1,014 1,095 5.6419. Cararayan 972.28 5,469 0.04 5,906 6 6 1,024 1,106 5.3420. Carolina 1,605.29 3,330 0.03 3,596 2 2 597 645 5.5821. Concepcion Grande 306.37 7,598 0.06 8,206 25 27 1,432 1,547 5.3122. Concepcion Pequena 333.06 15,615 0.12 16,864 47 51 2,832 3,059 5.5123. Del Rosario 201.52 5,021 0.04 5,423 25 27 1,005 1,085 5.0024. Pacol 1,184.61 3,146 0.02 3,398 3 3 630 680 4.9925. Panicuason 1,413.21 1,366 0.01 1,475 1 1 214 231 6.3826. San Felipe 518.26 3,977 0.03 4,295 8 8 809 874 4.9227. San Isidro 229.81 1,698 0.01 1,834 7 8 306 330 5.55
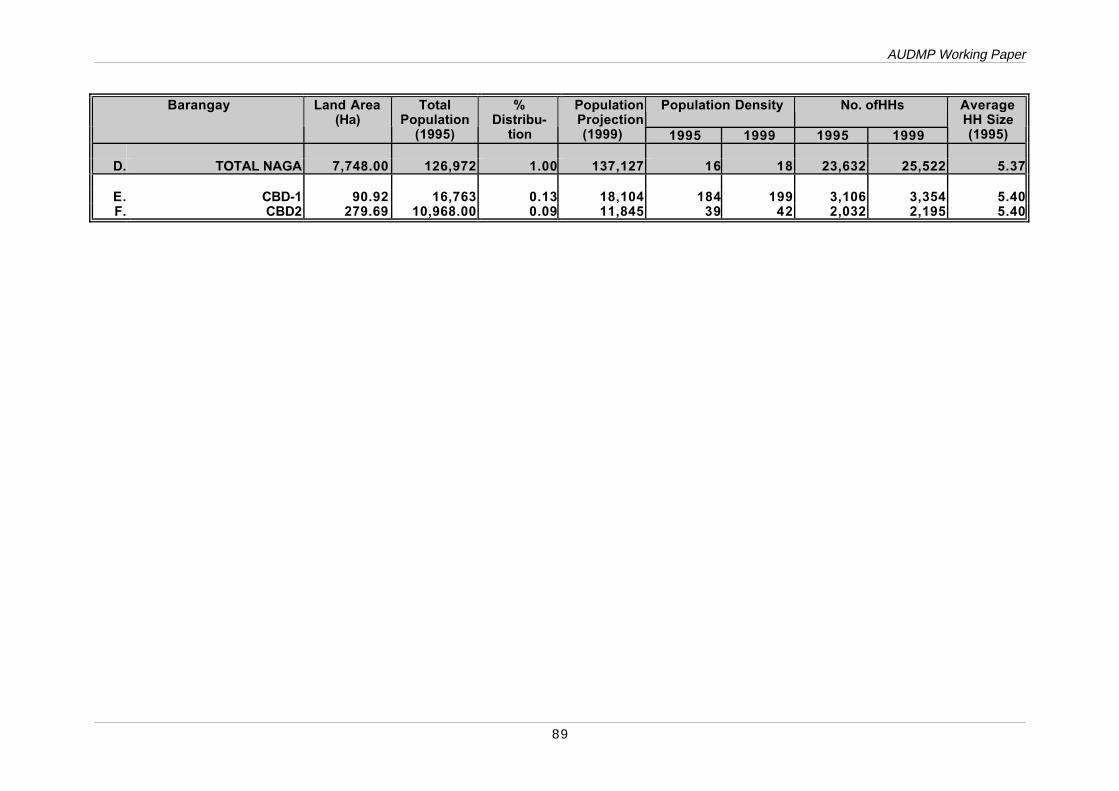
AUDMP Working Paper
89
Population Density No. ofHHsBarangay Land Area(Ha)
TotalPopulation
(1995)
%Distribu-
tion
PopulationProjection(1999) 1995 1999 1995 1999
AverageHH Size(1995)
D. TOTAL NAGA 7,748.00 126,972 1.00 137,127 16 18 23,632 25,522 5.37
E. CBD-1 90.92 16,763 0.13 18,104 184 199 3,106 3,354 5.40F. CBD2 279.69 10,968.00 0.09 11,845 39 42 2,032 2,195 5.40
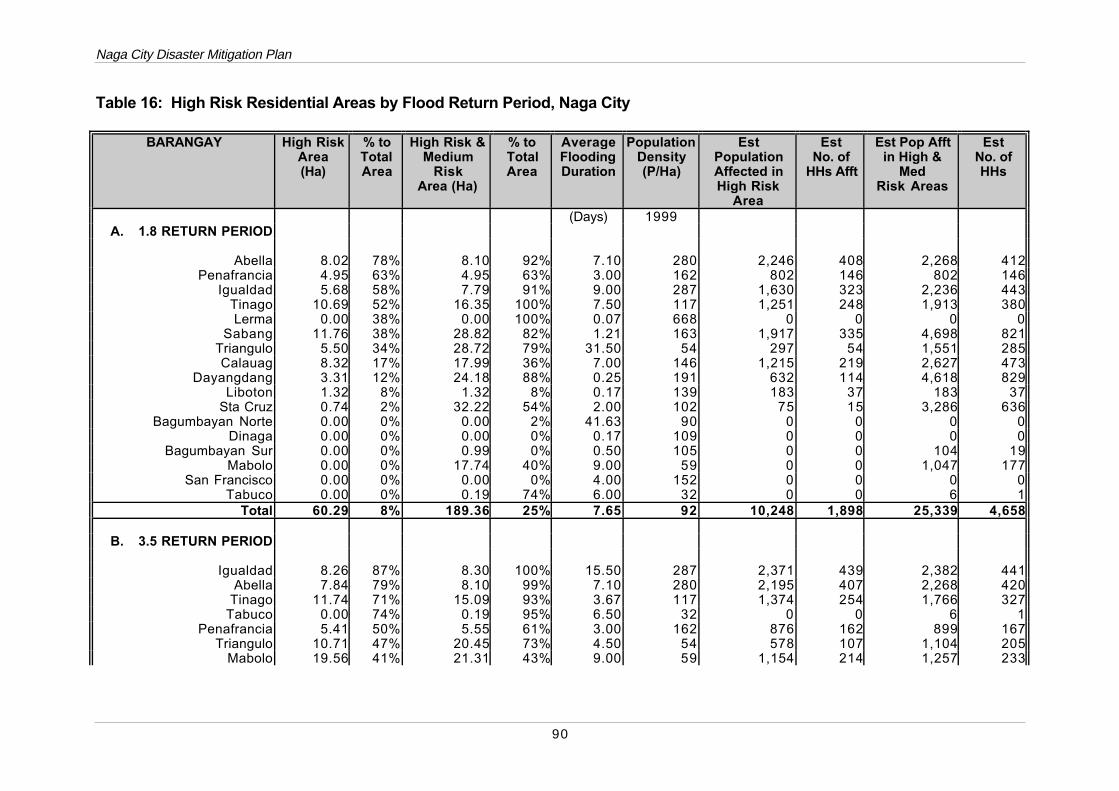
Naga City Disaster Mitigation Plan
90
Table 16: High Risk Residential Areas by Flood Return Period, Naga City
BARANGAY High RiskArea(Ha)
% toTotalArea
High Risk &Medium
RiskArea (Ha)
% toTotalArea
AverageFloodingDuration
PopulationDensity(P/Ha)
EstPopulationAffected inHigh Risk
Area
EstNo. of
HHs Afft
Est Pop Afftin High &
MedRisk Areas
EstNo. ofHHs
(Days) 1999A. 1.8 RETURN PERIOD
Abella 8.02 78% 8.10 92% 7.10 280 2,246 408 2,268 412Penafrancia 4.95 63% 4.95 63% 3.00 162 802 146 802 146
Igualdad 5.68 58% 7.79 91% 9.00 287 1,630 323 2,236 443Tinago 10.69 52% 16.35 100% 7.50 117 1,251 248 1,913 380Lerma 0.00 38% 0.00 100% 0.07 668 0 0 0 0
Sabang 11.76 38% 28.82 82% 1.21 163 1,917 335 4,698 821Triangulo 5.50 34% 28.72 79% 31.50 54 297 54 1,551 285Calauag 8.32 17% 17.99 36% 7.00 146 1,215 219 2,627 473
Dayangdang 3.31 12% 24.18 88% 0.25 191 632 114 4,618 829Liboton 1.32 8% 1.32 8% 0.17 139 183 37 183 37
Sta Cruz 0.74 2% 32.22 54% 2.00 102 75 15 3,286 636Bagumbayan Norte 0.00 0% 0.00 2% 41.63 90 0 0 0 0
Dinaga 0.00 0% 0.00 0% 0.17 109 0 0 0 0Bagumbayan Sur 0.00 0% 0.99 0% 0.50 105 0 0 104 19
Mabolo 0.00 0% 17.74 40% 9.00 59 0 0 1,047 177San Francisco 0.00 0% 0.00 0% 4.00 152 0 0 0 0
Tabuco 0.00 0% 0.19 74% 6.00 32 0 0 6 1Total 60.29 8% 189.36 25% 7.65 92 10,248 1,898 25,339 4,658
B. 3.5 RETURN PERIOD
Igualdad 8.26 87% 8.30 100% 15.50 287 2,371 439 2,382 441Abella 7.84 79% 8.10 99% 7.10 280 2,195 407 2,268 420
Tinago 11.74 71% 15.09 93% 3.67 117 1,374 254 1,766 327Tabuco 0.00 74% 0.19 95% 6.50 32 0 0 6 1
Penafrancia 5.41 50% 5.55 61% 3.00 162 876 162 899 167Triangulo 10.71 47% 20.45 73% 4.50 54 578 107 1,104 205
Mabolo 19.56 41% 21.31 43% 9.00 59 1,154 214 1,257 233
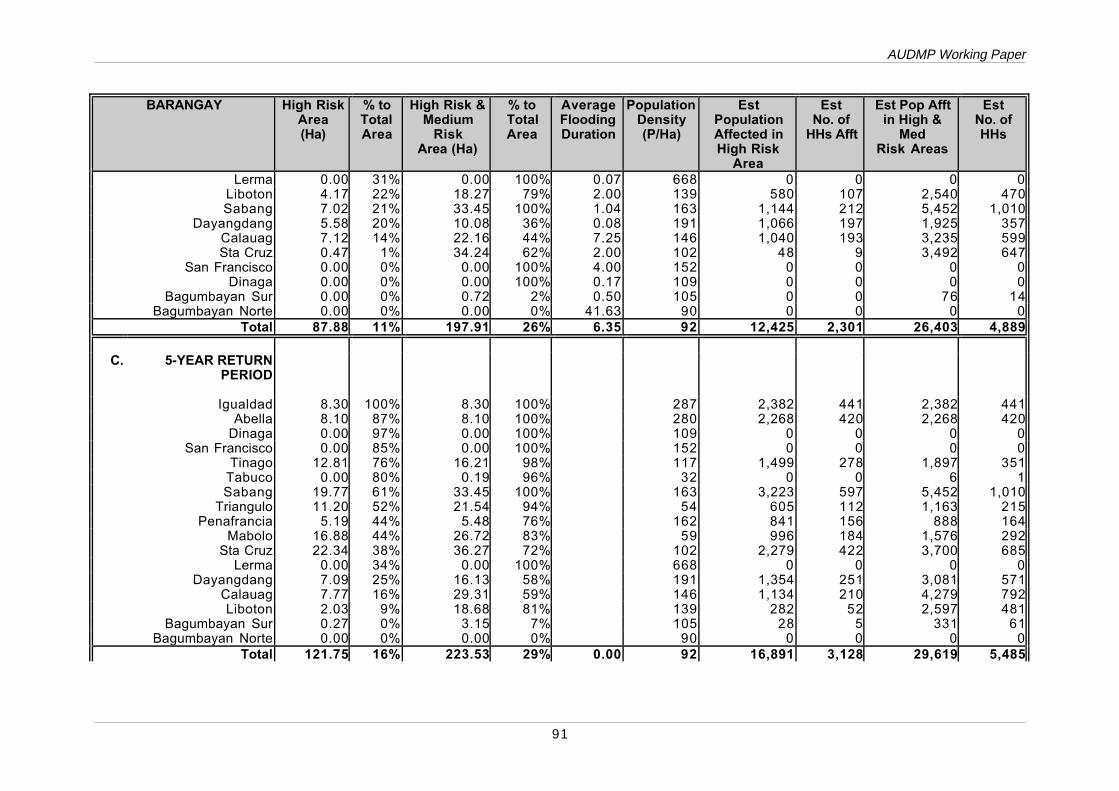
AUDMP Working Paper
91
BARANGAY High RiskArea(Ha)
% toTotalArea
High Risk &Medium
RiskArea (Ha)
% toTotalArea
AverageFloodingDuration
PopulationDensity(P/Ha)
EstPopulationAffected inHigh Risk
Area
EstNo. of
HHs Afft
Est Pop Afftin High &
MedRisk Areas
EstNo. ofHHs
Lerma 0.00 31% 0.00 100% 0.07 668 0 0 0 0Liboton 4.17 22% 18.27 79% 2.00 139 580 107 2,540 470Sabang 7.02 21% 33.45 100% 1.04 163 1,144 212 5,452 1,010
Dayangdang 5.58 20% 10.08 36% 0.08 191 1,066 197 1,925 357Calauag 7.12 14% 22.16 44% 7.25 146 1,040 193 3,235 599Sta Cruz 0.47 1% 34.24 62% 2.00 102 48 9 3,492 647
San Francisco 0.00 0% 0.00 100% 4.00 152 0 0 0 0Dinaga 0.00 0% 0.00 100% 0.17 109 0 0 0 0
Bagumbayan Sur 0.00 0% 0.72 2% 0.50 105 0 0 76 14Bagumbayan Norte 0.00 0% 0.00 0% 41.63 90 0 0 0 0
Total 87.88 11% 197.91 26% 6.35 92 12,425 2,301 26,403 4,889
C. 5-YEAR RETURNPERIOD
Igualdad 8.30 100% 8.30 100% 287 2,382 441 2,382 441Abella 8.10 87% 8.10 100% 280 2,268 420 2,268 420
Dinaga 0.00 97% 0.00 100% 109 0 0 0 0San Francisco 0.00 85% 0.00 100% 152 0 0 0 0
Tinago 12.81 76% 16.21 98% 117 1,499 278 1,897 351Tabuco 0.00 80% 0.19 96% 32 0 0 6 1Sabang 19.77 61% 33.45 100% 163 3,223 597 5,452 1,010
Triangulo 11.20 52% 21.54 94% 54 605 112 1,163 215Penafrancia 5.19 44% 5.48 76% 162 841 156 888 164
Mabolo 16.88 44% 26.72 83% 59 996 184 1,576 292Sta Cruz 22.34 38% 36.27 72% 102 2,279 422 3,700 685
Lerma 0.00 34% 0.00 100% 668 0 0 0 0Dayangdang 7.09 25% 16.13 58% 191 1,354 251 3,081 571
Calauag 7.77 16% 29.31 59% 146 1,134 210 4,279 792Liboton 2.03 9% 18.68 81% 139 282 52 2,597 481
Bagumbayan Sur 0.27 0% 3.15 7% 105 28 5 331 61Bagumbayan Norte 0.00 0% 0.00 0% 90 0 0 0 0
Total 121.75 16% 223.53 29% 0.00 92 16,891 3,128 29,619 5,485
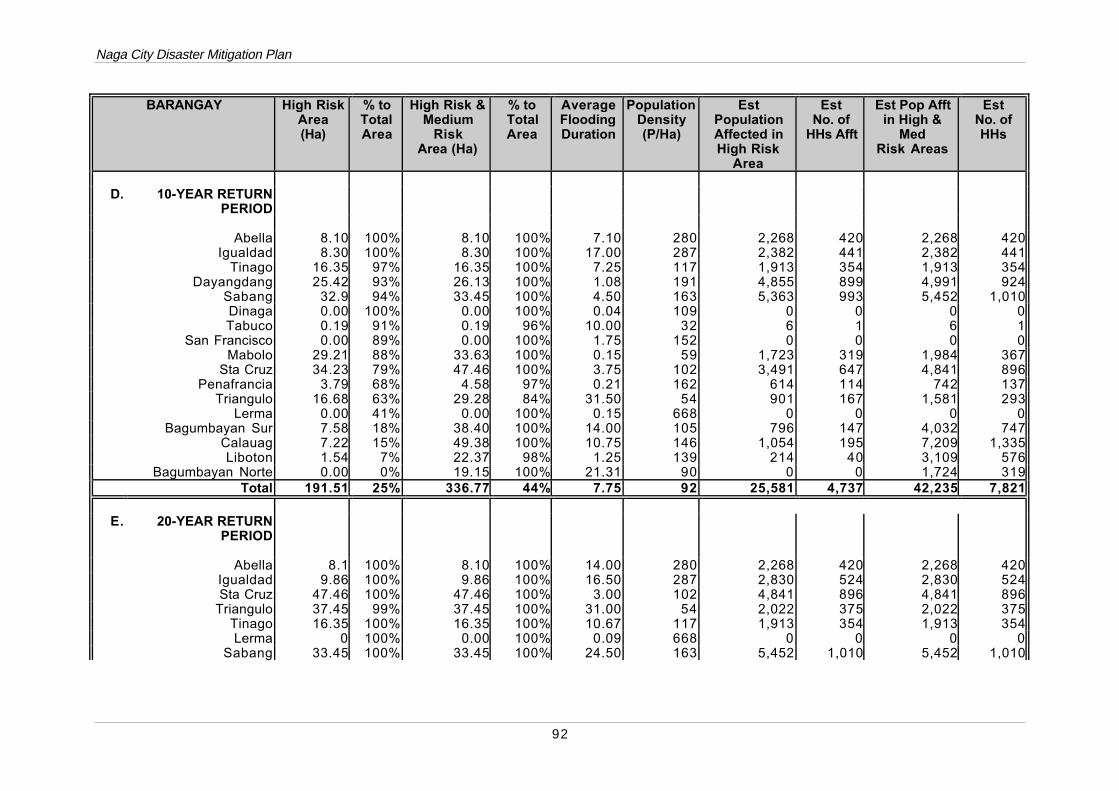
Naga City Disaster Mitigation Plan
92
BARANGAY High RiskArea(Ha)
% toTotalArea
High Risk &Medium
RiskArea (Ha)
% toTotalArea
AverageFloodingDuration
PopulationDensity(P/Ha)
EstPopulationAffected inHigh Risk
Area
EstNo. of
HHs Afft
Est Pop Afftin High &
MedRisk Areas
EstNo. ofHHs
D. 10-YEAR RETURNPERIOD
Abella 8.10 100% 8.10 100% 7.10 280 2,268 420 2,268 420Igualdad 8.30 100% 8.30 100% 17.00 287 2,382 441 2,382 441
Tinago 16.35 97% 16.35 100% 7.25 117 1,913 354 1,913 354Dayangdang 25.42 93% 26.13 100% 1.08 191 4,855 899 4,991 924
Sabang 32.9 94% 33.45 100% 4.50 163 5,363 993 5,452 1,010Dinaga 0.00 100% 0.00 100% 0.04 109 0 0 0 0Tabuco 0.19 91% 0.19 96% 10.00 32 6 1 6 1
San Francisco 0.00 89% 0.00 100% 1.75 152 0 0 0 0Mabolo 29.21 88% 33.63 100% 0.15 59 1,723 319 1,984 367
Sta Cruz 34.23 79% 47.46 100% 3.75 102 3,491 647 4,841 896Penafrancia 3.79 68% 4.58 97% 0.21 162 614 114 742 137
Triangulo 16.68 63% 29.28 84% 31.50 54 901 167 1,581 293Lerma 0.00 41% 0.00 100% 0.15 668 0 0 0 0
Bagumbayan Sur 7.58 18% 38.40 100% 14.00 105 796 147 4,032 747Calauag 7.22 15% 49.38 100% 10.75 146 1,054 195 7,209 1,335Liboton 1.54 7% 22.37 98% 1.25 139 214 40 3,109 576
Bagumbayan Norte 0.00 0% 19.15 100% 21.31 90 0 0 1,724 319Total 191.51 25% 336.77 44% 7.75 92 25,581 4,737 42,235 7,821
E. 20-YEAR RETURNPERIOD
Abella 8.1 100% 8.10 100% 14.00 280 2,268 420 2,268 420Igualdad 9.86 100% 9.86 100% 16.50 287 2,830 524 2,830 524Sta Cruz 47.46 100% 47.46 100% 3.00 102 4,841 896 4,841 896
Triangulo 37.45 99% 37.45 100% 31.00 54 2,022 375 2,022 375Tinago 16.35 100% 16.35 100% 10.67 117 1,913 354 1,913 354Lerma 0 100% 0.00 100% 0.09 668 0 0 0 0
Sabang 33.45 100% 33.45 100% 24.50 163 5,452 1,010 5,452 1,010
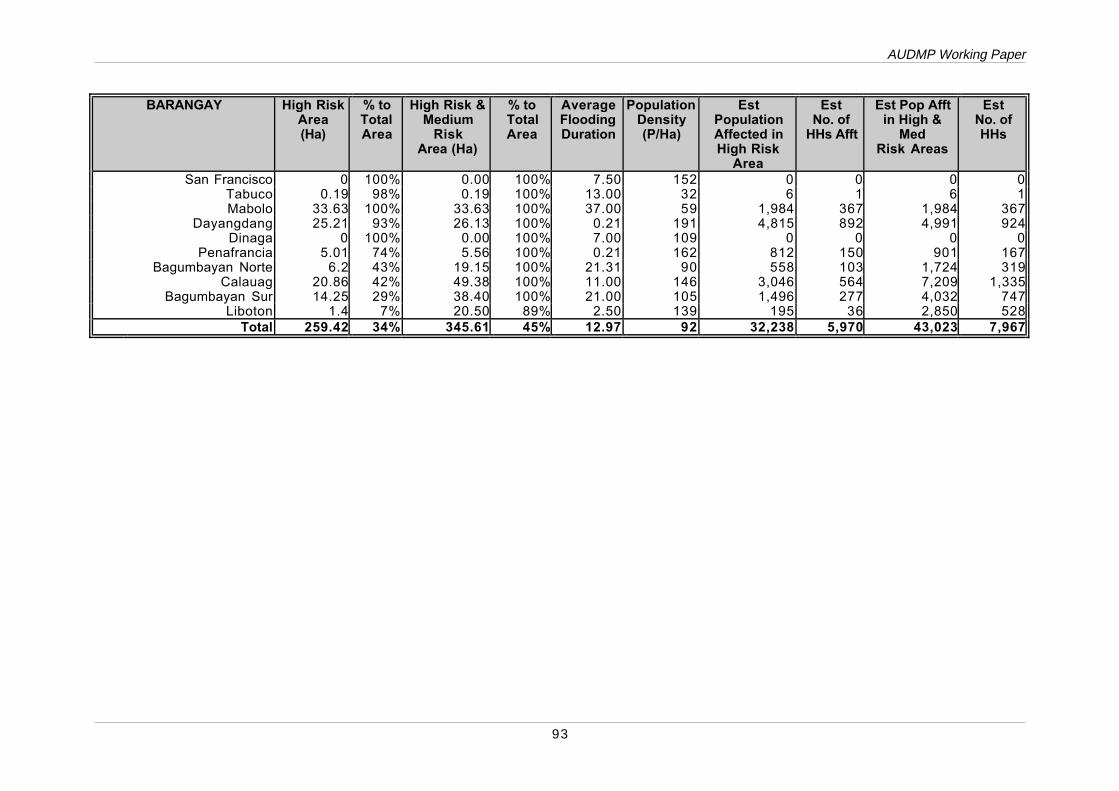
AUDMP Working Paper
93
BARANGAY High RiskArea(Ha)
% toTotalArea
High Risk &Medium
RiskArea (Ha)
% toTotalArea
AverageFloodingDuration
PopulationDensity(P/Ha)
EstPopulationAffected inHigh Risk
Area
EstNo. of
HHs Afft
Est Pop Afftin High &
MedRisk Areas
EstNo. ofHHs
San Francisco 0 100% 0.00 100% 7.50 152 0 0 0 0Tabuco 0.19 98% 0.19 100% 13.00 32 6 1 6 1Mabolo 33.63 100% 33.63 100% 37.00 59 1,984 367 1,984 367
Dayangdang 25.21 93% 26.13 100% 0.21 191 4,815 892 4,991 924Dinaga 0 100% 0.00 100% 7.00 109 0 0 0 0
Penafrancia 5.01 74% 5.56 100% 0.21 162 812 150 901 167Bagumbayan Norte 6.2 43% 19.15 100% 21.31 90 558 103 1,724 319
Calauag 20.86 42% 49.38 100% 11.00 146 3,046 564 7,209 1,335Bagumbayan Sur 14.25 29% 38.40 100% 21.00 105 1,496 277 4,032 747
Liboton 1.4 7% 20.50 89% 2.50 139 195 36 2,850 528Total 259.42 34% 345.61 45% 12.97 92 32,238 5,970 43,023 7,967
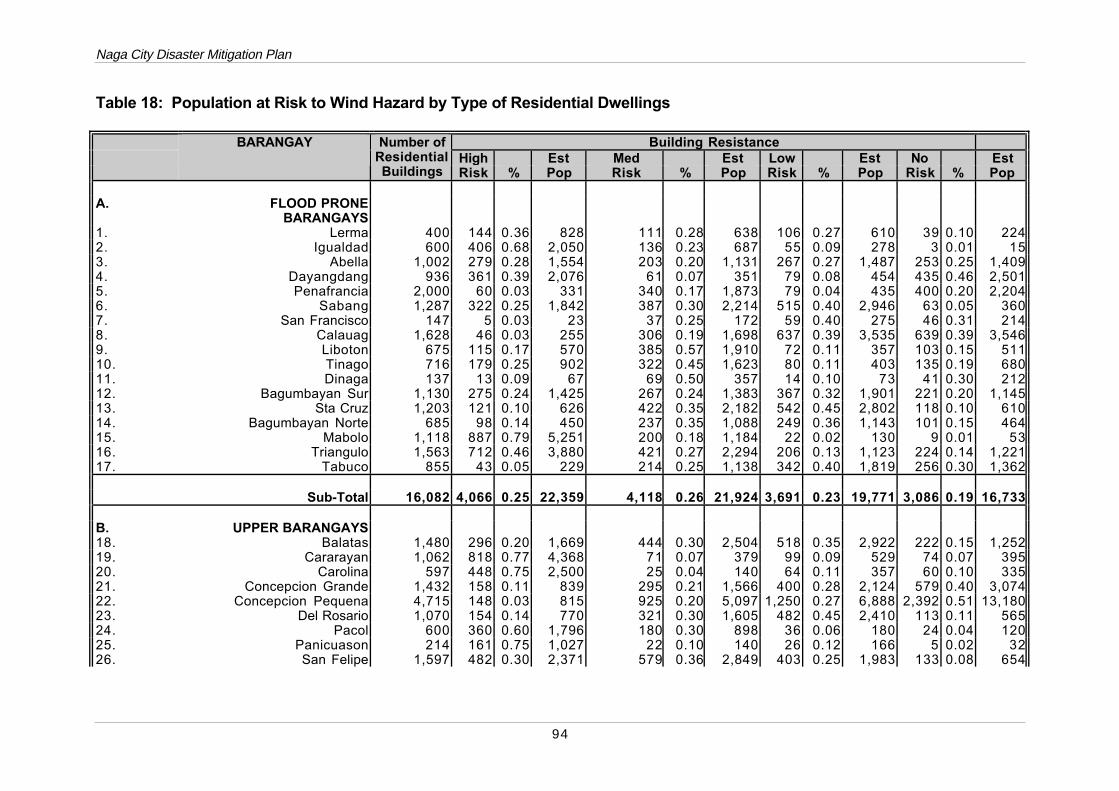
Naga City Disaster Mitigation Plan
94
Table 18: Population at Risk to Wind Hazard by Type of Residential Dwellings
Building ResistanceHigh Est Med Est Low Est No Est
BARANGAY Number ofResidentialBuildings Risk % Pop Risk % Pop Risk % Pop Risk % Pop
A. FLOOD PRONEBARANGAYS
1. Lerma 400 144 0.36 828 111 0.28 638 106 0.27 610 39 0.10 2242. Igualdad 600 406 0.68 2,050 136 0.23 687 55 0.09 278 3 0.01 153. Abella 1,002 279 0.28 1,554 203 0.20 1,131 267 0.27 1,487 253 0.25 1,4094. Dayangdang 936 361 0.39 2,076 61 0.07 351 79 0.08 454 435 0.46 2,5015. Penafrancia 2,000 60 0.03 331 340 0.17 1,873 79 0.04 435 400 0.20 2,2046. Sabang 1,287 322 0.25 1,842 387 0.30 2,214 515 0.40 2,946 63 0.05 3607. San Francisco 147 5 0.03 23 37 0.25 172 59 0.40 275 46 0.31 2148. Calauag 1,628 46 0.03 255 306 0.19 1,698 637 0.39 3,535 639 0.39 3,5469. Liboton 675 115 0.17 570 385 0.57 1,910 72 0.11 357 103 0.15 51110. Tinago 716 179 0.25 902 322 0.45 1,623 80 0.11 403 135 0.19 68011. Dinaga 137 13 0.09 67 69 0.50 357 14 0.10 73 41 0.30 21212. Bagumbayan Sur 1,130 275 0.24 1,425 267 0.24 1,383 367 0.32 1,901 221 0.20 1,14513. Sta Cruz 1,203 121 0.10 626 422 0.35 2,182 542 0.45 2,802 118 0.10 61014. Bagumbayan Norte 685 98 0.14 450 237 0.35 1,088 249 0.36 1,143 101 0.15 46415. Mabolo 1,118 887 0.79 5,251 200 0.18 1,184 22 0.02 130 9 0.01 5316. Triangulo 1,563 712 0.46 3,880 421 0.27 2,294 206 0.13 1,123 224 0.14 1,22117. Tabuco 855 43 0.05 229 214 0.25 1,138 342 0.40 1,819 256 0.30 1,362
Sub-Total 16,082 4,066 0.25 22,359 4,118 0.26 21,924 3,691 0.23 19,771 3,086 0.19 16,733
B. UPPER BARANGAYS18. Balatas 1,480 296 0.20 1,669 444 0.30 2,504 518 0.35 2,922 222 0.15 1,25219. Cararayan 1,062 818 0.77 4,368 71 0.07 379 99 0.09 529 74 0.07 39520. Carolina 597 448 0.75 2,500 25 0.04 140 64 0.11 357 60 0.10 33521. Concepcion Grande 1,432 158 0.11 839 295 0.21 1,566 400 0.28 2,124 579 0.40 3,07422. Concepcion Pequena 4,715 148 0.03 815 925 0.20 5,097 1,250 0.27 6,888 2,392 0.51 13,18023. Del Rosario 1,070 154 0.14 770 321 0.30 1,605 482 0.45 2,410 113 0.11 56524. Pacol 600 360 0.60 1,796 180 0.30 898 36 0.06 180 24 0.04 12025. Panicuason 214 161 0.75 1,027 22 0.10 140 26 0.12 166 5 0.02 3226. San Felipe 1,597 482 0.30 2,371 579 0.36 2,849 403 0.25 1,983 133 0.08 654
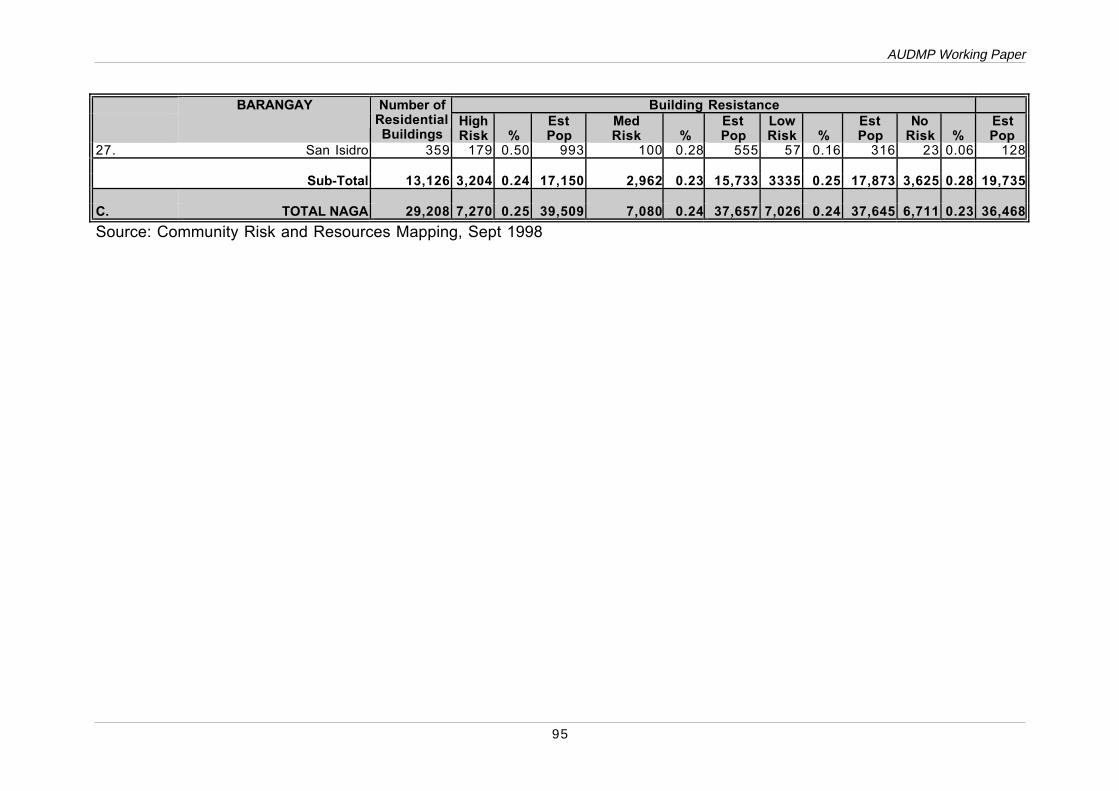
AUDMP Working Paper
95
Building ResistanceHigh Est Med Est Low Est No Est
BARANGAY Number ofResidentialBuildings Risk % Pop Risk % Pop Risk % Pop Risk % Pop
27. San Isidro 359 179 0.50 993 100 0.28 555 57 0.16 316 23 0.06 128
Sub-Total 13,126 3,204 0.24 17,150 2,962 0.23 15,733 3335 0.25 17,873 3,625 0.28 19,735
C. TOTAL NAGA 29,208 7,270 0.25 39,509 7,080 0.24 37,657 7,026 0.24 37,645 6,711 0.23 36,468
Source: Community Risk and Resources Mapping, Sept 1998
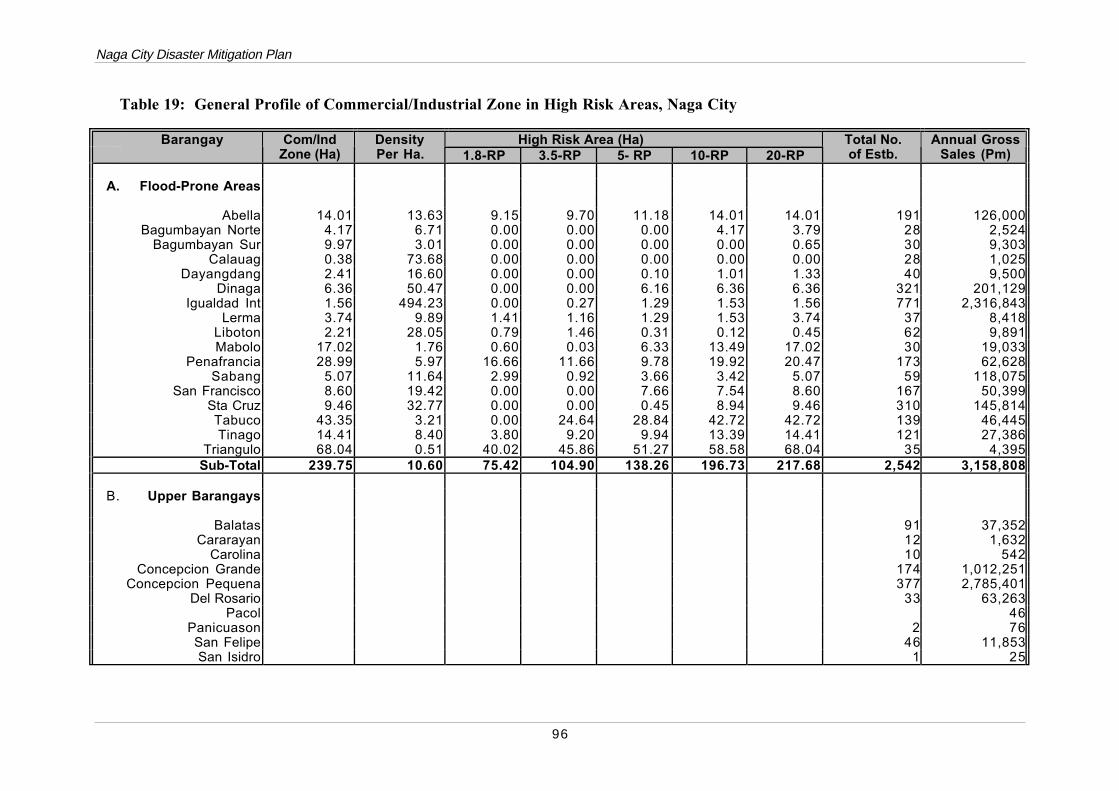
Naga City Disaster Mitigation Plan
96
Table 19: General Profile of Commercial/Industrial Zone in High Risk Areas, Naga City
High Risk Area (Ha)Barangay Com/IndZone (Ha)
DensityPer Ha. 1.8-RP 3.5-RP 5- RP 10-RP 20-RP
Total No.of Estb.
Annual GrossSales (Pm)
A. Flood-Prone Areas
Abella 14.01 13.63 9.15 9.70 11.18 14.01 14.01 191 126,000Bagumbayan Norte 4.17 6.71 0.00 0.00 0.00 4.17 3.79 28 2,524
Bagumbayan Sur 9.97 3.01 0.00 0.00 0.00 0.00 0.65 30 9,303Calauag 0.38 73.68 0.00 0.00 0.00 0.00 0.00 28 1,025
Dayangdang 2.41 16.60 0.00 0.00 0.10 1.01 1.33 40 9,500Dinaga 6.36 50.47 0.00 0.00 6.16 6.36 6.36 321 201,129
Igualdad Int 1.56 494.23 0.00 0.27 1.29 1.53 1.56 771 2,316,843Lerma 3.74 9.89 1.41 1.16 1.29 1.53 3.74 37 8,418
Liboton 2.21 28.05 0.79 1.46 0.31 0.12 0.45 62 9,891Mabolo 17.02 1.76 0.60 0.03 6.33 13.49 17.02 30 19,033
Penafrancia 28.99 5.97 16.66 11.66 9.78 19.92 20.47 173 62,628Sabang 5.07 11.64 2.99 0.92 3.66 3.42 5.07 59 118,075
San Francisco 8.60 19.42 0.00 0.00 7.66 7.54 8.60 167 50,399Sta Cruz 9.46 32.77 0.00 0.00 0.45 8.94 9.46 310 145,814Tabuco 43.35 3.21 0.00 24.64 28.84 42.72 42.72 139 46,445Tinago 14.41 8.40 3.80 9.20 9.94 13.39 14.41 121 27,386
Triangulo 68.04 0.51 40.02 45.86 51.27 58.58 68.04 35 4,395Sub-Total 239.75 10.60 75.42 104.90 138.26 196.73 217.68 2,542 3,158,808
B. Upper Barangays
Balatas 91 37,352Cararayan 12 1,632
Carolina 10 542Concepcion Grande 174 1,012,251
Concepcion Pequena 377 2,785,401Del Rosario 33 63,263
Pacol 46Panicuason 2 76San Felipe 46 11,853San Isidro 1 25
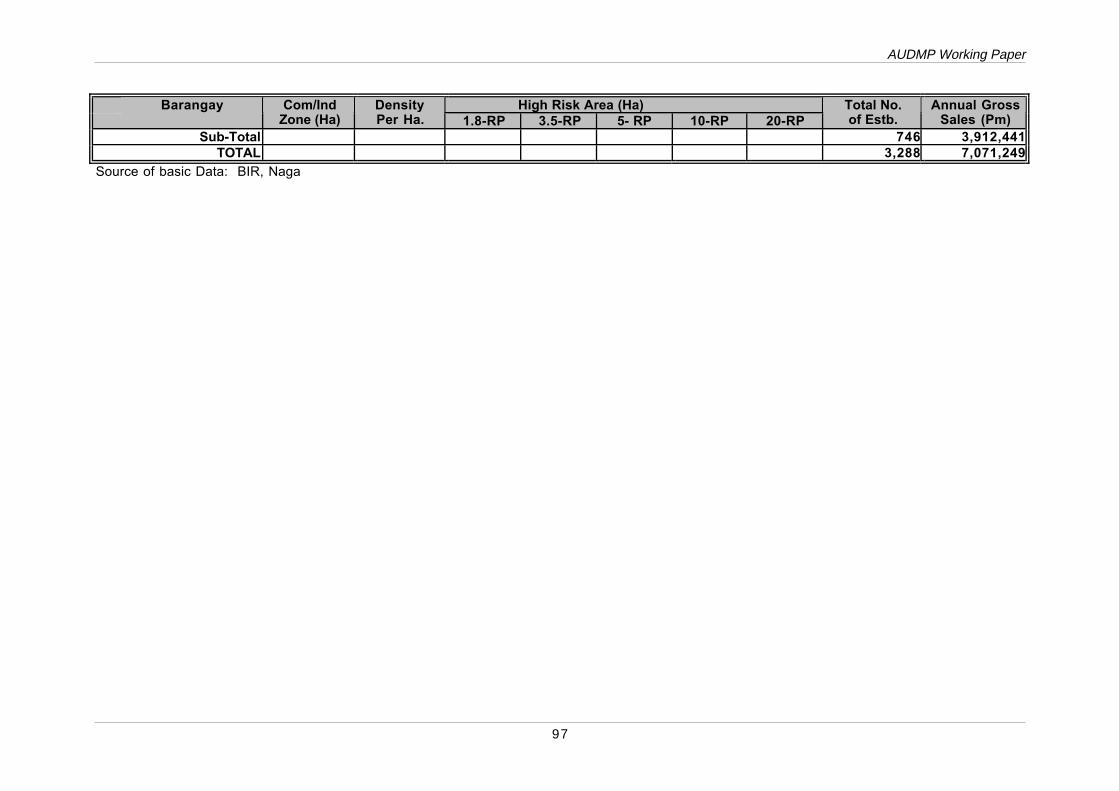
AUDMP Working Paper
97
High Risk Area (Ha)Barangay Com/IndZone (Ha)
DensityPer Ha. 1.8-RP 3.5-RP 5- RP 10-RP 20-RP
Total No.of Estb.
Annual GrossSales (Pm)
Sub-Total 746 3,912,441TOTAL 3,288 7,071,249
Source of basic Data: BIR, Naga
CHAPTER 5
MITIGATION MEASURES AND MANAGEMENT PLAN
5.1 PLANNING ASSUMPTIONS
Based on the risk evaluation, the threat to public health and safety as well as economiclosses can be considerably large. The need therefore for effective and appropriate riskprevention and reduction measures to avert a disaster situation is emphasized.
The formulation of the mitigation and management plan was guided by the results of theseries of meetings and consultations with concerned Officers and key Informants of theCity. One major consultation conducted was a Workshop on the Formulation of DisasterMitigation Strategies held on June 7-8, 1999. The workshop was able to identify gaps onthe current disaster mitigation program implementation, and recommendations ofappropriate mitigation measures to reduce particularly flooding risks to the vulnerablesectors.
The plan takes into consideration the fact that Naga City, due to its geographic location,will still be subjected to typhoon and flooding. The plan was therefore essentiallydesigned to reduce the physical, economic, and social vulnerabilities of thecommunities at risk and the entire Naga area in general. This is envisioned to be attainedthrough strategies and interventions that would effectively control, minimize and preparethe city to handle typhoon and flooding hazards.
A comprehensive and integrated strategy has been adopted to simultaneously address thestructural/physical, policy and institutional concerns for effective mitigation andmanagement of the flooding problems in Naga within the context of resource limitations.Three major program interventions which are interrelated and supportive of each otherhave been identified as follows:
• Physical/Civil Works Development Program• Land Use Policy/Legal Reforms Program• Institutional Development Program
5.2 PHYSICAL/CIVIL WORKS DEVELOPMENT PROGRAM
This program is intended primarily to provide mitigation strategies aimed at reducing thevolume of floodwaters and duration of flooding through structural/physical measures. Theset of proposed measures will protect areas whose flooding is not influenced by the BicolRiver up to a 5-year flood magnitude. The areas affected by the Bicol River flooding willlikewise benefit from improved drainage that will reduce the duration of flooding tocoincide with flood recession time along the Bicol River. The proposed sub-projects underthis program includes the following:
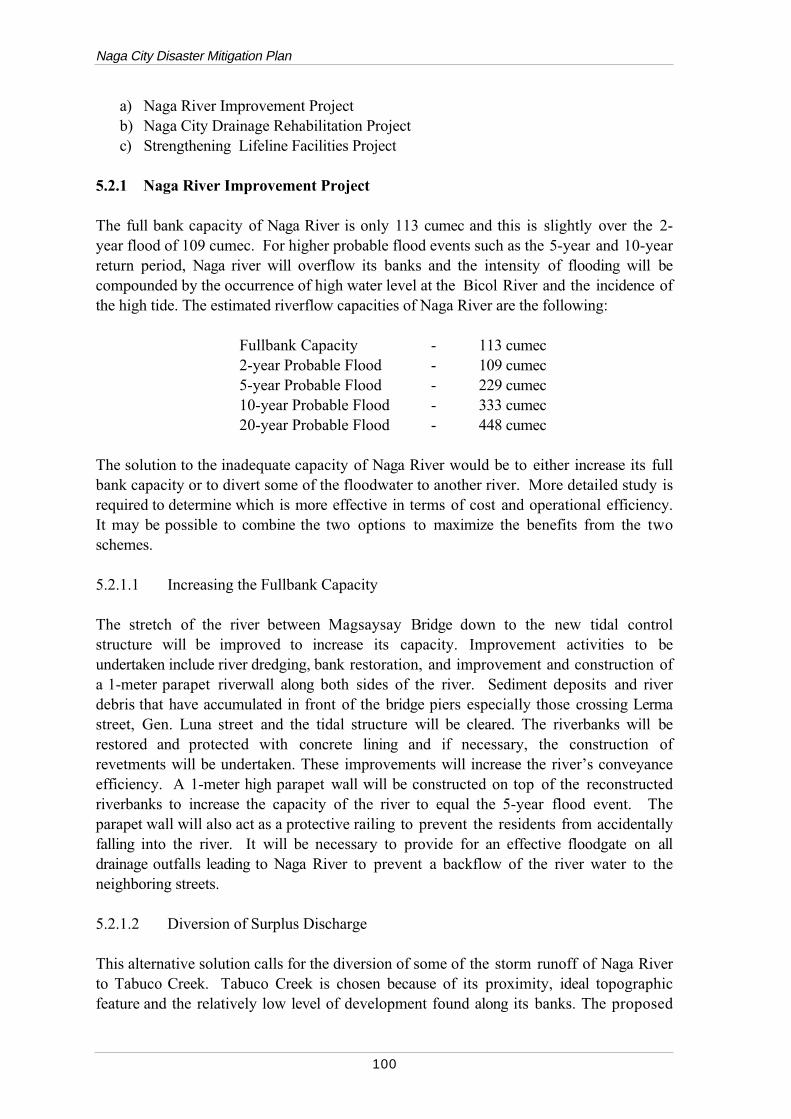
Naga City Disaster Mitigation Plan
100
a) Naga River Improvement Projectb) Naga City Drainage Rehabilitation Projectc) Strengthening Lifeline Facilities Project
5.2.1 Naga River Improvement Project
The full bank capacity of Naga River is only 113 cumec and this is slightly over the 2-year flood of 109 cumec. For higher probable flood events such as the 5-year and 10-yearreturn period, Naga river will overflow its banks and the intensity of flooding will becompounded by the occurrence of high water level at the Bicol River and the incidence ofthe high tide. The estimated riverflow capacities of Naga River are the following:
Fullbank Capacity - 113 cumec2-year Probable Flood - 109 cumec5-year Probable Flood - 229 cumec10-year Probable Flood - 333 cumec20-year Probable Flood - 448 cumec
The solution to the inadequate capacity of Naga River would be to either increase its fullbank capacity or to divert some of the floodwater to another river. More detailed study isrequired to determine which is more effective in terms of cost and operational efficiency.It may be possible to combine the two options to maximize the benefits from the twoschemes.
5.2.1.1 Increasing the Fullbank Capacity
The stretch of the river between Magsaysay Bridge down to the new tidal controlstructure will be improved to increase its capacity. Improvement activities to beundertaken include river dredging, bank restoration, and improvement and construction ofa 1-meter parapet riverwall along both sides of the river. Sediment deposits and riverdebris that have accumulated in front of the bridge piers especially those crossing Lermastreet, Gen. Luna street and the tidal structure will be cleared. The riverbanks will berestored and protected with concrete lining and if necessary, the construction ofrevetments will be undertaken. These improvements will increase the river’s conveyanceefficiency. A 1-meter high parapet wall will be constructed on top of the reconstructedriverbanks to increase the capacity of the river to equal the 5-year flood event. Theparapet wall will also act as a protective railing to prevent the residents from accidentallyfalling into the river. It will be necessary to provide for an effective floodgate on alldrainage outfalls leading to Naga River to prevent a backflow of the river water to theneighboring streets.
5.2.1.2 Diversion of Surplus Discharge
This alternative solution calls for the diversion of some of the storm runoff of Naga Riverto Tabuco Creek. Tabuco Creek is chosen because of its proximity, ideal topographicfeature and the relatively low level of development found along its banks. The proposed
AUDMP Working Paper
101
amount of Naga River flows to be transferred is between 20 to 50 cumec. A pilot channelcan be constructed and gradually allowed to enlarge by controlled erosion to the designedcapacity. The gradual diversion of the flow will give time for Tabuco Creek to adjust itsriver section to accommodate the additional discharge.
Further field investigation is necessary to finalize the location of the proposed diversionchannel. One possible diversion site can be located between Concepcion and Palestinawhich is the nearest point between Tabuco Creek and Pacol River, a tributary of NagaRiver. The identified site is shown in Figure 23.
5.2.1.3 Study of the Naga River Tidal Gate Structure
There are collaborated reports that the tidal gate structure at the mouth of Naga River isimpeding the river flow. It was also observed to have caused an afflux built-up as high as 1meter. Afflux is the difference in the water surface elevations between the upstream anddownstream faces of the piers of a river structure. The presence of the pier will cause thewater level to rise due to the contraction of the river section. In the case of the Naga Citytidal gate structure, the river was divided into 8 bays with a clear width of only 4 meterseach. The many numbers of piers and the narrow clearance can cause the built-up of thewater and this can be compounded with the clogging and blocking of the river by floatingand submerged debris. A 0.5 to 1-meter rise in the water level will result in a significantincrease in the flood affected areas.
A study of the tidal gate structure is necessary to evaluate the effect on the river dischargeand find ways of decreasing the afflux built-up. The problem of the obstruction causedby the river debris will also be studied especially the large ones that are lodged betweenthe piers. The retrofitting of the structure with automated gate lifting equipment needs tobe evaluated for an effective operation.
5.2.1.4 Proposed Replacement of Magsaysay Bridge
Since the Magsaysay Bridge will be replaced soon, it is suggested that a single span bridgebe constructed to remove the possibility of large river debris like tree branches, coconuttrunks and bamboos from blocking the waterway during flood as what happened before.Accordingly, the old center pier should be removed as it will serve no purpose.
5.2.1.5 Naga River Easement Recovery and Improvement Project
Naga City has been implementing projects to improve the easements along Naga River toserve as promenade area or Riverside Park, and viewing deck during the Peñafranciacelebration. However, the undertaking is proving to be difficult due to many factorsincluding the need to relocate the squatter families, right of way problems and fundingconstraints. In this new proposal, only a short stretch will be covered to minimize theproblems encountered in previous attempts and this will serve as a showcasedevelopment to rally community support for its full implementation later. The portion tobe included in the pilot project is from the Magsaysay Bridge to Panganiban Bridge,
Naga City Disaster Mitigation Plan
102
which is generally clear of squatters and right of way problems. The development of theeasement will be planned to include landscaping, lighted walkways, flower gardens,benches and playground, exhibit areas and food kiosks. The existing barangay hall can beintegrated in the overall development plan. The development of the easement areasshould be linked to the Naga River Improvement Project to prevent duplication of workactivities especially on the riverbank portions.
5.2.1.6 Naga River Watershed Reforestation Program.
Another effective way of reducing the intensity of flooding downstream is thepreservation of the watershed of Naga River. The forest retards the movement of waterallowing it to evaporate, be absorbed and percolate into the ground. A good forest canstore substantial amount of storm runoff and gradually release it as groundwater flow.The forest also serves as habitat to wildlife and various fauna species.
There is already an ongoing watershed protection and reforestation project beingundertaken by the Department of Environment and Natural Resources (DENR) and theplanning phase of the project has been reportedly completed. The implementation of theproject is going to be for 9 years.
5.2.2 Naga City Drainage Rehabilitation Program
One of the identified causes of flooding is the poor condition and inadequacy of theexisting drainage system. Naga City is making progress in trying to construct drainagefacilities but it seems that localized flooding continues to be a major problem. Theproposed improvement of the drainage system should consider integrating alternate maindrainage canals to minimize or completely eliminate the discharge of storm runoff intoNaga River thus preventing the backflow from the river. Furthermore, the construction ofthe street drainage facilities was found not systematic and inconsistent in their capacity. The absence of an up-to-date storm drainage masterplan and the rapid changes in the landuse is also making the work difficult for the City Engineer’s office. A storm drainagemasterplan was prepared in 1981. However, this was destroyed during one of the majorfloods that inundated the City Engineer’s office.
5.2.2.1 Comprehensive Storm Drainage Masterplan
To effectively improve and rehabilitate the storm drainage system, it is necessary that amasterplan be prepared. The masterplan will cover the upgrading of the existing drainagesystem and the expansion into unserviced areas and proposed developments. Theadvantage of having as wide area of coverage is to eliminate future problems ofinconsistent drainage capacities and overload of some of the main drains due tounprogrammed developments.
Although the area of coverage is large, implementation of the improvement andrehabilitation can be done by phase or by section but with the assurance that the overallsystem will remain consistent and adequate.
AUDMP Working Paper
103
The masterplan should be done using the latest hydro-dynamic models such as theSWMM and BRANCH computer programs. A geographic information system (GIS) forthe storm drainage system should be set-up to locate and catalogue all the drainagefacilities such as the drainage pipes, manholes, street inlets, outfall and others. The GISwill be helpful in the future repair and maintenance work.
5.2.2.2 Waterway Restoration and Rehabilitation
It has been observed that many of the natural waterways and drainage creeks have beensilted or built-over with illegal structures. It is essential that the existing waterways berecovered and improved. These waterways have high flow capacity and could be used asmain drainage canal for the urban storm drainage system. The waterways should have therequired easement of 3 meters on both banks to serve as buffer during flood and facilitatethe inspection and clearing of any debris and obstructions.
5.2.2.3 Proposed Drainage Interceptor Canals
Some of the low-lying areas are flooded even during moderate rainfall and are evensubjected to prolong inundation due to absence of any natural drainageways. In BarangayTriangulo, a natural waterway draining a low-lying area was blocked by the constructionof a new commercial center. There is also no main drainageway for the low-lying area ofBarangay Sabang. The natural waterway near Abella and Igualdad, and Calauag should beextended to drain these areas. It is, therefore, proposed that the following drainageinterceptor channels be constructed to remove the flood water in the affected communitiesand serve as an alternate main waterways for the smaller lateral placed along the streets.
1. Triangulo- Tabuco Interceptor Canal2. Sabang Waterway Extension Canal3. Abella-Sta. Cruz Interceptor Canal4. Calauag Waterway Extension Canal
5.2.2.4 Naga City Drainage Maintenance Program.
Aside from the proposed improvement of the drainage system, poor maintenance is foundas another reason for the occurrence of localized flooding. The maintenance of thedrainage system is both the responsibility of the barangays and the city engineer's office.The barangay usually conducts inspection of the drainage canals and do regular cleaning ofthe curbs and streets to prevent rubbish from clogging the street inlets. The cityengineer's office handles more serious problems like declogging and desilting of thedrainage pipes, repairs of the drainage facilities and declogging of the main waterways.
There are times when this cooperation is not functioning properly resulting to poordrainage maintenance and eventually flooding. It is necessary to strengthen theestablished cooperation by institutionalizing the function and responsibility of drainagemaintenance work to the concerned units such as the barangays. The barangays will haveto be supported with funds to do the job. Training of the personnel is needed to ensure
Naga City Disaster Mitigation Plan
104
that the maintenance work is properly done or implemented. Furthermore, the barangaysand the city engineer's office need to have the proper tools and equipment to undertakethe maintenance work. An effective reporting and monitoring system also needs to beestablished to coordinate and facilitate the maintenance work of the barangay and the cityengineer’s office.
5.2.3 Strengthening of Lifeline Facilities Program
One of the key concerns of those involved in the emergency response is the condition ofthe lifeline facilities like the evacuation centers, hospitals, communication system, electricpower system and the water supply system. The responsibility of maintaining thesefacilities lies with the different private and government agencies. Some of these facilitiesrequire repair and rehabilitation, which are often times overlooked by the concernedauthorities.
This proposal aims to evaluate the immediate rehabilitation needs of these facilities and tocoordinate with the concerned authorities the implementation of the repairs andimprovement. The scope of work includes the conduct of inventory and inspection of allthe lifeline facilities, evaluation of the repair requirement and cost estimates, coordinationand monitoring of the repairs undertaken. The inspection of the facilities can beconducted jointly with the disaster management office, city engineer's office and theconcerned agencies. A database of the information gathered can be set-up for monitoringand future reference. The concerned offices will prioritize the repair work depending onthe available funds and the other logistic requirement such as technical staff andequipment. A timetable of all the repairs will be prepared to have a clear idea on whichfacilities are available, on standby and non-functional in times of emergencies.
The critical Lifeline Facilities and Infrastructures are shown in Table 20, and their generallocation is shown in Figure 24.
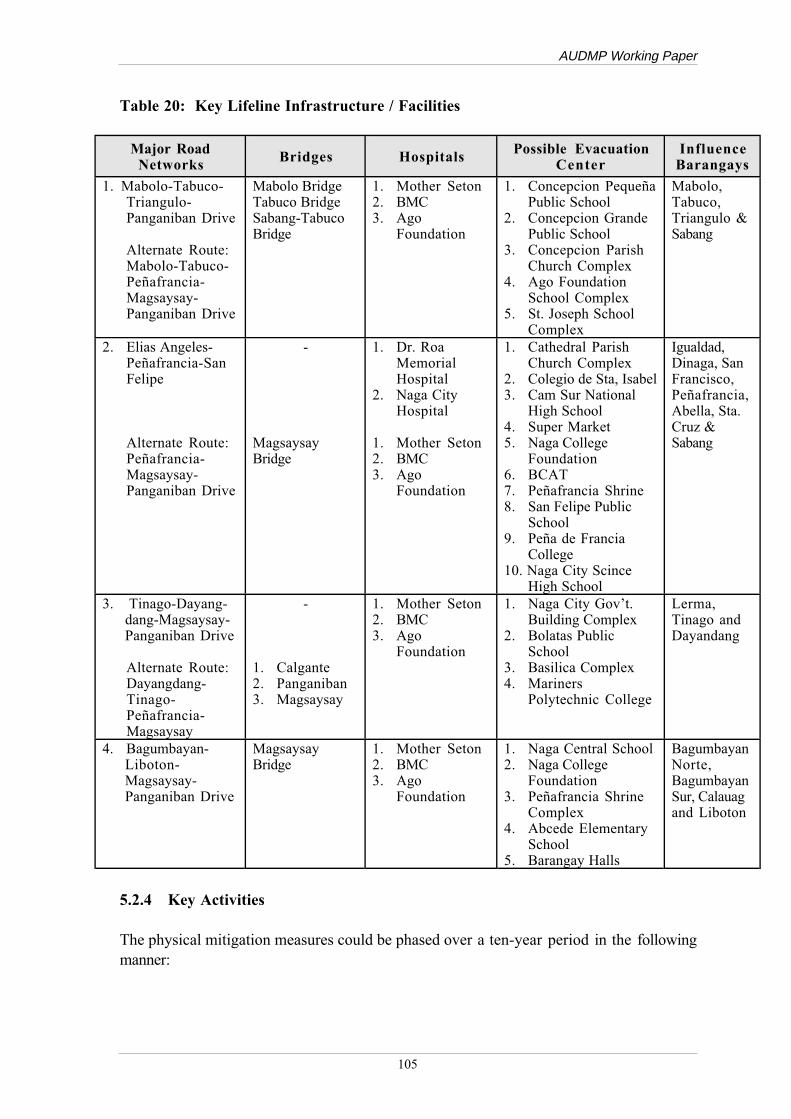
AUDMP Working Paper
105
Table 20: Key Lifeline Infrastructure / Facilities
Major RoadNetworks Bridges Hospitals Possible Evacuation
CenterInfluence
Barangays
1. Mabolo-Tabuco-Triangulo-Panganiban Drive
Alternate Route:Mabolo-Tabuco-Peñafrancia-Magsaysay-Panganiban Drive
Mabolo BridgeTabuco BridgeSabang-TabucoBridge
1. Mother Seton2. BMC3. Ago
Foundation
1. Concepcion PequeñaPublic School
2. Concepcion GrandePublic School
3. Concepcion ParishChurch Complex
4. Ago FoundationSchool Complex
5. St. Joseph SchoolComplex
Mabolo,Tabuco,Triangulo &Sabang
2. Elias Angeles-Peñafrancia-SanFelipe
Alternate Route:Peñafrancia-Magsaysay-Panganiban Drive
-
MagsaysayBridge
1. Dr. RoaMemorialHospital
2. Naga CityHospital
1. Mother Seton2. BMC3. Ago
Foundation
1. Cathedral ParishChurch Complex
2. Colegio de Sta, Isabel3. Cam Sur National
High School4. Super Market5. Naga College
Foundation6. BCAT7. Peñafrancia Shrine8. San Felipe Public
School9. Peña de Francia
College10. Naga City Scince
High School
Igualdad,Dinaga, SanFrancisco,Peñafrancia,Abella, Sta.Cruz &Sabang
3. Tinago-Dayang-dang-Magsaysay-Panganiban Drive
Alternate Route:Dayangdang-Tinago-Peñafrancia-Magsaysay
-
1. Calgante2. Panganiban3. Magsaysay
1. Mother Seton2. BMC3. Ago
Foundation
1. Naga City Gov’t.Building Complex
2. Bolatas PublicSchool
3. Basilica Complex4. Mariners
Polytechnic College
Lerma,Tinago andDayandang
4. Bagumbayan-Liboton-Magsaysay-Panganiban Drive
MagsaysayBridge
1. Mother Seton2. BMC3. Ago
Foundation
1. Naga Central School2. Naga College
Foundation3. Peñafrancia Shrine
Complex4. Abcede Elementary
School5. Barangay Halls
BagumbayanNorte,BagumbayanSur, Calauagand Liboton
5.2.4 Key Activities
The physical mitigation measures could be phased over a ten-year period in the followingmanner:
Naga City Disaster Mitigation Plan
106
• Phase – 1: Immediate implementation of projects already on stream or withapproved funding and requiring only some design modification.
• Phase – 2: Comprehensive Study of Storm Drainage and DetailedArchitectural and Engineering Design of viable project components.
• Phase – 3: Implementation of viable project components.
5.2.4.1 Phase -1 Implementation
This phase would involve most of the components under the Naga River ImprovementProject, with approved funding requiring some modification of design as follows:
i. Magsaysay Bridge Project - The construction of new bridge to replace theexisting Magsaysay Bridge has been funded and ready for implementation afterthe Peñafrancia on September 1999. The City Government should makerepresentation with DPWH to design the bridge with a single span only which isan improvement of the existing bridge with 4 span RCDG bridge.
ii. Naga River Easement Recovery and Improvement Project - The final design ofthis project should integrate the increase of the full bank capacity of the NagaRiver to accommodate the five-year return period flood flows. As a strategy, apilot site will be selected between the stretch of Panganiban and Magsaysaybridges.
iii. Naga River Watershed Reforestation Program
iv. Study of the Naga City Tidal Gate Structure to evaluate its effects on the riverand formulate remedial measures. The City Government should again makerepresentation with the DPWH to conduct the said study in the light of theobserved backwater effects of the said structure.
v. Inventory and evaluation of the identified lifeline facilities and infrastructures forimmediate improvement and rehabilitation by concerned agencies and/or privateinstitutions.
5.2.4.2 Phase - 2 Implementation
This phase would include the preparation of a storm drainage masterplan as the firststage, and the second stage would involve the planning and detailed design of prioritydrainage facilities. These may include the (a) recommended new and improvement ofexisting drainage system, (b) restoration and improvement of existing waterways ornatural drainageways, and (c) construction of the proposed interceptor canals andextension of major waterways to include the proposed diversion of flood discharge toTabuco creek from Pacol River. The estimated duration for this phase is about 24 months.
AUDMP Working Paper
107
5.2.4.3 Phase – 3 Implementation
Implementation of the recommended drainage system, to include the construction of thefollowing:
i. Waterway Restoration and Improvement,
ii. Construction of proposed drainage interceptor canals and extension of majorwaterways, to include the Pacol-Tabuco Diversion Channel,
iii. Construction of new drainage system and upgrading of existing drainage facilitiescovering an area of about 1,000 hectares, and
iv. Implementation of Drainage Maintenance Program.
5.2.5 Estimated Project Cost and Duration
A preliminary cost estimate of the proposed projects has been prepared based on certainassumptions on the scope of work to be undertaken. A more accurate estimate willrequire an investigation that is more detailed and consultation with regards to the mannerof implementation. Nonetheless, the estimated cost and project duration can assist indeciding which among the proposed projects has a good potential and may be urgentlyrequired. Some of the projects are already ongoing like the Naga City WatershedProtection Program while the Naga River Easement Recovery and Improvement Project iscurrently being undertaken but needs to be reformulated into a pilot project. A summaryof implementation plan (i.e., cost and schedule) is presented in Section 5.5.2.
5.3 LAND USE POLICY/LEGAL REFORMS PROGRAM
This program is aimed at introducing refinements and/or changes in the land use planning,policy and pertinent regulations in the existing and planned developments of the city. Theprimary consideration is to rationalize land use decisions and development directionwithin the context of flooding constraints. It provides a short-term and long-termperspective of the alternative options available given practical and political considerations.
5.3.1 An Alternative Naga Land Use Framework
The present Land Use Plan of Naga lacks only the refinements due the perspective of acity that is naturally flood prone. This oversight in appreciating as critically importantthe factoring of the flooding perspective as a primary planning constraint in Naga's landuse planning has led to the flaws described in the preceding sections. Had this primaryconstraint been recognized from the beginning, then hydrological studies would have beenthe first order of the day and the concept of "open spaces" for environmental purposesincluding flood mitigation, would have certainly been prominent in Naga's Land Use Planand Zoning.
Naga City Disaster Mitigation Plan
108
Nevertheless, the present Plan has much strength and exemplifies the solid developmentaldirections of Naga’s leadership. Its expansion of the agricultural districts and forest reserveserases any doubt about the sincerity of the City in addressing environmental issues and foodsecurity.
The following proposed mitigation measures assume that the present plans of Naga onlyneed to be adjusted or re-aligned, albeit in certain cases very significantly, based on agreater consideration of the flooding factor. Thus, the short term options presented belowmerely require at most, a retention of certain features of the 1978 Plan. What issomewhat far-reaching in the change that it sought is the long-term scenario of a newgrowth area in the middle eastern part of Naga's land area.
5.3.1.1 Land Use Mitigation Measures: Options for the Short-Term
Two options are presented. The first option accepts as given a “no change" scenario inthe present Land Use Plan. The recommendations are therefore in the nature of "add-ons"to the Plan including the overlay of a "flood hazard zone" (FHZ), see Figure 25 over 17barangays and a "most vulnerable area" (MVA), see Figure 26, delineation within theFHZ.
The second wills a change back to the land use categories of districts priorly delineated asgreen districts in 1978 but are now categorized as residential or commercial. It is assumedthat the formal conversions of these lands have not yet been executed, considering that thepresent Land Use Plan has not yet been approved by the Housing and Land UseRegulatory Board (HLURB) and thus the 1978 Plan may be interpreted to be technicallystill in effect.
5.3.1.2 The First Option
The first option assumes that the city feels that the option of changing back designatedcommercial or residential areas (mentioned later in Option 2) to "open spaces forenvironmental purposes" or agricultural use, is untenable or political unviable. Thus, therecommended direction here is to make the flooding hazard an omnipresent concern ofzoning and land use controls. It is proposed that:
a) the formal delineation of a Flood Hazard Zone (FHZ) and within the FHZ, aMost Vulnerable Area (MVA) as defined in the physical and hydrologicalstudy report be provided. The FHZ shall define a special zone within which aflood mitigation and support system shall be operative. Within the MVA, aspecial sub-system of regulations shall be established.
The FHZ is proposed to cover the following Barangays:
1) Abella2) Sta. Cruz3) Liboton
AUDMP Working Paper
109
4) Sabang5) San Francisco6) Calauag7) Mabolo8) Bagumbayan Sur9) Peñafrancia10) Triangulo11) Bagumbayan Norte12) Tabuco13) Tinago14) Dinaga15) Igualdad16) Lerma17) Dayangdang
Within this zone, the MVA is proposed to constitute the severely flooded sub-areas of the following barangays:
Sabang, Igualdad, Abella, Lerma, Tinago, Triangulo, Sta. Cruz, Calauag,Dayangdang, Liboton and Peñafrancia as delineated by the 1.8-year return periodinundation map, see Table 21 showing the area per barangay under severe flooding.
The FHZ shall immediately be the subject of a comprehensive drainage study forthe purpose of generating the detailed design for a comprehensive drainage systemlinking together natural processes and the natural drainage system available withthe technical infrastructure, both present and planned for construction. Thisshould entail a trace of the historical natural drainage system and the prospect ofeconomically restoring all or part of the natural system. The results of the studyshall be explicitly utilized in adjusting land use delineation and enhancing zoningregulations within the FHZ.
b) The Revised Comprehensive Zoning Ordinance of Naga City should beamended to include the FHZ and the MVA. All relevant Articles andSections in the Ordinance should cover the FHZ and MVA subject to therecommendation of the appropriate body (i.e., the Naga City DisasterManagement Board if this is established or the current Naga City DisasterMitigation Council or whichever body as appropriate). However, thefollowing particular policies should be implemented within the FHZ:
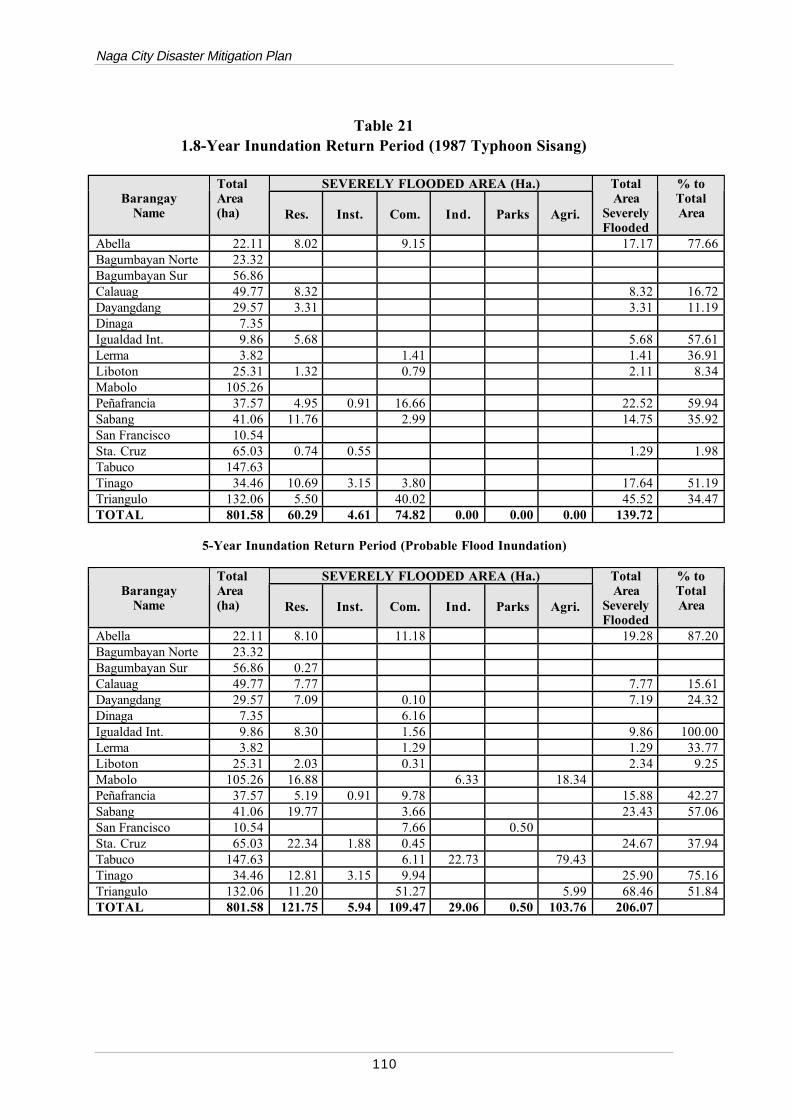
Naga City Disaster Mitigation Plan
110
Table 211.8-Year Inundation Return Period (1987 Typhoon Sisang)
SEVERELY FLOODED AREA (Ha.)Barangay
Name
TotalArea(ha) Res. Inst. Com. Ind. Parks Agri.
TotalArea
SeverelyFlooded
% toTotalArea
Abella 22.11 8.02 9.15 17.17 77.66Bagumbayan Norte 23.32Bagumbayan Sur 56.86Calauag 49.77 8.32 8.32 16.72Dayangdang 29.57 3.31 3.31 11.19Dinaga 7.35Igualdad Int. 9.86 5.68 5.68 57.61Lerma 3.82 1.41 1.41 36.91Liboton 25.31 1.32 0.79 2.11 8.34Mabolo 105.26Peñafrancia 37.57 4.95 0.91 16.66 22.52 59.94Sabang 41.06 11.76 2.99 14.75 35.92San Francisco 10.54Sta. Cruz 65.03 0.74 0.55 1.29 1.98Tabuco 147.63Tinago 34.46 10.69 3.15 3.80 17.64 51.19Triangulo 132.06 5.50 40.02 45.52 34.47TOTAL 801.58 60.29 4.61 74.82 0.00 0.00 0.00 139.72
5-Year Inundation Return Period (Probable Flood Inundation)
SEVERELY FLOODED AREA (Ha.)Barangay
Name
TotalArea(ha) Res. Inst. Com. Ind. Parks Agri.
TotalArea
SeverelyFlooded
% toTotalArea
Abella 22.11 8.10 11.18 19.28 87.20Bagumbayan Norte 23.32Bagumbayan Sur 56.86 0.27Calauag 49.77 7.77 7.77 15.61Dayangdang 29.57 7.09 0.10 7.19 24.32Dinaga 7.35 6.16Igualdad Int. 9.86 8.30 1.56 9.86 100.00Lerma 3.82 1.29 1.29 33.77Liboton 25.31 2.03 0.31 2.34 9.25Mabolo 105.26 16.88 6.33 18.34Peñafrancia 37.57 5.19 0.91 9.78 15.88 42.27Sabang 41.06 19.77 3.66 23.43 57.06San Francisco 10.54 7.66 0.50Sta. Cruz 65.03 22.34 1.88 0.45 24.67 37.94Tabuco 147.63 6.11 22.73 79.43Tinago 34.46 12.81 3.15 9.94 25.90 75.16Triangulo 132.06 11.20 51.27 5.99 68.46 51.84TOTAL 801.58 121.75 5.94 109.47 29.06 0.50 103.76 206.07
AUDMP Working Paper
111
i. Strict and continuing enforcement of current land use controlsparticularly on:
• River and stream development management measures including the3-meter riverbank easement regulation,
• Solid waste disposal measures, and
• Environmental management standards.
ii. The following measures should be inserted as an amendment or addedprovision in the current zoning ordinance:
• Industrial and commercial waste shall be disposed of byestablishments in accordance with the system and procedure to belaid by the city for all commercial and industrial establishmentswithin the FHZ;
• Sewage disposal shall be disposed of in strict accordance withparagraph g, Section 24, ARTICLE V of City Ordinance 98-076(Series of 1994).
• Any development or activity requiring any major construction shallpriorly secure the approval of the City. For this, the proponentshall submit to the City his/her plans for development andconstruction complying with the standards of the City's buildingcode and other specific standards within the FHZ. An initialenvironmental examination report or an environmental impactstatement, should the former not suffice, should be submitted forthe City's review and concurrence.
• Strict compliance with Section 26, ARTICLE VI of the ZoningOrdinance.
c) Greater detailing of performance and safety standards on flooding toinclude:
i. Specific drainage requirements;
ii. Flooding safeguards particularly in institutional facilities for children,the aged and the sick;
iii. Life saving equipment including generators should be placed wherethey shall be unaffected by flood waters; and
Naga City Disaster Mitigation Plan
112
iv. Life support systems in hospitals and emergency clinics should haveprovisions for quick evacuation and reinstallation in higher floors,secure from rising floodwaters.
d) Promotion of compatible uses or projects on privately-owned vacant lotsor agricultural districts that could be ideally reserved for open spaces buthave already been converted from agricultural to urban use:
i. the drawing up of incentives for compatible theme parks, other "green"recreational use projects, re-conversion to agricultural use,
ii. swap arrangement with land acquired by the city in the far Eastern partof Naga, and
iii. joint venture in compatible projects between the city government andprivate owners, etc.
e) Strict evaluation, including a mandatory ocular site inspection, of buildingconstruction plans and the issuance of building permits only uponcomplete adherence to building standards.
i. The system should include a specific clearance from the relevantBarangay that the community accepts that no flooding effect shallensue from the construction. This should be included as part of therequirements for the issuance of building permits.
ii. Additionally, there shall be a mandatory ocular inspection of thecompleted building ascertaining that all standards have been properlymet.
iii. Landfilling standards* shall be provided and strictly followed.
f) The Most Vulnerable Area or MVA should, in addition to all the foregoing,be subject to the following policies:
i. a requirement for private developers to undertake the installation ofdrainage systems in their residential or commercial projects that areintegrated in the city system and strictly conform with city standards;a specific drainage clearance procedure to the effect that the desireddrainage system has been installed shall form part of this system;
ii. no conversion rule for all land use categories, except for one exemptiononly - if the conversion is towards the use for open space forenvironmental purposes, agriculture, public park, low densityinstitutional use or "green" recreational use such as environmentaltheme parks featuring ponds or lakes for boating, swimming, etc.;
AUDMP Working Paper
113
iii. deletion of provisions that allow livestock and poultry raising; and
iv. deletion of provisions that allow the establishment of additionaltertiary level medical facilities, elementary schools, childcare facilities,senior citizen facilities and the like, within the MVA;
g) The following violation and penalty clause should be added as a secondparagraph to SECTION 61 of the Zoning Ordinance:
"...Provided THAT any person or juridical person or persons who violate anyof the provisions of the Ordinance as it pertains to the Flooding Hazard Zoneor the Most Vulnerable Area, shall, be punished by a fine of Ten ThousandPesos (P10,000.00) or an imprisonment of one year, or both, at the discretionof the court; Provided Further THAT, in the case of the first offense, theperson or persons shall be punished with a fine of Three Thousand Pesos(P3,000.00) or imprisonment of six months, or both, at the discretion of thecourt."
h) Impose a special levy* called the Naga flood tax in the FHZ to fund itsprograms.
The rationale for a special annual levy on establishments and residences within theFHZ is that the city will pay great amounts for mitigating floods within the FHZ.Flooding related studies, construction of sophisticated drainage systems,establishment and maintenance of a flood mitigation, disaster preparedness andmanagement system, not to mention the direct costs of rescue and relief operationswithin the FHZ, entail tremendous budgetary outlays. To draw the funding for thisfrom all taxpayers is to effectively penalize those who do not need all these measuresbecause they had the foresight or took the decision to locate or move away from theFHZ. Hence, the rationale is simply to make those who are benefited by cityactivities for the FHZ pay for those benefits.
This measure will also force residents to mull the economy of living within the FHZboth in the case of those already there and those thinking of moving into the FHZ. Inthe end, it might be economical only for those conducting business within the FHZ tostay on. The out-migration of residential dwellers within the FHZ is desirable andneed only to have their movement guided towards the desired places within Naga'sdesired urban framework.
5.3.1.3 The Second Option
This option essentially asserts that an environmental study needs to be done on the landslong assumed water catchment areas or natural drainage basins or aquifer recharge areas.These had formerly been designated agricultural districts in 1978 but some were actuallyseasonally "vacant" areas. Today they have been designated as either commercial or
Naga City Disaster Mitigation Plan
114
residential districts and, therefore, just waiting for conversion to such use. In addition tothis, it proposes certain directions in the amendment of the current zoning rules, and thepromotion of certain undertakings.Specifically the Second Option proposes the following sets of actions:
a) The retention of the remaining open areas reserved for agricultural use inthe 1978 Land Use Plan as areas reserved for "open spaces forenvironmental preserves" or agriculture or "green" use subject to anenvironmental study* of its final land use to be completed within one year.Should the study conclude the areas to be environmentally sensitive andneed to be reserved, this reserve classification could include a variance inuse. If feasible in the study conclusions that compatible recreational usecould be allowed, this should be subject to approval by the City Mayorupon the recommendation of the city's Planning and Development Office;
The lands referred to include the following:
i. the erstwhile "agricultural" area straddling the boundaries of Calauag,Liboton and San Felipe;
ii. the vacant Sabang area, directly northwest of the junction of theBicol and Naga rivers near the barangay boundary with Igualdad;
iii. the still undeveloped portions of the CBD II area in Triangulo;
iv. the Mabolo area; and
v. the Tabuco and Triangulo areas on the southern side of the diversionroad beyond the current strip of development along the southern sideof the said road.
b) Implement all sets of actions of the First Option.
5.3.1.4 Other Measures Common to Both OptionsThe following proposed strategies are indifferent to whichever option for short-term floodmitigation is chosen. These proposed measures should be undertaken under any option.
a) Alternative Kaantabay sa Kauswagan Approach
Current efforts at providing housing for the urban poor must consider floodingvulnerability. Current "on-site relocation" programs within the FHZ cannot butbe viewed as undesirable. First, considerable sums must be paid by Nagataxpayers for the acquisition of relatively expensive land for on-site demands ofthe urban poor. Second, the same taxpayers will have to pay added large amountsfor more sophisticated drainage systems in the "on-site relocation” areas withinthe flood hazard zone. Thirdly, Naga taxpayers will again pay for the incremental
AUDMP Working Paper
115
portion of the flood mitigation and disaster preparedness systems specificallyaddressed to the urban poor. Finally, taxpayers will have to let go of even moremoney to pay for the maintenance of all of those. All these costs may be difficultto be perceived as equitable by Naga's taxpayers if in fact there are other locationsless expensive to acquire, develop and maintain.
In fact, the urban poor of Naga may be assisted by way of housing and livelihoodoutside of the FHZ. This can be done via the acquisition of relocation sites in theCararayan - Carolina area within easy reach of the agro-industrial cluster in SanIsidro. The cluster can be an immediate provider of employment opportunities forthe urban poor. The City can also encourage other (non-pollutive) agro-industrialor commercial activities within the area pointing to the urban poor relocation sitesas ready labor pools. Since the lands are still relatively less expensive than withinthe present urban core of Naga, the City can acquire more lands and have moredevelopment funds if it acquires lands for urban poor programs in the said areasrather than in the present urban built up areas. The areas to be acquired anddesignated for the urban poor may be priorly identified through planning.
For existing "on-site" urban poor relocation and development programs, a majoreffort to persuade them to relocate in higher areas should be done. Included in thisapproach should be the discontinuance of further investments in "on-site"relocation programs and the withdrawal of financial or economic incentives andany type of support for proposed sites. These measures are needed to reinforceefforts in persuading the concerned groups to relocate in the sites suggested herein.Otherwise, the prospect of the urban families "selling out" or disposing of theirdesignated residences within the FHZ should be anticipated and planned for. Thepolicy should be to repossess these sites from leaving urban poor families andreserved them for institutional use or as open spaces, if feasible.
b) Land Use Planning and Monitoring Capability Building
There should be established within the City staff a sustainable land use planningand monitoring capacity to enable the appropriate updating of the Land Use andZoning Plans, Rules and Regulations and effectively monitor compliance with suchas well as check deviations from those plans and rules. Initial activities should be:
i. specific HRD needs analysis for relevant offices within the Cityorganization;
ii. orientation briefing/seminar for a) Sanggunian and Executive Officials ofCity, and b) CPDO, Engineering Office, other relevant Office staff e.g.,at the School of Urban and Regional Planning, UP;
iii. intensive certificate course training e.g., at the SURP, UP, in Land UsePlanning;
Naga City Disaster Mitigation Plan
116
c) Citywide Awareness Campaign on Zoning and Flood Mitigation*
A crucial component for the effectivity of flood mitigation measures is a sustainedcitywide awareness campaign. This is specially critical for all sectors residing ordoing business in the FHZ and all government agencies and instrumentalities,including non-government organizations, that have to do with flood mitigation andflood preparedness and disaster management.
The specific approach that has been proffered is to harness the public servicecomponent of local media for the mass media component of the awareness campaign.Corrolarily, government agencies as well as civic organizations could be persuaded orinduced and mobilized without cost or at least cost for the effort. In the latter case,Memoranda - Agreements could be forged with the said organizations for theaforementioned purpose.
d) Incentive systems for medium rise buildings within the FHZ.
Conditioned on the technical feasibility and strict conformity with all otherstandards for safe and secure buildings, as well as all other rules and regulationswithin the FHZ particularly zoning provisions, an incentive system for the use ofmedium rise housing or commercial buildings within the built up area of the FHZshould be provided.
5.3.2 A Long Term Perspective: An Alternative Growth Center.
Hydrological analyses indicate that a simple drainage system rationalization scenario willreduce localized flooding and mitigate flooding within the 1.8- to 3.5-year return periodbut longer return period floods will continue to affect the BUA (Built-Up Area), seeFigure 27, and CBD, sometimes severely. In a long-term scenario, however, the full-scaleflood reduction infrastructure program involving the rationalization of the drainage systemand the construction of dikes and revetments will simply be prohibitive for Nagataxpayers.
Moreover, any land use planning exercise for the current built-up area of Naga city willinvariably meet with a fixed constraint: the urban area's room for expansion is nowextremely limited. In fact, earlier discussions seem to indicate that at least as far asresidential areas are concerned, it may be nearing its limits, if it has not already reached ityet.
The agricultural lands below Bagumbayan Sur in the north and before ConcepcionPequena in the east that current city planners included as expansion zones for commercialor residential uses have acted as natural water catchment depressions. There are similardepressions in Sta.Cruz, Igualdad Interior, Sabang, part of Mabulo and Tabuco, Trianguloand Tinago. Those have long acted as natural floodwater catchment and soil infiltrationareas which should ideally be conservation areas where, if at all, only compatiblerecreational or institutional facilities should exist. The agenda should be to protect the
AUDMP Working Paper
117
natural processes in these areas which are very vulnerable to urbanization. Since theoutright elimination of these natural processes might generate in their place hazards thatpose danger to urban populations and activities, care must be exercised to conclusivelydetermine the nature of these lands before final land use classification is made.
Further building up in the aforementioned areas will in any case generate much moresophisticated drainage requirements that the natural and technical drainage systems canmeet. The failure here might result in seriously compounding flooding during typhoons.Other considerations such as the increase in health hazards stemming from contaminationof water supply systems, the over extraction of ground water aquifers due to heaviersupply requirements, and the propensity for greater pollution to the Naga and Bicol riversystems, can not be overlooked.
Particular attention is focused on the CBD II transition area, which cannot but bedescribed as unideally located. It is a cardinal land use planning rule NOT to locate anyurban transition area and more so a CBD transition area, in a hazard area, or within highlyvulnerable natural systems, or in land needed for catchment area for water supplyreservoirs. If this CBD II project will be completely pushed through, then care must betaken to install a drainage system that will not only secure the particular area fromflooding but will ensure that the flood waters are not merely transferred to adjacent areas.
The promotion of strip development along the Cararayan road and, parallel to it, a widerstrip development along the Panganiban - Del Rosario corridor could eventually result inuncontrolled growth that will join both strips to form an urban swath from theDayangdang/Tinago/Triangulo area of Naga going East all along up to the lower Cararayanand San Isidro areas. This alignment of the built up area would run counter to the naturalflow of rainwater from the higher areas of Naga. Where formerly rainwater infiltrated intothe agricultural soils in Balatas, Concepcion Grande and Cararayan, it would now meetwith concrete and compacted soil and therefore run rapidly towards the urban areas. Theprobability is this would exacerbate the flooding problem of Naga’s built up area.
5.3.2.1 The Alternative Growth Center
Following the aforementioned limitations on the city's urban growth, there is a real need todelineate urban transition areas in the only direction where there is still an abundance ofsuitable land - the Eastern portion of Naga. Indeed, the planned Cararayan residentialstrip development and the Panganiban-Del Rosario development corridor correspond tocurrent land use trends East of the built-up area. But considering the undesirableorientation of the proposed strip and corridor development as far as the sensitive floodwater runoff is concerned, what is proposed as an alternative is the development of anurban transition growth zone farther to the East in the very middle part of Naga's landarea. This area is centered along the road that runs perpendicular to the Northern Carolinaroad going down straight South to San Isidro.
This location is proposed for urban growth transition for the following reasons:
Naga City Disaster Mitigation Plan
118
a) It will allow a "greenbelt", from the top of San Felipe and Pacol going South inan arc to Concepcion Grande then connecting to the Tabuco ricelands, that willact as a buffer between the flood prone urban area and the new growth area.This buffer will act as a braking mechanism for rainwaters running off thegrowth area and constitute natural soil infiltration areas for both absorbingrainwaters and recharging ground aquifers. This "greenbelt" is feasible over theshort- to medium-term since most of the areas covered by the "greenbelt" areeither irrigated lands non-convertible in accordance with food security rules orlands covered by CARP and therefore similarly protected against conversionby law. The land use category of open space or agricultural use will seal thefeasibility of this "greenbelt" for at least the next five (5) years.
b) The new growth area will be entirely flood hazard free (although typhoonwind vulnerability will remain a problem). While the area is mostly privatelyowned, it is proposed that urban design commence in the area adopting theapproach of induced planned development through planned infrastructuredevelopment, firm land use controls, and participatory law enforcement.The frame for a viable circulation network is already appearing. Current roadarteries in the area show that it is conceivable to look at a growth center withaccess to "primary" Naga, Pili, Magarao, Calabanga and even Goa via Mt.Isarog. Plans for another diversion through Tabuco skirting Panganiban couldeasily link this proposed growth area directly to the Pan Philippine highwaytowards Manila.
5.3.2.2 Incremental Development Approach.
Given the policy decision to locate an urban growth transition area in the middle portionof Naga's land area, specifically in the Carolina area close to its boundaries with Pacol andCararayan, then a strategy of incremental implementation based on an induceddevelopment approach can be implemented. This means that from the outset, two factsare assumed: 1) the city cannot afford a huge capital outlay for a singular, large-scale "onetime project"; and 2) the city does not control the area since most of it is privately ownedand thus the city must rely on effective utilization of its persuasive and inducingresources. Additionally, a comprehensive plan for the growth area should be formulatedand adopted.
Given these, the strategy requires a part by part implementation of the plan orincremental implementation over time. The time frame for such should also be determinedby the comprehensive plan for the growth area. A crucial factor here will be the correctsequence of implementation to allow maximum cooperation, participation and entry of theprivate sector even on the basis of a pure private sector self interest. Once this sequenceis achieved, a "critical mass" of urban functions could be reached. At this point, ademonstration effect is generated through the reality of vibrant and progressiveurbanization process that shall be seen as the growth area having developed past thethreshold of reversal. Then it will simply be natural for investors to invest and forfamilies to reside in the growth area.
AUDMP Working Paper
119
It is, therefore, crucial that particularly in the initial period, land speculators are effectivelydissuaded from the proposed area. It is the investors who will build and operate, and familieswho will buy lots, build their homes on them and reside in them, who should be persuaded orinduced into the urban growth transition area. It is imperative that speculative investment iseffectively arrested if the growth area is to be realized. The city should exercise a will thatwill firmly and loudly say: We do not want mere speculators! Towards this, the city needs towield its "persuasive" and inducement powers - land use controls and zoning regulations,taxing powers, mobilization of development allies such as clergy, civic organizations etc. -very effectively.
5.3.2.3 Kaantabay sa Kauswagan Clusters in the Growth Area
We should approach the urban poor "off- site relocation" projects as a direct componentfor developing the urban growth area. Hence, not only should they be planned asresidential communities but places for work or livelihood as well. Moreover, planningshould also provide for lifeline and community facilities including schools and small scaleopen space and promote the inducements for locating within the cluster, local shoppingand recreational facilities. Community facilities should include police and fire stations,water and sewage plants, and terminals. Such facilities should be located to be convenientto specific user groups, economic for construction and of sufficient size to accommodatefuture expansion. Sources for future water supplies should be delineated and controlled toprotect watersheds and groundwater aquifers.
It had been earlier pointed out that the San Isidro area that is to be part of the proposedNaga’s urban growth transition zone is the designated site for agro-industrialdevelopment. It will therefore be a zone devoted to employment in manufacturing,wholesale trade, office and service industries. Kaantabay projects could be located nearthis zone in convenient proximity to where transit and thoroughfares can ensure easyaccess. The circulation system can be planned to be convenient to other work areas aswell as regional highways and public transportation. The system should be located awayfrom vulnerable environmental systems and distributed in such a manner as to minimizeconcentrations of air pollution.
5.3.2.4 Urban Growth Area Planning
Beyond the Kaantabay activity, the proposed urban growth area needs to becomprehensively studied and planned as already stated. Following are some proposedcomponents for such an undertaking:
a) Incentives
A promotion package with substantial incentives should be ordained for pursuingdevelopment in the new urban growth area (call it the Eastern Growth Area)following a system where the earliest takers get the most incentives. Plannedresidential, commercial and institutional sites should be buffered by green zones,
Naga City Disaster Mitigation Plan
120
should be adequate in size and should be economical to develop by both the publicand the private sector.
b) Anti-flooding
Needless to say an anti-flooding system with comprehensive measures to ensurethe correct orientation of the drainage system such that it does not, over time andunder any scenario, lead to compounding the flooding problems downstream, mustbe developed. Very strict measures of zoning and building regulations in the urbangrowth area should be established. Such rules and regulation should also coverwaste disposal concerns. Stream zones should be necessary and strict laws onprotecting the stream ecology should be established.
c) Transportation Planning
Planning for the transportation system should be towards a safe, energy-efficient,comfortable, convenient and multi-modal, if the urban complex is large enough. Itshould relate to the interregional highway, rail, and air transportation systems andlocated to serve but not disrupt work areas and shopping-entertainment-culturalcenters. Corridors for utilities and pipelines should be provided.
d) "Green" Concerns
The forest reservation in Panicuason at the foothills of Mt. Isarog should beexpanded westward to include a large portion of Carolina. This would insulate theMt. Isarog watershed from the greed of "carpetbagger" type real estate developersmarauding eastward once the Eastern Growth Area accumulates an urban mass ofits own.
Agricultural areas, prime forest lands and natural systems, major parks and largeopen spaces should be reserved in locations that take advantage of, as well asprotect, natural processes, vulnerable environments, and unusual natural features.They could also function to provide a variety of recreation opportunities. Mostdevelopment should be kept away from environmentally hazardous areas such asfault lines, steep slopes susceptible to sliding and unstable soils. Low-densitydevelopment using on-site sewage treatment should be prohibited from areas ofunsuitable soils. Present and future water supply watershed areas should berestricted to development except those compatible with protection of waterquality.
e) Open Spaces and Environmental Zones
Open space is recommended to be addressed first. This is a broad land usecategory that includes environmental processes (e.g., hydrology), hazards to urbandevelopment (e.g., floodplains), environmental resources (e.g., prime agriculturalland and gravel deposits), cultural resources (e.g., historic sites), regional outdoor
AUDMP Working Paper
121
recreation sites and areas where open space serves esthetic purposes (e.g., definingthe edge of the neighborhood or providing foreground with skyline view). Openspaces could be located to provide definition to neighborhoods as well as tomoderate climate, noise, light, and air pollution.
In this particular instance, there is a unique basis for focusing on open spaces first.For one thing, the flooding perspective particularly the vulnerability ofcompounding flooding problems in the "original" urban area requires a prioranalyses of open spaces. Requirements for natural processes are less flexible thanrequirements for most urban uses; natural processes must occur where conditionspermit and are not viable in different locations. Technical solutions, after the fact,to environmental problems are becoming increasingly costly and inefficient, andthey are often ineffective. It is wiser to anticipate and avoid such problemsthrough land use design.
Another reason for designating open space first is that the market orientedspontaneous urban growth process does not provide sufficient open space in theright locations for environmental and recreational purposes. Thus, open space,particularly open space for natural processes, is vulnerable in the market-determined process.
f) Specific Location Standards
Explicit standards can add meaning and usefulness to general principles.Convenient proximity or easy access is converted to a specific distance, measuredin meters or kilometers or travel time; e.g., half-kilometer service area for aneighborhood park. Adequate size might be converted to a specific number ofhectares. For instance 1,500 square meters for a standard community park servingper 10,000 population. Standards can be mapped more precisely than principlesand thus will provide a clearer basis for suitability analysis. They can also beassessed more easily to determine whether policy is being followed.
Standards can be established by ordinance. They typically take the form ofminimum standards necessary to protect public health, safety, and general welfare.Minimum standards are particularly useful for land use regulations. Planningshould further disaggregate the broad categories as plans and policies are refined.For example, open space for environmental protection might be distinguished fromopen space for recreational purposes.
g) Space Requirements and Carrying Capacity
The basis for space requirements are projections of populations and employment.Studies of the densities of present and projected development, and policies aboutthe future character of development, e.g. the mix of housing types and densities, allthese need to be assessed.
Naga City Disaster Mitigation Plan
122
Carrying capacity also called the analysis of holding capacity essentiallydetermines the available land supply in non-urban uses (e.g., agricultural uses),vacant land, and developed land slated for clearance or substantial rehabilitation.The number of hectares available is summarized for each barangay at each level ofsuitability. Based on the standards for space consumption developed under spaceneeds, the suitable hectarage can be converted to an equivalent number ofdwellings, population, or number of employees.
5.3.2.5 The Metro Naga Dimension
Shortages of suitable land might cause the planner to relax the standard of suitability,allow for greater densities, expand the planning area or reduce the levels of population,employment, and other activities planned for the area. In the case of Naga, it is certainthat even with the creation of an Eastern Growth Area, more space will eventually berequired for the ever compelling population and human activities’ space requirement. Theprospects in a Metro Naga conurbation or a circumferential or nodal development patterninvolving municipalities proximate to Naga, therefore, cannot but be explored.
It is, hence, recommended that the Metro-Naga dimension be already seriously studiedand recommendations based on its prospects presented. This will help delineate thoseareas where new urban development should be encouraged in contiguous, neighboringmunicipalities. Land use design can be aided by the appreciation of the regionalperspective. Regionally oriented urban land uses and facilities may even be delineated.
Anticipating an Objection
One may comment that why create a growth area in the very area that is still green today. Such a project will only result in the "de-greening" of the area.
In the first place, development and growth will most certainly reach the upper eastern reachesof Naga. Even today, resorts and subdivisions have already made their inroads in the area.The rise in land values is a sure sign that real estate developers have started speculating on thearea. The present Land Use Map already designates residential districts in the uppermostportions (Carolina) and an agro-industrial district in the lower portion (San Isidro). It iscertain that over time, urbanization will creep or burst into the area. The only question ishow.
A decision to plan the Eastern Growth Area could provide order to that march ofurbanization and ensure the environmental integrity of the whole of Naga.
5.4 INSTITUTIONAL DEVELOPMENT PROGRAM
The institutional development program intends to mobilize and harmonize governmentand community resources and capabilities towards a cohesive and participatory approachfor disaster preparedness. Building on existing initiatives, it seeks to encourage greater
AUDMP Working Paper
123
awareness and cooperation by the broad sector of society to provide direction andsustained effort for disaster management.
5.4.1 Establishment of A Flood Database System for Naga
While there exists today some information on occurrence and effects of typhoon/floodingin Naga from various local government offices and national agencies, there are certain datagaps, duplications and problems in effectively utilizing and communicating suchinformation.
Given the limitation of the existing information on typhoon/flooding, there is a pressingneed to establish a coordinated database system that would regularly provide updatedinformation on important technical, social and economic parameters relevant to effectivedisaster planning, response and monitoring. The proposed database system will provide ahistorical database that would measure changes overtime, both in terms of the physicaland socioeconomic environment, arising from measures implemented or from inability toact on recommended measures. Moreover, such database will input in the formulation ofinformation materials to increase community awareness and solicit broad support forproposed mitigation measures.
5.4.1.1 Scope of the Flood Database System
The proposed database system will provide for the design and establishment of a datacollection system, processing and communication of results. It will comprise of threemajor components that include the following:
• Technical data• Flood damage data• Computer-Based Mapping and Information System (GIS)
5.4.1.2 Technical Database
This component will address specifically the improvements and gaps in technicalinformation and analysis directly relating to meteorological data, such as weatherprediction, rainfall/wind data, flood water measurements (through establishment ofgauging stations), river characteristics and flow measurements, etc.. These data willprovide inputs to determine flood magnitudes, causes and appropriate design or validationof structural measures.
Naga City Flood Forecasting System
It will be a great advantage if the authorities concerned are able to predict when and wherethe disaster will happen so that emergency measures can be implemented in advance. Ineffect, that will save lives and minimize damage to properties. In the case of the floodingof Naga City, it is possible to establish a flood forecasting system that can provideadvance information on the depth, extent and duration of flood. A flood forecasting
Naga City Disaster Mitigation Plan
124
system has already been set-up for the Bicol river basin by PAGASA. However, thePAGASA system seems to be not fully functional or operational since it is not providingany quantitative predictions on the water level of the Bicol River.
The proposed flood forecasting project for Naga City would include the establishment ofa real time hydromet and flood monitoring network, development of a flood forecastingmodel and training of city and PAGASA staff in the operation and maintenance of thesystem. The hydromet and flood monitoring network will include automatic rainfall andriver water level gauges connected to a telemetry system that will provide continuousmeasurements on real time. A flood-forecasting model will be set-up to convert theinformation gathered into predicted river discharges and water levels. The model will beprobably a combination of a catchment model and hydrologic or hydraulic routing model.The forecasting model will also use the data collected by PAGASA from its own floodforecasting system to include the influence of Bicol River to the Naga River system. Theforecasting model could also be expanded to make predictions on the water levels in keylocations in the different barangays for use in the emergency response and disastermanagement.
Community-Based Flood Monitoring System
A community-based flood monitoring system could be immediately set-up in the floodaffected barangays. One or more strategically located staff gauges can be installed in eachflood prone barangay. The staff gauge will be at least 2 meters long, graduated similar to ameter stick, and will extend from the ground to the highest historical flood level. The zeroreading of the staff gauge shall be surveyed to determine the equivalent elevation withrespect to the mean sea level for later conversion of the staff readings to groundelevations. The readings of the staff gauge can be done as many times during the floodevent but the time and date of reading should be recorded properly. A special training canbe organized to orient the observers on the purpose and method of conducting floodmeasurements. The gauge readings can be correlated to the river gauge to establish amathematical relationship that can be used in predicting the water level at each barangay.
5.4.1.3 Flood/Wind Damage Database
This is one of the most important components of the database system that will show theextent of social and economic consequences of flood/wind hazards to affected areas. It isexpected to awaken consciousness of people so that appropriate measures and prioritiesfor interventions can be planned and implemented properly.
The city government through the barangay officials, DSWD, DA and other agencies hasbeen conducting their own damage assessment every after typhoon event. The intent ofthese surveys however is essentially for disaster response and generating calamity fundsupport. There are therefore certain data which are critical for planning as well asduplications in data gathered including cases of inconsistencies in the same data generated.The content and method of data gathering are not also clear especially the basis forestimation of damages.
AUDMP Working Paper
125
The proposed flood database system will be lodged at the barangay level which hasintimacy on the conditions of their respective area during typhoon/flood events. Twotypes of information will be established, a general profile of the barangay and a flooddamage survey to be executed every after typhoon.
Barangay Profile
There already exist some kind of profile and map for each barangay in Naga City. All thatis needed is to update, validate and add some other information. The general profile ofeach barangay should contain the following essential information:
a) Topographic map of the barangay (preferably at a scale of 1:10,000)containing the location of rivers/creeks and other natural or man-madewaterways, roads (national, provincial, municipal, barangay), and politicalboundaries w/ adjacent barangays.
b) Sewerage and drainage map of the barangay.
c) General land use map indicating the spatial distribution of existing landuses: residential, commercial, industrial, institutional, parks and others.Together with this is the data on location by zone and area for each landuse category.
d) Demographic data by barangay zone including population, number ofhouseholds, family size, type of residential unit (single detached, duplex,multi-storey, etc.), type of building materials (concrete, wooden, etc.) andstatus of ownership of house/lot. The spatial distribution of settlementareas should be preferably mapped, especially houses located along theriver, urban poor/squatter areas, resettlement sites, subdivisions andothers.
e) Inventory of commercial/industrial establishments and their location. Thisincludes data on number by type of business establishment, building typeand status of ownership and location within the barangay zones.
f) Inventory of institutional establishments (schools, church, governmentoffices, hospitals etc.) including location, type, facilities and other relevantinfo, such as a school offering elementary and secondary education with 5buildings and a school population of say 1,000.
g) Inventory of infrastructures and utilities in the barangay such as roads(type, length), water supply system (piped system, deep/shallow wells,etc.), power source (cooperative or with emergency generators, etc.),telecommunications and others.
Naga City Disaster Mitigation Plan
126
h) Barangay officials and local socio-civic organizations (name, purpose,activities, key persons) operating in the barangay.
The maps can be requested from the City Government's EDP unit for updating by thebarangay officials. Inventory of population and land uses can be undertaken based onocular survey and simple questionnaire.
Flood Damage Survey
A flood damage survey design should be formulated to integrate the informationrequirement of various data users. Preferably, there should only be one instrument to beused for purposes of the survey that will be administered at the barangay level andcomplemented by other data collected by different agencies every typhoon/flood event.However, data analysis can be distributed to various local and national agencies based ontheir respective requirements.
At the minimum the following information should be provided at the barangay zone level:
A. Respondents: Community/Barangay Residents
1. Extent of flooding in the area to include:
• estimated water depth during and after the typhoon/flooding andcorresponding duration (in hours or days) of inundation by water level (e.g., 2feet-5 hours; 4 feet thereafter for 2 days)
2. Number of fatalities (death) including cause of death, location, profile of casualtiesto cover the following:
• name, gender and age• marital status (if married indicate no. of children)• health status prior to death (e.g., healthy, with existing illness - specify)• existing occupation (if not working indicate whether student or not working)• daily/monthly earnings• cost of hospitalization/medication, if brought to the hospital prior to death
3. Number of persons injured or got sick during and a week after flooding (due toflood exposure) including location, cause of injury or illness and profile ofmorbidity cases to include the following:
• name, gender and age• marital status• health status prior to sickness• existing occupation and daily/monthly earnings• number of days sick• cost of medical consultation and/or confinement
AUDMP Working Paper
127
• cost of medicine
4. Property Damage (Residential) to include as follows:
• type of house• extent of damage: partial or total• type of damage (e.g., roofing was flown, windows broken, etc.)• estimated value of the house prior to damage• estimated value of damage to the house (P)• other personal properties damaged (specify type and number)• estimated value of personal properties damaged
5. For working family members:
• occupation of working family members• how many days did not report for work• daily income (P) of each
6. Student family members
• number of family members enrolled (including level: elementary, secondary andcollege)
• number of days absent• number of days school was closed
7. Disruption of basic utilities:
• number of days/hours without electric power• number of days/hours without water
B. Respondents: Business Establishments (commercial/industrial)
1. Location, type of business (sari-sari store, general merchandise, banking,insurance, etc.) and category (small, medium, large)
2. Estimated annual gross sales/revenue (P)
3. Damage to fixed assets and goods to include:
• type of fixed assets damaged and estimated value of damage• type and volume of goods damaged including estimated value of damaged
goods
4. Disruption to business operation:
Naga City Disaster Mitigation Plan
128
• number of days business establishment was closed• number of hours/days without power and water• reason for temporary closure• estimated value of revenue lost (from sales and overhead expenses)
Other complementary data collected by various organizations should be integrated intothe flood damage database. Arrangements should be made to collect data from thefollowing organizations that regularly collect information on flood damage:
1. Office of the Provincial Agriculturist and/or Department of Agriculture foragricultural damages/losses. These institutions have already established method ofestimating damage to crops/livestock.
2. Office of the City Engineer and the Department of Public Works and Highwaysfor damage estimates on roads, bridges, flood control works and drainage system.Information should also be gathered on areas where access was not possible andfor how many hours or days.
3. Electric Cooperatives and National Power Corporation for damage to power linesand household connections including number of days without electricity indifferent areas and cost of damaged facilities and repair.
4. Local Water Utilities for damage to water supply and distribution system andestimated value of damage.
5. DECS and private academic institutions for damage to school buildings andnumber of days closed.
6. National Irrigation Administration (NIA) for damage on irrigation facilities.
7. DSWD, City Government Office and Barangay officials to provide information oncost of relief operation and assistance to include the following:
• population evacuated/served• number of evacuation centers and population served• number of government and private organizations involved in relief assistance• cost of relief operation/assistance to beneficiaries and other costs incurred
during evacuation
8. Other information from the barangay officials.
5.4.1.4 Computer-Based Mapping and Information System
AUDMP Working Paper
129
All data generated from the barangay-level flood damage survey as well as those comingfrom various agencies should be consolidated as one big database under the Office of theCity Government, preferably with the City Planning and Development Office (CPDO).First level processing will be undertaken at the barangay level consolidating zone resultsinto one barangay database. This will be submitted to the city for further processing,integration and consolidation with other data from various agencies. The EDP Unit of thecity will handle the electronic data processing and mapping of results while CPDO can dothe data analysis, databanking and communication of results to various users.
The data processing aspect will require the development of simple tables of results on aper barangay basis and consolidated as one for the entire city. Geographically referencedinformation will be mapped to readily visualize the affected areas and extent ofdamage/impacts across different locations, population and economic sectors. A morereliable estimate of the cost of recurring flood damage to the city will provide a strongbasis for justifying investments in flood mitigation measures.
Results of the database system will be made available and/or published by the CPDO forplanning and decision basis in the implementation of the disaster mitigation program.
5.4.1.5 Key Activities
The CPDO as the logical office under the City Government to implement the databasesystem shall take the lead to undertake the following essential activities. These activitieswill lead to the establishment and institutionalization of database support system fordisaster planning, management and monitoring:
a) Review and Design of the Flood Database System
This will involve overall review and design of the integrated database system toinclude the following:
• identification of data requirements, uses and users;• data collection system involving secondary and primary data gathering including
survey methods and forms;• data processing and analysis including reporting formats for various participating
entities;• communication of results to different users; and• institutional responsibilities for implementation of the system including
coordination and resource requirement.
b) Systems Installation and Training
This will include installation, refinement and operation of the database design. Thekey inputs will involve essentially conduct of training to the city government/agencypersonnel that would be involved including barangay officials on the use of surveyinstruments and data processing. Coordination arrangements for data sourcing/data
Naga City Disaster Mitigation Plan
130
distribution from participating agencies will also be established. In addition, thecomputer-based information system will be installed to handle mapping and dataprocessing.
c) System’s Operation
This will involve regular operation and institutionalization of the database system asinputs to disaster planning, management and monitoring.
5.4.1.6 Resource Requirement
The initial requirement for review, design and installation/training is estimated at aboutP1.7 million. The implementation cost is around P600,000 on an annual basis, assumingoccurrence of annual flooding. In addition, the computer and vehicular supports shall beenhanced for a total cost of about P1.00 million.
The estimated cost for the improvement of the PAGASA Flood Forecasting Facilities isabout P5.00 million, while the installation of staff gauges and the training of gauge keepersat the barangay level is about P200,000.00. The maintenance of the gauging stations shallbe shouldered by the barangay councils concerned.
5.4.2 Information, Education and Communication (IEC) Program
A city-wide IEC program for flood disaster mitigation/management is deemed necessary inview of the limited capability and numerous uncoordinated efforts of institutions involvedin disaster mitigation, and the rather indifferent attitude of many city residents to floodingrisks including some anthropogenic interventions which tend to aggravate flooding.Specifically this program is intended to achieve the following:
• enhance the capabilities of various organizations involved in disaster management;• strengthen coordination system for proper resource complementation and effective
disaster management activities at various levels;• enhance awareness and knowledge of concerned communities on disaster
preparedness and mitigation;• broaden the participation and support network for disaster management; and• encourage community initiatives for disaster preparedness, prevention and
mitigation
5.4.2.1 Scope of IEC
The IEC program will cover both the institutions/organizations involved in disastermanagement and the concerned communities affected by flooding/wind hazards. Thisprogram involves the following key components and activities:
• Identification of Training Needs both at the Institutional and CommunityLevels
AUDMP Working Paper
131
This component includes review of existing capabilities of various agenciesinvolved in disaster management as well as assessment of skills, knowledge andattitudes of communities affected by flooding hazards. On the basis of this review,institutional training needs will be identified as well as those for affectedcommunities.
• Preparation of Training Design/Modules and Information Materials/Kits
There are already existing training modules/materials and information kits fromdifferent government agencies involved in disaster management. This will bereviewed and refined to incorporate the gaps based on needs assessment.Consequently, training modules will be developed for various types of training.Information materials will be prepared for dissemination to various sectors andresidents of affected barangays.
• Orientation Seminars/workshops/training of various institutions involved indisaster management for IEC organizational activities and conduct of IEC
This involves seminars/workshops/training of DM-concerned institutions toorganize, pool their resources, plan and synchronize their activities in the conductof IEC to affected communities. Coordination system and functionalresponsibilities of concerned groups at different levels shall be agreed uponincluding resource sharing/complementation and feedback mechanism for timelyand appropriate response of concerned agencies in times of emergency.
• Establishment of Tri-Media Communication Network for disaster management
A multi-media communication network will be organized as a vehicle for IECimplementation. Radio, TV and print media will be mobilized in communicatinginformation for disaster prevention, preparedness and mitigation. Specifically,media will be utilized to monitor direction and magnitude of typhoons that mayaffect Naga. They can provide an early warning to residents for incomingtyphoons, cover and document conditions during typhoons/flooding, and mostimportantly call for assistance in areas where emergency rescue/evacuation areneeded.
• Organization of IEC Disaster Action Teams at the Barangay Level
At the community level, a multi-sectoral IEC Disaster Action Team will beorganized as the working arm of the Barangay Disaster Management Council toregularly conduct IEC in their respective communities. The same shall bemobilized during typhoon/flood events to inform residents of what to do andrespond to emergency.
Naga City Disaster Mitigation Plan
132
• Conduct regular/sustained training and information campaign at thecommunity level on disaster management
This provides for regular updating of training modules/materials and informationkits as well as conduct of regular training and constant dissemination ofinformation to concerned organizations and community residents utilizing theorganizational mechanism established for IEC.
5.4.2.2 Resource Requirement
The initial cost of training/information needs assessment, preparation of training modulesand information materials as well as organizing works is estimated at around P1 million.Production of training and information materials and conduct of training/IEC on asustained basis is estimated at around P1.5 per year.
5.4.3 Community Mobilization and Preparedness Program
This program is intended to enhance community consciousness, instill propervalues/attitudes to community residents and develop/strengthen community participation,initiatives and support for disaster management. Its implementation is linked with otherprograms, such as the database and IEC activities. On the overall, a CommunityInformation Planning System (CIPS) shall be established in all barangays of the city.
5.4.3.1 Scope of the Program
The key components and activities of the program include the following:
• Inventory and profiling of community residents including local organizations in thebarangays
This activity is part of the requirement for the establishment of the databasesystem at the barangay level. Based on the profiling, local socio-civic organizationscan be identified to participate in various disaster-related activities based on theircapabilities and resources.
• Preparation of community-based disaster management plan which will beformulated with the participation of various groups within each barangay.
This activity will further refine the initial efforts of the City Government’s La NiñaTask Force in formulating and implementing disaster management plan at thebarangay level with the participation of the Barangay Council. This plan willtranslate/ operationalize the city disaster management plan at the barangay level. Thiswill include, among others, training and IEC activities (as identified in the IEC Sectionabove); identification of potential contingency evacuation centers which can be offeredby private residents/organizations to the barangay (outside of government-providedevacuation centers); identification of minimum equipment/facilities which should be
AUDMP Working Paper
133
purchased by the barangay (such as rubber boat, flashlights, etc.) includingcommunity residents who can provide support equipment/ facilities which can beaccessed in times of emergency; plan for voluntary and orderly evacuation in knownhigh risk areas; and resource sharing/ solicitation plan to augment government fundsfor food, clothing and medicine supply needs of evacuees. The plan should alsoprovide for measures to reduce risk to population by encouraging residents to complywith the land use and zoning regulation as well as appropriate control by barangayofficials of the development in their respective area which can aggravate floodingsituations. The clean up operation of drainage canals and other waterways shouldform part of the barangay disaster mitigation plan.
• Regular Monitoring of Flood Damage and Mitigation Measures
The Barangay Council through the IEC Disaster Action Team should regularlyconduct flood damage assessment (as recommended) and monitoring of theimplementation and effectiveness of mitigation measures implemented. The resultsof the monitoring activities at the barangay level will be communicated to the citygovernment for appropriate replanning and/or formulation of additional measuresnecessary to avert future disaster events.
5.4.3.2 Key Activities
The program will expand the initial initiative of the City Health Office under the La NiñaTask Force in assisting the Barangay Councils in formulating evacuation plans due to theimpending effect of the La Niña. The expansion of the current activity is to establish aCIPS in each barangay, which would involved the entire project cycle activities; fromprofiling, planning, resource generation, implementation, and monitoring and evaluation.This could be done by training the existing Barangay Health Aids (BHAs) on how toassist the Barangay Councils in establishing the CIPS.
The other key activity of the program is the adoption of “Adopt a Family Program”during typhoons and floods. This program was adopted by some Barangays Councils aspart of their preparation for the La Niña event to happen. The features of the programinvolved the community mobilization initiated by the Barangay Council to undertake thefollowing:
a) Identification of most vulnerable families that would require evacuation assistance,
b) Identification of residential and commercial building within the barangay, with verylow risk factor to typhoon and flooding, whose owners are willing to adopt familyevacuees,
c) Together with the building owners, determine the number and identity of familiesthat could be accommodated in each building,
Naga City Disaster Mitigation Plan
134
d) Define guidelines for the evacuation procedure, and the evacuees’ ethics while atthe evacuation centers, and
e) Conduct IEC to affected constituents in particular and to the general populace ofthe barangay.
5.4.3.3 Resource Requirement
The community mobilization and preparedness program is estimated at an average cost ofaround P300,000 per barangay covering some 27 flood-prone barangays. The aggregatecost is about P8.10 million. Priority can be given to the high-risk areas such as Sabang,Triangulo, Mabolo, Igualdad, Abella and Calauag. The cost of profiling, training/IEC arealready incorporated in the earlier programs.
5.4.4 Organizational Strengthening
The existing Special Bodies, namely the Naga City Disaster Mitigation Council(NCDMC) and the Emergency Rescue Naga (ERN), are all operating on an ad hoc basis.The reason being is that there are no formal documents to support their operationalexistence. Under this component, both bodies are proposed to be formally organizedthrough an Executive Order (EO) by the City Mayor and formally sanctioned/adopted bythe Sangguniang Panglunsod. The EO should define its memberships, functions, andresponsibilities.
5.4.4.1 Creation of the Naga City Disaster Mitigation Executive Board
The membership and functions of the existing NCDMC which evolved from the NagaCity Disaster Management Team, created under EO No.98-005, dated June 2, 1998, hasto be redefined by issuing another Executive Order amending EO No. 98-005 creating theNaga City Disaster Mitigation Executive Board (NCDMEB). The NCDMEB shallcomprise of Executives or chief of offices of the key government and non-governmentorganizations involved in disaster mitigation program implementation. For the ExecutiveBoard to be effective in its operation, the City Mayor is proposed to act as Chairmanwith the City Administrator as the Vice-Chairman. The City Administrator is mandatedunder the Local Government Code to be in the front line in delivering administrativesupport services during and in the aftermath of man-made and natural disasters andcalamities. This makes him the logical choice to act as vice-chair of the Executive Board.The other members of the Board being proposed are as follows:
• Chairman of the Committee on Public Safety of the Sangguniang Panglunsod• President, Liga ng mga Barangay• Supervisor Science and Technology, City Schools Division• Chief of Office, City Social Welfare and Development Office• Chief of Office, PAGASA Camaligan Flood Forecasting Station• City Health Officer, City Health Office• Chief of Office, Office of the Civil Defense
AUDMP Working Paper
135
• Chief of Police, Naga City Police Station• Fire Marshall, Naga City Fire Station• President, KBP, Camarines Sur Chapter• President, Naga City People’s Council• President, Chamber of Commerce and Industry• Executive Officer, Emergency Rescue Naga Foundation, Inc.
Function and Authorities
The Executive Board shall act as the permanent coordinating center that shall oversee andorchestrate the planning and implementation of all disaster mitigation developmentprograms and projects in the City of Naga. In pursuing this function, the Board shall:
a) Provide policy directions to incorporate disaster mitigation measures to allproposed development programs with the ultimate view of making theCity of Naga a safe and livable city,
b) Pass upon all proposed disaster mitigation programs and its budgets,making sure its complementation to optimize resource allocations forgreater benefits of the populace,
c) Call upon the assistance of any office of the Naga City Government toavail of the services of their technical personnel or make use of theirfacilities and equipment,
d) Establish mechanism for collaborative efforts among special bodies, e.g.,Naga City Development Council, Naga City Disaster CoordinationCouncil, Naga City School Board, etc., to avoid replication of planning andimplementation of disaster mitigation related programs,
e) Monitor and evaluate implementation of all disaster mitigation programsand projects within the city,
f) Act as an Emergency Body to orchestrate the rescue operation during andafter typhoons and flooding, and/or other calamities both natural and man-made, and
g) Solicit popular support from its memberships and its instrumentalities togenerate resources and implement approved disaster mitigation measures.
Creation of Disaster Mitigation Management Unit (DMMU)
In support of the operation of the Board, a Disaster Mitigation Management Unit shall beorganized under the Office of the City Mayor. The Unit shall be headed by an ActionOfficer, who shall be designated by the City Mayor from its existing officers. Support
Naga City Disaster Mitigation Plan
136
staff shall be organized to man the unit, whose functions and responsibilities shall be asfollows:
a) Provide the mechanism for coordinating the planning and implementationof all disaster mitigation related programs and projects in Naga City,
b) Provide Technical Secretariat Services to the Board by providing allnecessary information needed by the Board during its meetings and, makingsure that all its decision are being implemented by its members and theirinstrumentalities, and other concerned institutions,
c). Establish mechanism to monitor and evaluate the effectiveness ofimplementation of all approved disaster mitigation related programs,
d) Submit regular status report to the City Mayor and the Board on theimplementation of all disaster mitigation related programs, especially thosethat were pass upon by the board,
e) Initiate activities that are supportive, especially on information andeducation campaign (IEC), to the disaster mitigation programs that arebeing implemented by other units and/or agencies,
f) Conduct pilot/research projects on disaster mitigation to test itseffectiveness before full adoption for implementation,
g) Provide assistance in the mobilization of the communities to prepare theirrespective disaster mitigation measures, particularly on disasterpreparedness, and
h) Undertake such activities as may be directed by the Board.
Manpower Complement of DMMU
The DMMU shall be headed by an Action Officer and assisted by regular staff asfollows:
• Monitoring and Evaluation Officer, who shall be responsible to conduct regularmonitoring and evaluation on the status of all the disaster mitigation program beingimplemented,
• Project Development Coordinator, who shall be responsible in coordinating withother implementing units to make sure that approved programs and projects arebeing implemented accordingly, and
AUDMP Working Paper
137
• Community Development Officer, who shall be responsible in coordinating andassisting the Barangay Councils in developing community preparedness programon disaster mitigation.
Additional contractual staff maybe hired as special activities for implementation by theUnit, as approved by the Board.
5.4.4.2 Strengthening of the ERN
There are two major operating units working for the Emergency Rescue Naga (ERN),these are:
• The ERN Unit. A part of the Naga City Hospital staff and facilities is beingmobilized by the Chief of Hospital, who is designated as the ERN Action Officer,during emergency cases requiring medical services within Naga City. Thisarrangement is being implemented on the basis of the verbal commitment of theCity Mayor to operationalize ERN; and
• The Volunteer Groups. These are mostly trained paramedics, professionals andnon-professionals, who provide volunteer services to augment the manpowercomplement of the ERN Unit during emergency cases and/ or occurrence ofdisasters. Recently, the Volunteers have decided to formally organize themselvesinto a Non-Government Organization (NGO) by registering their group with theSecurities and Exchange Commission (SEC) as the Emergency Rescue Naga (ERN)Foundation, Inc.
In the light of the current development, there is now a need to:
• Formally include in the mandate of the Naga City Hospital the provision ofemergency medical services, and formally organizing the ERN Unit in the hospital.This could be done through the issuance of an Executive Order signed by the CityMayor. The formal organization of the Unit would require the identification of theresponsible Officers and staff that shall composed the ERN Unit. In addition, thefacilities and equipment required for the emergency operation shall be madeavailable for use by the ERN Unit. A development program should be drawn bythe Hospital, in conjunction with ERN Foundation, Inc., to enhance the capabilityof the emergency rescue operation of Naga City.
The City Government to sign a Memorandum of Agreement (MOA) among the Hospitalswithin Naga City (See Table 21), and the ERN Foundation, Inc. This MOA would laydown the complementation arrangement among concerned institutions in providingefficient emergency medical services to residents of Naga City in times of disastersand calamities. The Naga City Hospital could be designated as the operating center of theERN. A common program shall be drawn on how to enhance their capabilities toparticipate in the disaster mitigation program of the city.
Naga City Disaster Mitigation Plan
138
5.4.4.3 Key Activities
To institutionalize the above organizational arrangements, the following basic supportrequirement should be undertaken:
i. The City Government shall provide appropriate office space (about 50 squaremeter) within the City Hall Building Complex for the operating center of the NagaCity Disaster Mitigation Board and its DMMU, with complete operating facilitieslike computers with GIS and desktop publishing capabilities, communicationfacilities, basic office furniture and equipment, at least one rescue and commandvehicle (equipped with VHF radio, fire extinguisher, first aid kit, resuscitator,chain saw, and flashlights), and electrical generating set (about 15 kva capacity) toprovide emergency electrical power for the operation of the Board duringtyphoons and other calamities,
ii. Creation of emergency units in each hospital and train them on rescue operationand application of first aid and basic life support system,
iii. Provision of support to the ERN Foundation Inc. to train volunteers, on rescueoperations and application of first aid and basic life support system, both at theERN level and at the barangay levels, and
iv. Enhance equipment capability of the Naga City Hospital for emergencyoperations, such as acquisition of one additional ambulance, five sets of first aidand basic life support kits, one set electrical generating set with 2.5 KVA capacity.
5.4.4.4 Resource Requirements
The cost for the establishment of the operating center of the Disaster MitigationManagement is about P4.5 million, and the enhancement of the Naga City Hospital’sequipment and facilities is about P2.5 million. The training of about 6,000 Training-Persondays for paramedics and rescue workers of hospitals, ERN level, and barangay level isestimated at P12.00 million over a two-year period.
5.5 ORGANIZATION AND MANAGEMENT
The Disaster Mitigation Management Plan will be implemented by the City Governmentthrough its existing operating units. The City Government shall adopt the participatoryapproach, in both planning and implementation of the management plan. The popularparticipation of other institutions in Naga, both Government and NGOs will be solicitedby creating the Naga City Disaster Mitigation Board. The communities will be mobilizedin implementing specific components of the plan.
AUDMP Working Paper
139
5.5.1 Project Organization
The City Mayor shall be responsible in the successful implementation of the plan. Heshall be assisted by the City Administrator in overseeing the implementation of all theproject components by the designated Units of the City Government. A DisasterMitigation Unit (DMMU) will be organized under the Office of the City Mayor tocoordinate and monitor/evaluate the implementation of the project. The offices of theCity Government that will be directly involved in the project implementation are asfollows:
• City Planning and Development Office (CPDO) - shall take the lead inimplementation of the Land Use and Zoning Planning, and establishment ofFlood/Wind Database System,
• City Engineers Office - shall be responsible in implementing the Structural/CivilWorks Counter Measures,
• City Health Office - shall be responsible in the community mobilization anddisaster preparedness program,
• Naga City Hospital - shall be responsible in implementing the Emergency RescueOperations that would require medical assistance,
• Information Office - shall take the lead in the implementation of the IEC programof the project,
• Human Resource Management Office - shall be responsible in the overallmanagement training program of the project, and
• City Agriculturist/ENRO - Shall be responsible in coordinating the implementationof the Naga River Watershed Reforestation program.
A Memorandum Order shall be issued by the City Mayor to effect the implementation ofthe Organizational Functional Chart of the Project Management Implementation as shownin Figure 28.
5.5.2 Implementation Schedule and Cash Flow Requirements
The implementation of the Institutional Development and the Land Use and ZoningPlanning could be established in five year period, while the implementation of theStructural/Civil Works is planned to be implemented over a ten-year period. TheSummary Implementation Plan for the Institutional Development is shown in Table 22,the Summary Implementation Plan of Land Use Planning and Capability Building isshown in Table 23, while the Summary Implementation Plan of Structural/Civil WorksCounter Measures is shown in Table 24. The total estimated cost to implement theproject is about P720.38 million over a ten (10) year period, please refer to Table 25summary implementation schedule and cash flow.
5.6 PLAN EVALUATION
5.6.1 Economic Analysis
Naga City Disaster Mitigation Plan
140
A preliminary economic evaluation was undertaken to illustrate the prima facie viabilityof the plan using the conventional method of economic analysis . The economic life of theproject was assumed at 25 years. Project investment is spread over a period of 10 years,after which a 1% maintenance cost is provided. The opportunity cost of capital wasassumed at 15 percent.
The project will not entirely solve the flooding problem of Naga. The benefits “with theproject” will generally accrue from the reduction in flood levels consequently reducinglosses/damages to vulnerable settlements, businesses, agriculture and infrastructures. Inaddition, the spread of flooding may be controlled thereby protecting some areas fromincurring damages/losses. Likewise, it will reduce incidence of casualty of vulnerablepopulation from mortality/morbidity cases and associated medical and income opportunitylosses. There are many other indirect environmental benefits from the project relating toimproved drainage, river clean up and rehabilitation and watershed protection. These include,among others, incremental benefits from improved health and sanitation and reduction in soilerosion/sedimentation, aesthetics and others.
The present estimation of benefits however is constrained by the absence and/orinadequacy of data that will allow a more realistic quantification of benefits (as earliercited in the previous sections of the plan). Hence, for purposes of this analysis, data wasconfined on probabilistic estimates on what has been previously quantified under theconsequence analysis. In addition, the following assumptions were employed:
• 50% flooding reduction in areas affected by the Naga River after 5 years• 20% incremental reduction in flooding-related losses as improvement in the
drainage system continues up to the 10th-year alleviating flooding not only in theinfluence area of Naga River but to some extent the Bicol River.
Four alternative investment scenarios were considered to determine the most economicallyviable option. These include as follows:
• Option 1 - Full implementation based on a 10-year investment program• Option 2 - Only the structural costs were considered without the landuse/legal
reforms and institutional components• Option 3 - Only the investment costs for the first five years were considered
setting aside drainage rehabilitation• Option 4 - Implementation will be limited to structural works for the first five
years without drainage rehabilitation
Tables 26 to 29 show the preliminary economic analysis for the various options with thefollowing results:
• Option 1 - 8% Financial Internal Rate of Return (FIRR)• Option 2 - 10% FIRR• Option 3 - 12% FIRR• Option 4 - 18% FIRR
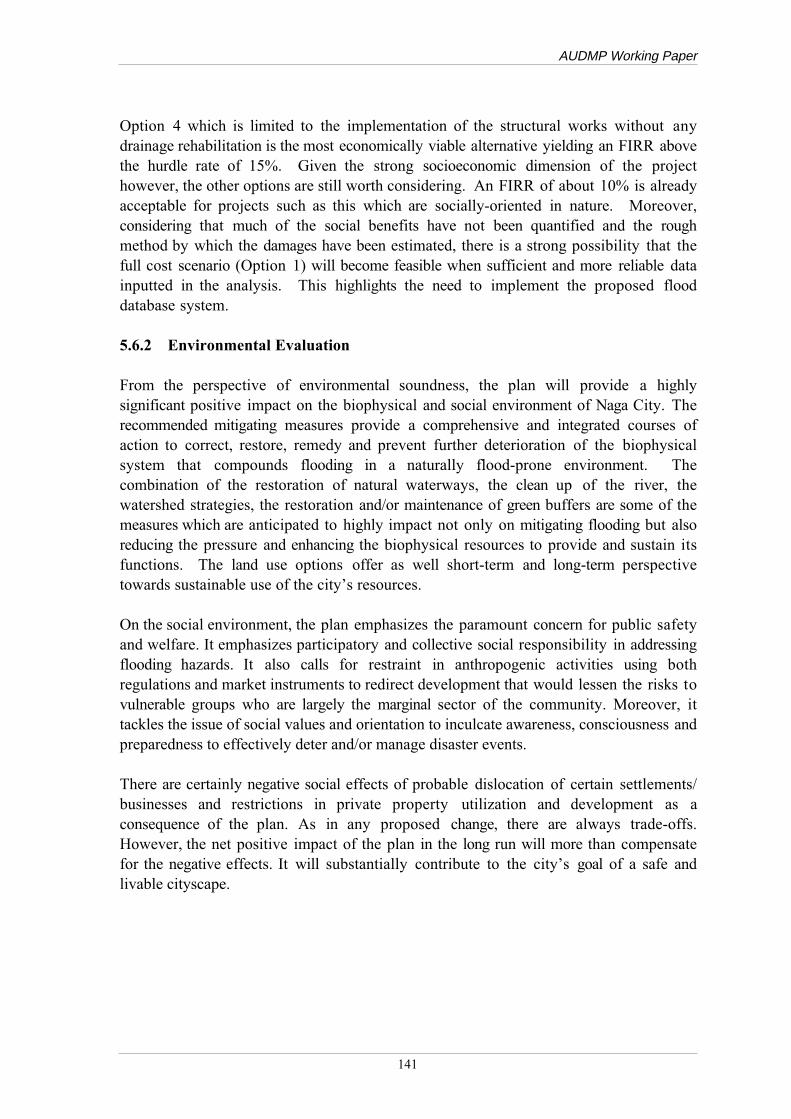
AUDMP Working Paper
141
Option 4 which is limited to the implementation of the structural works without anydrainage rehabilitation is the most economically viable alternative yielding an FIRR abovethe hurdle rate of 15%. Given the strong socioeconomic dimension of the projecthowever, the other options are still worth considering. An FIRR of about 10% is alreadyacceptable for projects such as this which are socially-oriented in nature. Moreover,considering that much of the social benefits have not been quantified and the roughmethod by which the damages have been estimated, there is a strong possibility that thefull cost scenario (Option 1) will become feasible when sufficient and more reliable datainputted in the analysis. This highlights the need to implement the proposed flooddatabase system.
5.6.2 Environmental Evaluation
From the perspective of environmental soundness, the plan will provide a highlysignificant positive impact on the biophysical and social environment of Naga City. Therecommended mitigating measures provide a comprehensive and integrated courses ofaction to correct, restore, remedy and prevent further deterioration of the biophysicalsystem that compounds flooding in a naturally flood-prone environment. Thecombination of the restoration of natural waterways, the clean up of the river, thewatershed strategies, the restoration and/or maintenance of green buffers are some of themeasures which are anticipated to highly impact not only on mitigating flooding but alsoreducing the pressure and enhancing the biophysical resources to provide and sustain itsfunctions. The land use options offer as well short-term and long-term perspectivetowards sustainable use of the city’s resources.
On the social environment, the plan emphasizes the paramount concern for public safetyand welfare. It emphasizes participatory and collective social responsibility in addressingflooding hazards. It also calls for restraint in anthropogenic activities using bothregulations and market instruments to redirect development that would lessen the risks tovulnerable groups who are largely the marginal sector of the community. Moreover, ittackles the issue of social values and orientation to inculcate awareness, consciousness andpreparedness to effectively deter and/or manage disaster events.
There are certainly negative social effects of probable dislocation of certain settlements/businesses and restrictions in private property utilization and development as aconsequence of the plan. As in any proposed change, there are always trade-offs.However, the net positive impact of the plan in the long run will more than compensatefor the negative effects. It will substantially contribute to the city’s goal of a safe andlivable cityscape.
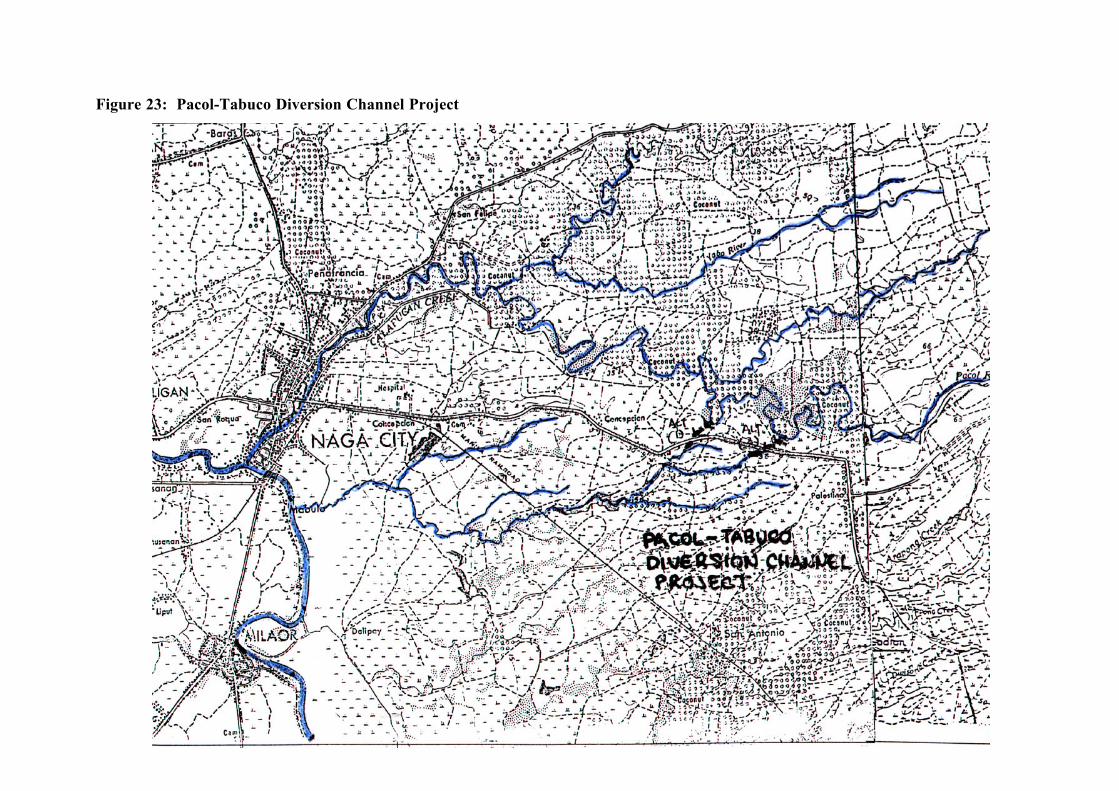
Figure 23: Pacol-Tabuco Diversion Channel Project
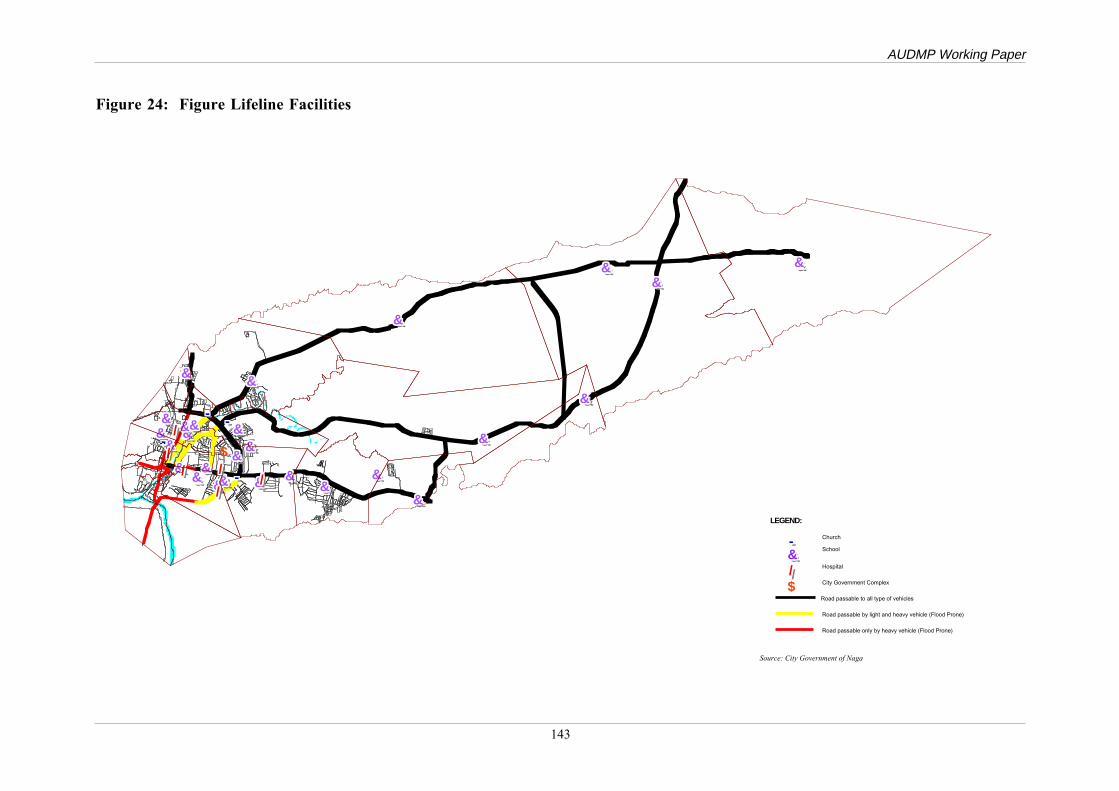
AUDMP Working Paper
143
Figure 24: Figure Lifeline Facilities
&&&&&&&&&&
&&&&&&&&&&&&&&&&&&&&
&&&&&&&&&&&&&&&&&&&& &&&&&&&&&&
&&&&&&&&&&
&&&&&&&&&&&&&&&&&&&&
&&&&&&&&&&&&&&&&&&&&
&&&&&&&&&& &&&&&&&&&&
&&&&&&&&&&&&&&&&&&&&
&&&&&&&&&& &&&&&&&&&&
&&&&&&&&&&
&&&&&&&&&&
&&&&&&&&&&&&&&&&&&&&
&&&&&&&&&&
&&&&&&&&&&
&&&&&&&&&&&&&&&&&&&&
&&&&&&&&&&
&&&&&&&&&&
---------- ----------
----------
----------
//////////
//////////
//////////////////// //////////
//////////
$
----------&&&&&&&&&&//////////
Church
School
Hospital
$ City Government Complex
Road passable to all type of vehicles
Road passable by light and heavy vehicle (Flood Prone)
Road passable only by heavy vehicle (Flood Prone)
LEGEND:
Source: City Government of Naga
Figure 25: Naga City, Flood Hazard Zone
Figure 46NAGA CITY
Flood Hazard Zone
MabolTabuc
Saban
Dinag
Abell
Sta.
Igualdad Int.
Triangul
Lerm
Concepcion
San Francisco
Tinag
Bagumbayan
Bagumbayan
Peñafranci
Dayangdan
Calaua
Liboto
Balata
San
1. Abella2. Bagumbayan Norte3. Bagumbayan Sur4. Calauag5. Dayangdang6. Dinaga7. Igualdad8. Lerma9. Liboton10. Mabolo11. Peñafrancia12. Sabang13. San Francisco14. Sta. Cruz15. Tabuco16. Tinago17. Triangulo
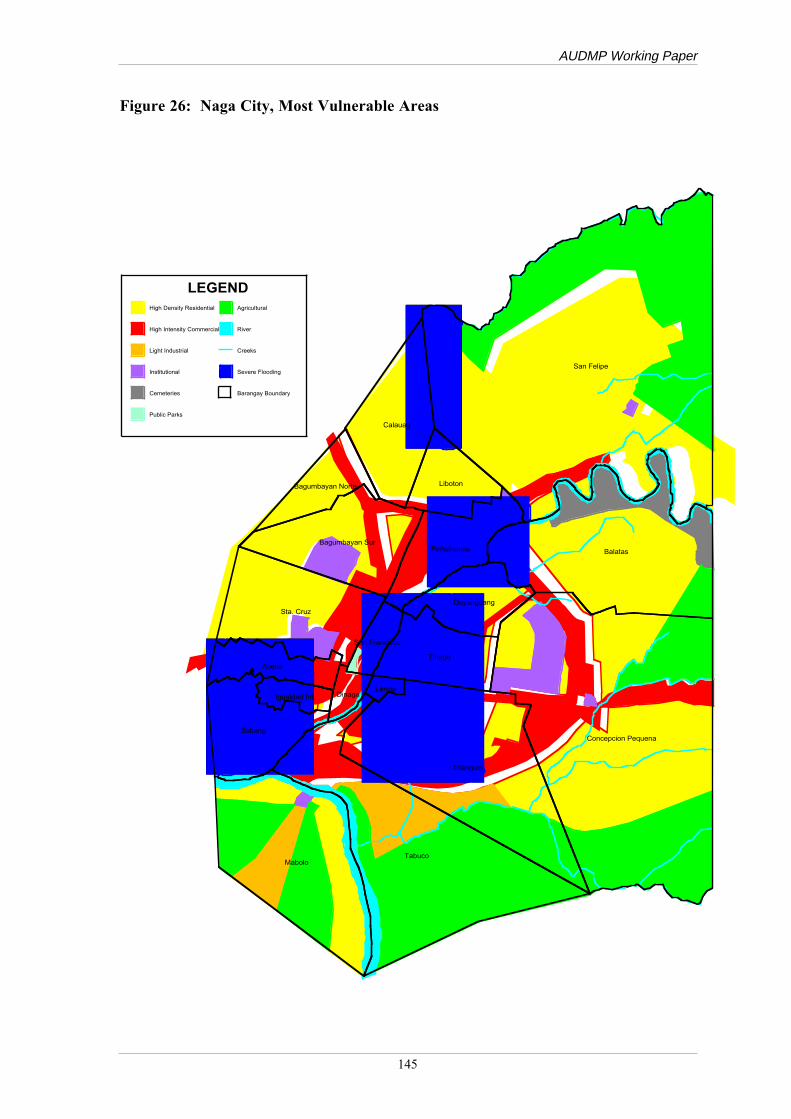
AUDMP Working Paper
145
Figure 26: Naga City, Most Vulnerable Areas
MaboloTabuco
Sabang
Dinaga
Abella
Sta. Cruz
Igualdad Int.
Triangulo
Lerma
Concepcion Pequena
San Francisco
Tinago
Bagumbayan Sur
Bagumbayan Norte
Peñafrancia
Dayangdang
Calauag
Liboton
Balatas
San Felipe
LEGEND High Density Residential
High Intensity Commercial
Light Industrial
Institutional
Cemeteries
Public Parks
Agricultural
River
Creeks
Severe Flooding
Barangay Boundary
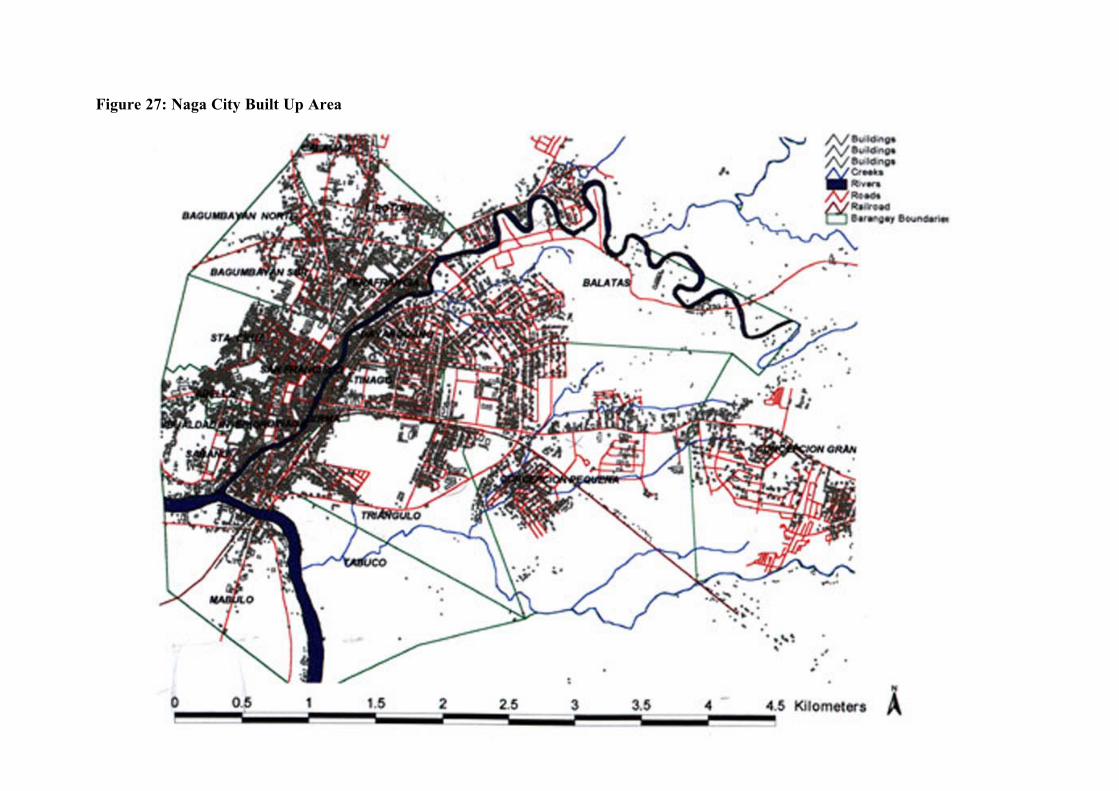
Figure 27: Naga City Built Up Area
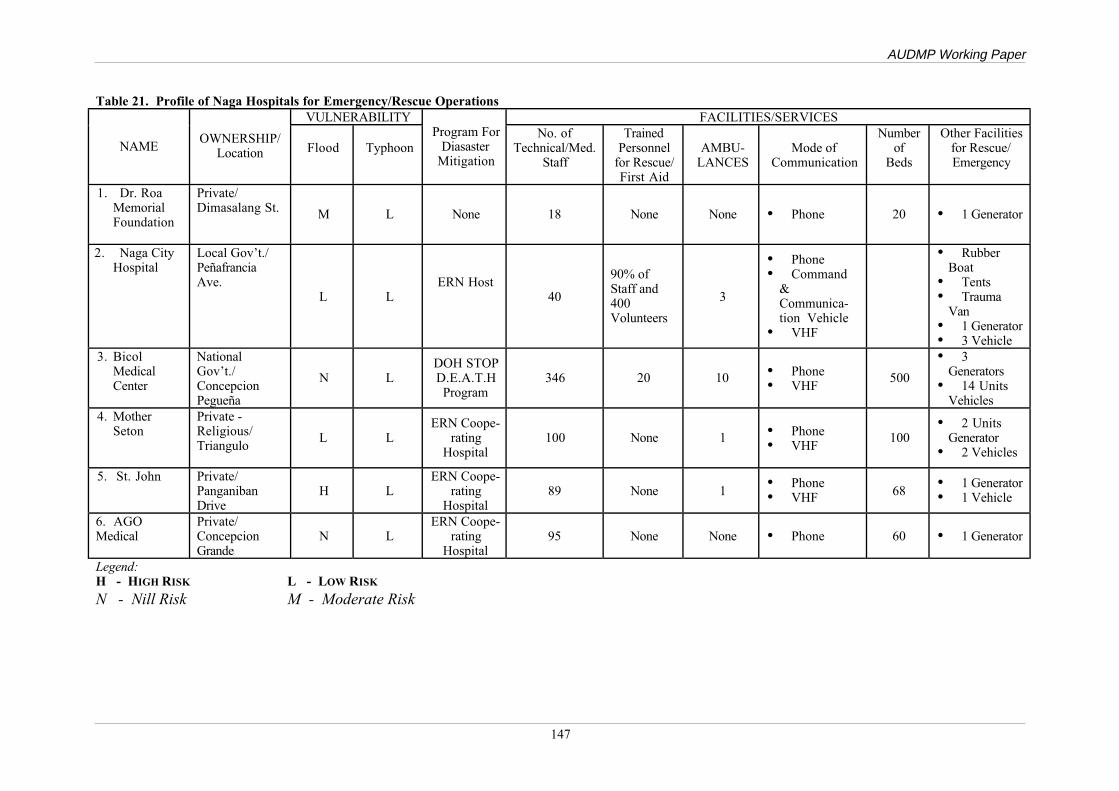
AUDMP Working Paper
147
Table 21. Profile of Naga Hospitals for Emergency/Rescue OperationsVULNERABILITY FACILITIES/SERVICES
NAMEOWNERSHIP/
Location Flood TyphoonProgram For
DiasasterMitigation
No. ofTechnical/Med.
Staff
TrainedPersonnel
for Rescue/First Aid
AMBU-LANCES
Mode ofCommunication
Numberof
Beds
Other Facilitiesfor Rescue/Emergency
1. Dr. RoaMemorialFoundation
Private/Dimasalang St. M L None 18 None None • Phone 20 • 1 Generator
2. Naga CityHospital
Local Gov’t./PeñafranciaAve.
L LERN Host
40
90% ofStaff and400Volunteers
3
• Phone• Command
&Communica-tion Vehicle
• VHF
• RubberBoat
• Tents• Trauma
Van• 1 Generator• 3 Vehicle
3. BicolMedicalCenter
NationalGov’t./ConcepcionPegueña
N LDOH STOPD.E.A.T.HProgram
346 20 10 • Phone• VHF
500
• 3Generators
• 14 UnitsVehicles
4. MotherSeton
Private -Religious/Triangulo
L LERN Coope-
ratingHospital
100 None 1 • Phone• VHF
100• 2 Units
Generator• 2 Vehicles
5. St. John Private/PanganibanDrive
H LERN Coope-
ratingHospital
89 None 1• Phone• VHF 68
• 1 Generator• 1 Vehicle
6. AGOMedical
Private/ConcepcionGrande
N LERN Coope-
ratingHospital
95 None None • Phone 60 • 1 Generator
Legend:H - HIGH RISK L - LOW RISK
N - Nill Risk M - Moderate Risk
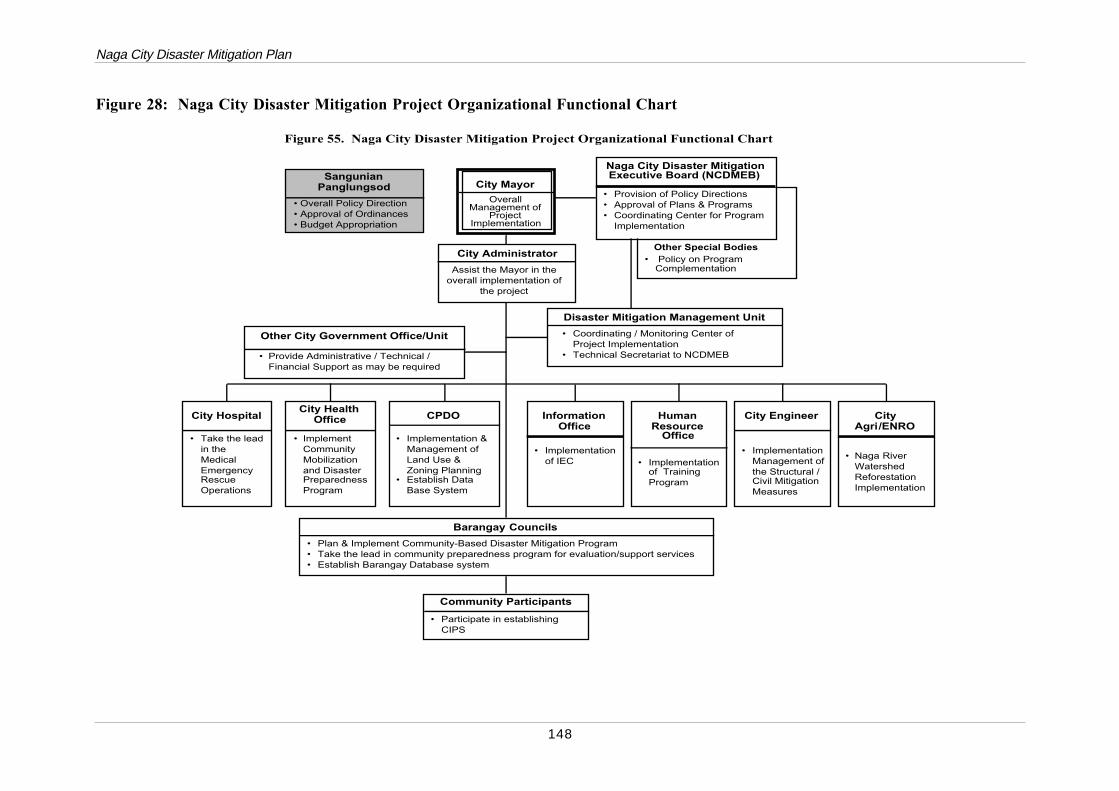
Naga City Disaster Mitigation Plan
148
Figure 28: Naga City Disaster Mitigation Project Organizational Functional Chart
Figure 55. Naga City Disaster Mitigation Project Organizational Functional Chart
City Mayor
OverallManagement of
ProjectImplementation
SangunianPanglungsod
• Overall Policy Direction• Approval of Ordinances• Budget Appropriation
Naga City Disaster MitigationExecutive Board (NCDMEB)
• Provision of Policy Directions• Approval of Plans & Programs• Coordinating Center for Program
Implementation
Other Special BodiesCity Administrator
Assist the Mayor in theoverall implementation of
the project
Other City Government Office/Unit
• Provide Administrative / Technical /Financial Support as may be required
City Hospital
• Take the leadin theMedicalEmergencyRescueOperations
City HealthOffice
• ImplementCommunityMobilizationand DisasterPreparednessProgram
CPDO
• Implementation &Management ofLand Use &Zoning Planning
• Establish DataBase System
InformationOffice
• Implementationof IEC
HumanResource
Office
• Implementationof TrainingProgram
City Engineer
• ImplementationManagement ofthe Structural /Civil MitigationMeasures
CityAgri/ENRO
• Naga RiverWatershedReforestationImplementation
Disaster Mitigation Management Unit
• Coordinating / Monitoring Center ofProject Implementation
• Technical Secretariat to NCDMEB
• Plan & Implement Community-Based Disaster Mitigation Program• Take the lead in community preparedness program for evaluation/support services• Establish Barangay Database system
Community Participants
• Participate in establishingCIPS
Barangay Councils
• Policy on ProgramComplementation
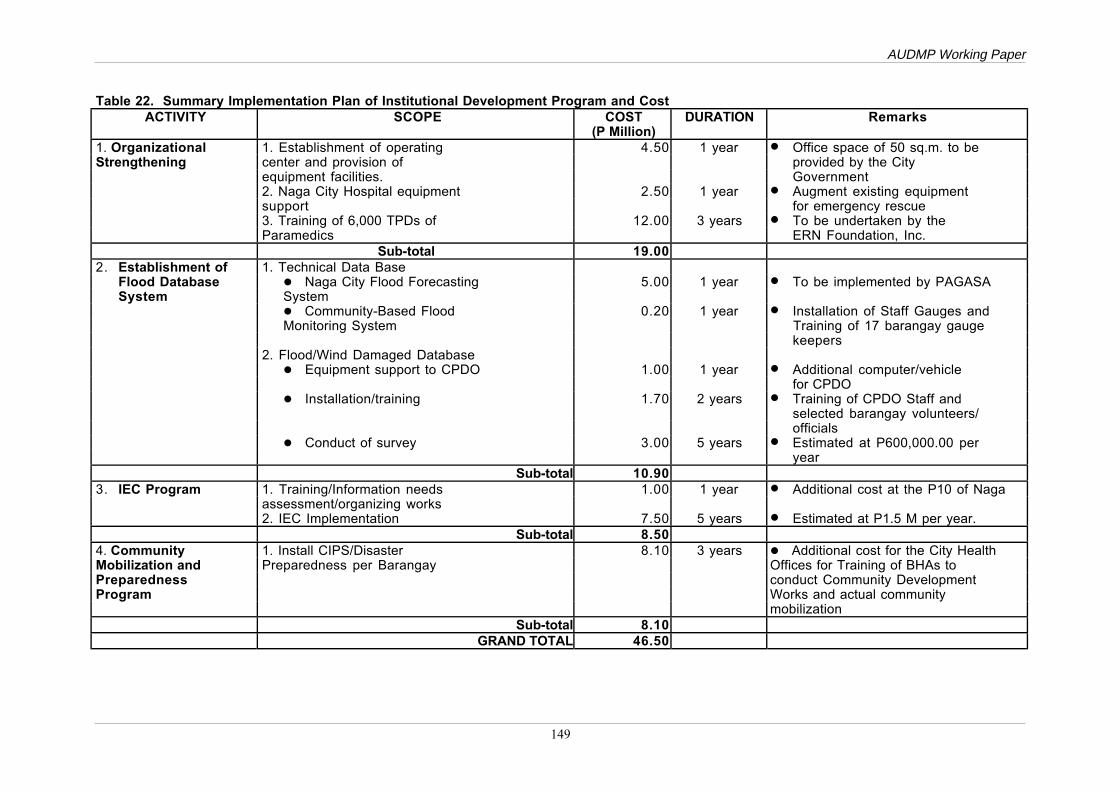
AUDMP Working Paper
149
Table 22. Summary Implementation Plan of Institutional Development Program and CostDURATION RemarksACTIVITY SCOPE COST
(P Million)4.50 1 year � Office space of 50 sq.m. to be
provided by the City1. Establishment of operatingcenter and provision ofequipment facilities. Government
2.50 1 year � Augment existing equipment2. Naga City Hospital equipmentsupport for emergency rescue
12.00 3 years � To be undertaken by the
1. OrganizationalStrengthening
3. Training of 6,000 TPDs ofParamedics ERN Foundation, Inc.
Sub-total 19.002. Establishment of 1. Technical Data Base
Flood Database 5.00 1 year � To be implemented by PAGASASystem
� Naga City Flood ForecastingSystem
0.20 1 year � Installation of Staff Gauges and� Community-Based FloodMonitoring System Training of 17 barangay gauge
keepers2. Flood/Wind Damaged Database� Equipment support to CPDO 1.00 1 year � Additional computer/vehicle
for CPDO� Installation/training 1.70 2 years � Training of CPDO Staff and
selected barangay volunteers/officials
� Conduct of survey 3.00 5 years � Estimated at P600,000.00 peryear
Sub-total 10.903. IEC Program 1.00 1 year � Additional cost at the P10 of Naga1. Training/Information needs
assessment/organizing works2. IEC Implementation 7.50 5 years � Estimated at P1.5 M per year.
Sub-total 8.508.10 3 years1. Install CIPS/Disaster
Preparedness per Barangay4. CommunityMobilization andPreparednessProgram
� Additional cost for the City HealthOffices for Training of BHAs toconduct Community DevelopmentWorks and actual communitymobilization
Sub-total 8.10GRAND TOTAL 46.50
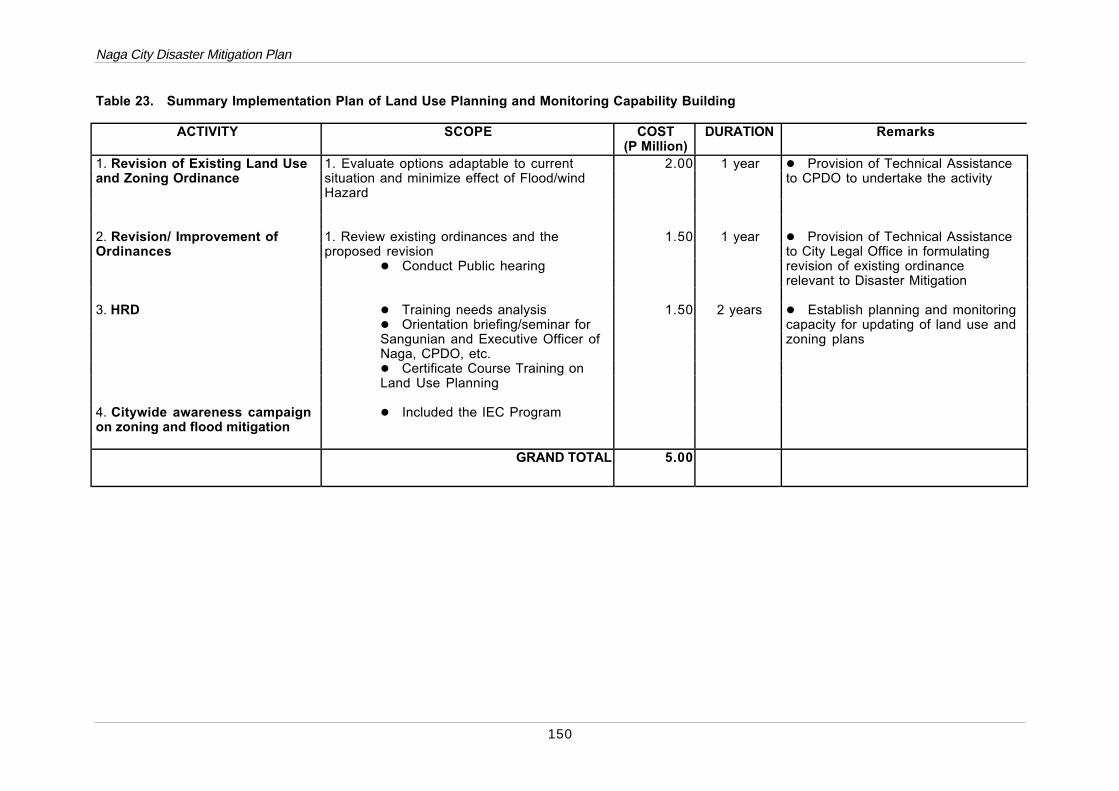
Naga City Disaster Mitigation Plan
150
Table 23. Summary Implementation Plan of Land Use Planning and Monitoring Capability Building
ACTIVITY SCOPE COST(P Million)
DURATION Remarks
2.00 1 year � Provision of Technical Assistanceto CPDO to undertake the activity
1. Revision of Existing Land Useand Zoning Ordinance
1. Evaluate options adaptable to currentsituation and minimize effect of Flood/windHazard
1.50 1 year1. Review existing ordinances and theproposed revision
� Conduct Public hearing
2. Revision/ Improvement ofOrdinances
� Provision of Technical Assistanceto City Legal Office in formulatingrevision of existing ordinancerelevant to Disaster Mitigation
1.50 2 years � Establish planning and monitoringcapacity for updating of land use andzoning plans
3. HRD � Training needs analysis� Orientation briefing/seminar forSangunian and Executive Officer ofNaga, CPDO, etc.� Certificate Course Training onLand Use Planning
4. Citywide awareness campaignon zoning and flood mitigation
� Included the IEC Program
GRAND TOTAL 5.00
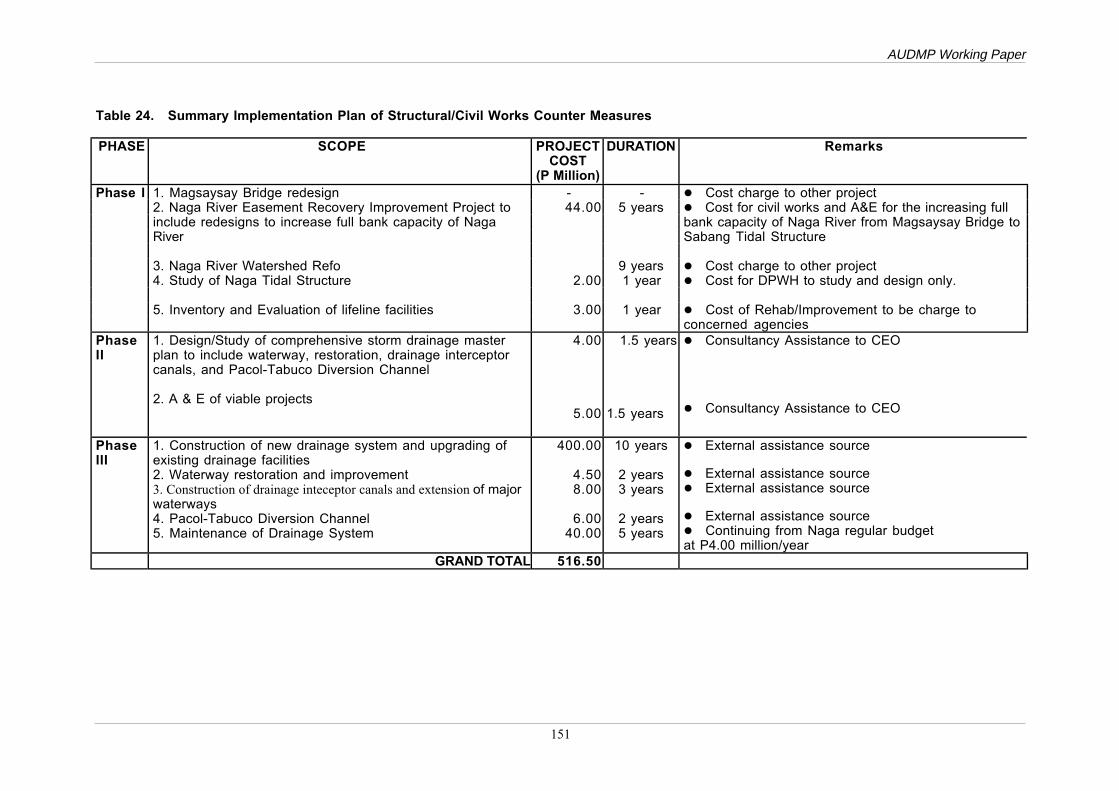
AUDMP Working Paper
151
Table 24. Summary Implementation Plan of Structural/Civil Works Counter Measures
PHASE SCOPE PROJECTCOST
(P Million)
DURATION Remarks
1. Magsaysay Bridge redesign - - � Cost charge to other project44.00 5 years2. Naga River Easement Recovery Improvement Project to
include redesigns to increase full bank capacity of NagaRiver
� Cost for civil works and A&E for the increasing fullbank capacity of Naga River from Magsaysay Bridge toSabang Tidal Structure
3. Naga River Watershed Refo 9 years � Cost charge to other project4. Study of Naga Tidal Structure 2.00 1 year � Cost for DPWH to study and design only.
3.00 1 year
Phase I
5. Inventory and Evaluation of lifeline facilities � Cost of Rehab/Improvement to be charge toconcerned agencies
PhaseII
1. Design/Study of comprehensive storm drainage masterplan to include waterway, restoration, drainage interceptorcanals, and Pacol-Tabuco Diversion Channel
2. A & E of viable projects
4.00
5.00
1.5 years
1.5 years
� Consultancy Assistance to CEO
� Consultancy Assistance to CEO
PhaseIII
1. Construction of new drainage system and upgrading ofexisting drainage facilities2. Waterway restoration and improvement3. Construction of drainage inteceptor canals and extension of majorwaterways4. Pacol-Tabuco Diversion Channel5. Maintenance of Drainage System
400.00
4.508.00
6.0040.00
10 years
2 years3 years
2 years5 years
� External assistance source
� External assistance source� External assistance source
� External assistance source� Continuing from Naga regular budgetat P4.00 million/year
GRAND TOTAL 516.50
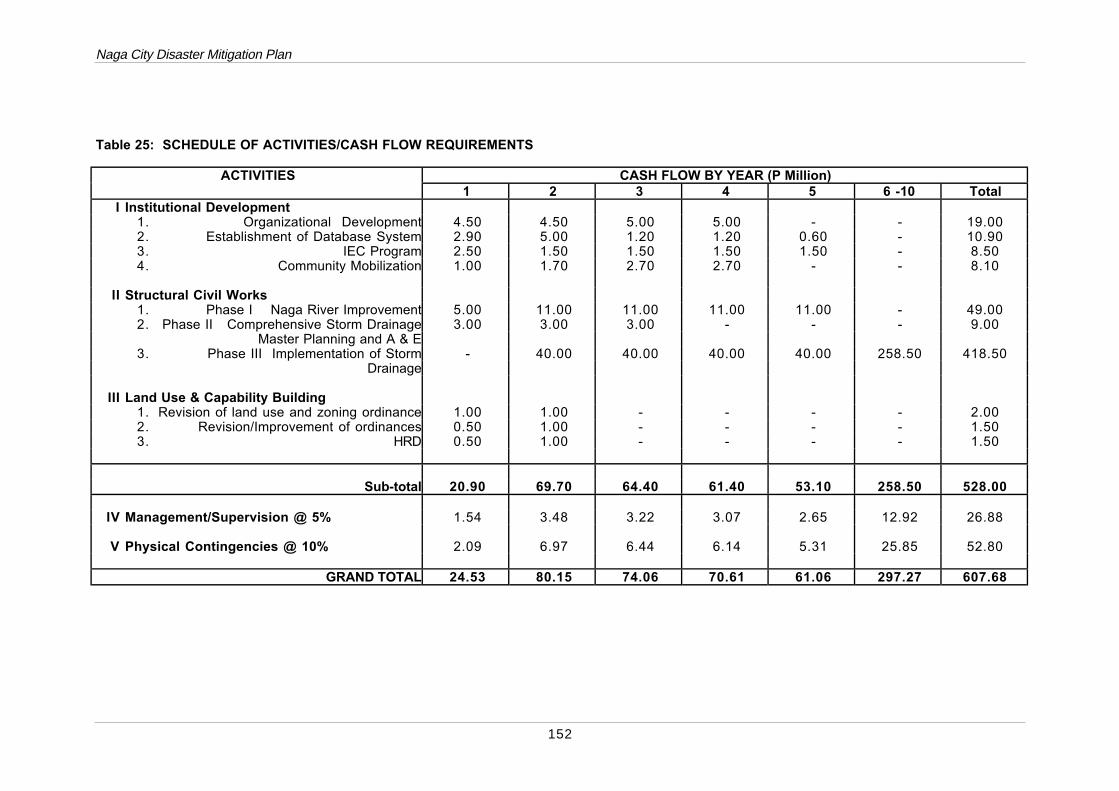
Naga City Disaster Mitigation Plan
152
Table 25: SCHEDULE OF ACTIVITIES/CASH FLOW REQUIREMENTS
ACTIVITIES CASH FLOW BY YEAR (P Million)1 2 3 4 5 6 -10 Total
I Institutional Development1. Organizational Development 4.50 4.50 5.00 5.00 - - 19.002. Establishment of Database System 2.90 5.00 1.20 1.20 0.60 - 10.903. IEC Program 2.50 1.50 1.50 1.50 1.50 - 8.504. Community Mobilization 1.00 1.70 2.70 2.70 - - 8.10
II Structural Civil Works1. Phase I Naga River Improvement 5.00 11.00 11.00 11.00 11.00 - 49.002. Phase II Comprehensive Storm Drainage 3.00 3.00 3.00 - - - 9.00
Master Planning and A & E3. Phase III Implementation of Storm - 40.00 40.00 40.00 40.00 258.50 418.50
Drainage
III Land Use & Capability Building1. Revision of land use and zoning ordinance 1.00 1.00 - - - - 2.002. Revision/Improvement of ordinances 0.50 1.00 - - - - 1.503. HRD 0.50 1.00 - - - - 1.50
Sub-total 20.90 69.70 64.40 61.40 53.10 258.50 528.00
IV Management/Supervision @ 5% 1.54 3.48 3.22 3.07 2.65 12.92 26.88
V Physical Contingencies @ 10% 2.09 6.97 6.44 6.14 5.31 25.85 52.80
GRAND TOTAL 24.53 80.15 74.06 70.61 61.06 297.27 607.68
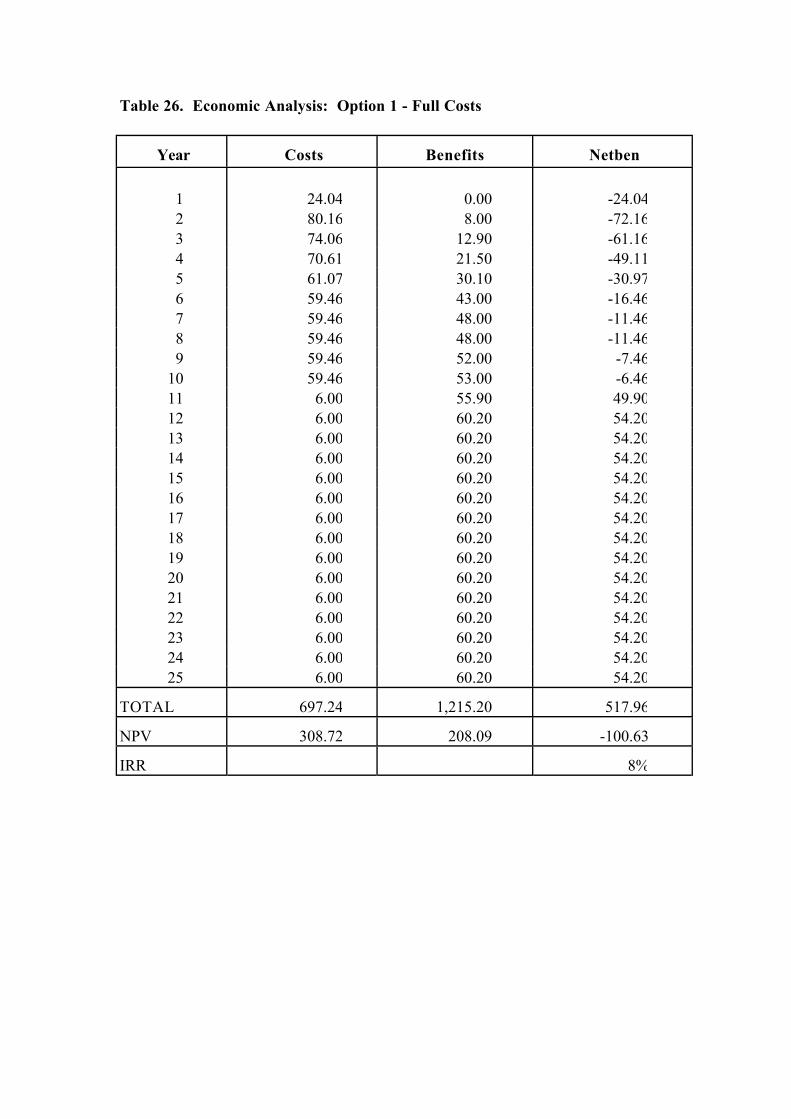
Table 26. Economic Analysis: Option 1 - Full Costs
Year Costs Benefits Netben
1 24.04 0.00 -24.042 80.16 8.00 -72.163 74.06 12.90 -61.164 70.61 21.50 -49.115 61.07 30.10 -30.976 59.46 43.00 -16.467 59.46 48.00 -11.468 59.46 48.00 -11.469 59.46 52.00 -7.46
10 59.46 53.00 -6.4611 6.00 55.90 49.9012 6.00 60.20 54.2013 6.00 60.20 54.2014 6.00 60.20 54.2015 6.00 60.20 54.2016 6.00 60.20 54.2017 6.00 60.20 54.2018 6.00 60.20 54.2019 6.00 60.20 54.2020 6.00 60.20 54.2021 6.00 60.20 54.2022 6.00 60.20 54.2023 6.00 60.20 54.2024 6.00 60.20 54.2025 6.00 60.20 54.20
TOTAL 697.24 1,215.20 517.96
NPV 308.72 208.09 -100.63
IRR 8%
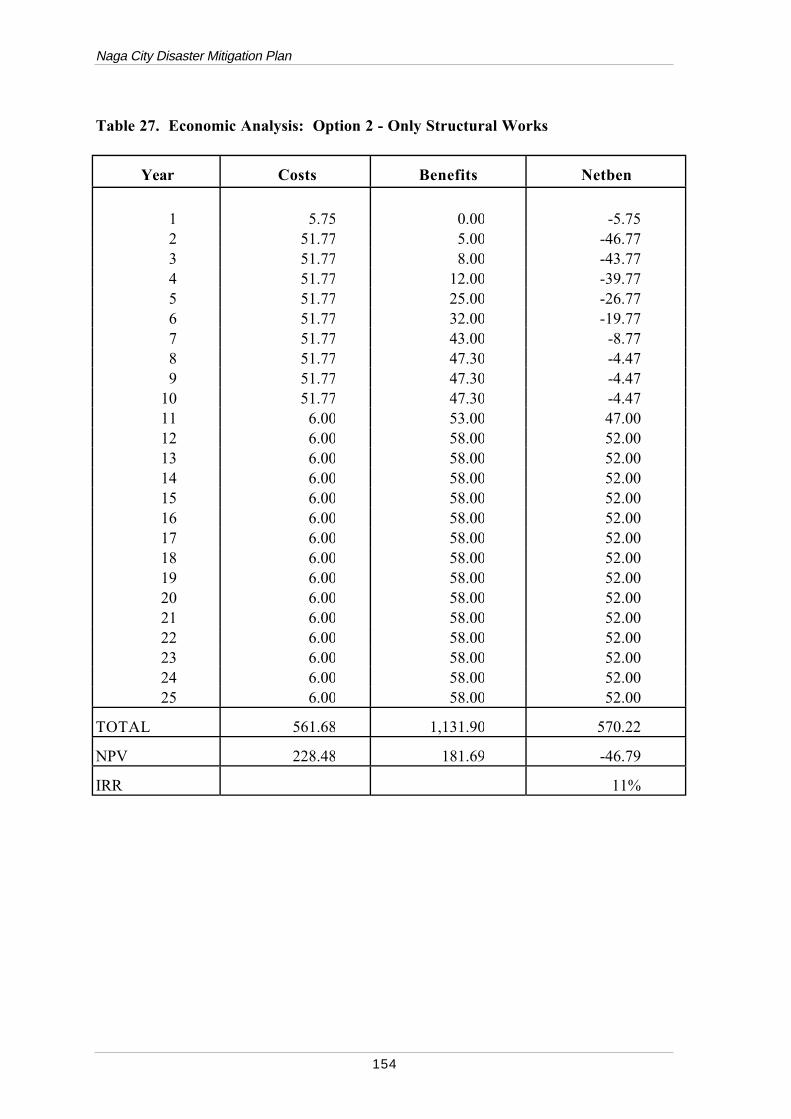
Naga City Disaster Mitigation Plan
154
Table 27. Economic Analysis: Option 2 - Only Structural Works
Year Costs Benefits Netben
1 5.75 0.00 -5.752 51.77 5.00 -46.773 51.77 8.00 -43.774 51.77 12.00 -39.775 51.77 25.00 -26.776 51.77 32.00 -19.777 51.77 43.00 -8.778 51.77 47.30 -4.479 51.77 47.30 -4.47
10 51.77 47.30 -4.4711 6.00 53.00 47.0012 6.00 58.00 52.0013 6.00 58.00 52.0014 6.00 58.00 52.0015 6.00 58.00 52.0016 6.00 58.00 52.0017 6.00 58.00 52.0018 6.00 58.00 52.0019 6.00 58.00 52.0020 6.00 58.00 52.0021 6.00 58.00 52.0022 6.00 58.00 52.0023 6.00 58.00 52.0024 6.00 58.00 52.0025 6.00 58.00 52.00
TOTAL 561.68 1,131.90 570.22
NPV 228.48 181.69 -46.79
IRR 11%
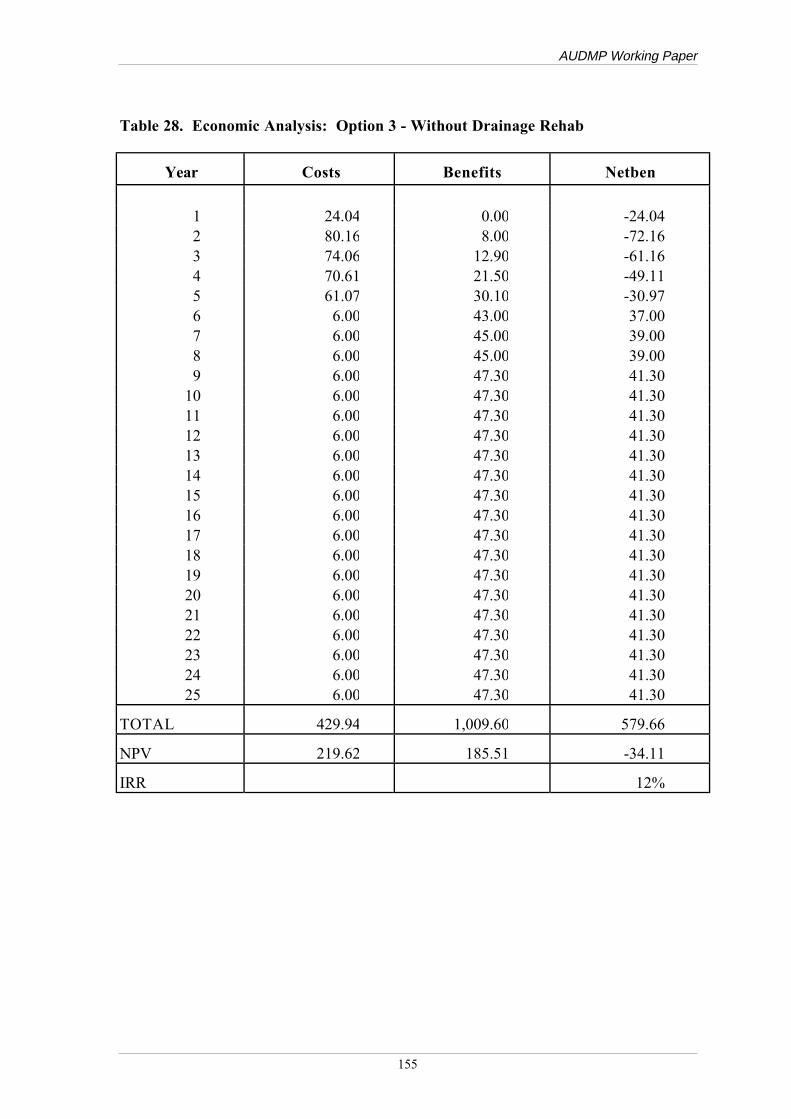
AUDMP Working Paper
155
Table 28. Economic Analysis: Option 3 - Without Drainage Rehab
Year Costs Benefits Netben
1 24.04 0.00 -24.042 80.16 8.00 -72.163 74.06 12.90 -61.164 70.61 21.50 -49.115 61.07 30.10 -30.976 6.00 43.00 37.007 6.00 45.00 39.008 6.00 45.00 39.009 6.00 47.30 41.30
10 6.00 47.30 41.3011 6.00 47.30 41.3012 6.00 47.30 41.3013 6.00 47.30 41.3014 6.00 47.30 41.3015 6.00 47.30 41.3016 6.00 47.30 41.3017 6.00 47.30 41.3018 6.00 47.30 41.3019 6.00 47.30 41.3020 6.00 47.30 41.3021 6.00 47.30 41.3022 6.00 47.30 41.3023 6.00 47.30 41.3024 6.00 47.30 41.3025 6.00 47.30 41.30
TOTAL 429.94 1,009.60 579.66
NPV 219.62 185.51 -34.11
IRR 12%
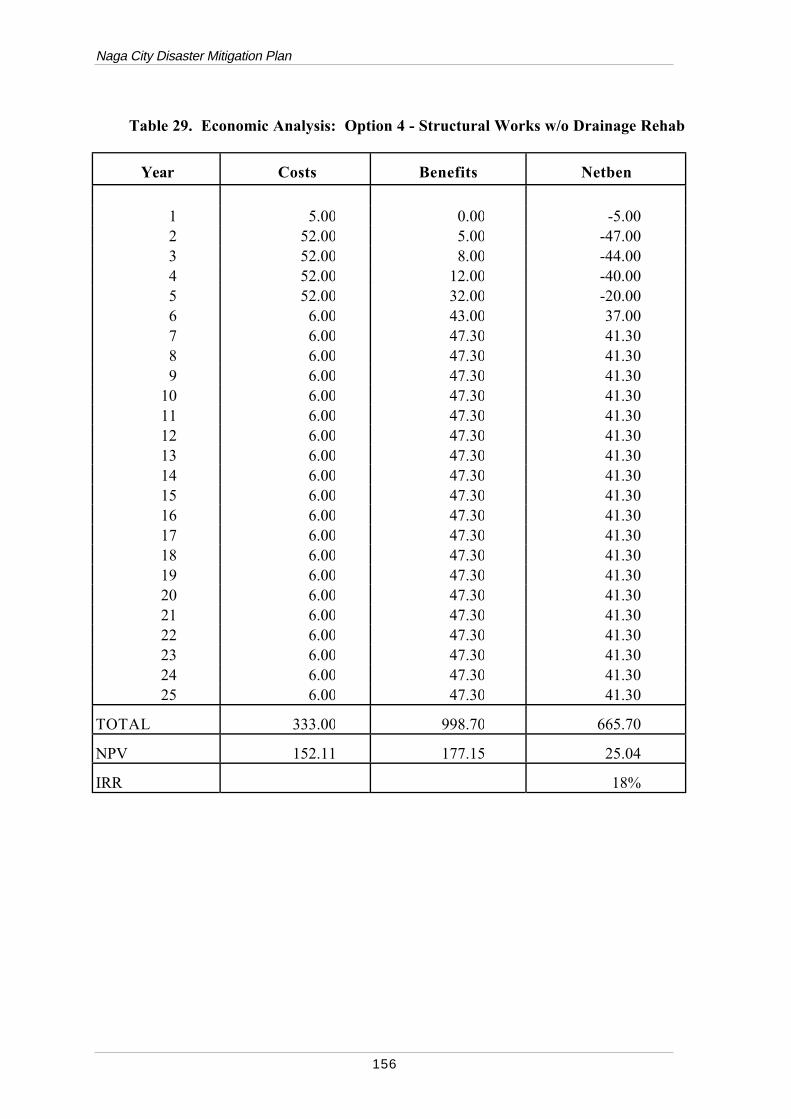
Naga City Disaster Mitigation Plan
156
Table 29. Economic Analysis: Option 4 - Structural Works w/o Drainage Rehab
Year Costs Benefits Netben
1 5.00 0.00 -5.002 52.00 5.00 -47.003 52.00 8.00 -44.004 52.00 12.00 -40.005 52.00 32.00 -20.006 6.00 43.00 37.007 6.00 47.30 41.308 6.00 47.30 41.309 6.00 47.30 41.30
10 6.00 47.30 41.3011 6.00 47.30 41.3012 6.00 47.30 41.3013 6.00 47.30 41.3014 6.00 47.30 41.3015 6.00 47.30 41.3016 6.00 47.30 41.3017 6.00 47.30 41.3018 6.00 47.30 41.3019 6.00 47.30 41.3020 6.00 47.30 41.3021 6.00 47.30 41.3022 6.00 47.30 41.3023 6.00 47.30 41.3024 6.00 47.30 41.3025 6.00 47.30 41.30
TOTAL 333.00 998.70 665.70
NPV 152.11 177.15 25.04
IRR 18%

Project Contacts
For further information about this paper or the Kathmandu Valley EarthquakeRisk Management Project, please contact:
1. Mr.N.M.S.I. ArambepolaDeputy Program ManagerAsian Urban Disaster Mitigation ProgramAsian Disaster Preparedness CenterP.O. Box 4, Klong LuanngPathumthani 12120, THAILANDTel: (66-2) 524-5354Fax: (66-2) 524-5350Email: [email protected]: http:://www.adpc.ait.ac.th
2. Mr.Ernesto ElcamelProject Development OfficerOffice of the City MayorCity hall ComplexJ.Miranda Ave., Naga CityPHILIPPINESTel: (63-54) 811-6190Fax: (63-54) 811-1286Email: [email protected]
The Asian Urban Disaster Mitigation Program (AUDMP), launched in 1995, isthe largest regional program of ADPC. The program, with core funding from theOffice of Foreign Disaster Assistance of the United States Agency forInternational Development, will ultimately work in ten or more countries of theregion. The program was designed to make cities safer from disasters. The goalof the AUDMP is to reduce the disaster vulnerability of urban populations,infrastructure, critical facilities and shelter in targeted cities in Asia, and topromote replication and adaptation of successful mitigation measures throughoutthe region. Towards this end, the program develops and supports nationaldemonstration projects, information dissemination and networking activities, andpolicy seminars and professional training in the target countries of Bangladesh,Cambodia, India, Indonesia, Lao PDR, Nepal, Philippines, Sri Lanka, Thailandand Vietnam.
The Asian Disaster Preparedness Center (ADPC) is a regional resource centerdedicated to disaster reduction for safer communities and sustainabledevelopment in Asia and the Pacific. Established in 1986 in Bangkok, Thailand,ADPC is recognized as an important focal point for promoting disaster awarenessand developing capabilities to foster institutionalized disaster management andmitigation policies.
For more information, please get in touch with us at the following address:
Asian Disaster Preparedness Center (ADPC)P.O. Box 4, Klong Luang, Pathumthani 12120, Thailand
Tel.: (66-2) 524-5354Fax: (66-2) 524-5350
E-mail: [email protected]: www.adpc.ait.ac.th