nagios and sec: a happy (re-) union - cs.umb.edurouilj/sec_nagios/nagios_sec_bblisa.pdf• three...
TRANSCRIPT

Nagios and SEC: A Happy (Re-) Union
Presented to: BBLISABy: John Rouillard (rouilj at renesys.com)January 10, 2007
© 2007 J. Rouillard 2
Overview
• Three parts to this presentation• Nagios
• Object definitions• Correlation – parents and others
• SEC – Simple Event Correlator• Rule Types• Time based correlation
• The integration of the two
© 2007 J. Rouillard 3
Nagios
• Active and passive monitoring of services• Runs little programs called plugins to test
services: web, ri, email (sending and receiving), vpn etc.
• Notifies contacts when things aren't working properly
• Provides some limited ability to distinguish actual cause from it's effects
• Provides a web interface to control/display status

© 2007 J. Rouillard 4
Objects
Service• Description• Host/hostgroup• Command
define service{
service_description AtDaemonCheck
host_name server.example.com
hostgroup_name runs_at_servers
use generic-service
check_command check_local_procs!:1!1:!-C atd
}
Host• Name• Address• Hostgroup membership
define host{
host_name server.example.com
alias server
address 192.168.0.222
parents switch1.example.com
use generic-host
hostgroups ping_only,linux_servers,dns_server
}

© 2007 J. Rouillard 5
A Service Template
define service{
name generic-service
register 0
active_checks_enabled 1
passive_checks_enabled 1
parallelize_check 1
check_freshness 0
event_handler_enabled 1
flap_detection_enabled 0
process_perf_data 1
is_volatile 0
max_check_attempts 3
normal_check_interval 3
retry_check_interval 1
check_period 24x7
contact_groups renesys-admins
notifications_enabled 1
notification_interval 60
notification_period 24x7
notification_options w,u,c,r,f
...
}

© 2007 J. Rouillard 6
More objects
Command• Command name• Command line
define command{
command_name check_local_procs
command_line $USER1$/check_procs -w $ARG1$ -c $ARG2$ $ARG3$
}
• Can contain dynamic host data:
define command{
command_name check_ldaps
command_line $USER1$/check_ldaps -p 636 -H `$USER1$/get_custom_attributes $HOSTNAME$ LDAP-CN` $ARG1$
}
define host{
host_name server2.example.com
alias server2
address 192.168.0.19
parents switch2
use generic-host
# custom_macro server2.example.com-LDAP-CN auth.example.com
hostgroups ...}

© 2007 J. Rouillard 7
And yet more objects (last object slide)
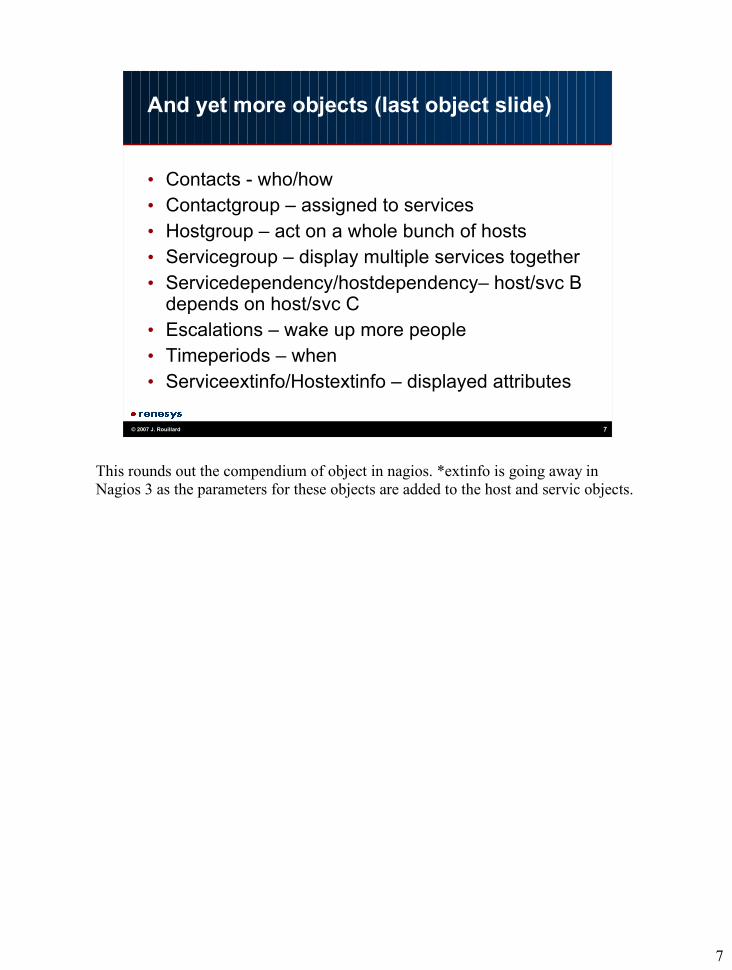
• Contacts - who/how• Contactgroup – assigned to services• Hostgroup – act on a whole bunch of hosts• Servicegroup – display multiple services together• Servicedependency/hostdependency– host/svc B
depends on host/svc C• Escalations – wake up more people• Timeperiods – when• Serviceextinfo/Hostextinfo – displayed attributes

© 2007 J. Rouillard 8
Nagios Correlation
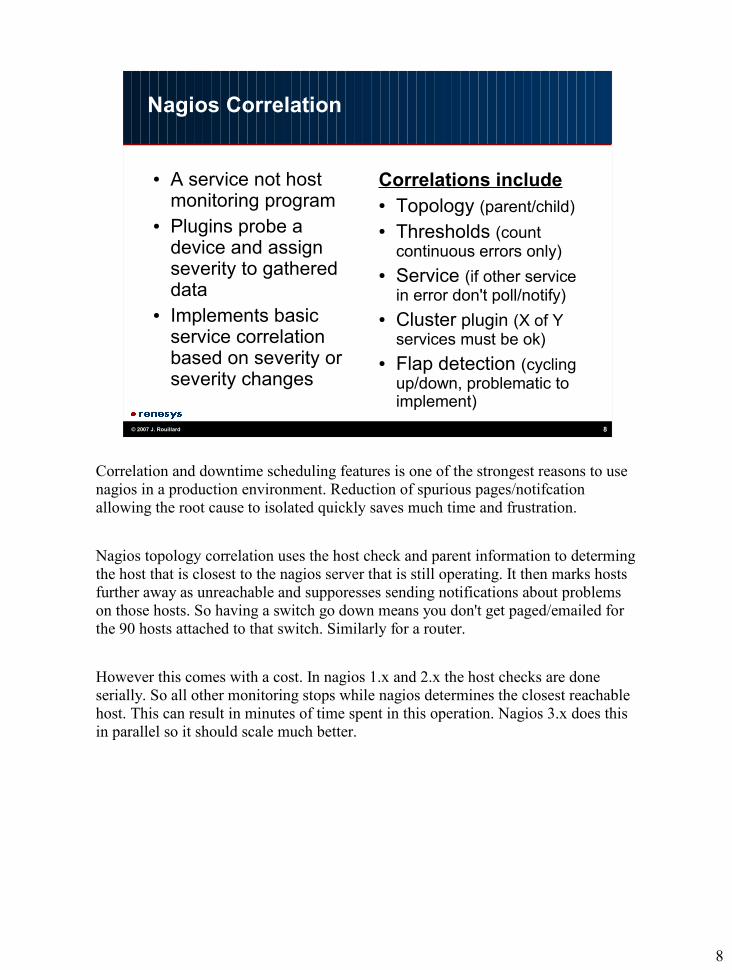
● A service not host monitoring program
● Plugins probe a device and assign severity to gathered data
● Implements basic service correlation based on severity or severity changes
Correlations include● Topology (parent/child)● Thresholds (count
continuous errors only)● Service (if other service
in error don't poll/notify)● Cluster plugin (X of Y
services must be ok)● Flap detection (cycling
up/down, problematic to implement)
© 2007 J. Rouillard 9
Other nagios tricks
• Links to TWiki for a knowledge base for services, hosts, additional commands
• Gui changes for searching services, hosts• Live example (time permitting/interest)

© 2007 J. Rouillard 10
SEC
• Mainly a passive tool that can be used for event/log analysis – responds to externally generated events
• Work in time as well as in “space”. E.G. the client connects to the server and must be responded to in 2 seconds and disconnect in 4 seconds.
• Can code “proper operation fingerprint” and report failures to match the fingerprint.
© 2007 J. Rouillard 11
SEC rules
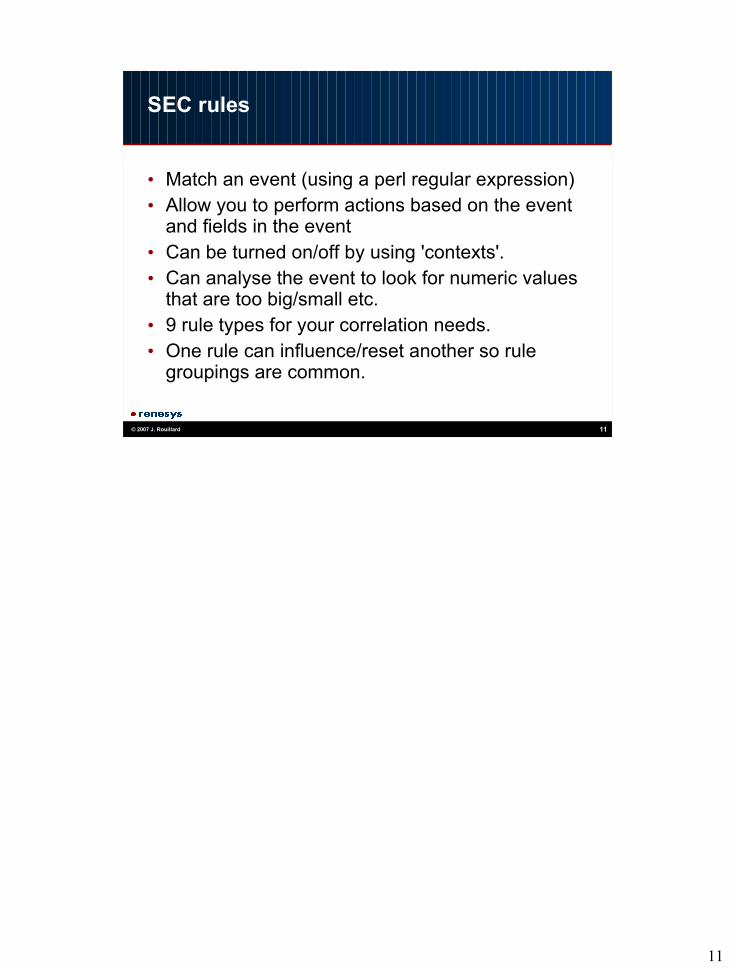
• Match an event (using a perl regular expression)• Allow you to perform actions based on the event
and fields in the event• Can be turned on/off by using 'contexts'.• Can analyse the event to look for numeric values
that are too big/small etc.• 9 rule types for your correlation needs.• One rule can influence/reset another so rule
groupings are common.
© 2007 J. Rouillard 12
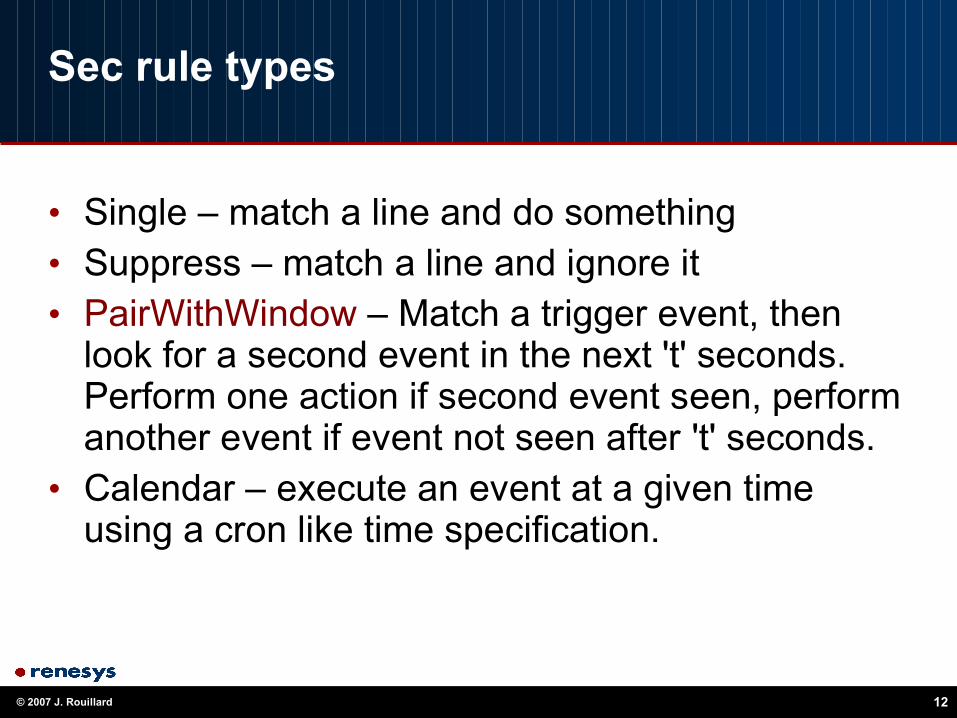
Sec rule types
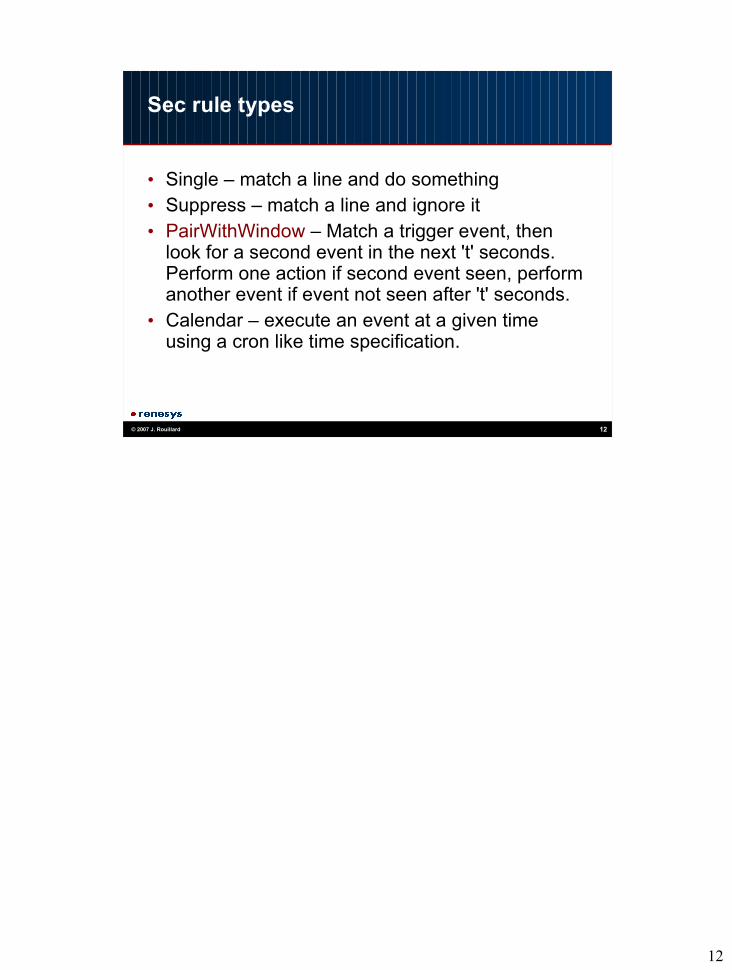
• Single – match a line and do something• Suppress – match a line and ignore it• PairWithWindow – Match a trigger event, then
look for a second event in the next 't' seconds. Perform one action if second event seen, perform another event if event not seen after 't' seconds.
• Calendar – execute an event at a given time using a cron like time specification.

© 2007 J. Rouillard 13
More SEC rules
• SingleWithThreshold – match a line and do something if it occurs enough times in a time window.
• SingleWith2Thresholds – like single with threshold, but rearm only when a second (lower) threshold is satisfied.
• Pair – match a trigger event then match a second event and perform an action
• SingleWithSuppress – suppress an event for some time 't'.

© 2007 J. Rouillard 14
The last SEC rule
• SingleWithScript – match rule, run an external script and perform an action depending on script exit status.
© 2007 J. Rouillard 15
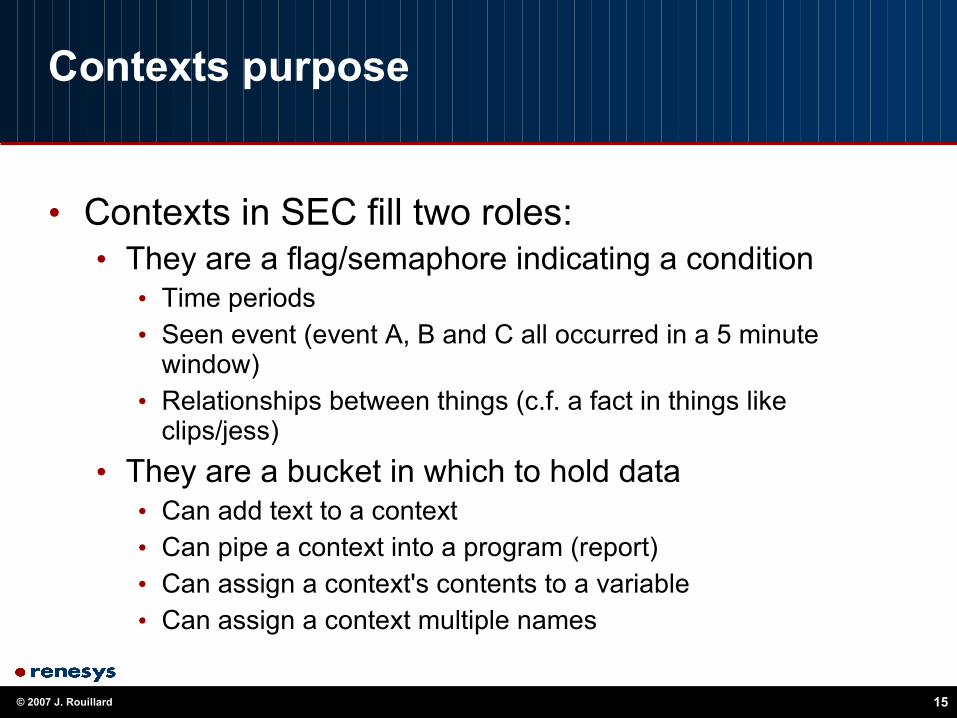
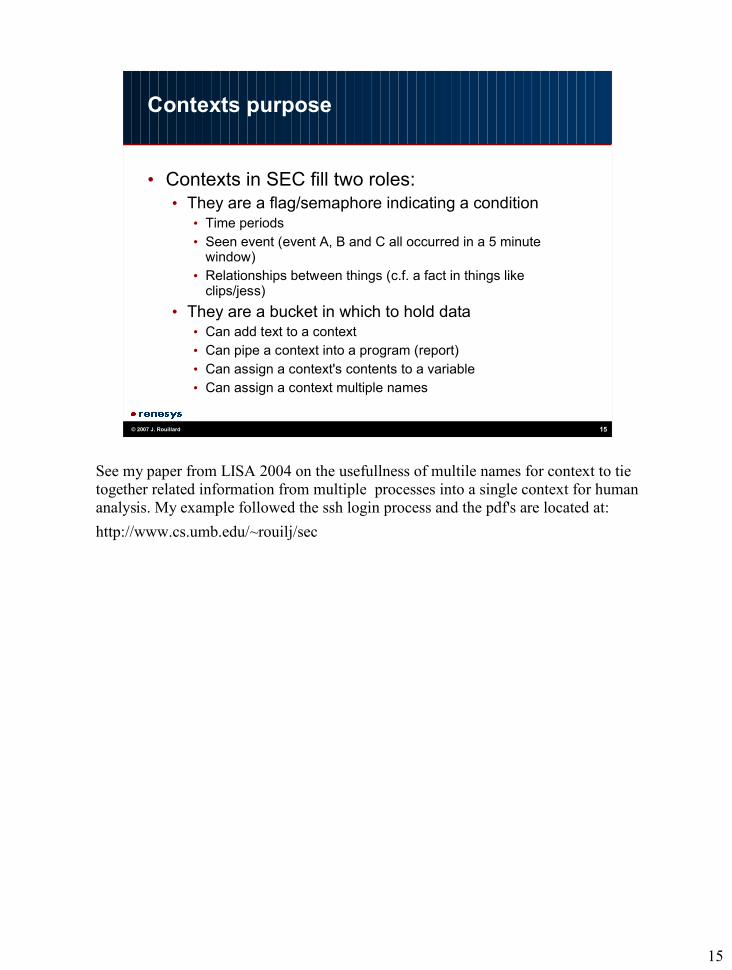
Contexts purpose
• Contexts in SEC fill two roles:• They are a flag/semaphore indicating a condition
• Time periods• Seen event (event A, B and C all occurred in a 5 minute
window)• Relationships between things (c.f. a fact in things like
clips/jess)• They are a bucket in which to hold data
• Can add text to a context• Can pipe a context into a program (report)• Can assign a context's contents to a variable• Can assign a context multiple names
© 2007 J. Rouillard 16
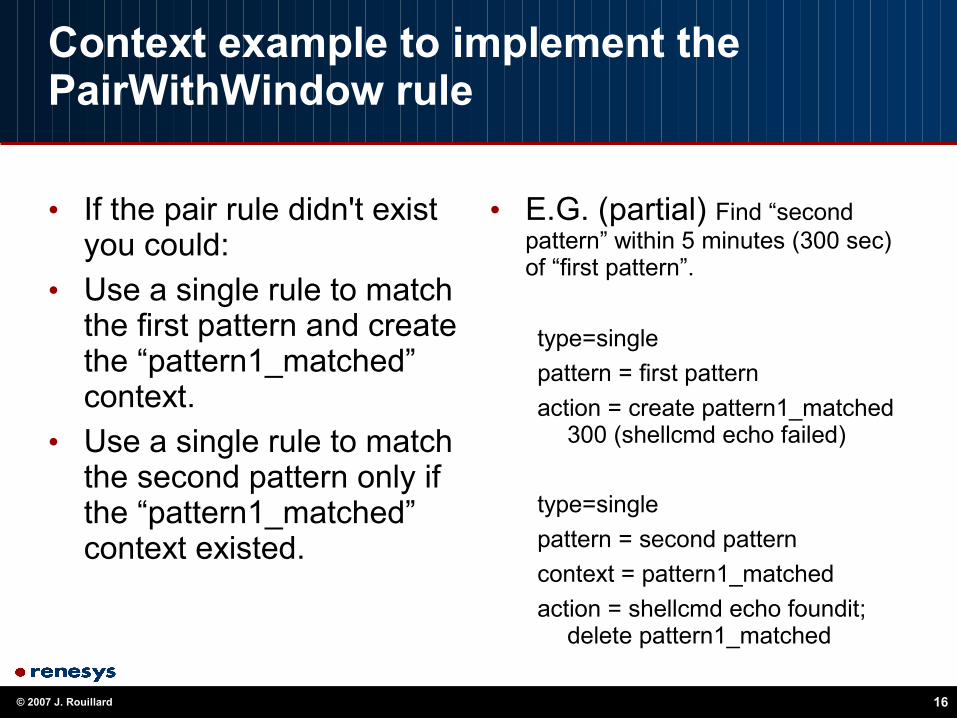
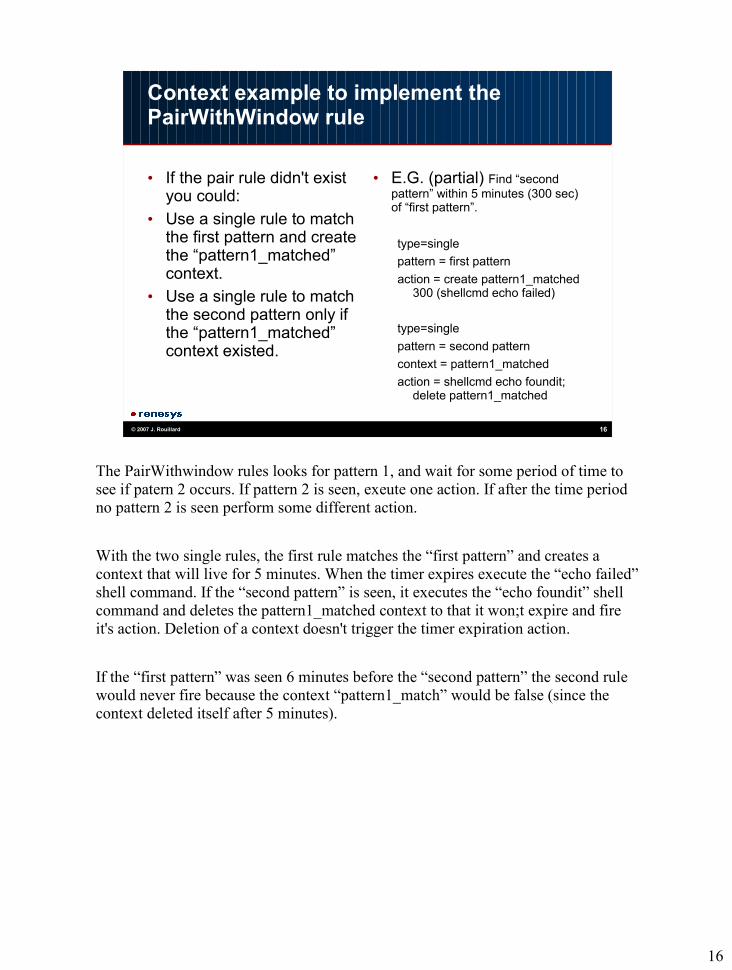
Context example to implement the PairWithWindow rule
• If the pair rule didn't exist you could:
• Use a single rule to match the first pattern and create the “pattern1_matched” context.
• Use a single rule to match the second pattern only if the “pattern1_matched” context existed.
• E.G. (partial) Find “second pattern” within 5 minutes (300 sec) of “first pattern”.
type=singlepattern = first patternaction = create pattern1_matched
300 (shellcmd echo failed)
type=singlepattern = second patterncontext = pattern1_matchedaction = shellcmd echo foundit;
delete pattern1_matched
© 2007 J. Rouillard 17
The Importance of Time
• My company has some very complex processing streams. Data is cooked by multiple processes which must all meet certain time constraints to provide data to our customers.
• Being able to see the current BGP data in 2 hours doesn't help people troubleshooting a problem now.
• Nagios is good at “what is happening now”. Sec is good at “what has been happening and how does it affect now”.

© 2007 J. Rouillard 18
Normal Suppression
• Nagios supplies a simple “now” based dependency mechanism. E.G.• Web server goes down – Nagios reports a problem• Because the web server is down, RT, TWiki, Password
changing apps are down.• Operations needs to receive the page for the web
server down and not all the collateral damage to TWiki, RT etc.
• Isolation of root cause is primary requirement and Nagios can do this since web server and TWiki are down at the same time.
© 2007 J. Rouillard 19
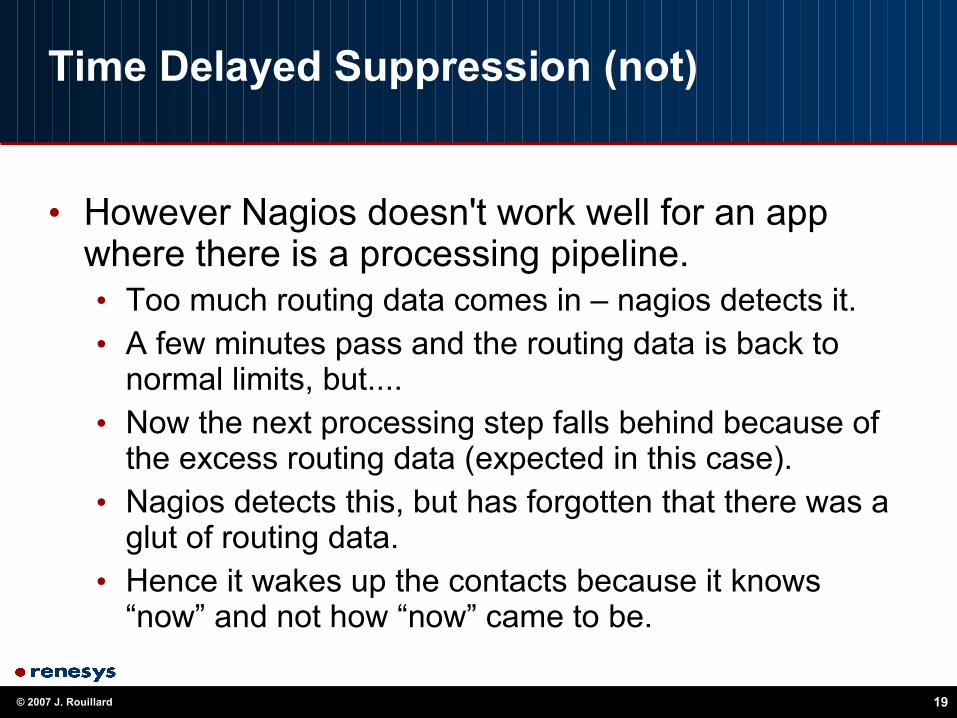
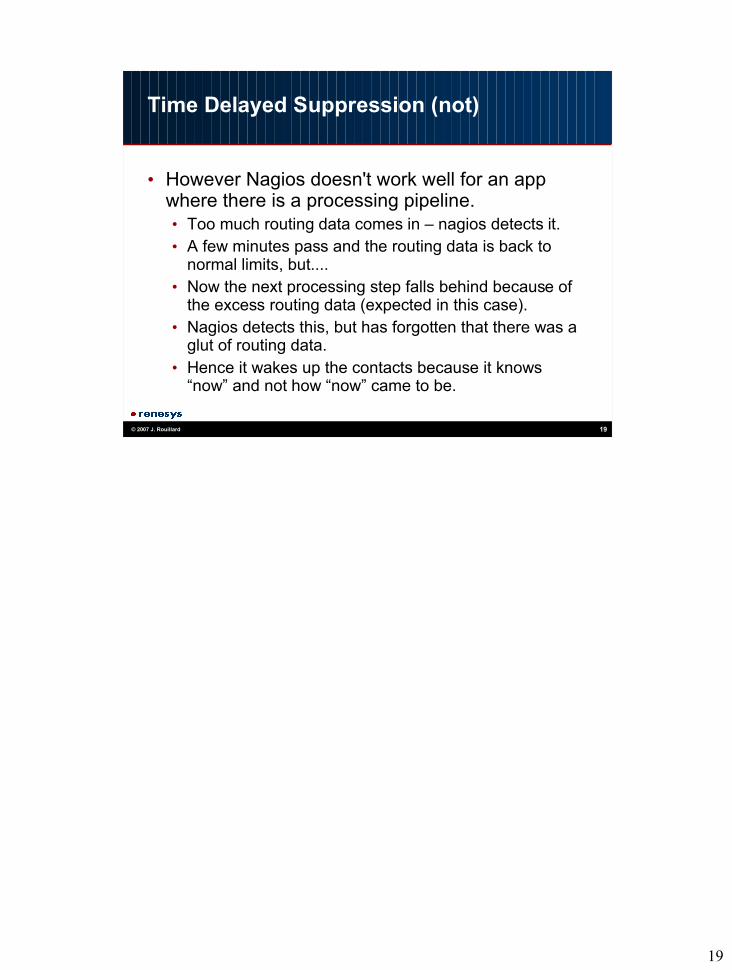
Time Delayed Suppression (not)
• However Nagios doesn't work well for an app where there is a processing pipeline.• Too much routing data comes in – nagios detects it.• A few minutes pass and the routing data is back to
normal limits, but....• Now the next processing step falls behind because of
the excess routing data (expected in this case).• Nagios detects this, but has forgotten that there was a
glut of routing data.• Hence it wakes up the contacts because it knows
“now” and not how “now” came to be.

© 2007 J. Rouillard 20
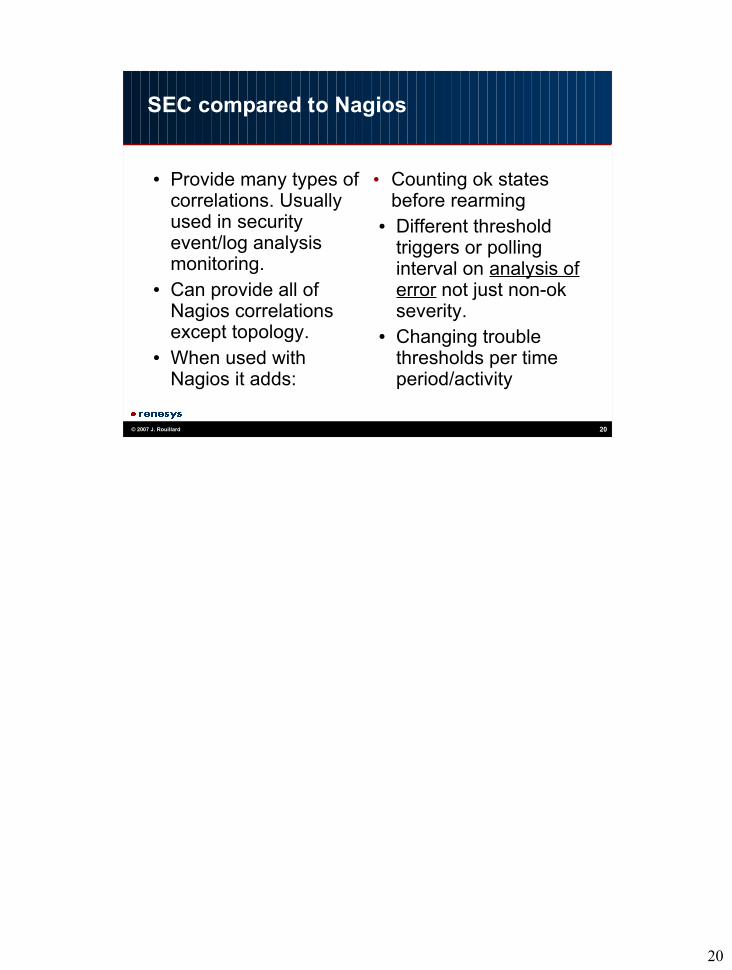
SEC compared to Nagios
● Provide many types of correlations. Usually used in security event/log analysis monitoring.
● Can provide all of Nagios correlations except topology.
● When used with Nagios it adds:
• Counting ok states before rearming
● Different threshold triggers or polling interval on analysis of error not just non-ok severity.
● Changing trouble thresholds per time period/activity
© 2007 J. Rouillard 21
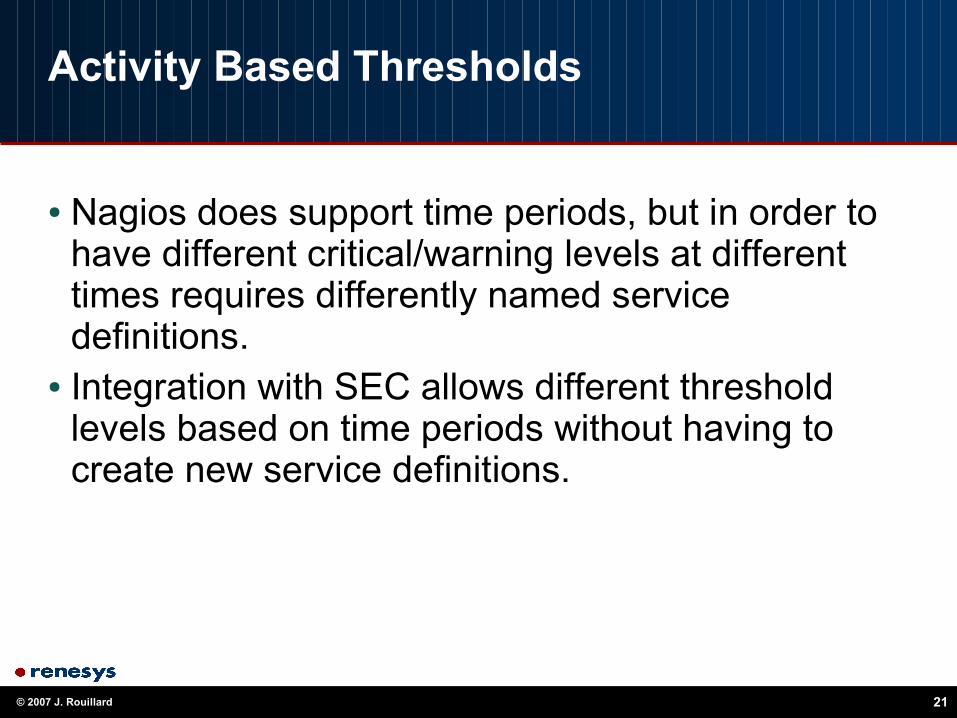
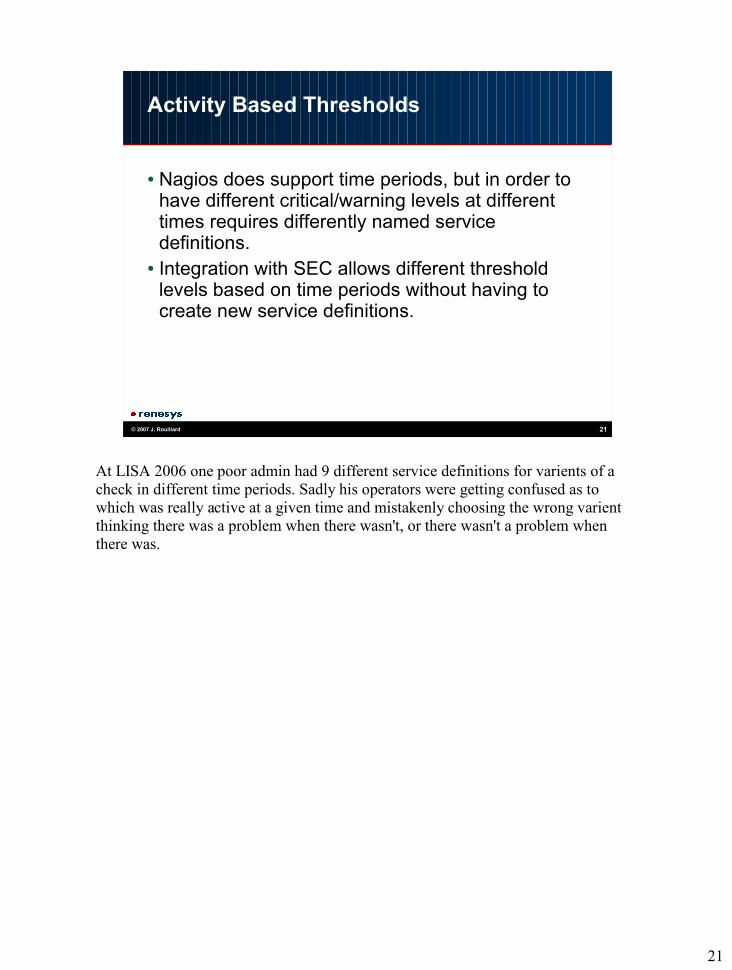
Activity Based Thresholds
● Nagios does support time periods, but in order to have different critical/warning levels at different times requires differently named service definitions.
● Integration with SEC allows different threshold levels based on time periods without having to create new service definitions.

© 2007 J. Rouillard 22
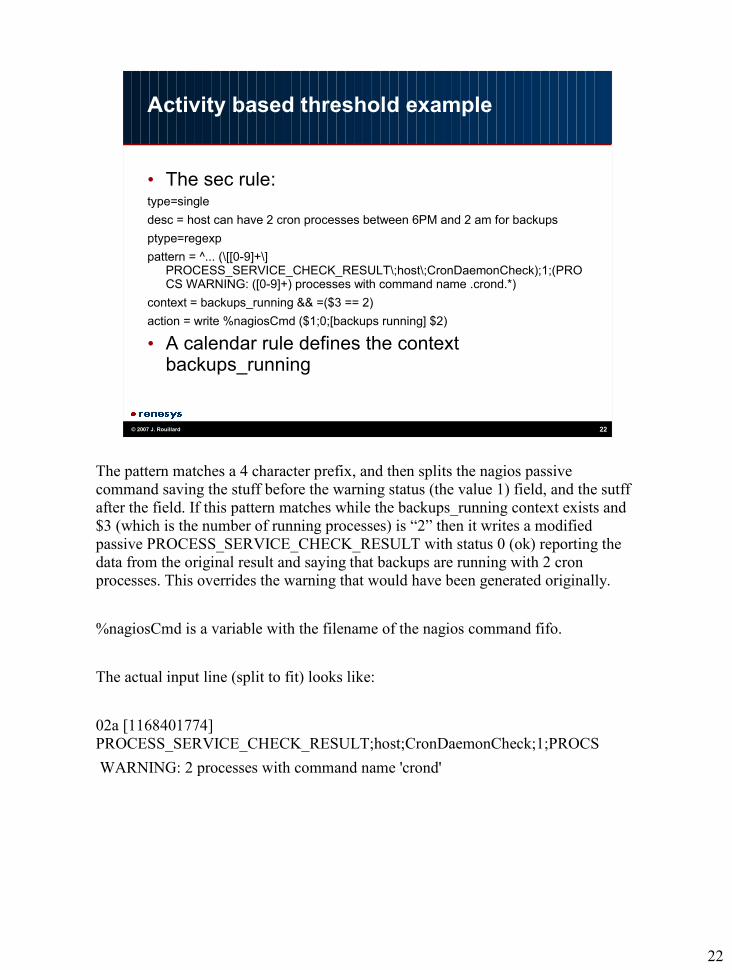
Activity based threshold example
• The sec rule:type=singledesc = host can have 2 cron processes between 6PM and 2 am for backupsptype=regexppattern = ^... (\[[0-9]+\]
PROCESS_SERVICE_CHECK_RESULT\;host\;CronDaemonCheck);1;(PROCS WARNING: ([0-9]+) processes with command name .crond.*)
context = backups_running && =($3 == 2)action = write %nagiosCmd ($1;0;[backups running] $2)
• A calendar rule defines the context backups_running
© 2007 J. Rouillard 23
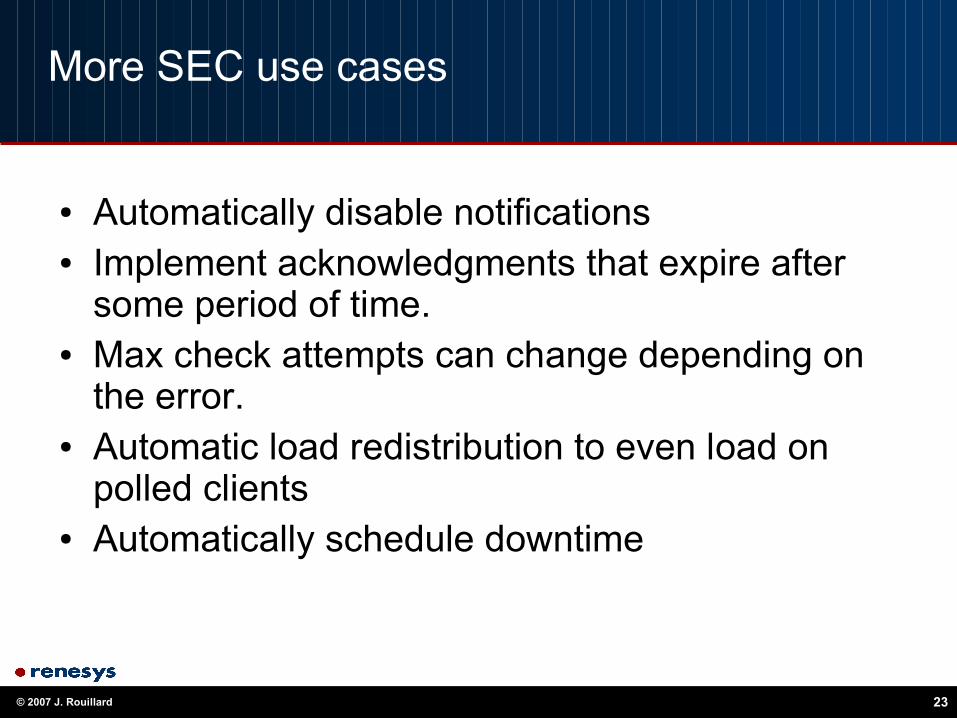
More SEC use cases
● Automatically disable notifications● Implement acknowledgments that expire after
some period of time.● Max check attempts can change depending on
the error.● Automatic load redistribution to even load on
polled clients● Automatically schedule downtime
© 2007 J. Rouillard 24
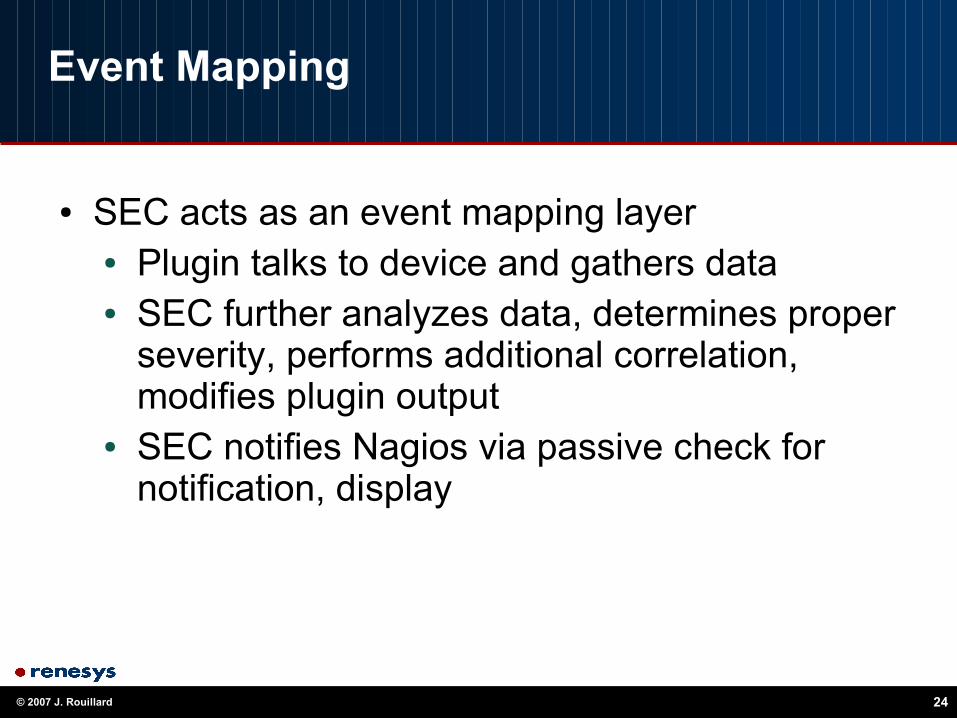
Event Mapping
● SEC acts as an event mapping layer● Plugin talks to device and gathers data● SEC further analyzes data, determines proper
severity, performs additional correlation, modifies plugin output
● SEC notifies Nagios via passive check for notification, display

© 2007 J. Rouillard 25
How to solve the problem?
• We have a mechanism (Nagios) that is not time aware that is good at actively monitoring and reporting on services.
• We have a mechanism (SEC) that is time aware and can determine how we came to a problem.
• If we can get Nagios to send it's monitoring info to SEC then can we get the best of both worlds?
© 2007 J. Rouillard 26
Yes
• I have created a patch to Nagios that allows the active events to be passed through to a SEC process.
• The processed results are then sent back to Nagios for notification and display.

© 2007 J. Rouillard 27
Implementation
● Uses Nagios 2.X event broker● Adds a callback to the core that allows event
broker module to override the plugin assigned severity, replacing with current severity for that service.
● Module can write a Nagios PROCESS_SERVICE_CHECK_RESULT to a file for the external correlator (e.g. SEC) to analyze.
● Two new service object parameters ec_active_action and ec_passive_action control operating mode for each severity.
© 2007 J. Rouillard 28
Operating Modes
● The module operates in one of three modes:1. Pass polled event to Nagios (no external
correlation, current operation)2. Pass unmodified polled event to Nagios and a
copy to SEC3. Pass modified polled event to Nagios changing
severity to current severity and pass a copy to SEC
© 2007 J. Rouillard 29
Current Testing
● Running with 1460 services. SEC uses 0.4% of cpu for processing 9 events/second. 11% of the events are sent back into Nagios. RTT (Nagios -> SEC -> Nagios) 2-10 seconds.
● SEC configuration has 8 rules that split apart every event line. Has 2 event mapping rules to provide more useful output messages and 1 rescheduling rule to distribute polls in time
● SEC also monitors Nagios log file for errors in addition to handling active event stream.
© 2007 J. Rouillard 30
The Future
✔ Need Beta Testers - Beta release in early January 2007
✗ Stop losing events when writing to a FIFO.✔ Command line parser to allow user to set items
such as output mode at module load.✔ Finalize annotation format for events● Have module receive other data from Nagios
(e.g. acknowledgments, host events)● More stress testing● Add a 4th operational mode to stop Nagios
processing of active check result.

© 2007 J. Rouillard 31
Current Status
• This was announced at the LISA 2006 conference in December.
• External beta test (3 sites) was supposed to occur last Friday (1/5/2007), but was delayed.
• It is currently running on a secondary nagios install monitoring the same services as the primary Nagios instance.
• Changes will be released under the GPL the same as Nagios.
32
http://www.renesys.com
• Presented by: John Rouillard (Renesys Corp)
● rouilj at renesys.com● rouilj+ns at cs.umb.edu
1
1
Nagios and SEC: A Happy (Re-) Union
Presented to: BBLISABy: John Rouillard (rouilj at renesys.com)January 10, 2007
For more info about me visit my home page at: http://www.cs.umb.edu/~rouilj
-- rouilj

2
© 2007 J. Rouillard 2
Overview
• Three parts to this presentation• Nagios
• Object definitions• Correlation – parents and others
• SEC – Simple Event Correlator• Rule Types• Time based correlation
• The integration of the two
We will discuss the two components usied in monitoring. By the time I am finished this evening you should be able to read nagios config files and understand what is happening.I will also discuss the use of SEC in event monitoring and how the two can be put together to increase the intellenegence in the monitoing application.
3
© 2007 J. Rouillard 3
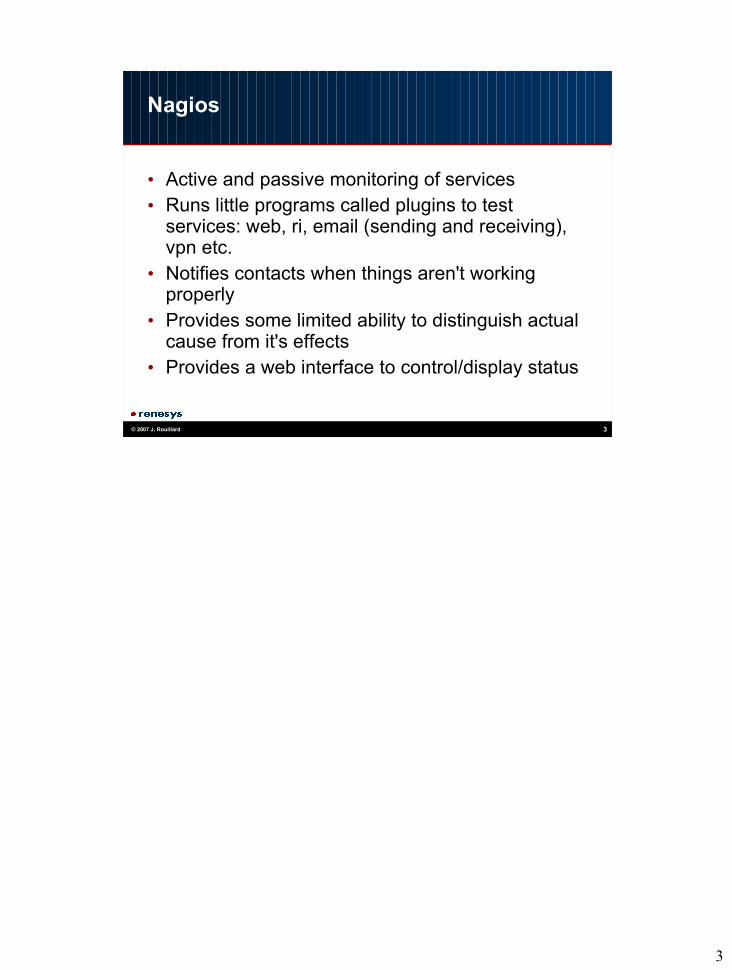
Nagios
• Active and passive monitoring of services• Runs little programs called plugins to test
services: web, ri, email (sending and receiving), vpn etc.
• Notifies contacts when things aren't working properly
• Provides some limited ability to distinguish actual cause from it's effects
• Provides a web interface to control/display status

4
© 2007 J. Rouillard 4
Objects
Service• Description• Host/hostgroup• Command
define service{
service_description AtDaemonCheck
host_name server.example.com
hostgroup_name runs_at_servers
use generic-service
check_command check_local_procs!:1!1:!-C atd
}
Host• Name• Address• Hostgroup membership
define host{
host_name server.example.com
alias server
address 192.168.0.222
parents switch1.example.com
use generic-host
hostgroups ping_only,linux_servers,dns_server
}
The basic monitoring unit in nagios is the service. It has a bunch of parameters, but most are defined using a template like generic service discussed in the next slide,and overridden by later definitions (until nagios 3 you can't undefine a parameter, only change it). Use of a template makes definitions short. Usually services are defined in terms of hostgroups, and not in terms of a host.
The service object check command consists of a command name (defined in a command object) and an ! seperate list of positional arguments to the command.The :1 argument means that any number of atd processes (specified by “-C atd”) greater than 1 is a warning condition. 1: means that anything less than 1 atd is a critical condition. The only way to determine what the positional parameters mean is to look at the command object.
Similar use of a template makes the host definition simple. Hosts have a default check command that is used to determine of the host is up. It is not run except when a service on the host returns a non-ok state. This test is used to detect network/host outages.
5
© 2007 J. Rouillard 5
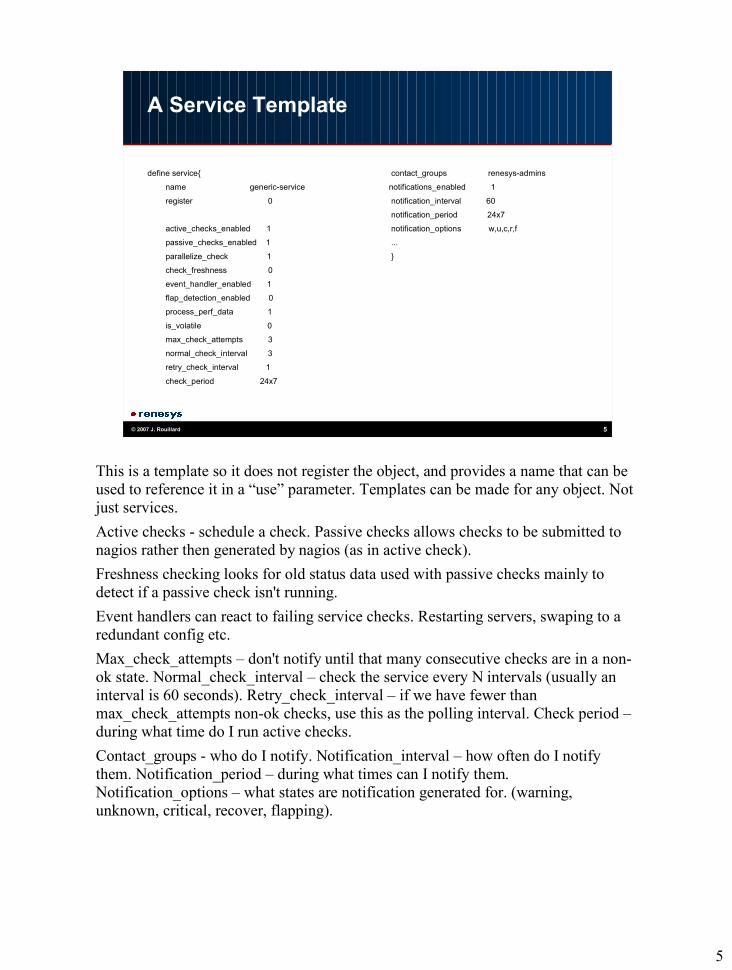
A Service Template
define service{
name generic-service
register 0
active_checks_enabled 1
passive_checks_enabled 1
parallelize_check 1
check_freshness 0
event_handler_enabled 1
flap_detection_enabled 0
process_perf_data 1
is_volatile 0
max_check_attempts 3
normal_check_interval 3
retry_check_interval 1
check_period 24x7
contact_groups renesys-admins
notifications_enabled 1
notification_interval 60
notification_period 24x7
notification_options w,u,c,r,f
...
}
This is a template so it does not register the object, and provides a name that can be used to reference it in a “use” parameter. Templates can be made for any object. Not just services.Active checks - schedule a check. Passive checks allows checks to be submitted to nagios rather then generated by nagios (as in active check).Freshness checking looks for old status data used with passive checks mainly to detect if a passive check isn't running.Event handlers can react to failing service checks. Restarting servers, swaping to a redundant config etc.Max_check_attempts – don't notify until that many consecutive checks are in a non-ok state. Normal_check_interval – check the service every N intervals (usually an interval is 60 seconds). Retry_check_interval – if we have fewer than max_check_attempts non-ok checks, use this as the polling interval. Check period – during what time do I run active checks.Contact_groups - who do I notify. Notification_interval – how often do I notify them. Notification_period – during what times can I notify them. Notification_options – what states are notification generated for. (warning, unknown, critical, recover, flapping).

6
© 2007 J. Rouillard 6
More objects
Command• Command name• Command line
define command{
command_name check_local_procs
command_line $USER1$/check_procs -w $ARG1$ -c $ARG2$ $ARG3$
}
• Can contain dynamic host data:
define command{
command_name check_ldaps
command_line $USER1$/check_ldaps -p 636 -H `$USER1$/get_custom_attributes $HOSTNAME$ LDAP-CN` $ARG1$
}
define host{
host_name server2.example.com
alias server2
address 192.168.0.19
parents switch2
use generic-host
# custom_macro server2.example.com-LDAP-CN auth.example.com
hostgroups ...}
In nagios 3, the host object can be extended with per host variables. The right hand column shows how to do it in nagios versions 1 and 2. A single host may be known under different names, external/internal interfaces, the SSL web interface may have a generic www.example.com name etc.
Using dynamic host data allows a single command object to be used for any host in a single service object. Otherwise multiple service objects (each passing a unique host name) must be used which makes it a mess.
7
© 2007 J. Rouillard 7
And yet more objects (last object slide)
• Contacts - who/how• Contactgroup – assigned to services• Hostgroup – act on a whole bunch of hosts• Servicegroup – display multiple services together• Servicedependency/hostdependency– host/svc B
depends on host/svc C• Escalations – wake up more people• Timeperiods – when• Serviceextinfo/Hostextinfo – displayed attributes
This rounds out the compendium of object in nagios. *extinfo is going away in Nagios 3 as the parameters for these objects are added to the host and servic objects.
8
© 2007 J. Rouillard 8
Nagios Correlation
● A service not host monitoring program
● Plugins probe a device and assign severity to gathered data
● Implements basic service correlation based on severity or severity changes
Correlations include● Topology (parent/child)● Thresholds (count
continuous errors only)● Service (if other service
in error don't poll/notify)● Cluster plugin (X of Y
services must be ok)● Flap detection (cycling
up/down, problematic to implement)
Correlation and downtime scheduling features is one of the strongest reasons to use nagios in a production environment. Reduction of spurious pages/notifcation allowing the root cause to isolated quickly saves much time and frustration.
Nagios topology correlation uses the host check and parent information to determing the host that is closest to the nagios server that is still operating. It then marks hosts further away as unreachable and supporesses sending notifications about problems on those hosts. So having a switch go down means you don't get paged/emailed for the 90 hosts attached to that switch. Similarly for a router.
However this comes with a cost. In nagios 1.x and 2.x the host checks are done serially. So all other monitoring stops while nagios determines the closest reachable host. This can result in minutes of time spent in this operation. Nagios 3.x does this in parallel so it should scale much better.

9
© 2007 J. Rouillard 9
Other nagios tricks
• Links to TWiki for a knowledge base for services, hosts, additional commands
• Gui changes for searching services, hosts• Live example (time permitting/interest)

10
© 2007 J. Rouillard 10
SEC
• Mainly a passive tool that can be used for event/log analysis – responds to externally generated events
• Work in time as well as in “space”. E.G. the client connects to the server and must be responded to in 2 seconds and disconnect in 4 seconds.
• Can code “proper operation fingerprint” and report failures to match the fingerprint.
11
© 2007 J. Rouillard 11
SEC rules
• Match an event (using a perl regular expression)• Allow you to perform actions based on the event
and fields in the event• Can be turned on/off by using 'contexts'.• Can analyse the event to look for numeric values
that are too big/small etc.• 9 rule types for your correlation needs.• One rule can influence/reset another so rule
groupings are common.
12
© 2007 J. Rouillard 12
Sec rule types
• Single – match a line and do something• Suppress – match a line and ignore it• PairWithWindow – Match a trigger event, then
look for a second event in the next 't' seconds. Perform one action if second event seen, perform another event if event not seen after 't' seconds.
• Calendar – execute an event at a given time using a cron like time specification.

13
© 2007 J. Rouillard 13
More SEC rules
• SingleWithThreshold – match a line and do something if it occurs enough times in a time window.
• SingleWith2Thresholds – like single with threshold, but rearm only when a second (lower) threshold is satisfied.
• Pair – match a trigger event then match a second event and perform an action
• SingleWithSuppress – suppress an event for some time 't'.
14
© 2007 J. Rouillard 14
The last SEC rule
• SingleWithScript – match rule, run an external script and perform an action depending on script exit status.
15
© 2007 J. Rouillard 15
Contexts purpose
• Contexts in SEC fill two roles:• They are a flag/semaphore indicating a condition
• Time periods• Seen event (event A, B and C all occurred in a 5 minute
window)• Relationships between things (c.f. a fact in things like
clips/jess)• They are a bucket in which to hold data
• Can add text to a context• Can pipe a context into a program (report)• Can assign a context's contents to a variable• Can assign a context multiple names
See my paper from LISA 2004 on the usefullness of multile names for context to tie together related information from multiple processes into a single context for human analysis. My example followed the ssh login process and the pdf's are located at:http://www.cs.umb.edu/~rouilj/sec
16
© 2007 J. Rouillard 16
Context example to implement the PairWithWindow rule
• If the pair rule didn't exist you could:
• Use a single rule to match the first pattern and create the “pattern1_matched” context.
• Use a single rule to match the second pattern only if the “pattern1_matched” context existed.
• E.G. (partial) Find “second pattern” within 5 minutes (300 sec) of “first pattern”.
type=singlepattern = first patternaction = create pattern1_matched
300 (shellcmd echo failed)
type=singlepattern = second patterncontext = pattern1_matchedaction = shellcmd echo foundit;
delete pattern1_matched
The PairWithwindow rules looks for pattern 1, and wait for some period of time to see if patern 2 occurs. If pattern 2 is seen, exeute one action. If after the time period no pattern 2 is seen perform some different action.
With the two single rules, the first rule matches the “first pattern” and creates a context that will live for 5 minutes. When the timer expires execute the “echo failed” shell command. If the “second pattern” is seen, it executes the “echo foundit” shell command and deletes the pattern1_matched context to that it won;t expire and fire it's action. Deletion of a context doesn't trigger the timer expiration action.
If the “first pattern” was seen 6 minutes before the “second pattern” the second rule would never fire because the context “pattern1_match” would be false (since the context deleted itself after 5 minutes).
17
© 2007 J. Rouillard 17
The Importance of Time
• My company has some very complex processing streams. Data is cooked by multiple processes which must all meet certain time constraints to provide data to our customers.
• Being able to see the current BGP data in 2 hours doesn't help people troubleshooting a problem now.
• Nagios is good at “what is happening now”. Sec is good at “what has been happening and how does it affect now”.

18
© 2007 J. Rouillard 18
Normal Suppression
• Nagios supplies a simple “now” based dependency mechanism. E.G.• Web server goes down – Nagios reports a problem• Because the web server is down, RT, TWiki, Password
changing apps are down.• Operations needs to receive the page for the web
server down and not all the collateral damage to TWiki, RT etc.
• Isolation of root cause is primary requirement and Nagios can do this since web server and TWiki are down at the same time.
19
© 2007 J. Rouillard 19
Time Delayed Suppression (not)
• However Nagios doesn't work well for an app where there is a processing pipeline.• Too much routing data comes in – nagios detects it.• A few minutes pass and the routing data is back to
normal limits, but....• Now the next processing step falls behind because of
the excess routing data (expected in this case).• Nagios detects this, but has forgotten that there was a
glut of routing data.• Hence it wakes up the contacts because it knows
“now” and not how “now” came to be.
20
© 2007 J. Rouillard 20
SEC compared to Nagios
● Provide many types of correlations. Usually used in security event/log analysis monitoring.
● Can provide all of Nagios correlations except topology.
● When used with Nagios it adds:
• Counting ok states before rearming
● Different threshold triggers or polling interval on analysis of error not just non-ok severity.
● Changing trouble thresholds per time period/activity
21
© 2007 J. Rouillard 21
Activity Based Thresholds
● Nagios does support time periods, but in order to have different critical/warning levels at different times requires differently named service definitions.
● Integration with SEC allows different threshold levels based on time periods without having to create new service definitions.
At LISA 2006 one poor admin had 9 different service definitions for varients of a check in different time periods. Sadly his operators were getting confused as to which was really active at a given time and mistakenly choosing the wrong varient thinking there was a problem when there wasn't, or there wasn't a problem when there was.
22
© 2007 J. Rouillard 22
Activity based threshold example
• The sec rule:type=singledesc = host can have 2 cron processes between 6PM and 2 am for backupsptype=regexppattern = ^... (\[[0-9]+\]
PROCESS_SERVICE_CHECK_RESULT\;host\;CronDaemonCheck);1;(PROCS WARNING: ([0-9]+) processes with command name .crond.*)
context = backups_running && =($3 == 2)action = write %nagiosCmd ($1;0;[backups running] $2)
• A calendar rule defines the context backups_running
The pattern matches a 4 character prefix, and then splits the nagios passive command saving the stuff before the warning status (the value 1) field, and the sutff after the field. If this pattern matches while the backups_running context exists and $3 (which is the number of running processes) is “2” then it writes a modified passive PROCESS_SERVICE_CHECK_RESULT with status 0 (ok) reporting the data from the original result and saying that backups are running with 2 cron processes. This overrides the warning that would have been generated originally.
%nagiosCmd is a variable with the filename of the nagios command fifo.
The actual input line (split to fit) looks like:
02a [1168401774] PROCESS_SERVICE_CHECK_RESULT;host;CronDaemonCheck;1;PROCS WARNING: 2 processes with command name 'crond'
23
© 2007 J. Rouillard 23
More SEC use cases
● Automatically disable notifications● Implement acknowledgments that expire after
some period of time.● Max check attempts can change depending on
the error.● Automatic load redistribution to even load on
polled clients● Automatically schedule downtime

24
© 2007 J. Rouillard 24
Event Mapping
● SEC acts as an event mapping layer● Plugin talks to device and gathers data● SEC further analyzes data, determines proper
severity, performs additional correlation, modifies plugin output
● SEC notifies Nagios via passive check for notification, display

25
© 2007 J. Rouillard 25
How to solve the problem?
• We have a mechanism (Nagios) that is not time aware that is good at actively monitoring and reporting on services.
• We have a mechanism (SEC) that is time aware and can determine how we came to a problem.
• If we can get Nagios to send it's monitoring info to SEC then can we get the best of both worlds?

26
© 2007 J. Rouillard 26
Yes
• I have created a patch to Nagios that allows the active events to be passed through to a SEC process.
• The processed results are then sent back to Nagios for notification and display.
27
© 2007 J. Rouillard 27
Implementation
● Uses Nagios 2.X event broker● Adds a callback to the core that allows event
broker module to override the plugin assigned severity, replacing with current severity for that service.
● Module can write a Nagios PROCESS_SERVICE_CHECK_RESULT to a file for the external correlator (e.g. SEC) to analyze.
● Two new service object parameters ec_active_action and ec_passive_action control operating mode for each severity.

28
© 2007 J. Rouillard 28
Operating Modes
● The module operates in one of three modes:1. Pass polled event to Nagios (no external
correlation, current operation)2. Pass unmodified polled event to Nagios and a
copy to SEC3. Pass modified polled event to Nagios changing
severity to current severity and pass a copy to SEC
29
© 2007 J. Rouillard 29
Current Testing
● Running with 1460 services. SEC uses 0.4% of cpu for processing 9 events/second. 11% of the events are sent back into Nagios. RTT (Nagios -> SEC -> Nagios) 2-10 seconds.
● SEC configuration has 8 rules that split apart every event line. Has 2 event mapping rules to provide more useful output messages and 1 rescheduling rule to distribute polls in time
● SEC also monitors Nagios log file for errors in addition to handling active event stream.

30
© 2007 J. Rouillard 30
The Future
✔ Need Beta Testers - Beta release in early January 2007
✗ Stop losing events when writing to a FIFO.✔ Command line parser to allow user to set items
such as output mode at module load.✔ Finalize annotation format for events● Have module receive other data from Nagios
(e.g. acknowledgments, host events)● More stress testing● Add a 4th operational mode to stop Nagios
processing of active check result.
Items with check marks have been done. Items with X's are not going to be done. Items with bullets are still in progress.
final annotation mode is 4 characters: current status of the service (0, 1, 2, 3) mode in which the service event was processed (1, 2, 3 (or 4 when implemented) whether the event was received actively or passively (a or p) a space to seperate the annotation from the nagios commandThe annotation mode is set by an argument to the object file when it is loaded. This allows varients to be used in the future for those who wish to have more info (e.g. polling interval data).
The fourth operation mode has not been started yet, and it is basically a varient of the third mode where: no service is returned to nagios. It is as though nagios never did the poll. The only result of the poll is an event passed to the external correlator.
The advantage of this is that mode three can be confusing. A poll occurs and displays the original output from the plugin on the web gui. Then the correlator changes that and displays some new text. So there is a small period where unprocessed raw plugin output is shown. This flipping can be disconcerting.Mode 4 does away with that as the result of the plugin is never seen unfiltered at the gui.
31
© 2007 J. Rouillard 31
Current Status
• This was announced at the LISA 2006 conference in December.
• External beta test (3 sites) was supposed to occur last Friday (1/5/2007), but was delayed.
• It is currently running on a secondary nagios install monitoring the same services as the primary Nagios instance.
• Changes will be released under the GPL the same as Nagios.
32
32
http://www.renesys.com
• Presented by: John Rouillard (Renesys Corp)
● rouilj at renesys.com● rouilj+ns at cs.umb.edu