nam: a network adaptable middleware to enhance
TRANSCRIPT

NAM: A Network Adaptable Middleware to Enhance
Response Time of Web Services1
S. Ghandeharizadeh, C. Papadopoulos, M. Cai, R. Zhou, P. Pol
Department of Computer Science
University of Southern California
Los Angeles, CA 90089, USA
ABSTRACT:
Web Services are an emerging software technology that are based on the concept of "software
and data as a service". Binary and XML are two popular encoding/decoding mechanisms for
network messages. A Web Service may employ a loss-less compression technique, e.g., Zip,
XMill, etc., to reduce message size prior to its transmission across the network, minimizing its
transmission time. This saving might be outweighed by the overhead of compressing the output
of a Web Service at a server and decompressing it at a client. The primary contribution of this
paper is NAM, a middleware that strikes a compromise between these two factors in order to
enhance response time. NAM decides when to compress data based on the available client and
server processor speeds, and network characteristics. When compared with today's common
practice to transmit the output of a Web Service uncompressed always, our experimental results
show NAM either provides similar or significantly improved response times (at times more than
90% improvement) with Internet connections that offer bandwidths ranging between 80 to 100
Mbps.
KEY WORDS:
Web Services, XML Compression, Response Time, Middleware
1 INTRODUCTION
Many organizations envision web services as an enabling component of Internet-scale computing.
A web service is either a computation or an information service with a published interface. Its
essence is a remote procedure call (RPC) that consumes and processes some input data in order to
produce output data. It is a concept that renders web applications extensible: By identifying each
component of a web application as a web service, an organization may combine these web
services with others to rapidly develop a new web application. The new web application may
consist of web services that span the boundaries of several (if not many) organizations. A final
vision of web services is to realize a dynamic environment that identifies, composes and
integrates web services in response to a query (Ghandeharizadeh et al., 2003a). This is similar to
how a relational database management system identifies and composes the appropriate relational
algebra operator into a query plan to process a SQL command.
The eXtensible Markup Language (XML) produces human-readable text and is emerging as the
standard for data interoperability among web services and cooperative applications that exchange
data. XML is predicted to rise from 3% of global network traffic in 2003 to 24% by 2006 and to
at least 40% by 2008 (Geer, 2005). Well-formed XML documents consist of elements, tags,
attributes, etc., and satisfy precise grammatical rules. The major commercial vendors, e.g.,
Microsoft, IBM, etc., employ XML to publish, invoke, and exchange data between web services.
1 This research was supported in part by an unrestricted cash gift from Microsoft research and a grant from
the National Science Foundation IIS-0307908.

A web service publishes its interface using the Web Service Description Language (WSDL). An
Internet application may invoke a remote web service using the Simple Object Access Protocol
(SOAP). Typically, an invoked web service produces an XML-formatted response.
Binary encoding is an alternative encoding mechanism that produces compact streams for
efficient parsing, which are not human readable. A binary formatted message is typically smaller
than its XML formatted counterpart. This is because XML encoding includes repeated tags, labels
and attributes. One may employ compression in order to reduce the size of both XML and binary
formatted messages.
In this study, we first quantify the performance tradeoff associated with binary and XML
formatters for a decision support benchmark. Next, we analyze the role of compression in
reducing the number of transmitted bytes with each encoding mechanism. With XML, we analyze
two compression schemes: Zip/GZip library and XMill (Liefke and Suciu, 1999). Both employ
techniques based on Lempel-Ziv algorithm (Ziv and Lempel, 1977). Our results demonstrate that
without compression, the XML encoder results in message sizes that are at times five times larger
than their Binary representation. With Zip, compressed XML messages are at most twice the size
of their compressed Binary representation. With XMill, compressed XML messages are at times
smaller than their Zip compressed Binary representation. This trend holds true for large messages
(more than one megabyte). Otherwise, Zip compressed Binary messages are smaller. The key
difference is that XMill employs the semantic information provided by XML tags to (a) group
data items with related meaning into containers and, (b) compresses each container
independently (Liefke and Suciu, 1999). This column-wise compression is generally better than
row-wise compression (Iyer and Wilhite, 1994) for large message sizes.
The primary contribution of this paper is Network Adaptable Middleware (NAM) designed with
the objective to enhance response time2 by trading CPU time for network transmission time.
NAM is divided into a client and a server component and is designed to scale in environments
consisting of millions of clients that invoke a single web service. If a web service is standalone
and does not depend on another web service, denoted WSS, it is configured with NAM's server
component. Otherwise, a web service plays dual roles of being a client of one or more web
services and a server for others, denoted WSSC, and is configured with both the client and server
components. NAM's components might be included as libraries of a software development
environment such as Microsoft's .NET in order to be deployed seamlessly when a web service is
deployed.
Compression techniques are a plug-in module for NAM’s components. In addition to Zip/GZip
and XMill, NAM may employ other XML compression techniques such as multiplexed
hierarchical PPM (Cheney 2001) and differential encoding (Werner and Buschmann 2004). This
study does not compare alternative compression techniques. Instead, it strives to demonstrate
feasibility of a middleware, namely NAM, to selectively use a compression technique to enhance
response time of Web Services that employ primitives of a programming language. Section 6
discusses attachments such as images.
Our experimental results from both an Internet and intranet deployments of NAM demonstrate its
feasibility. NAM readily adapts to its environment to use the appropriate transmission paradigm
to minimize response time. Experimental results in Section 4 demonstrate that NAM provides
significant savings compared to uncompressed transmission, representative of today's
deployments, with bandwidths in the order of tens of Mbps.
2 One may also employ NAM as a stack layer in frameworks such as FALCON (Shek et al., 1996)
The rest of this paper is organized as follows. Section 2 presents alternative encoding
mechanisms. In Section 3, we provide an overview of NAM and its components. Section 4
presents an experimental evaluation of NAM. We survey related research in Section 5. Brief
conclusions and future research directions are contained in Section 6.
2 BINARY AND XML FORMATTERS WITH
ALTERNATIVE COMPRESSION TECHNIQUES
In this section, we analyze the performance of alternative compression techniques for binary and
XML formatters. We quantified the performance of alternative transmission protocols using TPC-
H benchmark (Poess and Floyd, 2000) because it is a standard that provides documented queries
and data sets. This enables others to re-create our experiments. TPC-H includes both retrieval and
refresh queries. The refresh commands generate large requests and small responses. The retrieval
queries offer a mix of commands that generate either (a) large requests and small responses, and
(b) large requests and large responses. This motivated us to focus on retrieval queries and ignore
refresh queries from further consideration. We report on 21 out of 22 queries because we could
not implement query 15 in a timely manner.
Our hardware platform consists of two PCs. One is a server and the other is a client. (We analyze
results with PCs configured with four different processor speeds: 450 MHz, 1 GHz, 2 GHz and
3.06 GHz.) The client and server were connected using a LINKSYS Ethernet (10/100 megabit per
second, mbps) switch. Each machine is configured with a 20-gigabyte internal disk, 512
megabytes of memory (unless specified otherwise), and a 100 mbps network interface card. The
server is configured with Microsoft Windows 2000 Server, SQL Server 2000, and Visual
Studio .NET Beta 2 release. The client is configured with Microsoft Windows 2000 Professional
and Visual Studio .NET Beta 2 release. The server implements a web service that accepts one
TPC-H retrieval query, processes the query using ADO.NET, and returns the obtained results
back to the client. The client employs a TPC-H provided component that generates SQL retrieval
query strings, invokes the server’s web service, and receives the obtained results.
The communication between the client and server uses the .NET Remoting framework. For
transmission, we use the TCP and HTTP channels provided with the .NET framework. For
message formatting we use the SOAP (Box et al., 2000) and Binary formatters provided with
the .NET framework. We extended this framework with two new formatters: a) compression
using Zip/GZip library written entirely in C#, and b) XMill compression scheme (Liefke and
Suciu, 1999). XMill employs zlib, the library function for gzip. We modified XMill to consume
its input from buffers (instead of a file). This framework configures channels and encoders
without requiring modification of the application code. When performing our experiments, our
system reconfigures at runtime to repeat a query workload while communicating over different
channels with different encoders. All of our experiments were conducted in a single user mode
with no background load on the underlying hardware. The client was configured to invoke the
web service in an asynchronous manner.
2.1 A Comparison
We used a 1 Gigabyte TPC-H database for evaluation purposes. The presented results ignore the
query execution time. They pertain to only the encoding, transmission, and decoding times for
processing a query. Different TPC-H queries produce a different amount of data. With the binary
formatter, the message sizes vary from a few hundred bytes to a few megabytes. With the XML

formatter, the message varies from a few hundred bytes to tens of megabytes. The server
produces the largest volume of data for Query 10, approximately 25 megabytes of data with XML.
A compression scheme such as Zip can be applied to both the Binary and XML formatters. XMill
compresses XML data using its semantics. Figure 1 shows a comparison of these alternatives
using Zip compressed Binary (Zip-Binary) messages as a yardstick. The y-axis of this figure
shows the ratio in size between a technique such as XMill-XML and Zip-Binary. For example,
with Query 1, Zip-XML messages are 1.5 times larger than their Zip-Binary counterparts. A y-
axis value less than 1.0 implies a smaller message size relative to Zip-Binary. XMill compressed
XML (XMill-XML) produce smaller messages than Zip-Binary, i.e., 0.84 times the size with
Query 2. In our experiments, in the worst-case scenario, Zip compressed XML (Zip-XML)
messages are twice the size of Zip-Binary messages, see Figure 1. In the best case, they are
approximately the same size. This is because a loss-less compression technique can effectively
compress the repeated XML tags. To illustrate, Figure 2 shows the compression factor for Zip-
XML, and XMill-XML. In general, compression factor is higher with XML. With Binary,
compression factor ranges from 1.4 to 5.5. With XML, the Zip compression factor ranges from
2.1 to 19.6. With XMill, the compression factor is as high as 26 with query 16.
Figure 1: Comparison of XML and Binary message sizes with and without compression

Figure 2: Impact of compression on each encoding scheme
Figure 1 shows that XMill-XML messages are at times smaller than Zip-Binary messages, e.g.,
see query 2. This is because XMill groups data items with related meaning into containers and
compresses each independently (Liefke and Suciu, 1999). This column-wise compression is
generally better than row-wise compression (Iyer and Wilhite, 1994). At the same time, Figures 1
and 2 show XMill is not always superior to Zip compression technique for XML messages, e.g.,
queries 1, 4, 5, 6, 7, 8, 12, 13, 14, 17, 18, 19 and 22. Generally speaking, when compared with
Zip, XMill is more effective with large messages. The aforementioned queries transmit fewer
than 9000 bytes. With the remaining queries that produce XML messages that are tens of
thousands of bytes in size, XMill outperforms Zip.
Zip Compression XMill Compression
Query MSG MSG Comp Comp Decomp Msg Comp Comp Decomp
size size Factor Time (ms) Time (ms) size Factor Time (ms) Time (ms)
Q14 591 254 2.3 0.66 0.07 314 1.88 1.76 0.68
Q19 594 257 2.3 0.66 0.08 316 1.88 1.73 0.66
Q17 595 258 2.3 0.68 0.07 318 1.87 1.73 0.66
Q6 596 259 2.3 0.67 0.08 319 1.87 1.74 0.63
Q8 819 282 2.9 0.68 0.08 344 2.38 1.78 0.64
QS (Q12) 929 303 3.1 0.68 0.07 358 2.6 1.78 0.7
Q4 1509 373 4 0.71 0.09 421 3.59 1.84 0.67
Q5 1618 405 4 0.72 0.09 460 3.52 1.83 0.68
Q7 1848 395 4.7 0.72 0.09 455 4.07 1.86 0.69
Q22 2172 428 5.1 0.74 0.1 481 4.52 1.9 0.76

Q1 2863 600 4.8 0.82 0.13 643 4.45 2.04 0.78
Q18 4315 669 6.5 0.82 0.15 714 6.05 2.08 0.83
Q13 8067 765 10.6 0.93 0.16 701 11.51 2.42 0.98
QM (Q20) 46,219 6,766 6.8 2.8 0.85 5,962 7.75 9.54 3.04
Q9 49209 4172 11.8 2.73 0.77 3425 14.37 10.24 3.22
Q21 90861 5427 16.7 4.07 1.77 4121 22.05 14.63 6.06
Q11 186133 16104 11.6 8.68 3.35 12106 15.38 23.75 11.51
Q2 329086 45949 7.2 23.53 9.23 36032 9.13 53.17 22.52
QL (Q3) 3,513,484 243,912 14.4 146.4 55.32 199,671 17.6 356.54 173.1
Q16 6020556 305290 19.7 237.41 92.6 226890 26.54 629.44 308.27
QH (Q10) 25,927,167 4,166,404 6.2 1,493.00 569 3,259,501 7.95 2,916.60 1273.3
Table 1: Compression and decompression times using a 3.06 GHz processor. The query id in
parentheses denotes the TPC-H query used as a representative of a category. The granularity of
reported message size and times are in bytes and ms, respectively.
We analyzed the performance of Zip and XMill with these query classes as a function of different
processor speeds: 450 MHz, 1 GHz, 2 GHz, and 3.06 GHz. Table 1 shows these numbers for all
TPC-H queries (1 Gigabyte database size) with a 3.06 GHz PC. (We refer the interested reader
to (Cai et al., 2002) (Ghandeharizadeh et al., 2002) for tables showing these number for different
processor speeds.) Table 1 shows three important observations. First, the compression factor does
not necessarily increase as a function of message size. Second, XMill yields more compact
messages when compared with Zip for messages larger than 1 KB. Third, XMill is more time
consuming than Zip.

Figure 3: Speedup of compression and decompression times for TPC-H Query 13 as a function of
processor speed.
It is also important to note that compression and decompression times do not scale linearly as a
function of processor speeds. In Figure 3, we show the speedup observed with one TPC-H query
(Q13) as a function of different processor speeds. The break-down is applied to both compression
and decompression times of Zip and XMill. Similar trends hold for other TPC-H queries. In
particular, no query observes a linear speedup as a function of processor speed.
By studying the performance of alternative compression techniques, we found we can design a
"Middleware", which serves as an intermediary between the underlying network protocol and the
cooperative applications, to enhance response time for Web Services. This middleware analyzes
the characteristics of the underlying network and the transmitted data to render intelligent
decisions. We presented this "Network Adaptable Middleware" in the next section.
3 NAM
NAM consists of a server and a client component, denoted NAMS and NAMC respectively. NAMC
constructs and maintains (a) a profile of messages processed by a client, namely, the time
required to decompress a message, and b) a profile of network round-trip-time and loss rate for
each contacted server. NAMS maintains a profile of the time required to compress a message.
Profiles gathered by both NAMS and NAMC are maintained in a persistent manner to ensure their
cumulative growth in the presence of shutdowns, power failures, etc.
The primary advantages of maintaining the profile at the client are: a) the client may customize its
estimator based on the characteristics of its hardware and statistical peculiarities of its requested
data; b) the server is freed to support millions of clients without incurring the overhead of
maintaining a decompression profile on behalf of each client. A drawback of this approach is the
extra CPU overhead and storage required at a client to maintain the profile, which maybe
significant for small, mobile devices. As detailed in Section 3.1, one may use regression in order
to maintain a compact representation of these profiles, in the order of tens of bytes. Moreover, the
CPU overhead is negligible for clients that perform decompression and retrieve and process tens
of thousands of bytes of data. Experimental results of Section 4 show the benefits of NAM
significantly outweigh these overheads.
A web service configured with NAM (acting either as a WSS or WSSC) continues to inter-operate
with legacy clients and Web Services not configured with NAM. This is supported as follows.
When a client configured with NAMC (say a WSSC) invokes a remote web service, its SOAP
header includes a flag (along with several other tagged data items required by NAM) denoting the
presence of NAM. If the referenced web service is not configured with NAMS, it ignores this flag
and provides an uncompressed output always. If the service is configured with NAM (say it is a
WSS), it utilizes this flag to transmit its output in either a compressed or an uncompressed manner.
If a NAM web service receives a SOAP header without the NAM flag, it assumes the client is not
configured with NAM and produces an uncompressed reply. To simplify discussion, and without
loss of generality, we assume an environment that consists of two web services, a WSS and a WSSC,
configured with NAM. The WSSC invokes remote methods published by WSS.
NAMS (byte[ ] M, Client WSSC) {
S = M.Length();
SC = Estimate size of M in compressed form;

TComp = Estimate time to compress M at server;
TDecomp = Estimate time to decompress M at WSSC;
Estimate network round-trip time RTT and loss rate p for network connection between server
and WSSC;
RTU = transmission time (S, RTT, p);
RTC = transmission time (SC, RTT, p) + TComp + TDecomp;
if (RTU < RTC) then "transmit uncompressed";
else "compress and then transmit";
}
Figure 4: Pseudo-code of NAM, a network adaptable middleware
Figure 4 shows the pseudo-code for NAMS. It consists of a collection of estimation techniques in
order to render a decision quickly. When WSS produces a response M to a request issued by a
WSSC, it invokes this pseudo-code with the byte array corresponding to M and WSSC's SOAP
header. NAMS estimates: a) the size of this message once compressed, b) the time required to
compress this message, c) the time to decompress this message at the client, WSSC, and d) the
network characteristics.
Next, NAMS employs an analytical model of the underlying network protocol to estimate
transmission time with the estimated network characteristics for a given a message size. If the
estimated response time using a compression technique is better than an uncompressed
transmission then NAM compresses the message and transmits it. Otherwise, the message is
transmitted in uncompressed format. If NAMS includes several compression techniques then it
must estimate response time with each and choose the one with the best response time. This
trivial extension is not shown in Figure 4.
In Section 3.1, we describe a general purpose technique to estimate compressed message size,
compression time, and decompression time as a function of message size. Next, Section 3.2
describes how NAM estimates network transmission time. This model is specific to the TCP
protocol (Postel, 1981). The overall performance of NAM is dependent on the accuracy of these
estimation techniques.
Term Definition
NAMS Server component of NAM.
NAMC Client component of NAM.
WSS A Web Service that is not dependent on other Web Services, configured with NAMS only.
WSSC A Web Service that depends on other Web Services, configured with both NAMS and NAMC.
Table 2: Terms and their definitions
3.1 Regression to Estimate Compression Time and Compressed Message Size
This section describes a generic technique to estimate compression time, decompression time and
compressed message size for a given message. Of course, there are many ways to perform this
estimation and one may develop and deploy an application specific approach. NAM is envisioned
as a collection of different plug-and-play components, enabling an application developer to
replace our generic technique with their own specific model. Section 4 shows the tradeoff
associated with using our generic approach and how it impacts NAM's decisions.
We utilize a generic polynomial regression technique to detect a curvilinear function between a
message size and (a) its compressed message size, (b) compression time, and (c) decompression
time. In the following, we provide an overview of polynomial regression and its alternative
models. The key advantage of regression is that it represents a large sample set with a finite set of

variables. NAMC computes the coefficients of a regression model for decompression time and
transmits it to NAMS to estimate the decompression time of a message at the client.
Polynomial regression computes the relationship (such as linear, exponential, logarithmic, etc.,)
between a dependent variable (say y) and an independent variable (say x). Based on Taylor
approximation, if the original functions are difficult or impossible to evaluate directly, the partial
sums of the corresponding infinite series is polynomials and can be evaluated as follows:
0 1
0
( ) ( ) ... ( ) ...i n
i n
i
y f x a x a a x a x∞
=
= = × = + × + + × +∑
Linear, quadratic and cubic regressions are special cases of this general equation:
Linear regression: y = f(x) = a0 + (a1 ×x)
(1)
Quadratic regression: y = f(x) = a0 + (a1 ×x) + (a2 ×x2)
(2)
Cubic regression: y = f(x) = a0 + (a1 ×x) + (a2 ×x2) + (a3 ×x
3)
(3)
Given n observed samples: {x1, y1}, ..., {xn, yn}, a regression model solves for ai values with the
objective to minimize the sum of difference between the estimated value y′i and its observed value yi, i.e., minimize ∑i=1
n(yi − y′i)2. Conceptually, this is accomplished by computing the partial
derivatives at every point of xi and set its result to zero. With cubic regression, this is realized by
maintaining three matrices, see Figure 5, where Y = X × A. One may solve for matrix A to obtain
the coefficients by computing the inverse of X, i.e., A = X−1 ×Y.
2 3
1 1 1
2 3 4
1 1 1 1
2 3 4 5
1 1 1 1
3 4 5 6
1 1 1 1
n n n
i i ii i i
n n n n
i i i ii i i i
n n n n
i i i ii i i i
n n n n
i i i ii i i i
n x x x
x x x xX
x x x x
x x x x
= = =
= = = =
= = = =
= = = =
=
∑ ∑ ∑∑ ∑ ∑ ∑∑ ∑ ∑ ∑∑ ∑ ∑ ∑
1
1
2
1
3
1
n
ii
n
i ii
n
i ii
n
i ii
y
x yY
x y
x y
=
=
=
=
=
∑∑∑∑
01
11
21
31
n
i
n
i
n
i
n
i
a
aA
a
a
=
=
=
=
=
∑∑∑∑
Figure 5: Matrices maintained in support of Cubic regression.
At run time, the system may accumulate m new samples by maintaining separate X′ and Y′ matrices. The system may add these into the existing X, and Y matrices and solve for a new A
matrix. The space complexity of this approach is the size of matrices and independent of the total
number of samples. Its time complexity is to solve for matrix A: compute the inverse of matrix X
and multiply it by matrix Y.
3.2 Network Models
The network characteristics have a significant impact on the response time associated with
transmitting the output of a web service. The response time depends on network bandwidth,
transmission and propagation delays, loss rate, and the interaction of the transport protocol with
loss. In this paper we focus on the TCP (Postel, 1981) transport protocol because of its wide
spread use.
The main challenge for NAM is to devise mechanisms to estimate the response time of a server
based on information such as round-trip-time (RTT), bandwidth, output size and loss rate. Of
these, only the response size is known, thus the remaining variables must be either measured or

estimated. NAM builds on existing work on TCP modeling. Accurately modeling TCP over a
wide range of network conditions is a challenging issue, and most existing models are constrained
with a strict set of assumptions. TCP modeling is also complicated due to the existence of several
TCP variants, but not all of them are widely deployed. Such variants include TCP SACK (Mathis
et al., 1996), which speeds up loss recovery with selective re-transmission and TCP
Vegas (Brakmo and Peterson, 1977)], which proposes enhanced techniques for congestion
detection. The dominant TCP variant today is TCP Reno (Fall and Floyd, 1996), and thus is the
focus of NAM. As other TCP variants become popular, NAM must be enhanced to accommodate
them.
Several analytical models exist to estimate response time with TCP Reno. These include models
that consider both network loss (Padhye et al., 1998) and no loss (Sikdar et al., 2001)], termed
"LM" (Loss-estimation Model) and "NLM" (No-Loss estimation Model), respectively. We
evaluated these two models with both simulation using ns2 (Fall and Vardhan, 2002) and
experimentation using in a testbed with NIST Net (Carson, 1997). Some of these results are
presented below. In summary, each model has its own strengths and weaknesses: LM is accurate
with long flows but inaccurate with short flows (such as those frequently produced by web
services). NLM is accurate at modeling both short and long flows but inaccurate when flows
experience loss. Finally, both models become less accurate when response time is dominated by
CPU time to transfer data from the user to the kernel space. The two models are presented in
more detail below.
In order to understand TCP's contribution to response time, we first summarize the behavior of
TCP. A TCP connection begins with a three-way handshake, which takes up one round-trip time
(RTT).
For data larger than a single packet, TCP enters the slow start phase, where it increases its
transmission window by one for each received acknowledgment (ACK). In the absence of
delayed ACKs, the receiver sends an ACK for each new packet. If there is no loss, the sender's
window doubles every Round-Trip-Time (RTT) until it reaches a pre-specified limit, termed
maximum window size Wmax, typically bounded by the receiver's socket buffer size. At this point,
the sender enters a steady state and continues to transmit Wmax packets every RTT until the entire
message is transmitted. Therefore in the absence of loss we can use the model described by NLM
(Sikdar et al., 2001) to estimate the transfer time of a message consisting of N packets, denoted by
Ttr, as follows:
2 exp
exp
2 max
max
log
( log 2tr
RTT N if N N
T N NRTT W otherwise
W
× ≤
= − × + +
(4)
where Nexp is the number of packets transmitted during slow start phase, and
exp 2 max max2 log 1N W W= + − .
NAMC maintains a history of measurements with all the recently contacted servers. This history is
kept in a local database, which is consulted before a request is sent to a server. If past experience
has shown the network path to be relatively free of loss, or if the response size is small (a few
packets) then using the above model is reasonable. In our framework, NAMC maintains an
estimate of RTT for each of the corresponding servers. When communicating with a specific
server, NAMC provides its RTT estimate to NAMS as a part of its request (e.g., in a SOAP header).
Note that having NAMC communicate this information to NAMS is more scalable because it frees
the server from maintaining a potentially large database for all its clients. NAMC might estimate
the RTT to NAMS either off-line by using PING, or by monitoring the RTT on recent transactions
with the server, or a combination of these. With PING and low bandwidth connections, e.g., DSL,
Cable Modem, etc., where transmission time of data dominates RTT, we must ensure that the
transmitted ECHO request is padded to the size of a full packet, otherwise, the estimates of
Equation 4 will be inaccurate.
NAM needs additional parameters to estimate response time, such as the maximum TCP window
size and the loss rate. Both reside in the kernel in the TCP protocol control block (a control block
maintains the state the protocol requires for each connection). Currently, there is no interface that
provides these parameters to the application. Work such as Congestion Manager (Andersen et al.,
2000), however, aims to remedy this problem by allowing congestion information to be shared
among all protocols residing on a machine. For our NAM prototype we modified the Linux kernel
to return such information to the application via the getsockopt() system call. This was a simple
modification requiring just a few lines of code.
NLM works well if there is no packet loss. Packet loss in TCP may lead to a timeout, and the
impact on response time is dramatic because it adds idle time and causes the protocol to enter
slow start again. When history indicates that loss is likely during the transmission of a particular
large message, we estimate the network transmission time of message M by using its size,
M.length(), and an estimation of network bandwidth, β(p): M.Length() / β(p). Using the models of (Padhye et al., 1998), the network bandwidth is estimated as:
2max0
2 3( ) min( , min(1,3 ) (1 32 )
3 8
W p pp RTT T p p
RTTβ ≈ + + (5)
where p is the loss probability. Equation 5 is appropriate for bulk transmissions which send a
large amount of data.
6.a Latency = 100 msec 6.b Latency = 1 msec
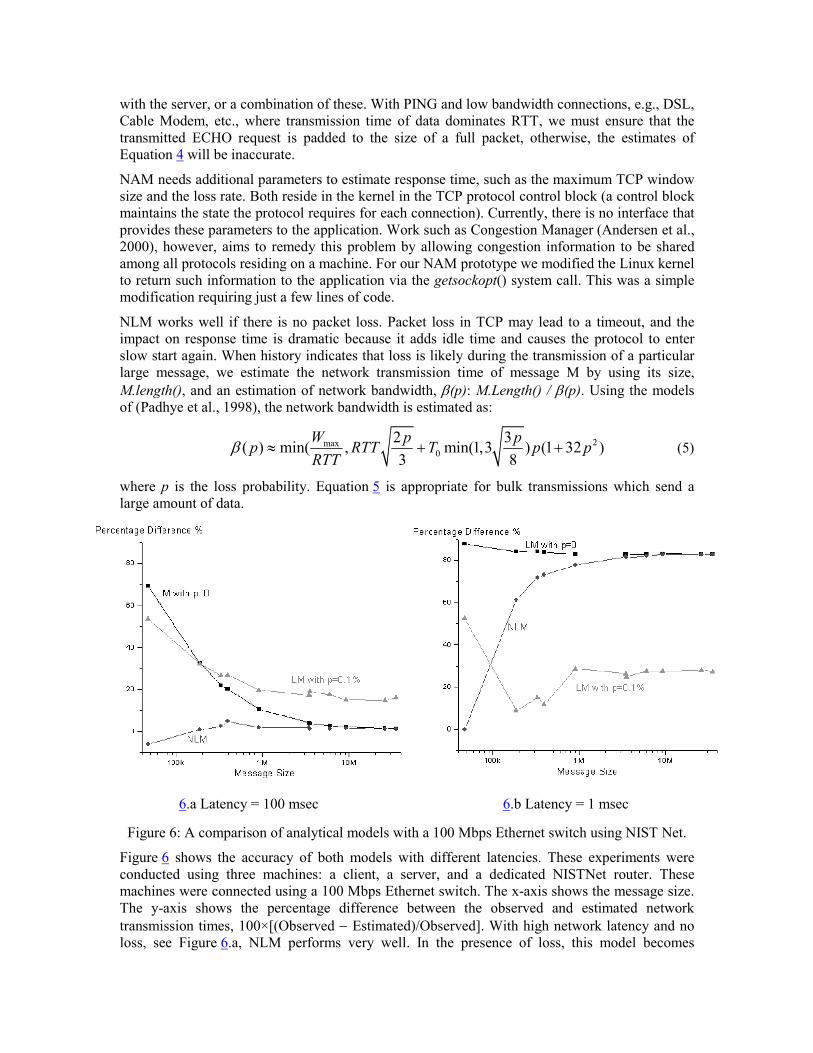
Figure 6: A comparison of analytical models with a 100 Mbps Ethernet switch using NIST Net.
Figure 6 shows the accuracy of both models with different latencies. These experiments were
conducted using three machines: a client, a server, and a dedicated NISTNet router. These
machines were connected using a 100 Mbps Ethernet switch. The x-axis shows the message size.
The y-axis shows the percentage difference between the observed and estimated network
transmission times, 100×[(Observed − Estimated)/Observed]. With high network latency and no
loss, see Figure 6.a, NLM performs very well. In the presence of loss, this model becomes

inaccurate (and eliminated from this presentation). LM does well for large messages (long flows)
with and without loss. With short messages (less than 100 Kilobytes), LM exhibits a high
percentage of error (Padhye et al., 1998).
Figure 7: PING does not take into account the transfer time from user space to kernel space.
Figure 6.b shows the accuracy of each model when network latency is low. With no packet loss,
the observed error was high. The reason is that we estimate RTT using PING. This estimation is
inaccurate because it ignores the time required to transfer data from user space to kernel space,
see Figure 7. This time becomes significant with large messages sizes (100 Kilobyte), resulting in
a high percentage of error. One may enhance the accuracy of these models by requiring NAMC to
maintain the observed RTT for the previous connections with a server. It is important to note that
this correction in RTT will enhance the quality of decisions rendered by NAM, but it does not
impact it greatly, because it is almost always appropriate to transmit messages uncompressed for
environments where RTT is so low that the CPU time or memory transfers become significant.
When the RTT is underestimated, NAM underestimates the total transmission time, motivating it
to transmit data uncompressed.
In light of these results, NAM employs a hybrid model, building on the strengths of both models.
This hybrid model works as follows. For connections were the expected loss is zero (based on
previous statistics), NAM employs NLM. If previous statistics reveal a high likelihood of loss
then NAM employs LM.
4 PERFORMANCE RESULTS OF NAM
We conducted numerous experiments to evaluate the effectiveness of NAM in both a controlled
laboratory setting and over the Internet. The controlled laboratory setting was configured with a
variety of network switches and processor speeds. We used NISTNet (Carson, 1997) to study
NAM with a variety of packet loss and bandwidths. This experimental setup enabled us to study
NAM with speeds up to 1 Gbps. Such bandwidths are expected to become common in the near
future.
Term Range
Low Latency(↓ L) < 20 ms
Moderate Latency(↔ L) 20-100 ms
High Latency( L) > 100 ms
Low Bandwidth(↓ B) < 10 Mbps
Moderate Bandwidth(↔ B) 10-100 Mbps
High Bandwidth( B) > 100 Mbps
Table 3: Bandwidth/Latency Terms and their ranges
We focused on the XML encoding mechanisms in the rest of the paper because most Web
Services employ XML to share and exchange data. As shown in Table 1, we analyzed four

different queries representative of: a) Small queries, denoted QS, with XML formatted result set
sizes equal to or smaller than 1 Kilobyte, b) moderate queries, QM, with result set sizes greater
than or equal to 1 Kilobyte and smaller than 1 Megabyte, c) large queries, QL, with result set sizes
greater than or equal to 1 Megabyte and smaller than 10 Megabytes, and d) huge queries, QH,
with results set sizes greater than 10 Megabytes and smaller than 50 Megabytes. Queries 12, 20, 3,
and 10 were chosen for each category, respectively.
The Internet experiments were conducted using connections between USC and clients at different
academic institutions as well as home clients connected using either DSL/Cable modems or 56
Kbps dial-up modems. These experiments offered a variety of network bandwidths and latencies.
A connection might offer either a low (↓ L), moderate (↔ L), or high ( L) latency. With a given
latency, a connection may offer either a low (↓ B), moderate (↔ B), or high ( B) bandwidth, see
Table 3. This yields nine combinations. This paper describes our observations with five of these,
which were selected to show that NAM is a general purpose technique that adapts to its target
environment and application. NAM's overall behavior is determined by how well regression
model of Section 3.1 and analytical models of Section 3.2 perform their estimations.
The five reported experiments are:
• Southern California, SC↓ L,↔ B: An Internet deployment with a Linux server at USC and a
client at University of California, San Diego. This connection offers typical bandwidth of
90 to 96 Mbps and latency of 3.5 ms (RTT = 7 ms). This is a low latency, moderate
bandwidth experiment.
• US↔ L,↓ B: An Internet deployment with a Linux server at USC (west coast) and ISI at
Washington DC (east coast). The ISI connection is a T1 with typical bandwidth of 1-1.2
Mbps and 45 ms latency (RTT = 90 ms). This experiment represents a moderate latency,
low bandwidth connection.
• US↔ L,↔ B: A coast-to-coast Internet deployment consisting of one machine at University of
Massachusetts at Amherst, and another at USC in Los Angeles. The bandwidth between
USC and UMass is approximately 87 to 96 Mbps with 45 ms latency (RTT = 90 ms). This
experiment represents a moderate latency, moderate bandwidth connection.
• Trans-Atlantic L,↔ B: An Internet deployment with a Linux server at USC and a Sun OS 5.8
client at the University of Saarlandes in Germany. We observed 90 to 97 Mbps network
bandwidth for connections USC and Saarlandes with 89 ms latency (RTT=178 ms). This
represents a high latency, moderate bandwidth connection.
• Gbps↓ L, B: An intranet configuration consisting of two machines connected using a Gigabit Ethernet switch. The bandwidth is limited by the processor speed and varies from 300 to
500 Mbps. Latency is a low 0.15 ms (RTT = 0.3 ms), because the machines are physically
located in the same room at USC's database laboratory. This represents a high bandwidth,
low latency connection.

Figure 8: Experimental framework.
The Internet is a shared resource and we did not want to impose unnecessary load that might
interfere with existing network application. Thus, we used the controlled environment of Figure 8
to analyze the impact of alternative estimation techniques on NAM. The details of this
environment are as follows. We stored the result of each TPC-H queries in a file and registered
the compression and decompression time of each data set with alternative processor speeds.
These times exclude the time to read the file into memory. These correspond to the "compression
profiles" box of Figure 8. Next, we performed an experiment consisting of an Internet application
configured with a NAMC invoking a remote server with the identity of a query. The query id
uniquely identifies the data set size that must be transmitted from the server to NAMC. The server
employs NAM to determine if the referenced data set should be transmitted compressed or
uncompressed and logs this information. Next, it transmits the data set in uncompressed, Zip
compressed and XMill compressed to NAMC and registers the observed response time and
network characteristics in a log file. An off-line program, "NAM's decision making" box of
Figure 8, processes these logs and emulates different processor speeds. In addition, it computes
the percentage improvement provided by NAM when compared with: a) uncompressed
transmission always, corresponding to how Web Services are deployed today, termed
Uncompressed, b) Zip transmission always, a simple improvement on today's status that would
employ Zip always, c) XMill transmission always, an environment that employs XMill at all
times.

Figure 9: Percentage improvement with NAM for QS with 3.06 GHz processors.
Figure 9 shows the percentage improvement with NAM when configured with a 3.06 GHz
processor speed for five different deployments. For each, the y-axis shows the percentage
improvement of NAM when compared with XMill compression always, Zip compression always,
and uncompressed always. We observed a zero loss rate in these experiments. NAM employs an
uncompressed transmission for QS always because the message is smaller than a TCP packet (a
packet is 1480 bytes between two Linux machines and 1460 bytes between a Linux machine and
a Sun OS 5.8 machine). Its model assumes TCP must transmit at least one packet worth of data
and attributes zero benefits to using either Zip or XMill. The results shows the superiority of this
decision with the low latency connections that offer moderate to high bandwidths (1-Gbps, SC).
With a low bandwidth, moderate latency connection, US↔ L,↓ B, compression provides marginal
benefits (1 to 3%) with a 3.06 GHz processor because the model's assumption is violated
(transmitting fewer than one packet worth of data does provide savings in network transmission
times). With a 2 GHz processor speed, this marginal benefit disappears. With both 1 GHz and
450 MHz processor speeds, use of either Zip or XMill is inferior to an uncompressed
transmission.
Figure 10 shows the percentage savings for QM and a 2 GHz processor speed. With the 1-Gbps↓ L,
B environment, NAM continues to transmit data uncompressed, providing substantial savings
when compared with environments configured to use either Zip or XMill always. With Trans-
AtlanticL,↔ B and US↔ L,↔ B, NAM employs XMill for 77% of queries, Zip for 14% of queries,
and uncompressed transmission for the remaining 9% of queries. An environment that would
employ XMill compression always outperforms NAM by approximately 19% for Trans-Atlantic
L,↔B. This drops to 2% with a 1 GHz processor. With a 450 MHz processor, NAM is superior to
XMill always. Note that NAM provides substantial savings when compared with today's common
practice to transmit uncompressed always.

Figure 10: Percentage improvement with NAM for QM with 2 GHz processors.
The results observed with both US↔ L,↓ B and SC↓ L,↔ B demonstrate the importance of estimating
network characteristic and data compression times accurately. Consider each of experiments in
turn. With US↔ L,↓ B, NAM employs XMill for 68% of queries, Zip for 22% of queries, and
uncompressed transmission for the remaining 10%. This is partly because cubic regression cannot
estimate the compressed message size, compression and decompression times accurately with
samples from both the 1 and 10 Gigabyte databases. If perfect estimates were provided, NAM
would employ Zip and XMill 81% and 19% of the time respectively, providing savings when
compared with XMill. The same would hold true if NAM was provided with samples from 1
Gigabyte database. The US↔ L,↓ B results demonstrate the importance of estimating compression
and decompression times accurately.
With SC↓ L,↔ B, NAM employs XMill for more queries than desired, resulting in inferior
performance when compared with an environment that employs Zip always. This is partly due to
inaccurate estimates provided by regression. However, even with perfect knowledge of
compressed message size, compression and decompression times, an environment that employs
Zip always will continue to outperform NAM by 7%. This is because NAM observes a loss from
a prior transmission and uses this to estimate response times with different compression
techniques. However, the observed transmission does not encounter the expected loss rate,
causing the Zip compressed response times to appear superior.
Figure 11 shows the percentage savings for the QL and a 1 GHz processor speed. With low
latency connections that offer moderate to high bandwidths (1-Gbps↓ L, B and SC↓ L,↔ B) NAM
transmits data uncompressed, producing significant savings. With Trans-Atlantic L,↔ B, US↔L,↔ B
and US↔ L,↓ B, NAM switches to Zip compression, providing savings when compared with an
uncompressed transmission. With Trans-AtlanticL,↔ B, NAM's savings when compared with an
environment that employs XMill always is marginal. This is due to a larger RTT between USC
and University of Saarlandes that dominates the network response time. It is interesting to note
that with SC↓L,↔ B, NAM employs an uncompressed transmission for QL because of the small
RTT (7 ms). With faster processor speeds (2 and 3.06 GHz) processors, NAM switches to Zip
compression.

Figure 11: Percentage improvement with NAM for QL with 1 GHz processors.
Figure 12: Percentage improvement with NAM for QH with 450 MHz processors.
Figure 12 shows the percentage savings for QH and a 450 MHz processor speed. The 1-Gbps↓ L, B
and SC↓ L,↔ B continue to transmit data uncompressed, providing significant savings when
compared with those environments that employ either XMill or Zip always. Even with a 3.06
GHz processor, NAM employs uncompressed transmission with the 1-Gbps↓ L, B connection. The
only difference is a lower percentage savings when compared with XMill and Zip, i.e., NAM
outperforms XMill and Zip by 82% and 60%, respectively. With Trans-Atlantic L,↔ B, US↔L,↔ B
and US↔ L,↓ B, NAM employs Zip compression to provide savings. With faster processor speeds
(1 GHz and above), NAM switches to XMill.

Results of Figures 9, 10, 11, and 12 show NAM adapts to enhance response time across different
output XML data set sizes, processor speeds, and network conditions. It may not provide a
superior response time for every single transmission, however, it significantly improves the
average response time across many transmissions. Of course, given a specific processor speed
and query output size, one may tailor the system to outperform NAM. Results of Figure 10 for
US↔ L,↓ B is a demonstration of this claim. However, NAM is designed to be general purpose and
adapt to its environment.
5 RELATED WORK
While XML is a key component of interoperability for wide-area applications, its performance
limitations has been identified by time-sensitive applications. Examples include scientific
computing applications (Davis and Parashar, 2002) (Chiu et al., 2002) (van Engelen, 2003)
(Seshasayee et al., 2004) and high performance business applications (Kohlhoff and Steele, 2003).
The approaches to address this limitation range from those that manipulate the transmission
protocol parameters, schema specific parsers, and extensions to XML representation of data for a
specific domain. NAM complements these approaches. Below, we survey these techniques in turn.
We describe SOAP-binQ (Seshasayee et al., 2004) as the closest approach to NAM and how it is
different. We end this section with a comparison to our earlier published study on NAM.
Davis et al. evaluated the latency performance of several implementations of SOAP with HTTP
and compared the results with the performance of JavaRMI and CORBA using HTTP and
TCP (Davis and Parashar, 2002). Similar to our findings, their study also shows that binary XML
encodings improve the response time of SOAP. They found that two large sources of inefficiency
in SOAP implementation are the use of multiple system calls to send one logical message and the
XML parsing and formatting time. They suggested using different capabilities of the HTTP
protocol such as HTTP chunking to improve the SOAP performance.
Chiu et al. analyzed the limitations of SOAP for high-performance scientific computing and
recommended several optimizations for using SOAP in scientific computing applications (Chiu et
al., 2002). They showed that the performance of SOAP can be significantly improved by using
optimization techniques including schema-specific parser mechanisms for arrays, trie data
structure for matching tags, efficient memory management as well as persistent connections and
chunking in HTTP. They also recommended a multi-protocol approach that uses SOAP to
negotiate faster binary protocols between messaging participants.
The gSOAP (van Engelen, 2003) exploits XML schema extensibility for defining optimized
XML representations of numerical data in scientific applications. It also improved the
performance of SOAP by using several message passing optimization techniques such as
chunking, compression, multi-hop routing and the streaming of Direct Internet Message
Encapsulation (DIME).
To apply XML and SOAP in time-sensitive business applications, Kohlhoff et al. (2003)
compared the performance of SOAP in real-time trading systems with both binary CDR and a
domain-specific protocol, i.e. Financial Information eXchange (FIX) protocol. Their results show
that SOAP did fare poorly when compared to both binary CDR and native FIX although the
difference is less than that measured for scientific computing applications.
Our NAM approach differs from above studies in the sense that it proactively measures the
characteristics of underlying communication channel and adaptively chooses different messaging
formatters to minimize the response time of Web Services applications. The closest approach to
NAM is the SOAP-binQ protocol recently proposed by Seshasayee et al. (2004). The SOAP-binQ

protocol associates runtime quality management functions with SOAP parameters. It can
dynamically adjust data volumes to available clients by using application-specific data
manipulations, such as data down-sampling. However, the SOAP-binQ protocol relies on
developers or end users to provide a "quality" file accompanying the WSDL information that
indicates the data precision to be used under different resource availabilities. In contrast, our
NAM approach can intelligently choose a optimal message formatting decision based on current
network condition without the participation of developers or end users.
This paper is a comprehensive version of our earlier study that introduced NAM
(Ghandeharizadeh et al., 2003). There are two key extensions. First, we have included an in-depth
discussion of the alternative formatters and their impact on message size, see Section 2. Second,
the experimental section has been extended to present results from additional queries, see Table 1.
6 CONCLUSION AND FUTURE RESEARCH
DIRECTIONS
This paper investigates performance of XML and Binary formatters and the role of compression
to reduce the number of transmitted bytes. Our primary contribution is NAM, a middleware to
enhance response time of Web Services using compression techniques when appropriate. Our
performance results demonstrate how NAM switches from using XMill compression to Zip and
uncompressed transmission selectively to improve response time. We analyzed the performance
of this middleware with TPC-H queries that produce data set sizes ranging from a few hundred
bytes to tens of Megabytes. This was done in the context of different Internet and intranet settings.
NAM is designed to adapt based on the data characteristics of an application, available client and
server processor speeds, and network characteristics. It exchanges profile information between a
client (NAMC) and a Web Service (NAMS) in support of intelligent decisions. This distributes the
overhead of NAM between the client and the Web Service in order to free the Web Service to
scale to a large number of clients. It is important to note that NAM is not appropriate for
multimedia content such as still images, audio and video clips, etc. This is because these data
types are compressed using a lossy compression technique. A lossless compression technique,
such as Zip, reduces the size of these files by only a few percentage (instead of several factors as
with XML, see Table 1).
An immediate research direction is to extend NAM to maintain a history of its decisions and their
quality. This would enable it to detect when its estimates are inaccurate. Moreover, it is possible
to attribute this error to either the regression models or the observed network characteristics.
Based on this, NAM may start to modify its models in order to enhance the quality of its
decisions. A challenge here is the division of this activity between NAMC and NAMS. Another
research direction is to extend NAM to streaming architectures. In its present form, NAM
assumes a Web Service produces its output in its entirety prior to its transmission. While this
assumption matches today's practices, we anticipate emergence of XML streaming architectures
in support of integrated Web Services. These will incrementally produce and transmit their XML
formatted output in a pipelined manner, overlapping the server's production of output with the
client's consumption and processing of this output. We intend to explore extensions of NAM to
these architectures in the near future.
7 ACKNOWLEDGEMENTS

We wish to thank the anonymous referee for his valuable comments that helped refine this
manuscript. This research is supported in part by an unrestricted cash gift from Microsoft and a
grant from the National Science Foundation IIS-0307908.
REFERENCES
Andersen, D., Bansal, D., Curtis, D., Seshan, S., and Balakrishnan, H. (2000), System Support for
Bandwidth Management and Content Adaptation in Internet Applications. Technical Report LCS-TR-808,
MIT, May 2000. http://nms.lcs.mit.edu/projects/cm/.
Box, D., Ehnebuske, D., Kakivaya, G., Layman, A., Mendelsoh, N., Nielsen, H. F., Thatte, S., and Winder,
D. (2000), Simple Object Access Protocal (SOAP). Technical Report 8, World Wide Web Consortium
(W3C), May 2000.
Brakmo, L. and Peterson, L. (1977), TCP Vegas: End to End Congestion Avoidance on a Global Internet.
IEEE Journal on Selected Areas in Communications, 13(8):1465-1480, 1977.
Carson, M. (1997), NIST Net. Internetworking Technologies Group, NIST, 1997,
http://snad.ncsl.nist.gov/itg/nistnet/.
Chiu, K., Govindaraju, M., and Bramley, R. (2002), Investigating the limits of soap performance for
scientific computing. In HPDC '02: Proceedings of the 11 th IEEE International Symposium on High
Performance Distributed Computing HPDC-11 20002 (HPDC'02), page 246-255, Washington, DC, USA,
2002. IEEE Computer Society.
Cai, M., Ghandeharizadeh, S., Schmidt, R., and Song, S. (2002), A Compression of Alternative Encoding
Mechanism for Web Services. In Proceedings of DEXA Conference, page 93-102, August 2002.
Cheney, J. (2001), Compressing XML with Multiplexed Hierarchical PPM Models. In CCD: Proceedings
of the Data Compression Conference, page 163-172, March 2001.
Davis, D. and Parashar, M. P. (2002), Latency Performance of SOAP Implementations. In CCGRID '02:
Proceedings of the 2nd IEEE/ACM International Symposium on Cluster Computing and the Grid, page
407-413, Washington, DC, USA, 2002. IEEE Computer Society.
Fall, K. and Floyd, S. (1996), Simulation-based Comparisons of Tahoe, Reno, and SACK TCP. Computer
Communications Review, 26(3):5-21, July 1996.
Fall, K. and Varadhan, K. (2002), The ns Manual. The VINT Project, April 2002.
http://www.isi.edu/nsnam/ns/index.html.
Geer, D. (2005), Will Binary XML Speed Network Traffic? IEEE Computer, 38(4), April 2005.
Ghandeharizadeh, S., Knoblock, C. A., Papadopoulos, C., Shahabi, C., Alwagait, E., Ambite, J. L., Cai, M.,
Chen, C., Pol, P., Schmidt, R., Song, S., Thakkar, S., and Zhou, R. (2003a), Proteus: A System for
Dynamically Composing and Intelligently Executing Web Services. In First International Conference on
Web Services (ICWS), page 17-21, Las Vegas, Nevada, June 2003.
Ghandeharizadeh, S., Papadopoulos, C., Cai, M., and Chintalapudi, K. (2002), Performance of Networked
XML-Driven Cooperative Applications. In Proceedings of Second International Workshop on Cooperative
Internet Computing (CIC, held in conjunction with VLDB), pages 32-42, August 2002.
Ghandeharizadeh, S., Papadopoulos, C., Pol, P., and Zhou, R. (2003b), NAM: A Network Adaptable
Middleware to Enhance Response Time of Web Services. In the Eleventh IEEE/ACM International
Symposium on Modeling, Analysis and Simulation of Computer and Telecommunication Systems
(MASCOTS), page 136-146, Orlando, Florida, October 2003.
Iyer, B. R. and Wilhite, D. (1994), Data Compression Support in Databases. In Proceedings of the 20th
International Conference on Very Large Data Bases, page 695-704, September, 1994.

Kohlhoff, C. and Steele, R. (2003), Evaluating SOAP for High Performance Business Applications: Real-
Time Trading Systems. In Proceedings of the 12th World Wide Web Conference (alternate track), pages
872-880, Budapest, Hungary, 2003.
Liefke, H. and Suciu, D. (1999), XMill: An Efficient Compressor for XML Data. Technical Report MSCIS-
99-26, University of Pennsylvania, 1999.
Mathis, M., Mahdavi, J., Floyd, S., and Romanow, A. (1996), TCP Selective Acknowledgment Options.
Technical Report 2018, Network Working Group RFC, October 1996.
Poess, M. and Floyd, C. (2000), New TPC Benchmarks for Decision Support and Web Commerce. ACM
SIGMOD Record, 29(4), pages 64-71, December 2000.
Padhye, J., Firoiu, V., Towsley, D., and Krusoe, J. (1998), Modeling TCP Throughput: A Simple Model
and its Empirical Validation. In ACM SIGCOMM '98 conference on Applications, technologies,
architectures, and protocols for computer communication, page 303-314, Vancouver, CA, 1998.
Postel, J. (1981), Transmission Control Protocol. Technical Report 793, Network Working Group RFC,
September 1981.
Sikdar, B., Kalyanaraman, S., and Vastola, K. S. (2001), An Integrated Model for the Latency and Steady-
State Throughput of TCP Connections. Performance Evaluation, 46(2-3):139-154, 2001.
Shek, E. C., Muntz, R. R., and Fillion, L. (1996), The Design of the FALCON Framework for Application
Level Communication Optimization. Technical Report CST-TR-960039, UCLA, November 1996.
Seshasayee, B., Schwan, K., and Widener, P. (2004), SOAP-binQ: High-Performance SOAP with
Continuous Quality Management. In ICDCS, page 158-165, 2004.
van Engelen, R. A. (2003), Pushing the soap envelope with web services for scientific computing. In
Proceedings of the International Conference on Web Services (ICWS), page 346-352, June, 2003.
Werner, C., and Buschmann, C. (2004), Compressing SOAP Messages by Using Differential Encoding. In
Proceedings of IEEE International Conference on Web Services, page 540-547, July 2004.
Ziv, J. and Lempel, A. (1977), A Universal Algorithm for Sequential Data Compression. IEEE
Transactions on Information Theory, 23(3):337-343, 1977.
ABOUT THE AUTHOR
Shahram Ghandeharizadeh received his Ph.D. degree in Computer Science from the University of
Wisconsin, Madison, in 1990. Since then, he has been on the faculty at the University of
Southern California. In 1992, Dr. Ghandeharizadeh received the National Science Foundation
Young Investigator Award for his research on the physical design of parallel database systems.
In 1995, he received an award from the School of Engineering at USC in recognition of his
research activities. His primary research interests include design and implementation of
extensible storage systems that employ Web Services as a building block. Microsoft and the
National Science Foundation have been the primary sponsors of this research effort.
Christos Papadopoulos is currently faculty at the University of Southern California. He received
his Ph.D. in Computer Science in 1999 from Washington University in St. Louis, MO. His
interests include network security, router services, multimedia protocols and reliable multicast. Dr.
Papadopoulos is a member of IMSC, where he conducts research in supporting immersive
applications and a member of ISI, where he works on network security related projects. In 2002,
he received an NSF CAREER award to explore router services as a component of the next
generation Internet architecture.
Min Cai received his BS and MS degrees in Computer Science from Southeast University, China,
in 1998 and 2001. He joined IBM Research, Beijing, in 2001, where he worked on multimedia
networking. He is currently a PhD candidate in the Computer Science Department at the

University of Southern California. His research interests include peer-to-peer systems, grid
computing, semantic web and web services technologies. His email address is [email protected].
Runfang Zhou received her BS and MS degree in Computer Science from Southeast University,
China in 1998 and 2001. She is currently a PhD student in the Computer Science Department at
the University of Southern California. Her research interests include web services performance,
reputation management in decentralized systems, and overlay networks. Her email address is