name of the company internal auditors as integrated as dimo … · 2019-06-27 · business segment...
TRANSCRIPT
Name of the CompanyDiesel & Motor Engineering PLC
Registered O�ceP.O. Box 339,
No. 65, Jetawana Road,
Colombo 14, Sri Lanka.
Telephone: +94-11-2449797,
+94-11-2338883
www.dimolanka.com
E-mail: [email protected]
Facsimile: +94-11-2449080
Legal FormA public limited company
incorporated in 1945 under the Laws
of the Democratic Socialist
Republic of Sri Lanka. The Company
was re-registered under the
Companies Act No. 07 of 2007
on 9th May 2008.
Company Registration Number
PQ 146
Founded
1939
Accounting Year End31st March
Tax Payer Identi�cation Number (TIN)104002498
Stock Exchange ListingThe ordinary shares of the Company
are listed with the Colombo Stock
Exchange of Sri Lanka.
AuditorsKPMG
Chartered Accountants,
No. 32 A, Sir Mohamed Macan
Markar Mawatha, Colombo 3,
Sri Lanka.
Internal AuditorsSJMS Associates
Chartered Accountants
No. 2, Castle Street, Colombo 4,
Sri Lanka.
LawyersF.J. & G. De Saram & Company
Attorneys-at-Law
No. 216, De Saram Place,
Colombo 10, Sri Lanka.
BankersBank of Ceylon
Commercial Bank of Ceylon PLC
Citibank
DFCC Vardhana Bank
Hatton National Bank PLC
Hongkong & Shanghai Banking Corporation Ltd.
Nations Trust Bank PLC
NDB Bank PLC
People’s Bank
Sampath Bank PLC
Company SecretaryB.C.S.A.P. Gooneratne, F.C.A.,
M.B.A. (Sri J.)
Company RegistrarsCorporate Services Ltd.
No. 216, De Saram Place,
Colombo 10, Sri Lanka
Corporate information
Our Second Integrated Annual Report
Our first , last year, turned out to be the first for Asia as well . Heartened by the overwhelming
response from al l our stakeholders, we made yet another attempt. We have once again
structured this Annual Report based on our eight strategic imperatives; Highlights of the Year,
Management Report, Enterprise Governance Report and Risk Management Report
i l lustrate and discuss our position and response in holding true to them. As much
as this is a Report about Dimo’s duties of responsible trusteeship, faithful stewardship and
uncompromising accountabil ity, it is also a Report of Dimo’s drivers of value; or as we cal l it ,
a Report of Dimo’s f inancial capital and intel lectual capital .
as integrated as Dimo ...
(Detailed contents are given on inner back cover �ap)

Business Segment Principals Represented Performance Highlights of the Year Outlook for 2012/13
Vehicles
Passenger cars, SUV and a range of commercial vehicles from small 750kg trucks to large 40 Ton+ trucks to tippers and buses.
Number of vehicles sold and turnover increased by 65% and 32% respectively. TATA passenger vehicle sales increased by 16 times mainly on account of the launch of the TATA Nano. TATA commercial vehicles increased market share from 43 to 50% of the brand new commercial vehicles segment. Heavy/medium commercial vehicles sales increased by 115% while light and small commercial vehicles sales increased by 37%. Mercedes-Benz, Chrysler and Jeep performed below expectations.
Recent upward revision of tariffs and duties together with the upward movement in exchange rates could challenge sales, particularly of our high end products. We nevertheless continue to invest on strengthening infrastructure and reach. Particular emphasis is on increasing our customer contact points. Overall, we remain cautiously optimistic.
Vehicle Parts & Service
Parts for the after-care markets of passenger vehicles, commercial vehicles and construction machinery including a range of Original Equipment Manufacturers‘ (OEM) parts. Engine management systems, vehicle accessories, tyres and services.
Sales of TATA as well as OEM parts increased by 34% and 17% respectively, while sales of Mercedes-Benz, Chrysler and Jeep parts dropped by 14% and sales of Bosch parts dropped by 7%. Tyre sales performed below expectation owing to poor supplies. Growth momentum in vehicle service continued during the year with Vehicle Service Hours Sold rising sharply from 118,430 to 208,768 along with Vehicle Throughput rising from 22,392 to 45,281.
The investments currently underway to upgrade and expand our service and repair facilities, the rapid increase in the vehicle population in recent years, and the expansion of our Dimo outlets plus dealer network augurs well for growth in this division. The new brand of tyres, ‘KHUMO’, the tyre retail service and repair centres to be launched during the year and the increase in the tyre dealer network should improve tyre sales.
Lighting & Power Tools
A wide range of lamps, lighting fittings, lighting equipment and systems, tailor-made lighting design service and energy audits, industrial and domestic Power Tools.
Sales were adversely affected due to non-availability of CFL lamp supplies. Bosch power tools recorded a 38% increase in sales, retaining market leadership with a 36% share of the branded market. Growth in the construction sector, focus on the end user, enhancing our island-wide authorised dealer network and a 90% availability of spare parts contributed to this growth. Lighting business unit systems were certified to provide LEED consultancy.
Opening up of markets in the North and East, growth in hotels and construction sectors as well as our own expansion of the distribution network should turn a worthwhile result.
Construction, Agricultural & Material Handling Machinery
Construction and mining equipment, compaction and road building machinery, concrete machinery, fluid management systems, tractors, agri implements, forklifts, storage and racking systems, building cleaning and maintenance systems, aerial work platforms, parking systems and harvesters.
Market leadership status in heavy machinery and equipment that Komatsu rose to last year was retained in the year under review. However, downscaling of Komatsu forklift operation by the principal led to a loss of market share in the forklift market. Fluid management systems recorded a 35% increase in turnover owing to several projects that were hitherto on hold coming on stream. The Agri Business witnessed a turnover growth of 4%.
Launch of innovative new products together with the expansion of our regional service network and growth in hotels and construction sectors should enable us to augment our market leading position to drive growth in this sector.
Electromechanical & Biomedical Engineering
Power solutions, building automation systems, fire detection, protection and suppression systems, CCTV and access control systems, public address systems, power systems for marine propulsion and rail traction, industrial refrigeration, and medical equipment.
LEADER MARINE
Highlight of the year was winning the first ever Supervisory Control and Data Acquisition/Distribution Management System (SCADA/DMS) project of the Ceylon Electricity Board. The Country’s largest fire detection project was also awarded to Dimo. Several high profile projects were successfully completed during the year. Medical solutions division recorded a 70% increase in turnover. Power systems division secured an order of 23 locomotive engines although overall performance of this division was below expectations.
With key sectors such as hotels, construction and health-care poised for growth, this division is expected to continue it growth momentum.
T H I S I S D I M O
Diesel & Motor Engineering PLC, better known as Dimo is a public quoted company listed on the Colombo Bourse. Founded in 1939, Dimo
operates across the five business segments shown below through representing several best-in-class Principals. Headquartered in the commercial
capital of Colombo in Sri Lanka, Dimo has an extensive network of sales and after-sales facilities spread throughout the Island and a team of over
1,360 employees. 2011/12 has been a year of exceptional all round performance. These highlights as well as the outlook for the ensuing year are
summarised below:
Our vision is to be the leader in all the businesses we are engaged in, by building a world-class team and partnering with the best in the world, to
deliver, lasting and outstanding value to all our stakeholders.
COnTExT
Strategy 01A 360 Degree View of Highlights of the Year 02
Report Parameters...The Big Picture 05
Chairman’s Letter 10
MAnAGEMEnT REPORT
The Operating Environment...and Trends 18Refining Our Portfolio...and Reinventing Our Future 23Financial Value Creation 24Delivering Value to Customers...and their Value to Us 40Working at Dimo...Enjoyable and Rewarding 62Our Business Partners...A Symbiotic Relationship 80Regulatory Authorities...Playing by the Rules 88Our Community...Live and Let Live 90The Environment...Now and for Generations Yet Unborn 100Sustainability Performance Objectives in 2011/12 112
STEwARdSHiP
Enterprise Governance 116Risk Management 128Chairman/Managing Director and Chief Financial Officer’s Responsibility Statement 141Report of the Audit Committee 142The Remuneration Committee Report 144Report of the Nomination Committee 145
FinAnCiAL REPORTS
Annual Report of the Board of Directors 149Annex to the Annual Report of the Board of Directors 157Statement of Directors’ Responsibilities for the Financial Statements 159Independent Auditors’ Report 161Income Statement 162Balance Sheet 163Statement of Changes in Equity 164Cash Flow Statement 165Notes to wthe Financial Statements 167
APPEndiCES
Annex to Enterprise Governance 206Board of Directors - Profiles 235Ten Year Summary 236Share Information 237Our Heritage 243Group Structure 246Awards 247Country Report 248Glossary 253Independent Assurance Statement on the Non-Financial Reporting 255GRI and Global Compact Index 258GRI Application Level Check 259Alphabetical Index 260Notice of Meeting 261Form of Proxy Enclosed
D I E S E L & M OTO R E N G I N E E R I N G P L C
A N N U A L R E P O RT 2 0 1 1 / 1 21
We Exist Because We
1. Refine the portfolio mix of our business continuously
2. Create financial value
3. Earn the trust of customers and they keep coming back
4. Nurture people and they find it enjoyable and rewarding to work with us
5. Have great relationships with best-of-breed business partners
6. Play by the rules
7. Serve the community
8. Are friendly towards the environment
And these constitute our eight strategic imperatives.
Our Overarching Strategy is Quite Simple
We always and repeatedly ask ourselves what is next, and what do we have to do next,
to hold true to our eight strategic imperatives.
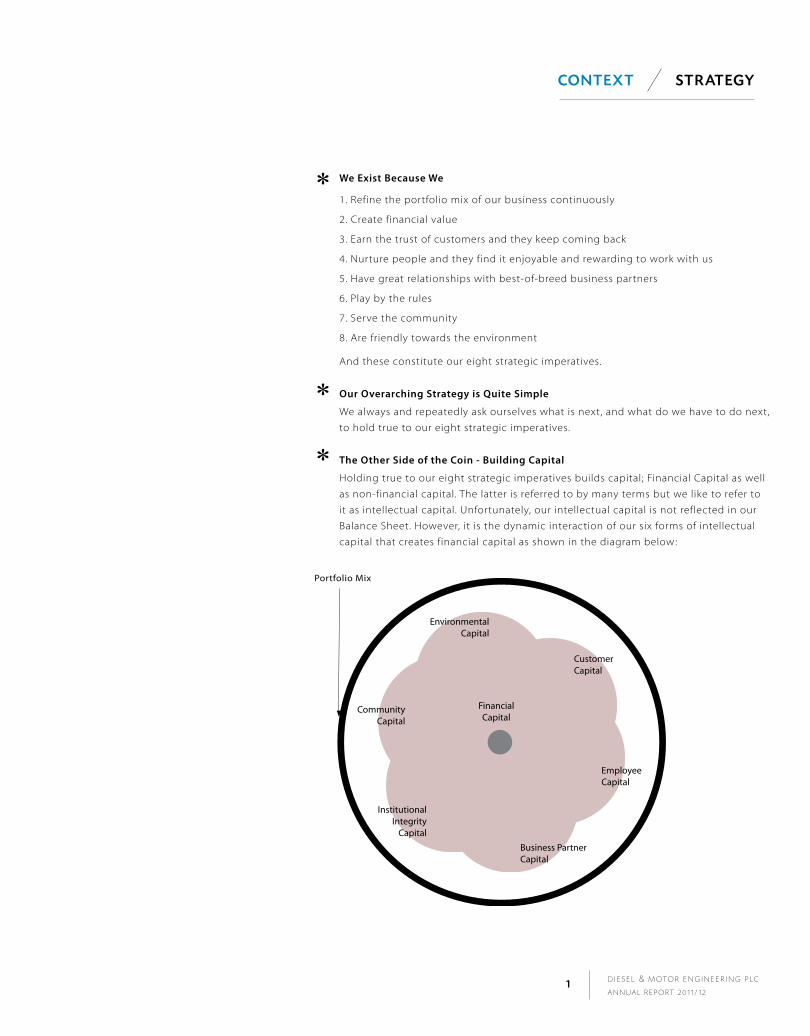
The Other Side of the Coin - Building Capital
Holding true to our eight strategic imperatives builds capital; Financial Capital as well
as non-financial capital. The latter is referred to by many terms but we like to refer to
it as intellectual capital. Unfortunately, our intellectual capital is not reflected in our
Balance Sheet. However, it is the dynamic interaction of our six forms of intellectual
capital that creates financial capital as shown in the diagram below:
Co n t e x t St R At eGY
Portfolio Mix
Customer Capital
EmployeeCapital
Business Partner Capital
Institutional Integrity
Capital
Environmental Capital
Community Capital
Financial Capital

D I E S E L & M OTO R E N G I N E E R I N G P L C
A N N U A L R E P O RT 2 0 1 1 / 1 22
Key Performance Area Metric Achievement Change A Forward Looking Note
2011/12 2010/11
CrEaTing finanCial valuE
Wealth creation Economic Value Added (Rs. mn) 1,905 1,762 8% Several investments are already underway to enhance
capacity, competency and reach. These investments
amounting to Rs. 5 bn during the three-year period ending
31st March 2014 are expected to support revenue growth
from the ensuing year onwards. For details, refer column
on outlook for 2012/13 given in inner front cover.
Relentless focus on working capital management will
continue. We will challenge the current market norms of
60-day credit periods and 60-day stock residence times
and gradually set new standards for them.
We are focused on improving gross profit margin by at
least 2%, greater efficiencies in managing expenses, higher
value addition and productivity improvement in order to
improve profitability. Our budget for 2012/13 envisages
a stable performance rather than a substantial growth
in profits. We are confident of maintaining our record of
creating positive EVAs.
Market Value Added (Rs. mn) 1,253 8,719 (86%)
Net Assets Value per Share (Rs.) 841 473 78%
Market Capitalisation (Rs. mn) 8,718 12,920 (33%)
Wealth distribution Employees (Rs. mn) 1,372 1,037 32%
Government (Rs. mn) 6,062 5,571 9%
Lenders (Rs. mn) 253 207 22%
Community (Rs. mn) 51 30 70%
Shareholders (Rs. mn) 554 122 354%
Shareholder return Return on Equity (%) 36.13 50.51 (28%)
Earnings per Share (Rs.) 303.87 239.03 27%
Price Earnings Ratio (times) 3.23 6.21 (48%)
Dividend per Share (Rs.) 40.00 61.00 (34%)
Shareholders’ Funds (Rs. mn) - at
the year end
7,465 4,201 78%
Profitability Gross Profit Ratio (%) 18.23 20.56 (11%)
Net Profit Ratio (%) 6.81 7.31 (7%)
Working capital
management
Current Ratio (times) - at the
year end 1.55 1.27 22%
Quick Assets Ratio (times) -
at the year end 0.34 0.84 (60%)
Asset utilisation Fixed Assets Turnover (times) 8.49 9.37 (9%)
Capital structure Debt/Equity (%) - at the
year end 13.4 9.76 37%
Interest Cover (times) 15.64 17.35 (10%)
Co n t e x t A 3 6 0 d eG R e e v I eW o F h I G h L I G h TS O F T h E Y E A R
Strategy 01 A 360 Degree View of Highl ights of the Year 02 Report Parameters . . .The Big P icture 05 Chairman’s Letter 10

D I E S E L & M OTO R E N G I N E E R I N G P L C
A N N U A L R E P O RT 2 0 1 1 / 1 23
Key Performance Area Metric Achievement Change A Forward Looking Note
2011/12 2010/11
Earning ThE TruST Of CuSTOmErS SO ThaT ThEy kEEp COming BaCk
Customer service Number of sales personnel 362 345 5% In the ensuing months we should see a change in the face
of our customer relationship management (Refer pages
56 to 58 for details). Major investments and initiatives to
improve customer service and customer convenience are
underway. We are strengthening our island-wide presence
at strategic locations. Several new investments in state-of-
the-art facilities will set a new benchmark in the sectors
that we operate in. While strengthening our existing
customer portfolio, new customer segments will be
attracted particularly owing to the Bosch Centre launched
in the year under review which attracts all popular makes
of vehicles and the expansion of our ‘Tyre Plus’ network
that kicked off during the year under review.
Number of service personnel 481 442 9%
Training man hours -
Sales personnel 4,044 3,518 15%
Customer convenience Number of branches and
customer interaction points 40 25 60%
Customer satisfaction Weighted average customer
satisfaction index 89.2 85.6 4%
Number of complaints received 261 201 30%
Number of complaints resolved
within 3 days in Vehicle Sales
and Parts & Service Segments 128 48
167%
nurTuring pEOplE SO ThaT ThEy find iT EnjOyaBlE and rEWarding TO WOrk WiTh uS
Team strength Number of employees as at
year end 1,339 1,019 31%
Statistics suggest an increase in ‘Y’ generation employees.
The human resources function is increasingly gearing itself
to address their needs. We are on track towards increasing
our percentage of female employees to 15% by 2014.
We have budgeted to invest on at least 10 hours of
training per employee per annum. We expect the
employee satisfaction score to move further up from
the current level of 62.6%. An upgrade of our current
system for managing employee health and safety as well
as OHSAS 18001 accreditation has been planned for the
ensuing year.
Gender distribution % of female employees 11 10 10%
Age distribution % of employees below 40 years
of age 81 76 7%
Knowledge and
skills development
Number of training man hours 18,106 11,105 63%
Employee satisfaction % of employees who
participated in the voluntary
employee satisfaction survey 86.4 54 60%
Employee satisfaction index (%) 62.6 55 14%
Employee health &
safety
Expenses incurred for employee
health & safety (Rs. mn) 25.1 9.47 165%
Work-related fatalities Nil Nil Nil
A 3 6 0 d eG R e e v I eW o F h I G h L I G h tS o F t h e Y e A R Co n t e x t
The Operat ing Environment . . .and Trends 18 Ref in ing Our Portfol io . . .and Reinvent ing Our Future 23 Financia l Value Creat ion 24
D I E S E L & M OTO R E N G I N E E R I N G P L C
A N N U A L R E P O RT 2 0 1 1 / 1 24
Key Performance Area Metric Achievement Change A Forward Looking Note
2011/12 2010/11
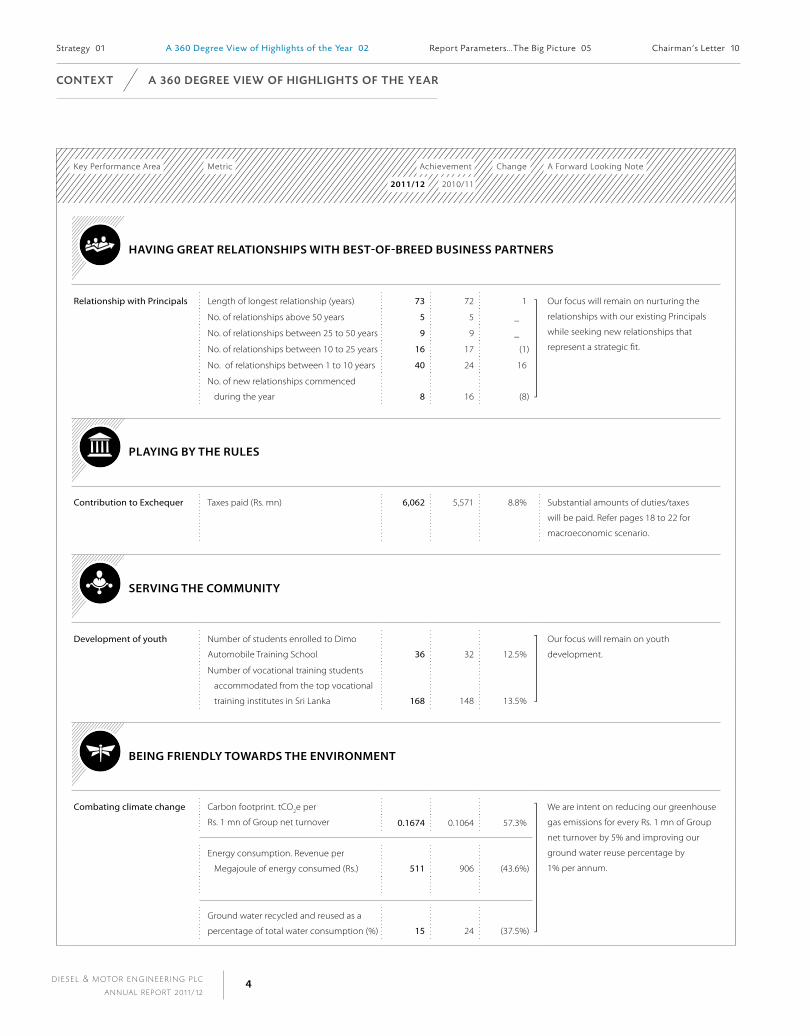
having grEaT rElaTiOnShipS WiTh BEST-Of-BrEEd BuSinESS parTnErS
Relationship with Principals Length of longest relationship (years) 73 72 1 Our focus will remain on nurturing the
relationships with our existing Principals
while seeking new relationships that
represent a strategic fit.
No. of relationships above 50 years 5 5 _
No. of relationships between 25 to 50 years 9 9 _
No. of relationships between 10 to 25 years 16 17 (1)
No. of relationships between 1 to 10 years 40 24 16
No. of new relationships commenced
during the year 8 16 (8)
playing By ThE rulES
Contribution to Exchequer Taxes paid (Rs. mn) 6,062 5,571 8.8% Substantial amounts of duties/taxes
will be paid. Refer pages 18 to 22 for
macroeconomic scenario.
SErving ThE COmmuniTy
Development of youth Number of students enrolled to Dimo
Automobile Training School 36 32 12.5%
Our focus will remain on youth
development.
Number of vocational training students
accommodated from the top vocational
training institutes in Sri Lanka 168 148 13.5%
BEing friEndly TOWardS ThE EnvirOnmEnT
Combating climate change Carbon footprint. tCO2e per
Rs. 1 mn of Group net turnover 0.1674 0.1064
We are intent on reducing our greenhouse
gas emissions for every Rs. 1 mn of Group
net turnover by 5% and improving our
ground water reuse percentage by
1% per annum.
57.3%
Energy consumption. Revenue per
Megajoule of energy consumed (Rs.) 511 906 (43.6%)
Ground water recycled and reused as a
percentage of total water consumption (%) 15 24 (37.5%)
Strategy 01 A 360 Degree View of Highl ights of the Year 02 Report Parameters . . .The Big P icture 05 Chairman’s Letter 10
Co n t e x t A 3 6 0 d eG R e e v I eW o F h I G h L I G h tS o F t h e Y e A R
D I E S E L & M OTO R E N G I N E E R I N G P L C
A N N U A L R E P O RT 2 0 1 1 / 1 25
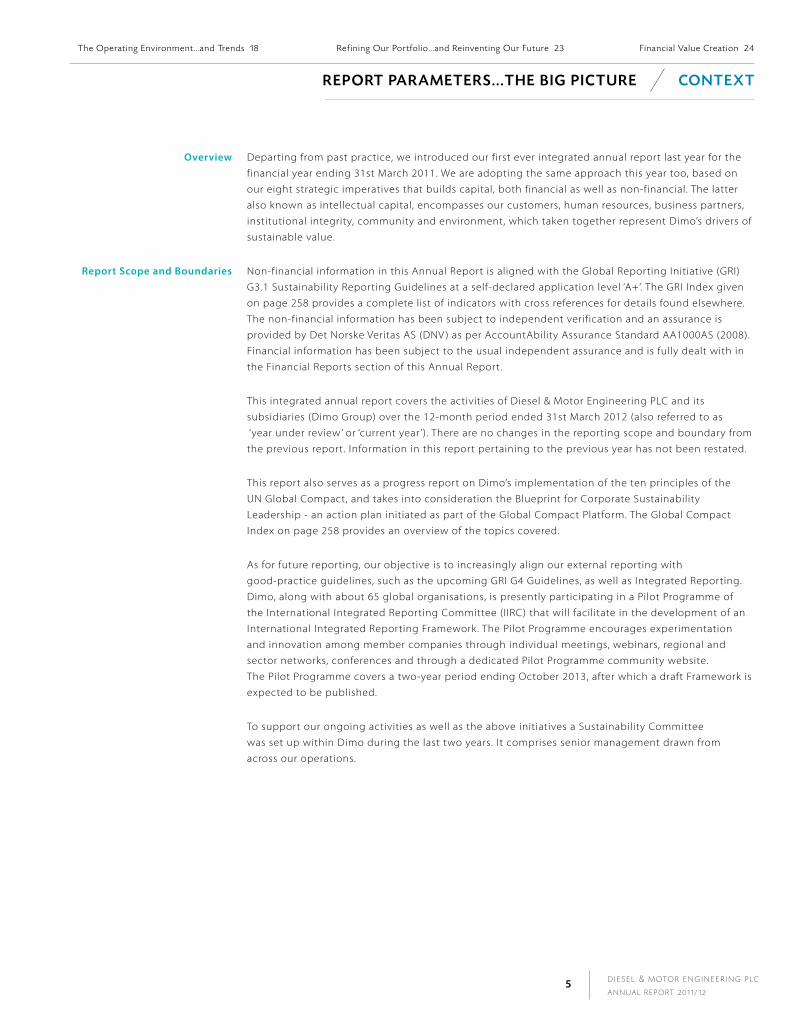
Overview Departing from past practice, we introduced our first ever integrated annual report last year for the
financial year ending 31st March 2011. We are adopting the same approach this year too, based on
our eight strategic imperatives that builds capital, both financial as well as non-financial. The latter
also known as intellectual capital, encompasses our customers, human resources, business partners,
institutional integrity, community and environment, which taken together represent Dimo’s drivers of
sustainable value.
report Scope and Boundaries Non-financial information in this Annual Report is aligned with the Global Reporting Initiative (GRI)
G3.1 Sustainability Reporting Guidelines at a self-declared application level ‘A+’. The GRI Index given
on page 258 provides a complete list of indicators with cross references for details found elsewhere.
The non-financial information has been subject to independent verification and an assurance is
provided by Det Norske Veritas AS (DNV ) as per AccountAbility Assurance Standard AA1000AS (2008).
Financial information has been subject to the usual independent assurance and is fully dealt with in
the Financial Reports section of this Annual Report.
This integrated annual report covers the activities of Diesel & Motor Engineering PLC and its
subsidiaries (Dimo Group) over the 12-month period ended 31st March 2012 (also referred to as
‘year under review’ or ‘current year ’). There are no changes in the reporting scope and boundary from
the previous report. Information in this report pertaining to the previous year has not been restated.
This report also serves as a progress report on Dimo’s implementation of the ten principles of the
UN Global Compact, and takes into consideration the Blueprint for Corporate Sustainability
Leadership - an action plan initiated as part of the Global Compact Platform. The Global Compact
Index on page 258 provides an overview of the topics covered.
As for future reporting, our objective is to increasingly align our external reporting with
good-practice guidelines, such as the upcoming GRI G4 Guidelines, as well as Integrated Reporting.
Dimo, along with about 65 global organisations, is presently participating in a Pilot Programme of
the International Integrated Reporting Committee (IIRC) that will facilitate in the development of an
International Integrated Reporting Framework. The Pilot Programme encourages experimentation
and innovation among member companies through individual meetings, webinars, regional and
sector networks, conferences and through a dedicated Pilot Programme community website.
The Pilot Programme covers a two-year period ending October 2013, after which a draft Framework is
expected to be published.
To support our ongoing activities as well as the above initiatives a Sustainability Committee
was set up within Dimo during the last two years. It comprises senior management drawn from
across our operations.
The Operat ing Environment . . .and Trends 18 Ref in ing Our Portfol io . . .and Reinvent ing Our Future 23 Financia l Value Creat ion 24
R e P o Rt PA R A M et e R S . . . t h e B I G P I C t U R e Co n t e x t
D I E S E L & M OTO R E N G I N E E R I N G P L C
A N N U A L R E P O RT 2 0 1 1 / 1 26
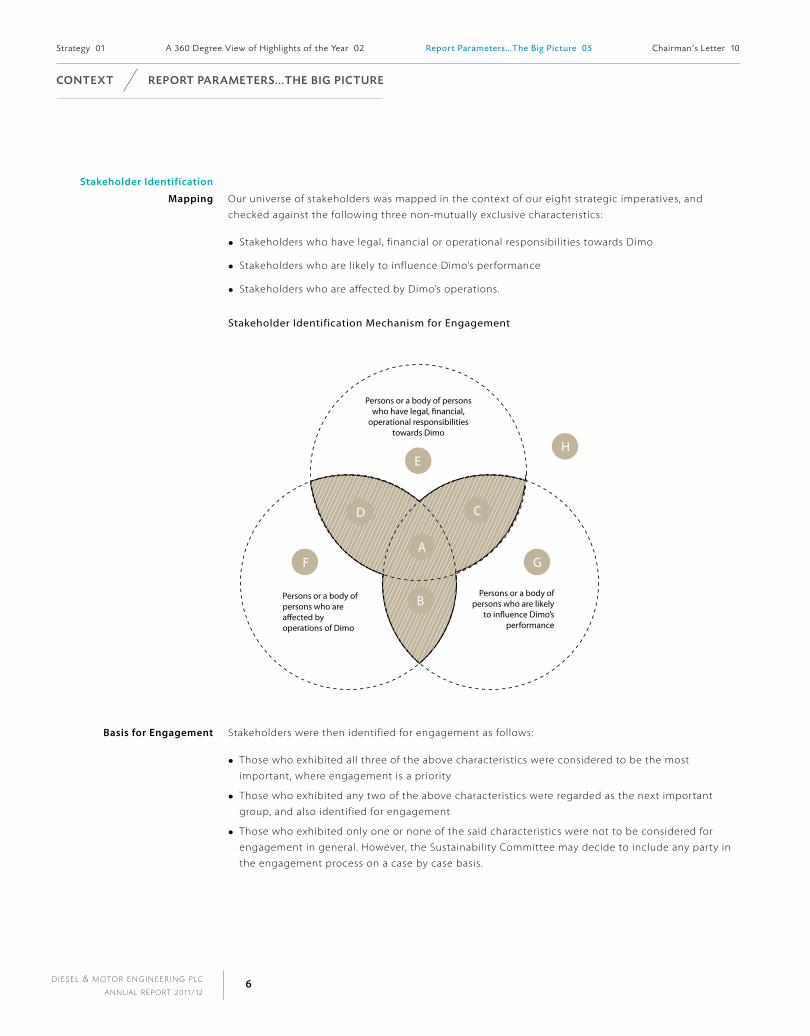
Stakeholder identification
mapping Our universe of stakeholders was mapped in the context of our eight strategic imperatives, and
checked against the following three non-mutually exclusive characteristics:
Stakeholders who have legal, financial or operational responsibilities towards Dimo
Stakeholders who are likely to influence Dimo’s performance
Stakeholders who are affected by Dimo’s operations.
Stakeholder Identification Mechanism for Engagement
Persons or a body of persons who have legal, �nancial,
operational responsibilities towards Dimo
Persons or a body of persons who are a�ected by operations of Dimo
Persons or a body of persons who are likely
to in�uence Dimo’sperformance
D
E
C
A
B
H
GF
Basis for Engagement Stakeholders were then identified for engagement as follows:
Those who exhibited all three of the above characteristics were considered to be the most
important, where engagement is a priority
Those who exhibited any two of the above characteristics were regarded as the next important
group, and also identified for engagement
Those who exhibited only one or none of the said characteristics were not to be considered for
engagement in general. However, the Sustainability Committee may decide to include any party in
the engagement process on a case by case basis.
Co n t e x t R e P o Rt PA R A M et e R S . . . t h e B I G P I C t U R e
Strategy 01 A 360 Degree View of highl ights of the Year 02 Report Parameters . . .The Big Picture 05 Chairman’s Letter 10

D I E S E L & M OTO R E N G I N E E R I N G P L C
A N N U A L R E P O RT 2 0 1 1 / 1 27
Stakeholder Engagement The following table depicts the various methods by which we engage with our important
stakeholder groups.
Stakeholders Process of Engagement
Shareholders One-to-one interview (by an independent third party on behalf of the Company)
Annual General Meeting provides an opportunity to review the past year ’s performance and
engage in discussions with the management
Annual Report
Quarterly reports provide a quarterly review of performance
Company website
Customers One-to-one interviews (by an independent third party)
Customer Relationship Management (CRM) process enables keeping in touch with the customer
on a daily basis. It helps to respond to queries and problems from the customer. ‘Problem
solving’ for challenges the customer faces is also done through the CRM process
A Customer Satisfaction Index maintained by each Business unit provides an assessment of
satisfaction levels and helps to improve problem solving capacities within the Company
Dimo ‘Fleet Owners Club’ - Customer Loyalty programme
Mercedes-Benz Club
24-hour roadside assistance
Dimo call centre
Employees One-to-one interviews (by an independent third party)
Focus group discussions (by an independent third party)
Employee Council meetings
Employee Portal ’Dimo net’ of the Company, accessible to every employee
Annual strategic planning meeting
Company’s ‘Open Door ’ policy encourages direct dialogue
Annual Employee Surveys - voluntary and confidential
HR Clinics - biannually
Individual Performance Reviews - biannually
Employee Rewards & Recognition
Product knowledge sharing session with employees
Business Partners and
Suppliers
One-to-one interviews (by an independent third party)
Supplier Code of Conduct
A high speed 24x7 on line link enables constant dialogue with principals. Issues discussed
include product quality, marketing, customer satisfaction and, ‘problem solving’
On site visits from principals and on site visits to principals’ locations facilitate engagement
Principals’ Reports - Compiled by Dimo annually and submitted to respective principals
R e P o Rt PA R A M et e R S . . . t h e B I G P I C t U R e Co n t e x t
The Operat ing Environment . . .and Trends 18 Ref in ing Our Portfol io . . .and Reinvent ing Our Future 23 Financia l Value Creat ion 24
D I E S E L & M OTO R E N G I N E E R I N G P L C
A N N U A L R E P O RT 2 0 1 1 / 1 28
Stakeholders Process of Engagement
Regulatory and
Government Agencies
One-to-one Interview (by an independent third party)
Community One-to-one interviews (by an independent third party)
Focus group discussions (by an independent third party)
Dialogue with Religious Dignitaries
Written and oral communications initiated by stakeholders
Company website
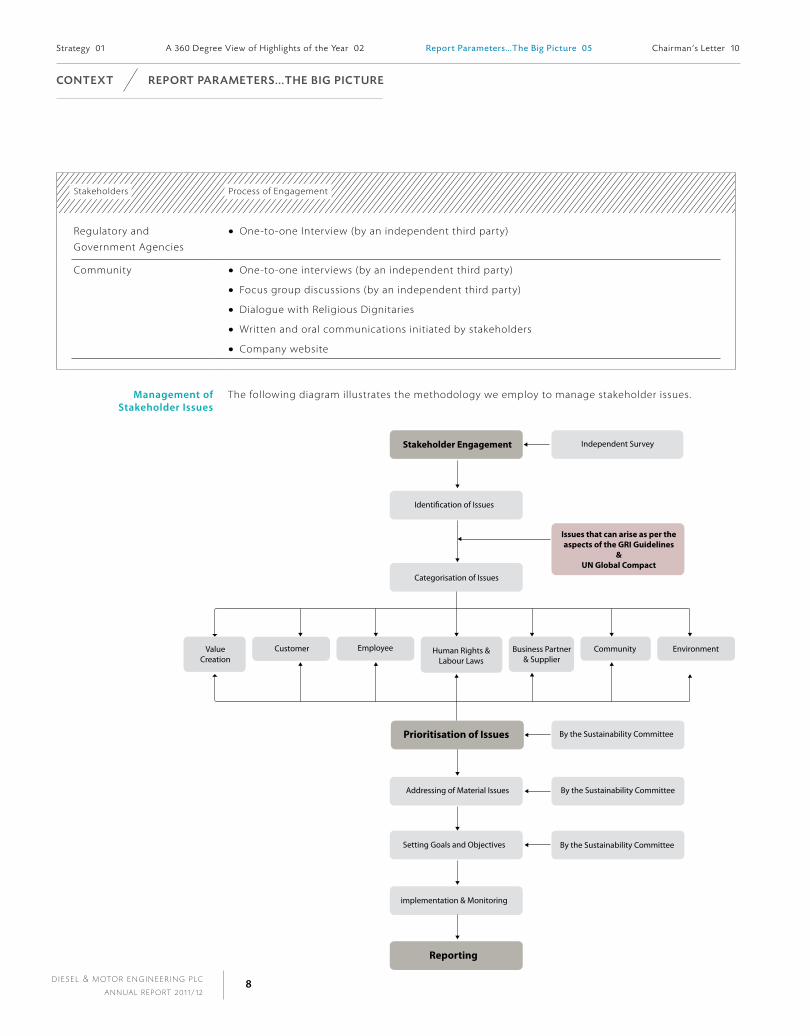
management of Stakeholder issues
The following diagram illustrates the methodology we employ to manage stakeholder issues.
Stakeholder Engagement
Prioritisation of Issues
Addressing of Material Issues
Setting Goals and Objectives
implementation & Monitoring
Reporting
Issues that can arise as per the aspects of the GRI Guidelines
&UN Global Compact
By the Sustainability Committee
By the Sustainability Committee
Independent Survey
By the Sustainability Committee
Categorisation of Issues
Identi�cation of Issues
Customer Human Rights & Labour Laws
EnvironmentBusiness Partner & Supplier
Value Creation
Employee Community
Co n t e x t R e P o Rt PA R A M et e R S . . . t h e B I G P I C t U R e
Strategy 01 A 360 Degree View of highl ights of the Year 02 Report Parameters . . .The Big Picture 05 Chairman’s Letter 10

D I E S E L & M OTO R E N G I N E E R I N G P L C
A N N U A L R E P O RT 2 0 1 1 / 1 29
materiality of Stakeholder issues
The issues identified were mapped according to their materiality as shown in the diagram
below. Materiality was assessed as being high, medium or low along two dimensions, namely,
(i) significance of economic, environmental and social impacts, and (ii) influence on stakeholder
assessments and decisions, and hence stakeholder priority.
1. Emissions, Effluents and Waste 2. Technical Education for Youth
3. Customer Health and Safety 4. Economic Performance
5. Employee Training and Education 6. Occupational Health and Safety
7. Equal Remuneration for Women and Men 8. Labour/Management Relations
9. Compliance 10. Materials & Energy Usage
11. Corruption 12. Diversity and Equal Opportunity
13. Investment and Procurement Practices for Local suppliers 14. Anti-Competitive Behaviour
15. Customer Privacy 16. Ethical Marketing Communications
17. Local Communities 18. Carbon Footprint
19. Mutually beneficial relationships with suppliers
Issues indicated in this area are of high signi�cance and impact for both stakeholders and the organisation. All indicators shown in this area are fully discussed in the report.
Issues found in this area of the grid have only a minor impact and are thus not reported on.
Issues indicated in this area have a relatively moderate impact on our business. They too were addressed during the reporting period and are fully or partially reported.
14 216
3 418
19
5 6
7 8917
15 1
HM
H
M
L
L M
1110
1213
R e P o Rt PA R A M et e R S . . . t h e B I G P I C t U R e Co n t e x t
The Operat ing Environment . . .and Trends 18 Ref in ing Our Portfol io . . .and Reinvent ing Our Future 23 Financia l Value Creat ion 24
Co n t e x t C h A I R M A n ’ S L E TT E R
Strategy 01 A 360 Degree View of highl ights of the Year 02 Report Parameters . . .The Big P icture 05 Chairman’s Letter 10

D I E S E L & M OTO R E N G I N E E R I N G P L C
A N N U A L R E P O RT 2 0 1 1 / 1 211
Riding on the favourable macroeconomic environment and duty regime of the previous year, the year
under review too is an all-time best for both Dimo and the Group. Dimo’s gross turnover grew by 36%
to Rs. 39,899 mn and profit after tax by 27% to Rs. 2,697 mn. The Group results too mirrored these
exemplary results.
In a nutshell, it was an excellent performance all round. The management report that follows provides
a discussion on our performance, supported by sections on stewardship, financial performance and
supplementary information.
Let me now bring you up to speed on our strategic thinking for the future. The business cycle
is getting shorter. While we conclude another year with outstanding results, we are entering an era
of challenge.
As I had mentioned in my previous letter, we were - and are - mindful of the two main factors that
contributed to our phenomenal growth in 2010/11; the decline in interest rates and the reduction
of duty on imported motor vehicles. A relatively stable exchange rate that prevailed during the first
three quarters also favoured this scenario.
We were well positioned to benefit from such an economic climate. However, there was also a
downside. The resulting surge in imports and increased consumption led to the overheating of the
economy in the second half of 2011. In response to the widening deficit in the balance of payments
the Central Bank of Sri Lanka intervened with corrective measures that included the depreciation of
the Rupee, a hike in policy rates and a curb on credit expansion by financial institutions. March 2012
saw an upward revision of the duty structure.
While these may well be early warning signals, they also serve to prepare us to face the future with
grit and determination.
The year 2012 will be one that will test our mettle. We have experienced difficult times in our long
history. We look back on them with pride and satisfaction, having overcome the hardships while
holding true to the Dimo ethos. The real challenge during such periods is to shield our customers
and employees from the adverse situations arising from the business cycle. Our customers’ businesses
and livelihoods are dependent on our unfailing service. The quality of life of the families that are
dependent on our employees cannot be compromised. As such, Dimo has to be consistent in its
delivery of value to them. They in turn will drive Dimo’s value creation. We work simultaneously to
keep our principals’ brands alive. Thus, while grappling with the demands that are before us,
we will not yield to short-term measures that would compromise our ongoing commitment to
our stakeholders.
C h A I R M A n ’ S L ett e R Co n t e x t
The year 2012 will
be one that will test
our mettle. We have
experienced difficult
times in our long
history. We look back
on them with pride
and satisfaction,
having overcome
the hardships while
holding true to the
Dimo ethos.
The Operat ing Environment . . .and Trends 18 Ref in ing Our Portfol io . . .and Reinvent ing Our Future 23 Financia l Value Creat ion 24
D I E S E L & M OTO R E N G I N E E R I N G P L C
A N N U A L R E P O RT 2 0 1 1 / 1 212
Last year we produced what is now acclaimed as Asia's first integrated annual report. That maiden
effort has been enhanced this year. Let me once again reiterate our eight strategic imperatives as they
form the basis for all our plans and actions; and naturally the structure of our report. Our six forms of
non-financial or intellectual capital - customers, employees, business partners, regulatory authorities,
community and concern for the environment - are in dynamic interaction to create financial value for
Dimo, our seventh form of capital. That’s only one side of the coin in economic value creation.
The other side is the value that Dimo delivers to each of the six forms of intellectual capital.
Encompassing the seven forms of capital is our business domain or portfolio mix - and managing this
is our eighth strategic imperative.
I would like to say more on this eighth imperative.
It is prudent to consider diversity when selecting an investment portfolio in order to reduce the risk.
The individual components of the portfolio should bring about synergies. They should also build on
the strengths of the Group and forge new pathways for sustainable development and growth.
Where do we stand in relation to the above concepts and principles?
What is most obvious is Dimo’s heavy concentration in the motor vehicles segment. That too
with high dependence on a select few, albeit prestigious, principals. All five business segments of
Dimo, being import-dependent, are exposed to the vagaries of the exchange rate and the tariff
structure. Both can change overnight, as we have seen in the recent past - with positive and
negative implications.
These prompt us to further our thinking.
Our priority is to deliver value to our customers, who are becoming more sophisticated and
demanding. We need to provide services at the customers’ doorstep, so to speak. With the post-war
development that is taking place in the entire country, we must reach out and have an island wide
presence at strategic locations. Coming all the way to Colombo for service is not an option, especially
for commercial vehicles.
During the year under review we established Dimo Customer Contact Points in many parts of
the country. The Siyambalape workshop facility was expanded, and the state-of-the-art Bosch
Centre which accommodates all popular vehicle makes and modern diesel injection systems was
commissioned.
Starting from Matara, we are introducing a new experience in vehicle tyre sales and service under the
banner ‘Tyre Plus’. Work is in progress on the construction of the TATA and Mercedes-Benz Centres;
sales and service centres in Jaffna, Trincomalee and Kurunegala; and the Dimo Technical Institute in
Sooriyawewa. These are major long-term investments. We are targeting investments totalling Rs. 5 bn
over the three years ending 2013/14.
Strategy 01 A 360 Degree View of highl ights of the Year 02 Report Parameters . . .The Big P icture 05 Chairman’s Letter 10
Co n t e x t C h A I R M A n ’ S L ett e R
D I E S E L & M OTO R E N G I N E E R I N G P L C
A N N U A L R E P O RT 2 0 1 1 / 1 213
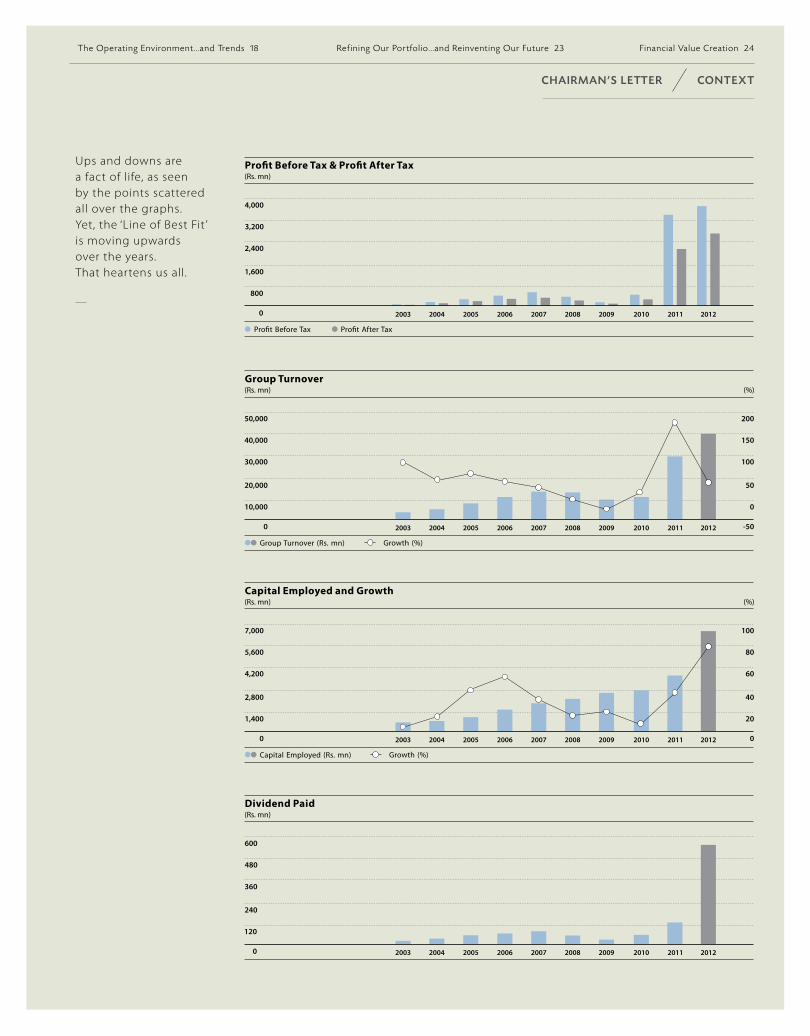
Ups and downs are a fact of life, as seen by the points scattered all over the graphs. Yet, the ‘Line of Best Fit ’ is moving upwards over the years. That heartens us all.
C h A I R M A n ’ S L ett e R Co n t e x t
The Operat ing Environment . . .and Trends 18 Ref in ing Our Portfol io . . .and Reinvent ing Our Future 23 Financia l Value Creat ion 24

D I E S E L & M OTO R E N G I N E E R I N G P L C
A N N U A L R E P O RT 2 0 1 1 / 1 214
Customer Relationship Management (CRM) also received considerable attention during the year.
Results of our annual customer satisfaction surveys provide the basis for continuous improvement
in all areas. A dedicated CRM Division is in operation that presently serves our vehicles segment.
Its scope will be expanded to cover other business segments in the near future. In September 2011
we launched a Call Centre to manage inquiries and complaints in a more systematic and structured
manner. Service standards and procedures are monitored, as we strive harder to raise the bar on
customer satisfaction through convenience, superior service and technical excellence.
We continue to invest in people through training and development; not only our employees, but also
those in the localities where we operate through voluntary programmes and the Dimo Automobile
Training Schools. We embarked on a large recruitment drive during the year that saw 567 persons
joining the Dimo Group to enhance our expanding business.
But that is not all. We must also proactively manage the risks inherent in our portfolio mix. We need
to hedge the dual risks of tariff revisions and the depreciation of the currency. One option is to create
greater value addition locally. We are currently negotiating with our principals to assemble passenger
vehicles in Sri Lanka. Another option is to look at backward integration into component manufacture
where we see fit.
Dimo is closely studying its business domain, or playing field, to manage its future in a sustainable
manner. Times change, and we with them. Business boundaries can expand or contract, or undergo a
paradigm shift.
Dimo has withstood the test of time. Good times and bad. The golden thread that kept the fabric
of our enterprise together through its seventy three-year history was, and is, our reputation. We
call it institutional integrity in accounting for our intellectual capital. This is our mainstay in an ever
changing business world.
I thank our customers for their valuable patronage and the fruitful relationships we have built. To earn
and retain their trust is of utmost importance to us.
Strategy 01 A 360 Degree View of highl ights of the Year 02 Report Parameters . . .The Big P icture 05 Chairman’s Letter 10
Co n t e x t C h A I R M A n ’ S L ett e R
D I E S E L & M OTO R E N G I N E E R I N G P L C
A N N U A L R E P O RT 2 0 1 1 / 1 215
To the Dimo Team - our own distinctive ‘Tribe’ - I congratulate you wholeheartedly for delivering yet
another year of splendid performance. I look forward to your continued commitment, dynamism and
effort as we move into challenging times.
As for our principals, we are honoured and touched by the confidence they have placed in us, some
going back half a century or more. We look forward to many more years of mutually beneficial
collaborations.
In keeping with the performance of the Company, the Board has recommended that we reward our
shareholders with a final dividend of Rs. 27.50 per share, which inclusive of the two previous interim
dividends, amounts to a total dividend payout of Rs. 40.00 per share for the year. We are encouraged
by the faith our shareholders have placed in our stewardship in driving the Company forward.
My colleagues on the Board continue to provide valuable guidance and counsel. We work as an
effective and dynamic team. While warmly thanking them I also look forward to their continued
support in what is sure to be a challenging, yet exciting year ahead.
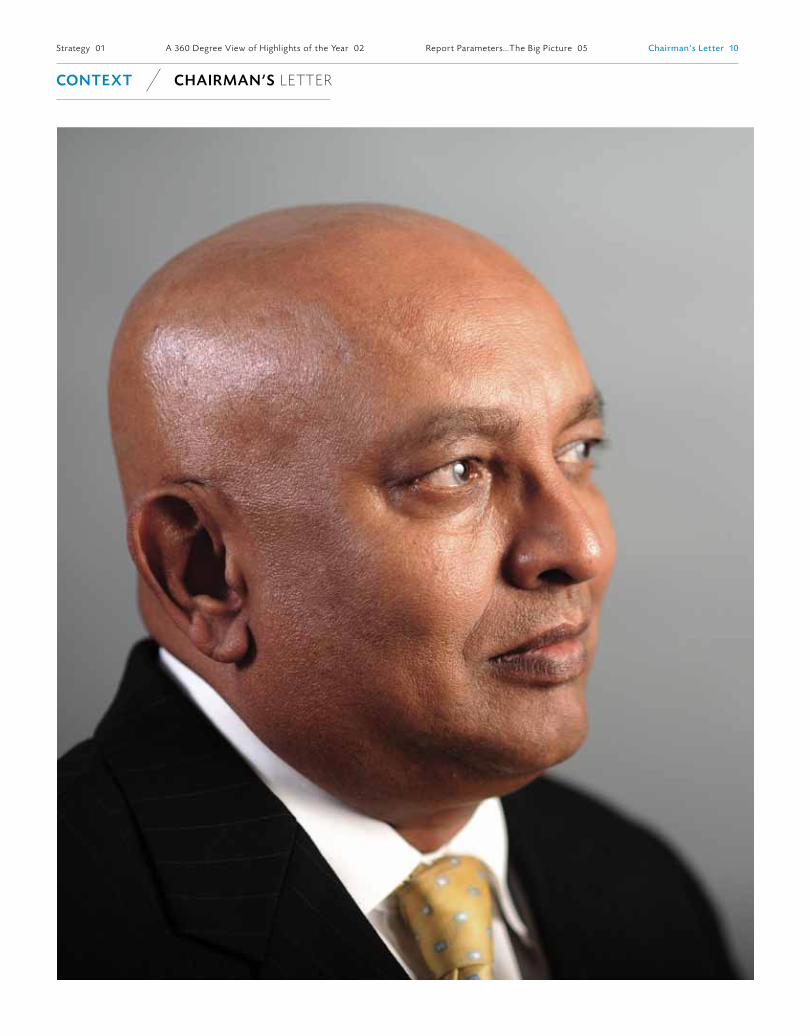
A. Ranjith PandithageChairman/Managing Director
Colombo
30th May 2012
C h A I R M A n ’ S L ett e R Co n t e x t
The Operat ing Environment . . .and Trends 18 Ref in ing Our Portfol io . . .and Reinvent ing Our Future 23 Financia l Value Creat ion 24
D I E S E L & M OTO R E N G I N E E R I N G P L C
A N N U A L R E P O RT 2 0 1 1 / 1 216
Topics Page
The Operating Environment...and Trends 18
Refining Our Portfolio...and Reinventing Our Future 23
Financial Value Creation 24
Delivering Value to Customers...and their Value to Us 40
Working at Dimo...Enjoyable and Rewarding 62
Our Business Partners...A Symbiotic Relationship 80
Regulatory Authorities...Playing by the Rules 88
Our Community...Live and Let Live 90
The Environment...Now and for Generations Yet Unborn 100
Sustainability Performance Objectives in 2011/12 112
managEmEnT rEpOrTGroup strategy given on page 1 and the description of our portfolio of
businesses together with their performance and prospects given in the
inner front cover forms part of this Management Report. We have tried to
leave out details that would dilute the most important points for a clear
and comprehensive picture.

D I E S E L & M OTO R E N G I N E E R I N G P L C
A N N U A L R E P O RT 2 0 1 1 / 1 217
M A n AG e M e n t R e P o Rt t h e o P e R At I n G e n v I Ro n M e n t . . . A N D T R E N D S
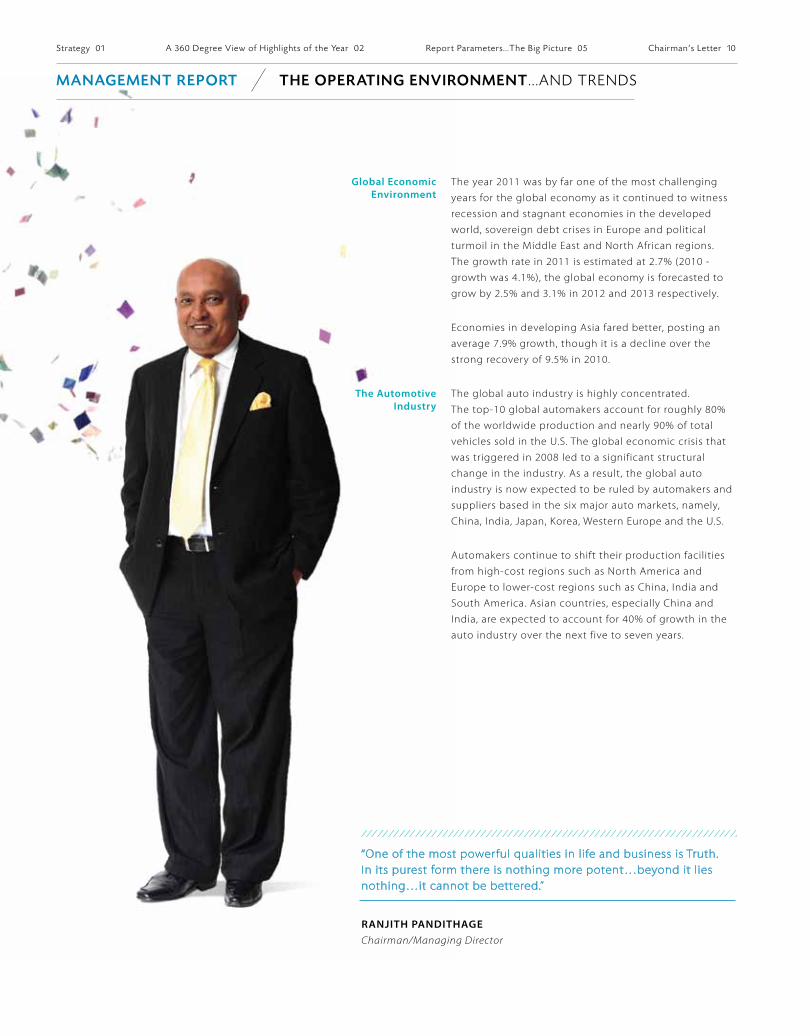
global Economic Environment
The year 2011 was by far one of the most challenging
years for the global economy as it continued to witness
recession and stagnant economies in the developed
world, sovereign debt crises in Europe and political
turmoil in the Middle East and North African regions.
The growth rate in 2011 is estimated at 2.7% (2010 -
growth was 4.1%), the global economy is forecasted to
grow by 2.5% and 3.1% in 2012 and 2013 respectively.
Economies in developing Asia fared better, posting an
average 7.9% growth, though it is a decline over the
strong recovery of 9.5% in 2010.
The automotive industry
The global auto industry is highly concentrated.
The top-10 global automakers account for roughly 80%
of the worldwide production and nearly 90% of total
vehicles sold in the U.S. The global economic crisis that
was triggered in 2008 led to a significant structural
change in the industry. As a result, the global auto
industry is now expected to be ruled by automakers and
suppliers based in the six major auto markets, namely,
China, India, Japan, Korea, Western Europe and the U.S.
Automakers continue to shift their production facilities
from high-cost regions such as North America and
Europe to lower-cost regions such as China, India and
South America. Asian countries, especially China and
India, are expected to account for 40% of growth in the
auto industry over the next five to seven years.
“One of the most powerful qualities in life and business is Truth. In its purest form there is nothing more potent…beyond it lies nothing…it cannot be bettered.”
ranjiTh pandiThagEChairman/Managing Director
Strategy 01 A 360 Degree View of highl ights of the Year 02 Report Parameters . . .The Big P icture 05 Chairman’s Letter 10

D I E S E L & M OTO R E N G I N E E R I N G P L C
A N N U A L R E P O RT 2 0 1 1 / 1 219
t h e o P e R At I n G e n v I Ro n M e n t. . . A n d t R e n d S M A n AG e M e n t R e P o Rt
The role of Governments is highly significant. Governments in all major countries have become
active auto industry players. Their energy and environmental policies will strongly influence the auto
industry in the coming years.
Rising fuel prices and global warming have turned attention to the auto industry to either rely
less on traditional fossil fuels or to use renewable sources of energy. Thus, 'green' alternatives such
as fuel-efficient electric vehicles (EVs) and hybrid vehicles will attract consumers in the affluent
countries while flex-fuels such as ethanol and natural gas will be in high demand in the emerging
auto markets due to their suitability with the local climate and resource base.
Some recent trends also show that automakers are concentrating on offering more optional fuel
efficient features even on the small and less gas-guzzler vehicles in order to attract buyers. The sale
of optional features is helping them offset lower profit margins for small cars relative to large trucks.
The Sri lankan Economy The economy grew 8.3% in 2011, the highest in Sri Lanka’s post-independence history, sustaining a
growth momentum of over 8% for the first time in two consecutive years. The 2011 performance was
largely driven by the consumption and investment boom following the restoration of peace. Inflation
remained subdued at a single digit level for the third consecutive year. Nevertheless, systemic
pressures during the second half of 2011 characterised by a widening deficit and a deteriorating
balance of payments position led to the Central Bank of Sri Lanka introducing some corrective
measures. These measures included a depreciation of the Rupee, a hike in policy rates and the
introduction of ceilings on credit expansion, which in turn may result in a somewhat lower rate of
GDP growth in 2012.
Transportation Sector Government fiscal policies on vehicle imports have a direct and significant impact on the sale of new
passenger vehicles, commercial vehicles, special purpose vehicles, vehicle spares, accessories and
tyres of the Dimo Group. The vehicle segment accounts for over 75% of the Group’s business and
hence merits further discussion. Some key statistics of the sector are given below:
The Operat ing Environment. . .and Trends 18 Ref in ing Our Portfol io . . .and Reinvent ing Our Future 23 Financia l Value Creat ion 24

D I E S E L & M OTO R E N G I N E E R I N G P L C
A N N U A L R E P O RT 2 0 1 1 / 1 220
M A n AG e M e n t R e P o Rt t h e o P e R At I n G e n v I Ro n M e n t. . . A n d t R e n d S
registration of motor vehicles in Sri lanka Class of Vehicle 2006 2007 2008 2009 2010 2011
Motor cars 27,578 22,603 20,237 5,762 23,072 57,886
Three-wheelers 64,466 43,068 44,804 37,364 85,648 138,426
Motor cycles 156,626 182,508 155,952 135,421 204,811 253,331
Buses 3,346 2,637 1,180 739 2,491 4,248
Dual purpose vehicles 7,245 5,193 2,856 1,280 11,712 33,518
Goods transport vehicles 20,436 18,408 14,038 8,225 11,845 14,818
Land vehicle 20,825 23,475 26,132 15,284 19,664 23,194
Total 300,522 297,892 265,199 204,075 359,243 525,421
Source: Department of Motor Traffic
Remarkable progress was seen in the transportation sector during 2011, particularly in road
development. The construction of highways, expressways, bridges, rehabilitation of existing roads
with special focus on roads in the Northern and Eastern Provinces, and construction of rural roads
under the ‘Maga Neguma’ programme continued throughout the year.
The public passenger transportation sector [road and rail] recorded a moderate growth in 2011.
The Sri Lanka Transport Board continued with its programme of refurbishing buses and adding them
back to the fleet. The number of buses owned by private operators decreased marginally by 4.3%,
although the average operational bus fleet countrywide increased by 3.9% in 2011.
Registration of new vehicles increased substantially during 2011. The number of buses registered
increased by 71%, mainly due to replacements in existing fleets. The number of motor cars registered
increased by 151% due to import duties that were lowered in 2010, increased real income levels,
the continuation of a low interest rate regime and the granting of permits to public servants to
import motor vehicles at concessionary rates of tax.
Strategy 01 A 360 Degree View of highl ights of the Year 02 Report Parameters . . .The Big P icture 05 Chairman’s Letter 10

D I E S E L & M OTO R E N G I N E E R I N G P L C
A N N U A L R E P O RT 2 0 1 1 / 1 221
t h e o P e R At I n G e n v I Ro n M e n t. . . A n d t R e n d S M A n AG e M e n t R e P o Rt
agriculture and fishing The performance of the Agriculture and Fishing sector impacts on the Dimo Group’s sales and
service of earth moving equipment, agricultural machinery, industrial refrigeration equipment and
marine solutions.
Extreme weather conditions experienced in the first quarter of the year, which negatively affected
agricultural production, resulted in Agriculture and Fishing recording a low growth of 1.5% in 2011
compared to the 7.0% growth of the previous year. However, supported by a bountiful Yala harvest in
paddy and other food crops in the second half of the year and the expansion of fishing and livestock
throughout the year along with the recovery in coconut production helped the sector to maintain a
11.2% share of GDP, which is a marginal decline from the 11.9% share of the previous year.
industry and Services The performance of Industry and Services sectors have a direct impact on the sale of road
construction machinery, forklifts, material handling machinery, racking systems, power tools and
accessories, and lamps, lighting fittings and accessories of the Group.
The Industry sector, which accounts for about 29.3% of GDP grew by 10.3% in 2011, following a 8.4%
growth in 2010. Reflecting the continued favourable environment for industries that prevailed during
the year, all sub-sectors contributed positively towards this impressive performance. The higher
growth in factory industry sub-sector, together with the 14.2% expansion in construction were the
major contributors to growth in the Industry sector.
Growth in the Construction sector was largely driven by public sector infrastructure development
projects (particularly ports, electricity and transportation) as well as private sector involvement in
construction activities.
Services, which is by far the largest sector of the economy that accounts for about 59.5% of
GDP, grew by 8.3% during the year compared to a growth of 8% in 2010. Riding on the post-war
resurgence in tourism, the hotels and restaurants sub-sector recorded a commendable growth of
26.4% in 2011 following a growth of 39.8% in the previous year.
Economic and Social infrastructure
This sector impacts on the sale of medical equipment, pumps, building technologies and power
engineering solutions of the Dimo Group.
power and Energy Electricity generation increased by 7.5% to 11,521 GWh in 2011 reflecting the expansion of
economic activities. In terms of capacity addition, the first phase (300 MW ) of the Norochcholai
Coal Power Plant was added to the national grid on a permanent basis in July 2011, while
construction work on the second phase was in progress during the year. Construction of the Upper
Kotmale Hydro Power Plant was also in progress while the Uma Oya Hydro Power Project is in the
initial stages of construction.
The ongoing rural electrification projects will bring the country closer to achieving its target of 100%
electrification by end 2013, which includes off-grid renewable energy solutions.
The Operat ing Environment. . .and Trends 18 Ref in ing Our Portfol io . . .and Reinvent ing Our Future 23 Financia l Value Creat ion 24
D I E S E L & M OTO R E N G I N E E R I N G P L C
A N N U A L R E P O RT 2 0 1 1 / 1 222
The Sustainable Energy Authority seeks to increase the share of renewable energy from non-
conventional sources to 10% by 2015 and 20% by 2020. It is noteworthy that independent power
producers who have hitherto focused on mini hydro power are now venturing into other renewable
energy technologies such as wind and biomass. The energy labelling programme of the Sustainable
Energy Authority continued to gain momentum in respect of Compact Fluorescent Lamps (CFL).
Plans are afoot to extend energy labelling to other products as well.
Water Supply The demand for pipe borne water continues to grow with urbanisation, changes in lifestyles and the
expansion of commercial and industrial activities. The total number of connections provided by the
National Water Supply and Drainage Board increased 7.1% during the year, bringing the total to
1.4 mn connections countrywide. In tandem, several water supply projects were in progress during
2011, while rain water harvesting is also implemented as an alternative approach where appropriate.
health Healthcare in Sri Lanka continued to develop, with the private sector playing an increasingly
significant role. Further, the potential for promoting health tourism in Sri Lanka is significant,
considering the existing competitive advantages of the industry, such as the highly skilled and
trained workforce and the country's strategic location.
Economic Outlook and implications
The Sri Lankan economy is projected to grow at a slower rate of 7.2% in 2012 compared to the over
8% growths of the two previous years. The increase in policy interest rates, limiting of domestic
credit expansion, and rising domestic fuel and electricity prices are likely to somewhat dampen
economic activity, and also have a direct impact on the sale of vehicles. As a direct measure to curb
the importation of vehicles, Government increased tariffs on most types of vehicles with effect from
31 March 2012. Small petrol cars of less than 1000 cc capacity were among those that were most
severely affected.
Other key challenges in 2012 would be in managing the numerous risks arising from global
developments, as clear signs of global recovery are yet to be seen while geopolitical tensions
in some oil-producing countries continue to remain unresolved. Meanwhile, adverse weather
conditions and higher demand from emerging economies would continue to keep energy and other
commodity prices in the international market elevated.
As for Dimo, our primary principals in terms of business volume are based in Germany and India, and
it is comforting to note that both countries have been relatively unaffected by the global economic
crisis and its aftermath.
Increased economic activity locally has contributed to a continued low rate of unemployment, and
further tightening of labour market conditions may pose challenges to economic and price stability
as well as social stability.
Sri Lanka’s tourism industry is poised to grow rapidly, and presents opportunities centred on tourism
infrastructure development and services.
Overall, following the many notable achievements during the past two years, the Sri Lankan economy
is likely to experience a year of consolidation in 2012.
Strategy 01 A 360 Degree View of highl ights of the Year 02 Report Parameters . . .The Big P icture 05 Chairman’s Letter 10
M A n AG e M e n t R e P o Rt t h e o P e R At I n G e n v I Ro n M e n t. . . A n d t R e n d S

“Dimo is proud to ‘own’ a great heritage featuring great customers… great staff…great shareholders…great principals. Importantly we match the greatness of these assets with equally great culture and spirit…ethics…products. This is Dimo’s unique strength.”
gahanaTh pandiThagEChief Executive Officer
R e F I n I n G o U R P o Rt F o L I o . . . A N D R E I N V E N T I N G O U R F U T U R E M A n AG e M e n t R e P o Rt
Selecting an investment portfolio is essentially
all about diversification. The strategic objective
is to select a mix of assets that collectively has a
lower risk than any individual asset.
Different types of assets often change in value
in opposite ways.
Therefore, from a risk management perspective
assets in an investment portfolio should not
be selected individually, each on its own merit.
Rather, we should consider how the return on
each asset changes in value relative to others in
the portfolio under different scenarios.
By holding different assets whose returns are
not perfectly positively correlated we seek to
reduce the risk, or more precisely the expected
variance of the portfolio return.
That brings us to the concept of trade-off . In
general, assets with higher expected returns are
riskier, and vice versa. Investing is a trade-off
between risk and expected return.
Having defined our level or appetite for risk, we
also look for synergies in selecting and refining
our portfolio. We seek businesses that build on
Group strengths. We balance the short-term
with the long-term.
So, refining the Dimo portfolio entails a
continuous process of finding an optimum
portfolio strategy... and reinventing our business
domain to ensure a sustainable future.
Some thoughts on the subject are discussed in
the Chairman's Letter.
The Operat ing Environment . . .and Trends 18 Refining Our Portfol io . . .and Reinventing Our Future 23 Financia l Value Creat ion 24
D I E S E L & M OTO R E N G I N E E R I N G P L C
A N N U A L R E P O RT 2 0 1 1 / 1 224
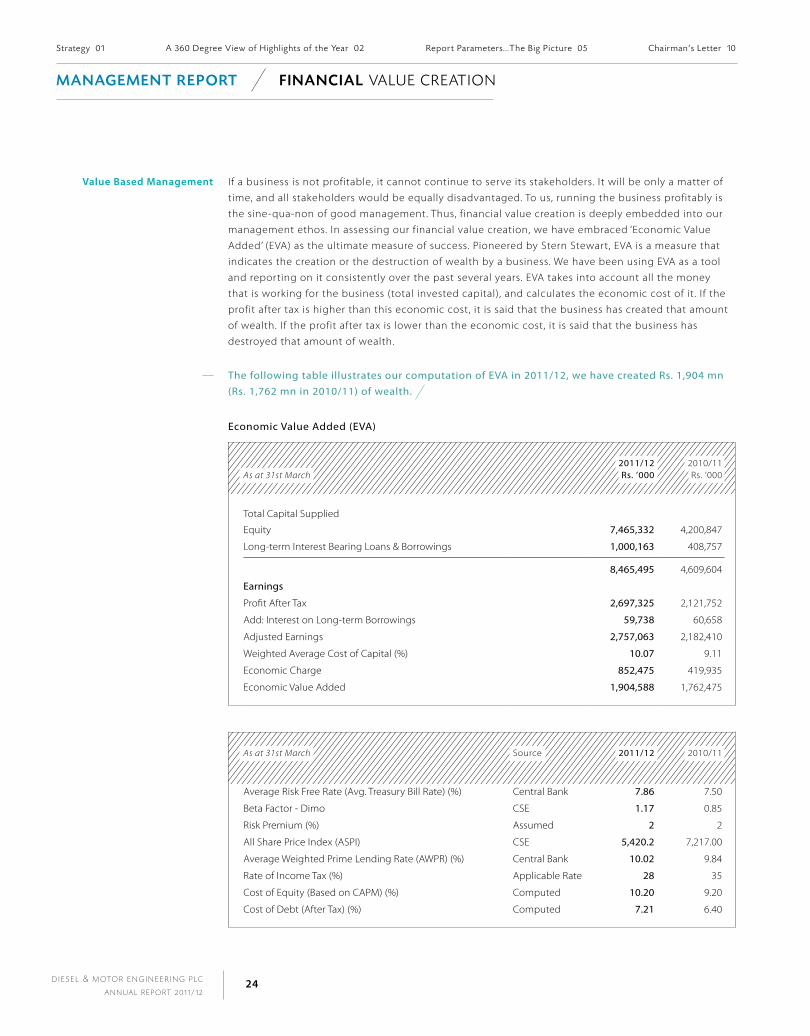
value Based management If a business is not profitable, it cannot continue to serve its stakeholders. It will be only a matter of
time, and all stakeholders would be equally disadvantaged. To us, running the business profitably is
the sine-qua-non of good management. Thus, financial value creation is deeply embedded into our
management ethos. In assessing our financial value creation, we have embraced ‘Economic Value
Added’ (EVA) as the ultimate measure of success. Pioneered by Stern Stewart, EVA is a measure that
indicates the creation or the destruction of wealth by a business. We have been using EVA as a tool
and reporting on it consistently over the past several years. EVA takes into account all the money
that is working for the business (total invested capital), and calculates the economic cost of it. If the
profit after tax is higher than this economic cost, it is said that the business has created that amount
of wealth. If the profit after tax is lower than the economic cost, it is said that the business has
destroyed that amount of wealth.
The following table illustrates our computation of EVA in 2011/12, we have created Rs. 1,904 mn (Rs. 1,762 mn in 2010/11) of wealth.
Economic Value Added (EVA)
As at 31st March2011/12Rs. ’000
2010/11Rs. ’000
Total Capital Supplied
Equity 7,465,332 4,200,847
Long-term Interest Bearing Loans & Borrowings 1,000,163 408,757
8,465,495 4,609,604
Earnings
Profit After Tax 2,697,325 2,121,752
Add: Interest on Long-term Borrowings 59,738 60,658
Adjusted Earnings 2,757,063 2,182,410
Weighted Average Cost of Capital (%) 10.07 9.11
Economic Charge 852,475 419,935
Economic Value Added 1,904,588 1,762,475
As at 31st March Source 2011/12 2010/11
Average Risk Free Rate (Avg. Treasury Bill Rate) (%) Central Bank 7.86 7.50
Beta Factor - Dimo CSE 1.17 0.85
Risk Premium (%) Assumed 2 2
All Share Price Index (ASPI) CSE 5,420.2 7,217.00
Average Weighted Prime Lending Rate (AWPR) (%) Central Bank 10.02 9.84
Rate of Income Tax (%) Applicable Rate 28 35
Cost of Equity (Based on CAPM) (%) Computed 10.20 9.20
Cost of Debt (After Tax) (%) Computed 7.21 6.40
M A n AG e M e n t R e P o Rt F I n A n C I A L VA LU E C R E AT I O N
Strategy 01 A 360 Degree View of highl ights of the Year 02 Report Parameters . . .The Big P icture 05 Chairman’s Letter 10

D I E S E L & M OTO R E N G I N E E R I N G P L C
A N N U A L R E P O RT 2 0 1 1 / 1 225
We also look at value added and the distribution thereof. Value added equals our revenue minus cost
of goods and services purchased. It indicates the value that has been created by Dimo through the
utilisation of its capacity, capital, manpower and other resources.
Statement of value added
Group Company
For the Period of%
2011/12Rs. ’000 %
2010/11Rs. ’000 %
2011/12Rs. ’000 %
2010/11Rs. ’000
Gross Turnover 39,898,589 29,357,271 38,936,764 28,662,124
Other Income 60,521 48,742 43,968 51,245
Less: Cost of Materials and Services Bought in (29,386,650) (20,344,370) (28,789,832) (19,862,467)
Value Added 10,572,460 9,061,643 10,190,900 8,850,902
Value Shared with
Employees 13 1,372,494 11 1,037,261 12 1,211,045 11 945,365
Government 57 6,062,532 61 5,571,287 59 5,977,377 62 5,478,291
Lenders 04 253,890 03 207,674 03 267,900 02 207,184
Community Investment - Donations 00 51,055 00 30,570 00 50,526 00 30,305
Shareholders 03 355,057 06 530,846 03 355,057 06 530,846
Retained in the Business 23 2,477,432 19 1,684,005 23 2,328,994 19 1,658,911
Depreciation set aside 01 135,164 01 93,099 01 129,965 01 85,852
Profit Retained 22 2,342,268 18 1,590,906 22 2,199,029 18 1,573,059
100 10,572,460 100 9,061,643 100 10,190,900 100 8,850,902
The above table illustrates the creation of our value added and the distribution thereof. Our value added has grown from Rs. 9,062 mn in the previous year to Rs. 10,572 mn in the year under review. A great part of the value added in 2011/12 has been retained in the business enhancing the Group’s investment capacity very significantly. Likewise, the value distributed among Government by way of customs duties and taxation and employees has also increased.
Group Value Added
(%)
Employees
Government
Lenders
Community Investment-donations
Shareholders
Retained in Business
2011/12
57%
4%
0%
23%
3%
13% 11%
61%
2010/11
19%
3%
6%
0%
The Operat ing Environment . . .and Trends 18 Ref in ing Our Portfol io . . .and Reinvent ing Our Future 23 Financia l Value Creation 24
F I n A n C I A L vA LU e C R e At I o n M A n AG e M e n t R e P o Rt
D I E S E L & M OTO R E N G I N E E R I N G P L C
A N N U A L R E P O RT 2 0 1 1 / 1 226
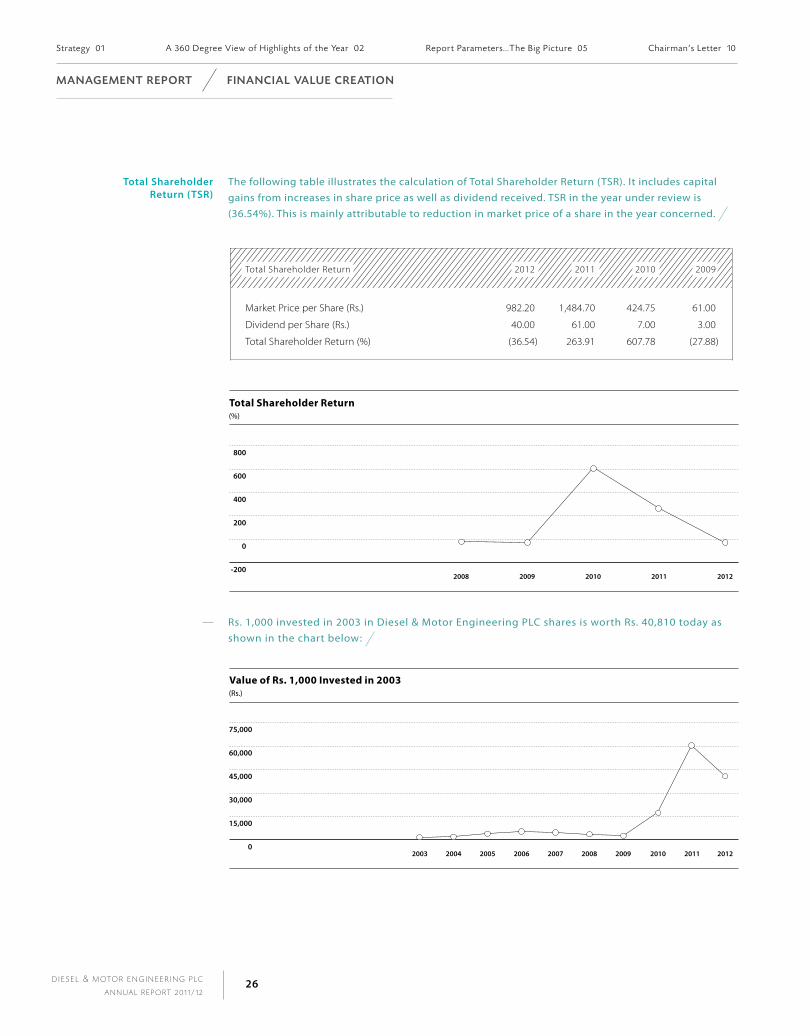
Total Shareholder return (TSr)
The following table illustrates the calculation of Total Shareholder Return (TSR). It includes capital gains from increases in share price as well as dividend received. TSR in the year under review is (36.54%). This is mainly attributable to reduction in market price of a share in the year concerned.
Total Shareholder Return 2012 2011 2010 2009
Market Price per Share (Rs.) 982.20 1,484.70 424.75 61.00
Dividend per Share (Rs.) 40.00 61.00 7.00 3.00
Total Shareholder Return (%) (36.54) 263.91 607.78 (27.88)
Rs. 1,000 invested in 2003 in Diesel & Motor Engineering PLC shares is worth Rs. 40,810 today as shown in the chart below:
Strategy 01 A 360 Degree View of highl ights of the Year 02 Report Parameters . . .The Big P icture 05 Chairman’s Letter 10
M A n AG e M e n t R e P o Rt F I n A n C I A L vA LU e C R e At I o n
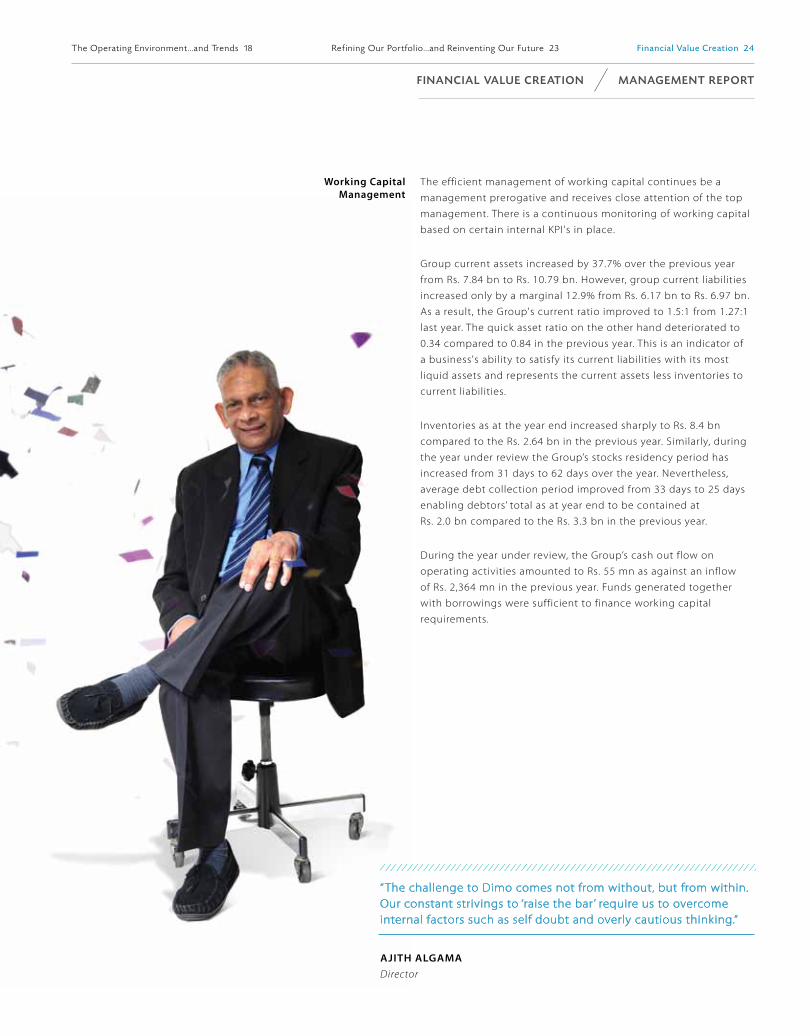
“The challenge to Dimo comes not from without, but from within. Our constant strivings to ‘raise the bar ’ require us to overcome internal factors such as self doubt and overly cautious thinking.”
ajiTh algamaDirector
Working Capital management
The efficient management of working capital continues be a
management prerogative and receives close attention of the top
management. There is a continuous monitoring of working capital
based on certain internal KPI's in place.
Group current assets increased by 37.7% over the previous year
from Rs. 7.84 bn to Rs. 10.79 bn. However, group current liabilities
increased only by a marginal 12.9% from Rs. 6.17 bn to Rs. 6.97 bn.
As a result, the Group's current ratio improved to 1.5:1 from 1.27:1
last year. The quick asset ratio on the other hand deteriorated to
0.34 compared to 0.84 in the previous year. This is an indicator of
a business's ability to satisfy its current liabilities with its most
liquid assets and represents the current assets less inventories to
current liabilities.
Inventories as at the year end increased sharply to Rs. 8.4 bn
compared to the Rs. 2.64 bn in the previous year. Similarly, during
the year under review the Group’s stocks residency period has
increased from 31 days to 62 days over the year. Nevertheless,
average debt collection period improved from 33 days to 25 days
enabling debtors’ total as at year end to be contained at
Rs. 2.0 bn compared to the Rs. 3.3 bn in the previous year.
During the year under review, the Group’s cash out flow on
operating activities amounted to Rs. 55 mn as against an inflow
of Rs. 2,364 mn in the previous year. Funds generated together
with borrowings were sufficient to finance working capital
requirements.
The Operat ing Environment . . .and Trends 18 Ref in ing Our Portfol io . . .and Reinvent ing Our Future 23 Financia l Value Creation 24
F I n A n C I A L vA LU e C R e At I o n M A n AG e M e n t R e P o Rt

D I E S E L & M OTO R E N G I N E E R I N G P L C
A N N U A L R E P O RT 2 0 1 1 / 1 228
financial review
Overview
Dimo delivered another solid financial performance for the year under review. The results demonstrate
the underlying potential of Dimo to create financial value. The year ’s performance was a further
improvement to the excellent results recorded in the previous year. Improved revenues supported by a
lower rate of income tax drove up the Group Profit after Tax by 27%. As in the previous years, the Auto-
related businesses dominated the revenue streams and profits.
financial Environment The GDP growth of 8.3% recorded for the year 2011 was a key factor that provided the impetus for the
year ’s achievement. A decline in the conducive business environment that prevailed during the first
half of the year occurred during the third quarter with interest rates moving upwards and the trend
continuing into the last quarter to be joined by a markedly depreciating Rupee. The Sri Lankan Rupee
depreciated 17.40% during the year and is one of the highest rates of depreciation during the recent
times. 12.78% of the depreciation came in the fourth quarter. The AWPLR which stood at 9.22% at
the beginning of the year was 12.80% at the end of the year. This caused the lease rentals to increase
which had an impact on the automobile sales towards the end of the 4th Quarter. Overall, what was
considered to be an excellent business environment at the commencement of the year changed
towards the end of the year.
Table below provides the quarterly turnover and profit after tax of the Group together with relevant key
indicators of financial and economic environment.
Quarterly performance & Economic indicators
2011/12 (Rs. ’000) 2010/11 (Rs. ’000)
Segment Performance 1st
Quarter2nd
Quarter3rd
Quarter4th
Quarter Total1st
Quarter2nd
Quarter3rd
Quarter4th
Quarter Total
Vehicles Revenue 5,404,789 8,394,255 8,399,064 9,323,772 31,521,880 2,120,665 3,729,272 9,543,479 6,705,695 22,099,111
Results 752,766 1,115,131 977,196 942,748 3,787,841 216,670 523,258 1,486,348 992,754 3,219,030
Vehicle Parts & Service Revenue 723,157 658,366 791,116 682,344 2,854,983 659,831 650,758 729,590 781,563 2,821,742
Results 123,309 155,814 135,070 53,406 467,599 (7,572) 216,490 68,486 252,343 529,747
Lighting & Power Tools Revenue 165,974 194,569 174,241 152,652 687,436 112,519 143,705 373,178 268,731 898,133
Results 308 (5,034) (19,630) 31,952 7,596 277 32,454 44,123 31,931 108,785
Construction, Agricultural & Material Handling Machinery Revenue 793,329 1,276,887 989,891 905,625 3,965,732 408,551 769,749 1,108,122 707,520 2,993,942
Results 79,858 149,701 65,751 15,194 310,504 (25,470) 127,959 109,590 91,930 304,009
Electro - Mechanical and Bio Medical Engineering Revenue 157,426 245,642 231,708 233,782 868,558 116,376 38,173 286,058 103,736 544,343
Results 63,186 41,491 41,451 (15,809) 130,319 23,649 61,896 847 (25,392) 61,000
Total Revenue 7,244,675 10,769,689 10,585,912 11,298,313 39,898,589 3,417,942 5,331,657 12,040,427 8,567,245 29,357,271
Total Results 1,019,427 1,457,103 1,199,838 1,027,491 4,703,859 207,554 962,057 1,709,394 1,343,566 4,222,571
Economic IndicatorsExchange Rate (Quarter beginning) US$ 110.36 111.05 114.88 129.57 114.82 114.36 112.84 111.82
Euro 160.8 151.38 149.59 173.87 155.8 140.03 154.86 149.55
AWPLR % 9.22 9.13 10.77 12.80 10.62 10.37 9.91 8.92
Inflation (CCPI 2006/07 = 100) 6.60 7.00 7.10 6.50 3.4 4.2 5.4 6.00
GDP Growth (%) - Calender Year 8.30 8.00
Strategy 01 A 360 Degree View of highl ights of the Year 02 Report Parameters . . .The Big P icture 05 Chairman’s Letter 10
M A n AG e M e n t R e P o Rt F I n A n C I A L vA LU e C R e At I o n
D I E S E L & M OTO R E N G I N E E R I N G P L C
A N N U A L R E P O RT 2 0 1 1 / 1 229
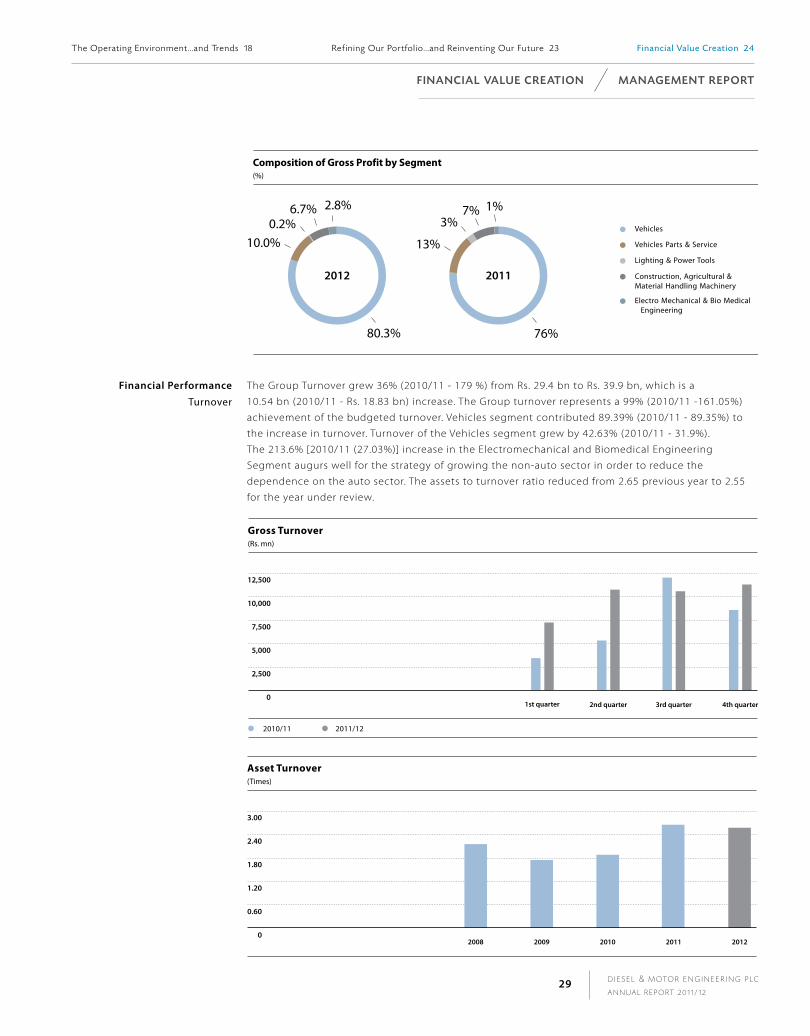
Composition of Gross Profit by Segment
(%)
Vehicles
Vehicles Parts & Service
Lighting & Power Tools
Construction, Agricultural &
Material Handling Machinery
Electro Mechanical & Bio Medical
Engineering
2012
80.3%
10.0%
0.2%6.7% 2.8% 1%
76%
2011
7%
13%
3%
financial performance
Turnover
The Group Turnover grew 36% (2010/11 - 179 %) from Rs. 29.4 bn to Rs. 39.9 bn, which is a
10.54 bn (2010/11 - Rs. 18.83 bn) increase. The Group turnover represents a 99% (2010/11 -161.05%)
achievement of the budgeted turnover. Vehicles segment contributed 89.39% (2010/11 - 89.35%) to
the increase in turnover. Turnover of the Vehicles segment grew by 42.63% (2010/11 - 31.9%).
The 213.6% [2010/11 (27.03%)] increase in the Electromechanical and Biomedical Engineering
Segment augurs well for the strategy of growing the non-auto sector in order to reduce the
dependence on the auto sector. The assets to turnover ratio reduced from 2.65 previous year to 2.55
for the year under review.
2,500
5,000
7,500
10,000
12,500
0
Gross Turnover
(Rs. mn)
1st quarter
2010/11 2011/12
2nd quarter 3rd quarter 4th quarter
The Operat ing Environment . . .and Trends 18 Ref in ing Our Portfol io . . .and Reinvent ing Our Future 23 Financia l Value Creation 24
F I n A n C I A L vA LU e C R e At I o n M A n AG e M e n t R e P o Rt
D I E S E L & M OTO R E N G I N E E R I N G P L C
A N N U A L R E P O RT 2 0 1 1 / 1 230
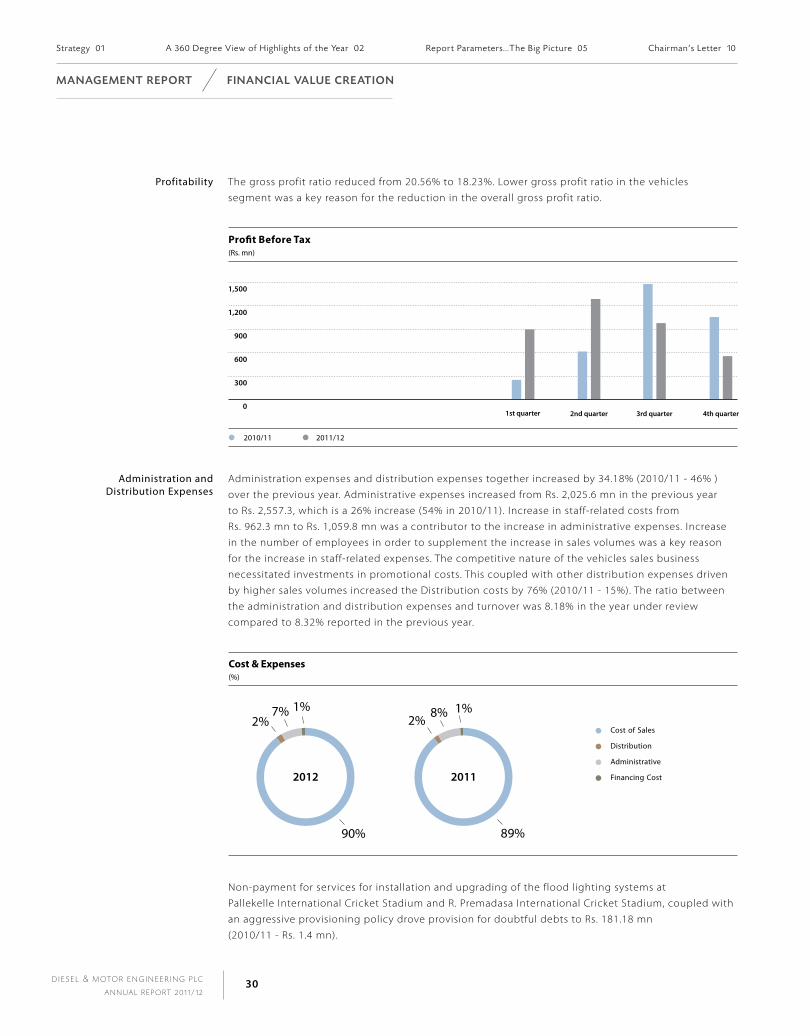
Profitability The gross profit ratio reduced from 20.56% to 18.23%. Lower gross profit ratio in the vehicles
segment was a key reason for the reduction in the overall gross profit ratio.
Administration and Distribution Expenses
Administration expenses and distribution expenses together increased by 34.18% (2010/11 - 46% )
over the previous year. Administrative expenses increased from Rs. 2,025.6 mn in the previous year
to Rs. 2,557.3, which is a 26% increase (54% in 2010/11). Increase in staff-related costs from
Rs. 962.3 mn to Rs. 1,059.8 mn was a contributor to the increase in administrative expenses. Increase
in the number of employees in order to supplement the increase in sales volumes was a key reason
for the increase in staff-related expenses. The competitive nature of the vehicles sales business
necessitated investments in promotional costs. This coupled with other distribution expenses driven
by higher sales volumes increased the Distribution costs by 76% (2010/11 - 15%). The ratio between
the administration and distribution expenses and turnover was 8.18% in the year under review
compared to 8.32% reported in the previous year.
Non-payment for services for installation and upgrading of the flood lighting systems at
Pallekelle International Cricket Stadium and R. Premadasa International Cricket Stadium, coupled with
an aggressive provisioning policy drove provision for doubtful debts to Rs. 181.18 mn
(2010/11 - Rs. 1.4 mn).
Strategy 01 A 360 Degree View of highl ights of the Year 02 Report Parameters . . .The Big P icture 05 Chairman’s Letter 10
M A n AG e M e n t R e P o Rt F I n A n C I A L vA LU e C R e At I o n

D I E S E L & M OTO R E N G I N E E R I N G P L C
A N N U A L R E P O RT 2 0 1 1 / 1 231
Other Income/Expenses The demolition of existing buildings to give way to construction of the proposed Mercedes Benz
Centre at Sirimavo Bandaranaike Mawatha, Colombo 14, necessitated derecognition of the demolished
buildings, the written down value of which stood at Rs. 72.5 mn. The overall loss on disposal of
property, plant & equipment for the year was Rs. 67.84 mn (2010/11 - a gain of Rs. 2.63 mn).
Net Finance Cost The increase in short-term borrowings to support the increased volume of business and the gradual
increase in interest rates during the second half of the financial year caused finance expenses to
increase by 49% (Decreased by 17% - 2010/11) from Rs. 303 mn in the previous year to
Rs. 451 mn. The interest cover was 15.64 times (2010/11 - 17.35 times). Interest cost on long-term
borrowings remained at the same levels while interest cost on short-term borrowings increased from
Rs. 241 mn in the previous year to Rs. 390 mn in the year under review.
The Operat ing Environment . . .and Trends 18 Ref in ing Our Portfol io . . .and Reinvent ing Our Future 23 Financia l Value Creation 24
F I n A n C I A L vA LU e C R e At I o n M A n AG e M e n t R e P o Rt
D I E S E L & M OTO R E N G I N E E R I N G P L C
A N N U A L R E P O RT 2 0 1 1 / 1 232
Taxation The rate of income tax applicable to the Company and its subsidiaries reduced from 35% to 28%
with effect from 1st April 2011. This led to a reduction in the income tax expense from
Rs. 1,274.2 mn in the previous year to Rs. 1,018.7 mn in the year under review, despite an increase
in the Profit Before Tax from Rs. 3,396 mn to 3,716 mn. The effective tax rate was 28.57% (2010/11 -
35.57%). Taxable income on export profits was Rs. 80 mn on which a lower income tax rate of 12%
was applicable. The reconciliation between accounting profits and taxable income is available in
Note 12.1 on page 185. The Social Responsibility Levy that was applicable during the financial year
2010/11 was abolished with effect from 1st April 2011.
Deferred Taxation The tax expenses include a reversal of Rs. 29.8 mn (a charge of Rs. 30 mn in 2010/11) in respect of
deferred tax. A summary of the deferred tax computation is available in Note 12 to the Financial
Statements on page 185.
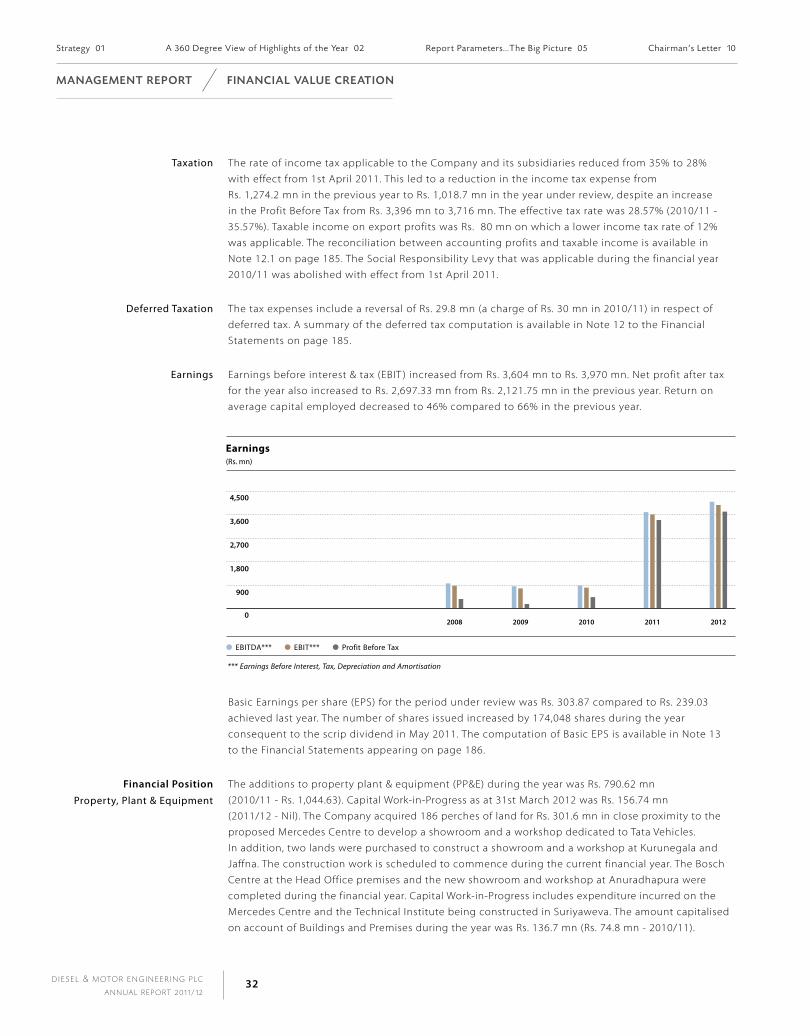
Earnings Earnings before interest & tax (EBIT ) increased from Rs. 3,604 mn to Rs. 3,970 mn. Net profit after tax
for the year also increased to Rs. 2,697.33 mn from Rs. 2,121.75 mn in the previous year. Return on
average capital employed decreased to 46% compared to 66% in the previous year.
Basic Earnings per share (EPS) for the period under review was Rs. 303.87 compared to Rs. 239.03
achieved last year. The number of shares issued increased by 174,048 shares during the year
consequent to the scrip dividend in May 2011. The computation of Basic EPS is available in Note 13
to the Financial Statements appearing on page 186.
financial position
Property, Plant & Equipment
The additions to property plant & equipment (PP&E) during the year was Rs. 790.62 mn
(2010/11 - Rs. 1,044.63). Capital Work-in-Progress as at 31st March 2012 was Rs. 156.74 mn
(2011/12 - Nil). The Company acquired 186 perches of land for Rs. 301.6 mn in close proximity to the
proposed Mercedes Centre to develop a showroom and a workshop dedicated to Tata Vehicles.
In addition, two lands were purchased to construct a showroom and a workshop at Kurunegala and
Jaffna. The construction work is scheduled to commence during the current financial year. The Bosch
Centre at the Head Office premises and the new showroom and workshop at Anuradhapura were
completed during the financial year. Capital Work-in-Progress includes expenditure incurred on the
Mercedes Centre and the Technical Institute being constructed in Suriyaweva. The amount capitalised
on account of Buildings and Premises during the year was Rs. 136.7 mn (Rs. 74.8 mn - 2010/11).
Strategy 01 A 360 Degree View of highl ights of the Year 02 Report Parameters . . .The Big P icture 05 Chairman’s Letter 10
M A n AG e M e n t R e P o Rt F I n A n C I A L vA LU e C R e At I o n
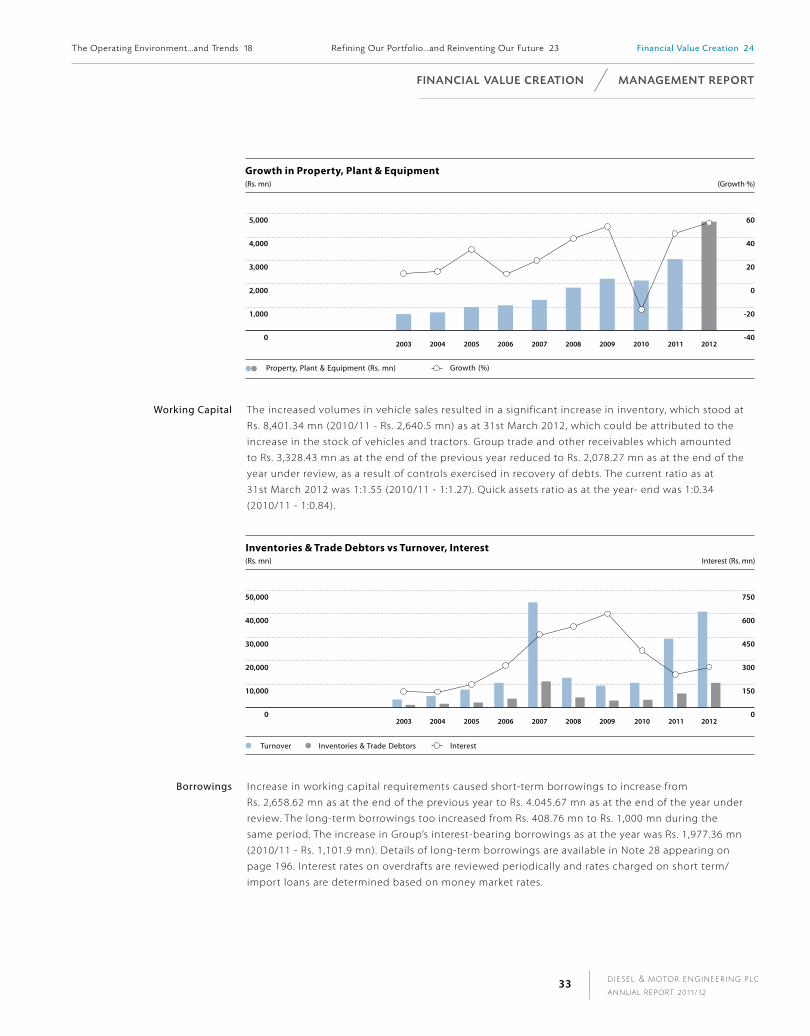
D I E S E L & M OTO R E N G I N E E R I N G P L C
A N N U A L R E P O RT 2 0 1 1 / 1 233
Working Capital The increased volumes in vehicle sales resulted in a significant increase in inventory, which stood at
Rs. 8,401.34 mn (2010/11 - Rs. 2,640.5 mn) as at 31st March 2012, which could be attributed to the
increase in the stock of vehicles and tractors. Group trade and other receivables which amounted
to Rs. 3,328.43 mn as at the end of the previous year reduced to Rs. 2,078.27 mn as at the end of the
year under review, as a result of controls exercised in recovery of debts. The current ratio as at
31st March 2012 was 1:1.55 (2010/11 - 1:1.27). Quick assets ratio as at the year- end was 1:0.34
(2010/11 - 1:0.84).
0
(Rs. mn)
Inventories & Trade Debtors vs Turnover, Interest
10,000
20,000
30,000
40,000
50,000
0
150
300
450
600
750
Interest
20122010200720052003 2004 2006 2008 20112009
Turnover Inventories & Trade Debtors
Interest (Rs. mn)
Borrowings Increase in working capital requirements caused short-term borrowings to increase from
Rs. 2,658.62 mn as at the end of the previous year to Rs. 4.045.67 mn as at the end of the year under
review. The long-term borrowings too increased from Rs. 408.76 mn to Rs. 1,000 mn during the
same period. The increase in Group’s interest-bearing borrowings as at the year was Rs. 1,977.36 mn
(2010/11 - Rs. 1,101.9 mn). Details of long-term borrowings are available in Note 28 appearing on
page 196. Interest rates on overdrafts are reviewed periodically and rates charged on short term/
import loans are determined based on money market rates.
The Operat ing Environment . . .and Trends 18 Ref in ing Our Portfol io . . .and Reinvent ing Our Future 23 Financia l Value Creation 24
F I n A n C I A L vA LU e C R e At I o n M A n AG e M e n t R e P o Rt

D I E S E L & M OTO R E N G I N E E R I N G P L C
A N N U A L R E P O RT 2 0 1 1 / 1 234
Solvency Section 56 of the Companies Act No. 07 of 2007, requires that a solvency test be performed prior to
the payment of dividends. In order to satisfy this requirement, the Company carried out solvency
tests prior to payment of the two interim dividends. As per requirements of above Act, the Company
Auditors certified prior to payment of interim dividends that the Company has the ability to pay its
debts as they become due in the normal course of business and that the value of the Company’s
assets is greater than the value of its liabilities and the Company’s stated capital.
Following is computation of solvency criteria for the Company as at the year-end:
As at 31st March 2011/12Rs. ’000
2010/11Rs. ’000
Non-Current Assets 4,671,534 3,073,840
Current Assets 10,068,585 7,476,574
Total Assets 14,740,119 10,550,414
Non-Current Liabilities 1,019,065 555,674
Current Liabilities 6,646,945 6,041,877
Total Liabilities 7,666,010 6,597,551
Assets Less Liabilities 7,074,109 3,952,863
Stated Capital 425,297 182,500
Strategy 01 A 360 Degree View of highl ights of the Year 02 Report Parameters . . .The Big P icture 05 Chairman’s Letter 10
M A n AG e M e n t R e P o Rt F I n A n C I A L vA LU e C R e At I o n
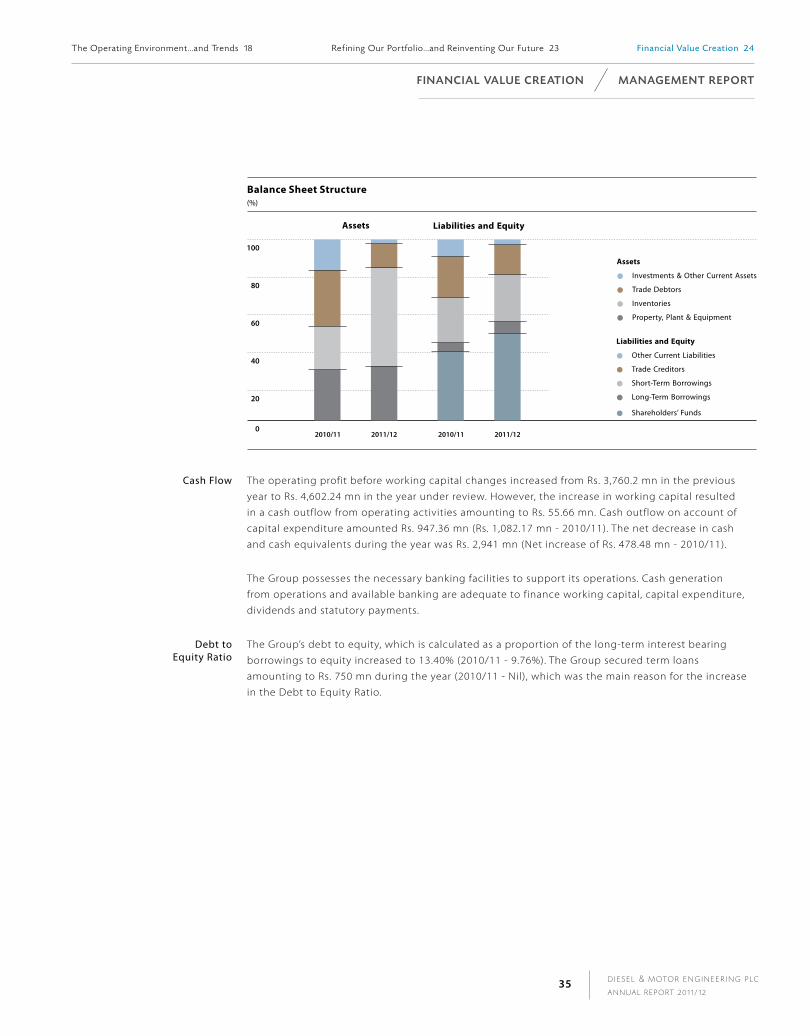
D I E S E L & M OTO R E N G I N E E R I N G P L C
A N N U A L R E P O RT 2 0 1 1 / 1 235
Cash Flow The operating profit before working capital changes increased from Rs. 3,760.2 mn in the previous
year to Rs. 4,602.24 mn in the year under review. However, the increase in working capital resulted
in a cash outflow from operating activities amounting to Rs. 55.66 mn. Cash outflow on account of
capital expenditure amounted Rs. 947.36 mn (Rs. 1,082.17 mn - 2010/11). The net decrease in cash
and cash equivalents during the year was Rs. 2,941 mn (Net increase of Rs. 478.48 mn - 2010/11).
The Group possesses the necessary banking facilities to support its operations. Cash generation
from operations and available banking are adequate to finance working capital, capital expenditure,
dividends and statutory payments.
Debt to Equity Ratio
The Group’s debt to equity, which is calculated as a proportion of the long-term interest bearing
borrowings to equity increased to 13.40% (2010/11 - 9.76%). The Group secured term loans
amounting to Rs. 750 mn during the year (2010/11 - Nil), which was the main reason for the increase
in the Debt to Equity Ratio.
The Operat ing Environment . . .and Trends 18 Ref in ing Our Portfol io . . .and Reinvent ing Our Future 23 Financia l Value Creation 24
F I n A n C I A L vA LU e C R e At I o n M A n AG e M e n t R e P o Rt
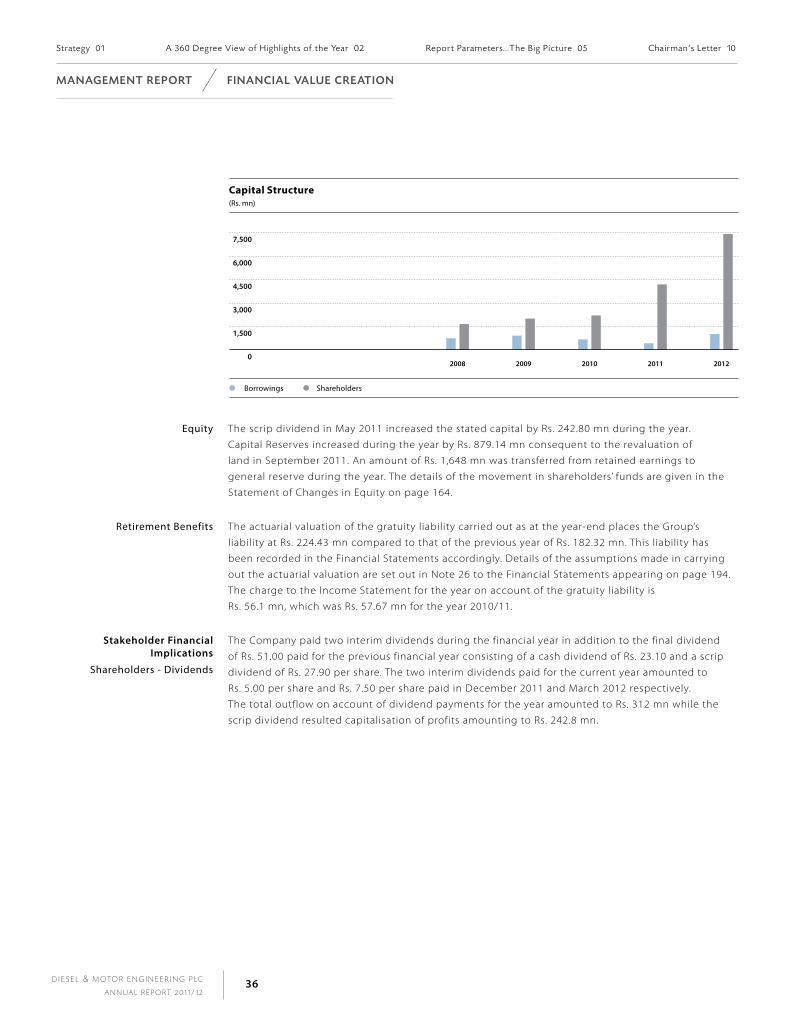
D I E S E L & M OTO R E N G I N E E R I N G P L C
A N N U A L R E P O RT 2 0 1 1 / 1 236
Equity The scrip dividend in May 2011 increased the stated capital by Rs. 242.80 mn during the year.
Capital Reserves increased during the year by Rs. 879.14 mn consequent to the revaluation of
land in September 2011. An amount of Rs. 1,648 mn was transferred from retained earnings to
general reserve during the year. The details of the movement in shareholders’ funds are given in the
Statement of Changes in Equity on page 164.
Retirement Benefits The actuarial valuation of the gratuity liability carried out as at the year-end places the Group’s
liability at Rs. 224.43 mn compared to that of the previous year of Rs. 182.32 mn. This liability has
been recorded in the Financial Statements accordingly. Details of the assumptions made in carrying
out the actuarial valuation are set out in Note 26 to the Financial Statements appearing on page 194.
The charge to the Income Statement for the year on account of the gratuity liability is
Rs. 56.1 mn, which was Rs. 57.67 mn for the year 2010/11.
Stakeholder financial implications
Shareholders - Dividends
The Company paid two interim dividends during the financial year in addition to the final dividend
of Rs. 51.00 paid for the previous financial year consisting of a cash dividend of Rs. 23.10 and a scrip
dividend of Rs. 27.90 per share. The two interim dividends paid for the current year amounted to
Rs. 5.00 per share and Rs. 7.50 per share paid in December 2011 and March 2012 respectively.
The total outflow on account of dividend payments for the year amounted to Rs. 312 mn while the
scrip dividend resulted capitalisation of profits amounting to Rs. 242.8 mn.
Strategy 01 A 360 Degree View of highl ights of the Year 02 Report Parameters . . .The Big P icture 05 Chairman’s Letter 10
M A n AG e M e n t R e P o Rt F I n A n C I A L vA LU e C R e At I o n

D I E S E L & M OTO R E N G I N E E R I N G P L C
A N N U A L R E P O RT 2 0 1 1 / 1 237
Shareholders - Return on Equity Return on Equity (ROE) was 36.13% compared to a ROE of 50.51% for the preceding year.
Suppliers Payments to local suppliers amounted to Rs. 4.51 bn (2010/11 - Rs. 3.9 bn).
Employees Rs. 1,372 mn (2010/11 - Rs. 1,037 mn) out of value added through operations was shared with the
employees. This amounts to an increase of 32.3% (2009/10 - 45.5%) and 12% of the total value added.
Employee-related costs to the Company for the year was Rs. 1,059.81 mn (Rs. 962.26 mn - 2010/11).
The Operat ing Environment . . .and Trends 18 Ref in ing Our Portfol io . . .and Reinvent ing Our Future 23 Financia l Value Creation 24
F I n A n C I A L vA LU e C R e At I o n M A n AG e M e n t R e P o Rt

“When you get right down to it, a good employer must meet and exceed the basic requirements of its employees…food, clothing and shelter…a means of realising self worth and life advancement…and a defined role for each individual…Dimo is a ‘complete’ employer.”
SaraTh algamaExecutive Director
Society Expenditure incurred during the year for the direct
benefit of the society was Rs. 51 mn
(2010/11 - Rs. 30.5 mn).
financial Operations
Treasury Management
The Group operates a central treasury function.
It controls decisions in respect of cash management,
utilisation of borrowing facilities, banking relationships
and foreign currency exposure management.
Further, it enables effective cross utilisation of funds
between Business Units.
Financial Market Risk The Company is exposed to changes in financial
market conditions such as fluctuations in interest
rates and foreign currency exchange rates. Increases
in interest rates could have a significant impact on the
net finance cost. Forward exchange rate contracts may
be entered into, on a selective basis.
Accounting and Financial Reporting
The Group strives to make meaningful disclosures
of material information in the Annual Report has
consistently focused on improving the presentation
of information, within the framework of Sri Lanka
Accounting Standards.
It remains committed to the adoption of best practices
in its communications with shareholders
and other users of Financial Statements (Analysts,
Banks and Government etc.), within the bounds
of commercial confidentiality, to enable them to make
informed judgments on the performance of the Group.
Strategy 01 A 360 Degree View of highl ights of the Year 02 Report Parameters . . .The Big P icture 05 Chairman’s Letter 10
M A n AG e M e n t R e P o Rt F I n A n C I A L vA LU e C R e At I o n
D I E S E L & M OTO R E N G I N E E R I N G P L C
A N N U A L R E P O RT 2 0 1 1 / 1 239
financial priorities The financial priorities remain unchanged from the previous financial year. As in the previous year,
the forecasts into the immediate future, demands focus on sustaining growth and managing the
funds generated. These necessities have given rise to the following priorities:
1. Rational utilisation and investment of funds generated.
2. Prudent management of costs ensuring that inefficiencies do not get hidden in the success.
3. Management of working capital in view of the demands placed by strong growth in turnover.
The above measures are integrated with the identified long-term financial priorities that are strongly
pursued in Corporate Strategy. The following are the Group’s financial priorities that drive the Group’s
financial strategy:
Financial investment in capacity building in order to drive growth.
Striking a balance between growth and immediate profitability in allocating financial resources.
Optimising profitability through efficient utilisation of resources particularly through prudent
working capital management.
Maintaining a healthy Balance Sheet.
financial Outlook 2012/13 The Group achieved its budgeted profit before tax for the year under review. The second half of the
year witnessed some macro economic developments that adversely affected the vehicles segment.
Among the adverse factors are increases in interest rates, depreciation of the Rupee and duty
increases in passenger vehicles. Further continuation of these negative factors is likely to hinder
growth. However, investments made in building capacity and competencies could partially off-set
these adverse effects. In this background, the budgets prepared for the financial year 2012/13, does
not envisage a substantial growth in profits, although a stable performance is expected.
The Operat ing Environment . . .and Trends 18 Ref in ing Our Portfol io . . .and Reinvent ing Our Future 23 Financia l Value Creation 24
F I n A n C I A L vA LU e C R e At I o n M A n AG e M e n t R e P o Rt

D I E S E L & M OTO R E N G I N E E R I N G P L C
A N N U A L R E P O RT 2 0 1 1 / 1 240
M A n AG e M e n t R e P o Rt d e L I v e R I n G vA LU e to C U Sto M e R S . . . A N D T h E I R VA LU E TO U S
management approach Our approach is centred around earning the customers’ trust and ensuring that we consistently meet customer expectations and requirements. We have set the bar very high as evidenced in our tag line ‘Dimo Technology - Expect Perfection’. To enable this, we have instituted a comprehensive and continuous process of engagement with the customer.
Our customers are spread across five business segments and range from individuals and businesses to Government. We employ a range of marketing strategies targeting these segments which comprise -
Vehicles
Vehicle Parts and Service
Lighting & Power Tools
Construction, Agricultural and Material Handling Machinery
Electromechanical and Biomedical Engineering
Word of mouth is a key component of our marketing communications strategy. We are strong believers that a satisfied customer, whose trust we have earned, not only returns and remains with us but also brings in more customers, as well as becoming a facilitator for cross-selling across our business segments. The word of mouth process is catalysed by a customer relationship management programme which includes service and educational campaigns and a host of social events. Advertising is done only for selected products, promotions and events at specific times, and always sparingly. We believe that no amount of advertising can bring us better results than consistent after-sales service, honest interaction with customers and meaningful product augmentation.
Our policy of partnering with the world’s best has enabled us to bring a portfolio of the best brands in their respective categories to the Sri Lankan customer.
The Group’s Quality Management System is accredited with ISO 9001:2008 Certification.
Customer profile We have over 35,000 direct customers - individuals, businesses and Government plus an island wide dealer network. This dealer network in turn serves several thousands of consumers of our products. To serve and interact with our direct customers including our dealer network, we have a team of 362 sales (345 in 2010/11) and 481 service (442 in 2010/11) people working with us.
The following table illustrates the distribution of our active customer base considering last financial year, and their satisfaction levels measured by a Customer Satisfaction Index (CSI).
Market Segment B2C B2B B2G Total Weighted Average Customer Satisfaction Index (CSI) (%)
2011/12 2010/11 2011/12 2010/11 2011/12 2010/11 2011/12 2010/11 2011/12 2010/11
Vehicles 3,077 2,525 18,433 15,119 146 159 21,656 17,803 88 82
Vehicle Parts & Service 2,841 2,631 1,912 1,028 228 232 4,981 3,891 90 88
Lighting & Power Tools 954 881 730 93 71 68 1,755 1,042 86 85
Construction, Agricultural & Material Handling Machinery 1,001 941 771 1,099 148 132 1920 2,172 88 87
Electromechanical & Biomedical Engineering 282 264 19 8 105 103 406 375 94 86
Financia l Value Creat ion 24 Del iver ing Value to Customers . . .and their Value to Us 40 Working at Dimo. . .Enjoyable and Rewarding 62
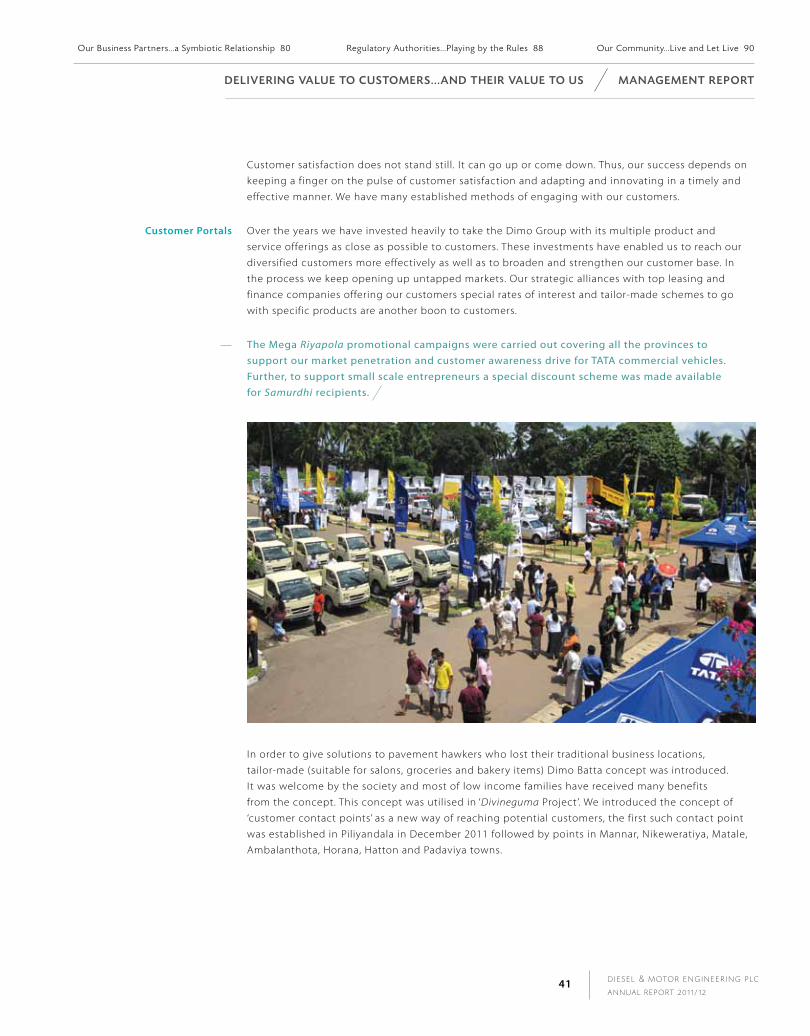
D I E S E L & M OTO R E N G I N E E R I N G P L C
A N N U A L R E P O RT 2 0 1 1 / 1 241
d e L I v e R I n G vA LU e to C U Sto M e R S . . . A n d t h e I R vA LU e to U S M A n AG e M e n t R e P o Rt
Customer satisfaction does not stand still. It can go up or come down. Thus, our success depends on
keeping a finger on the pulse of customer satisfaction and adapting and innovating in a timely and
effective manner. We have many established methods of engaging with our customers.
Customer portals Over the years we have invested heavily to take the Dimo Group with its multiple product and
service offerings as close as possible to customers. These investments have enabled us to reach our
diversified customers more effectively as well as to broaden and strengthen our customer base. In
the process we keep opening up untapped markets. Our strategic alliances with top leasing and
finance companies offering our customers special rates of interest and tailor-made schemes to go
with specific products are another boon to customers.
The Mega Riyapola promotional campaigns were carried out covering all the provinces to support our market penetration and customer awareness drive for TATA commercial vehicles. Further, to support small scale entrepreneurs a special discount scheme was made available for Samurdhi recipients.
In order to give solutions to pavement hawkers who lost their traditional business locations,
tailor-made (suitable for salons, groceries and bakery items) Dimo Batta concept was introduced.
It was welcome by the society and most of low income families have received many benefits
from the concept. This concept was utilised in ‘Divineguma Project’. We introduced the concept of
‘customer contact points’ as a new way of reaching potential customers, the first such contact point
was established in Piliyandala in December 2011 followed by points in Mannar, Nikeweratiya, Matale,
Ambalanthota, Horana, Hatton and Padaviya towns.
Our Bus iness Partners . . .a Symbiot ic Relat ionship 80 Regulatory Authorit ies . . .P lay ing by the Rules 88 Our Community. . .L ive and Let L ive 90
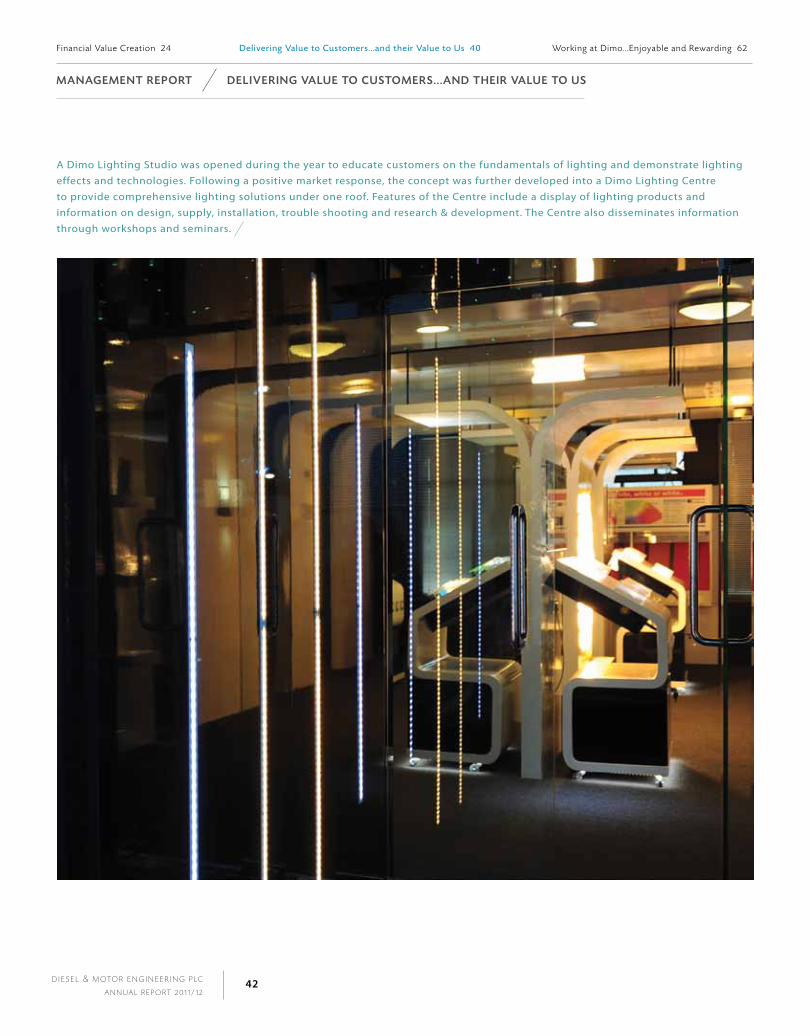
D I E S E L & M OTO R E N G I N E E R I N G P L C
A N N U A L R E P O RT 2 0 1 1 / 1 242
A Dimo Lighting Studio was opened during the year to educate customers on the fundamentals of lighting and demonstrate lighting effects and technologies. Following a positive market response, the concept was further developed into a Dimo Lighting Centre to provide comprehensive lighting solutions under one roof. Features of the Centre include a display of lighting products and information on design, supply, installation, trouble shooting and research & development. The Centre also disseminates information through workshops and seminars.
M A n AG e M e n t R e P o Rt d e L I v e R I n G vA LU e to C U Sto M e R S . . . A n d t h e I R vA LU e to U S
Financia l Value Creat ion 24 Del iver ing Value to Customers . . .and their Value to Us 40 Working at Dimo. . .Enjoyable and Rewarding 62

D I E S E L & M OTO R E N G I N E E R I N G P L C
A N N U A L R E P O RT 2 0 1 1 / 1 243
The following table lists our customer interaction points:
Branches Sales After Sales Services
Display Points Spare PartsSales
Customer Contact Point
1. Head OfficeNo. 65, Jetawana Road, Colombo 14
X X X X X
2. TATA Colombo Branch No. 61, Jetawana Road, Colombo 14
X X X
3. TATA Passenger Car Showroom and WorkshopNo. 467, Sirimavo Bandaranaike Mawatha, Colombo 14
X X X X X
4. Mercedes-Benz & Chrysler Showroom No. 378-385, R.A. De Mel Mawatha, Colombo 3
X X X
5. TATA Passenger Car ShowroomNo. 385 A, R.A. De Mel Mawatha, Colombo 3
X X X
6. Dimo Mart No. 50, 51, Jetawana Road, Colombo 14
X X X X
7. TATA Spare Parts Showroom No. 74,74/1, Jetawana Road, Colombo 14
X X
8. Agri Machinery & Construction Spare Parts Sale CentreNo. 661, Sirimavo Bandaranaike Mawatha, Colombo 14
X X X
9. Medical Engineering & Power Engineering SolutionsNo. 60/7, Horton Place, Colombo 07
X X X X
10. Total Marine SolutionsNo. 15/2, Tickelle Road, Borella, Colombo 08
X X X
11. Tyres & Power Tools Corporate Centre and Bosch Power Tools Service CentreNo. 180, Deans road, Colombo 10
X X X X X
12. Bosch Service Centre56, K, Cyril C. Perera Mawatha, Colombo 13
X X X
13. Siyambalape ComplexNo. 135, Mahena Road, Siyambalape, Biyagama
X X X
14. Dimo Logistics Centre Kirindaiwela Road, Weliweriya.
X X
15. Piliyandala - Customer Contact PointNo. 329/3, Colombo road, Piliyandala
X X
16. Horana - Customer Contact Point No. 275, Rathnapura Road, Horana
X X
17. Matale - Customer Contact Point No. 185B, Kandy Road, Kohombiliwela, Matale.
X X
18. Welimada - TATA Display PointNo. 73, National Building,Badulla Road, Welimada
X X X X
19. Hatton - Customer Contact Point No. 162/81, Dimbulla Road, Hatton
X X
20. Kandy Branch Work Shop
No. 671/A, Balagolla,Kengalla, Kandy
X X X
21. Kandy BranchNo. 276 A, Katugasthota Road, Kandy
X X X X
d e L I v e R I n G vA LU e to C U Sto M e R S . . . A n d t h e I R vA LU e to U S M A n AG e M e n t R e P o Rt
Our Bus iness Partners . . .a Symbiot ic Relat ionship 80 Regulatory Authorit ies . . .P lay ing by the Rules 88 Our Community. . .L ive and Let L ive 90

D I E S E L & M OTO R E N G I N E E R I N G P L C
A N N U A L R E P O RT 2 0 1 1 / 1 244
Branches Sales After Sales Services
Display Points Spare PartsSales
Customer Contact Point
22. Kurunegala Branch No. 27 A, Colombo Road, Malpitiya, Boyagane, Kurunegala
X X X X X
23. TATA Vehicle Display PointNo. 56, Bandarawatte, Hidellana, Ratnapura
X X X X X
24. TATA Vehicle Display PointNo. 32, Aluthgama, Bogamuwa, Yakkala
X X X X
25. Matara Branch No. 401, Kumaratunga Munidasa Mawatha, Pamburana, Matara
X X X X X
26. TATA Vehicle Display PointNo. 2H, New Road, Ambalangoda
X X X X
27. TATA Vehicle Display Point
No. 345, Pallegama, Ratnapura Road, Embilipitiya
X X X
28. Padaviya - Customer Contact Point Opposite the school Padavi-Parakramapura
X X
29. Anuradhapura BranchNo. 562/100, Jayanthi Mawatha, Anuradhapura
X X X X X
30. TATA WorkshopNo. 562/126, D.S. Senanayake Mawatha, Anuradhapura
X X X
31. TATA Vehicle Display PointNo. 61, Town 1, Main Street, Akkaraipattu
X X X
32. Vehicle Display PointNo. 786, Madawelana, Debarawewa, Tissamaharama
X X X X
33. TATA Vehicle Display PointNo. 542/1, Colombo Road, Thilladiya, Puttalam
X X X
34. Mannar - Customer Contact PointThalvupadu Road, Eluthur, Mannar
X X
35. Nikaweratiya - Customer Contact Point No. 222, Opposite Police Station, Nikaweratiya
X X
36. Ambalantota - Customer Contact PointTissapura, Walawa, Ambalantota
X X
37. TATA Vehicle Display PointNo. 43, Jaffna Road, Vavuniya
X X X X
38. TATA Vehicle Display PointNo. 800, Dambulugama, Dambulla
X X X X
39. Ampara Branch
No. C 62, D.S. Senanayaka Street, Ampara
X X X
40. Jaffna Branch No. 214, Stanley Road, Jaffna
X X X
M A n AG e M e n t R e P o Rt d e L I v e R I n G vA LU e to C U Sto M e R S . . . A n d t h e I R vA LU e to U S
Financia l Value Creat ion 24 Del iver ing Value to Customers . . .and their Value to Us 40 Working at Dimo. . .Enjoyable and Rewarding 62
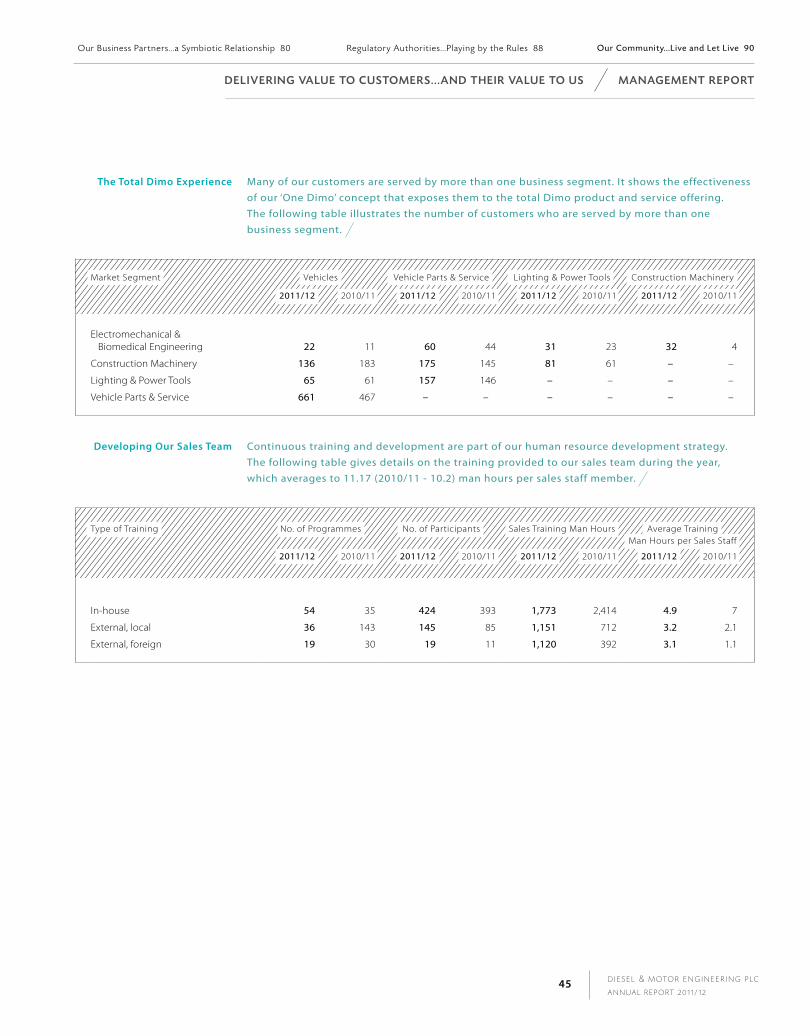
D I E S E L & M OTO R E N G I N E E R I N G P L C
A N N U A L R E P O RT 2 0 1 1 / 1 245
The Total dimo Experience Many of our customers are served by more than one business segment. It shows the effectiveness of our ‘One Dimo’ concept that exposes them to the total Dimo product and service offering. The following table illustrates the number of customers who are served by more than one business segment.
Market Segment Vehicles Vehicle Parts & Service Lighting & Power Tools Construction Machinery
2011/12 2010/11 2011/12 2010/11 2011/12 2010/11 2011/12 2010/11
Electromechanical & Biomedical Engineering 22 11 60 44 31 23 32 4
Construction Machinery 136 183 175 145 81 61 – –
Lighting & Power Tools 65 61 157 146 – – – –
Vehicle Parts & Service 661 467 – – – – – –
developing Our Sales Team Continuous training and development are part of our human resource development strategy. The following table gives details on the training provided to our sales team during the year, which averages to 11.17 (2010/11 - 10.2) man hours per sales staff member.
Type of Training No. of Programmes No. of Participants Sales Training Man Hours Average Training Man Hours per Sales Staff
2011/12 2010/11 2011/12 2010/11 2011/12 2010/11 2011/12 2010/11
In-house 54 35 424 393 1,773 2,414 4.9 7
External, local 36 143 145 85 1,151 712 3.2 2.1
External, foreign 19 30 19 11 1,120 392 3.1 1.1
d e L I v e R I n G vA LU e to C U Sto M e R S . . . A n d t h e I R vA LU e to U S M A n AG e M e n t R e P o Rt
Our Bus iness Partners . . .a Symbiot ic Relat ionship 80 Regulatory Authorit ies . . .P lay ing by the Rules 88 Our Community. . .L ive and Let L ive 90

D I E S E L & M OTO R E N G I N E E R I N G P L C
A N N U A L R E P O RT 2 0 1 1 / 1 246
a new Experience in vehicle Care
The Bosch diesel and Car Service Centre
The state-of-the-art Bosch Diesel Centre, located at No. 56, K. Cyril C. Perera Mw, Colombo 14, was inaugurated in January 2012. It is a Rs. 145 mn investment that will take Dimo into top gear with unmatched customer care in our vehicles segment.
The Bosch Diesel Centre is equipped with the most advanced testing technology and equipment
manufactured by Bosch. As one of the largest manufacturers of diesel fuel injection systems in the world,
the Bosch test equipment commissioned at the Centre can test, calibrate, diagnose faults and repair most
makes of the new generation electronically controlled diesel fuel injection systems, including common rail.
The Bosch Car Service is an ultra-modern workshop facility that can accommodate up to 20 vehicles
of all popular makes. Services include fault diagnosis, troubleshooting, repairs and exhaust
emission testing, particularly for the new generation of motor vehicles that employ advanced
electromechanical technologies.
M A n AG e M e n t R e P o Rt d e L I v e R I n G vA LU e to C U Sto M e R S . . . A n d t h e I R vA LU e to U S
Financia l Value Creat ion 24 Del iver ing Value to Customers . . .and their Value to Us 40 Working at Dimo. . .Enjoyable and Rewarding 62
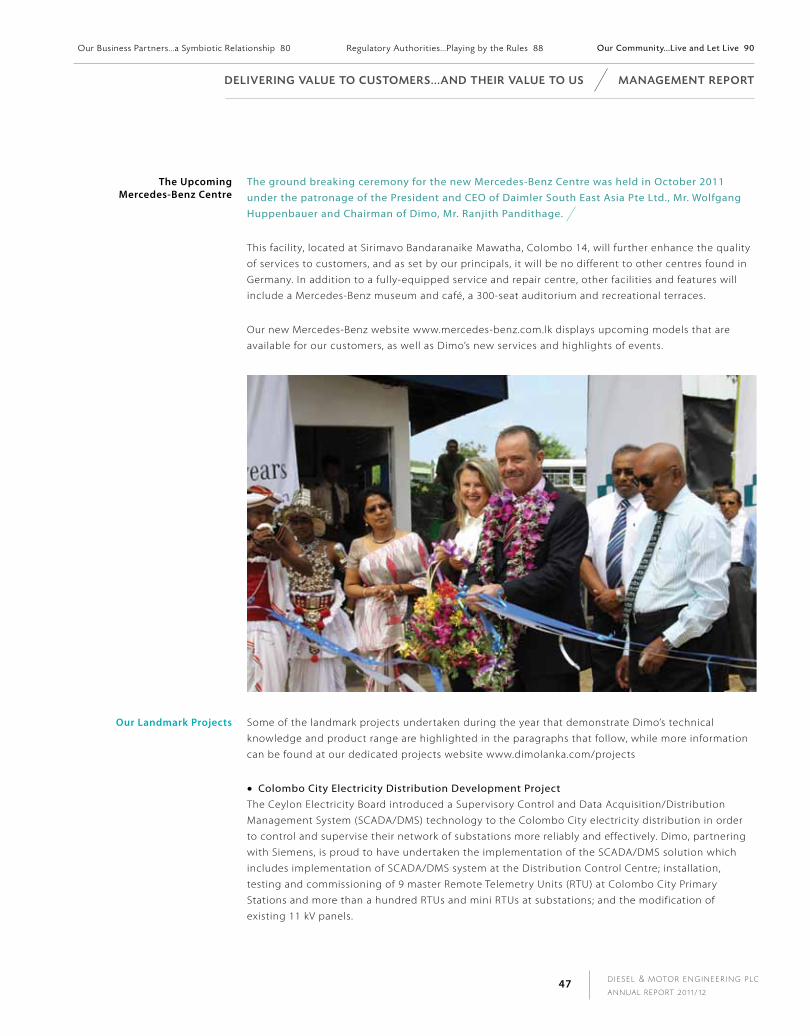
D I E S E L & M OTO R E N G I N E E R I N G P L C
A N N U A L R E P O RT 2 0 1 1 / 1 247
The upcoming mercedes-Benz Centre
The ground breaking ceremony for the new Mercedes-Benz Centre was held in October 2011 under the patronage of the President and CEO of Daimler South East Asia Pte Ltd., Mr. Wolfgang Huppenbauer and Chairman of Dimo, Mr. Ranjith Pandithage.
This facility, located at Sirimavo Bandaranaike Mawatha, Colombo 14, will further enhance the quality
of services to customers, and as set by our principals, it will be no different to other centres found in
Germany. In addition to a fully-equipped service and repair centre, other facilities and features will
include a Mercedes-Benz museum and café, a 300-seat auditorium and recreational terraces.
Our new Mercedes-Benz website www.mercedes-benz.com.lk displays upcoming models that are
available for our customers, as well as Dimo’s new services and highlights of events.
Our landmark projects Some of the landmark projects undertaken during the year that demonstrate Dimo’s technical
knowledge and product range are highlighted in the paragraphs that follow, while more information
can be found at our dedicated projects website www.dimolanka.com/projects
Colombo City Electricity Distribution Development ProjectThe Ceylon Electricity Board introduced a Supervisory Control and Data Acquisition/Distribution
Management System (SCADA/DMS) technology to the Colombo City electricity distribution in order
to control and supervise their network of substations more reliably and effectively. Dimo, partnering
with Siemens, is proud to have undertaken the implementation of the SCADA/DMS solution which
includes implementation of SCADA/DMS system at the Distribution Control Centre; installation,
testing and commissioning of 9 master Remote Telemetry Units (RTU) at Colombo City Primary
Stations and more than a hundred RTUs and mini RTUs at substations; and the modification of
existing 11 kV panels.
d e L I v e R I n G vA LU e to C U Sto M e R S . . . A n d t h e I R vA LU e to U S M A n AG e M e n t R e P o Rt
Our Bus iness Partners . . .a Symbiot ic Relat ionship 80 Regulatory Authorit ies . . .P lay ing by the Rules 88 Our Community. . .L ive and Let L ive 90
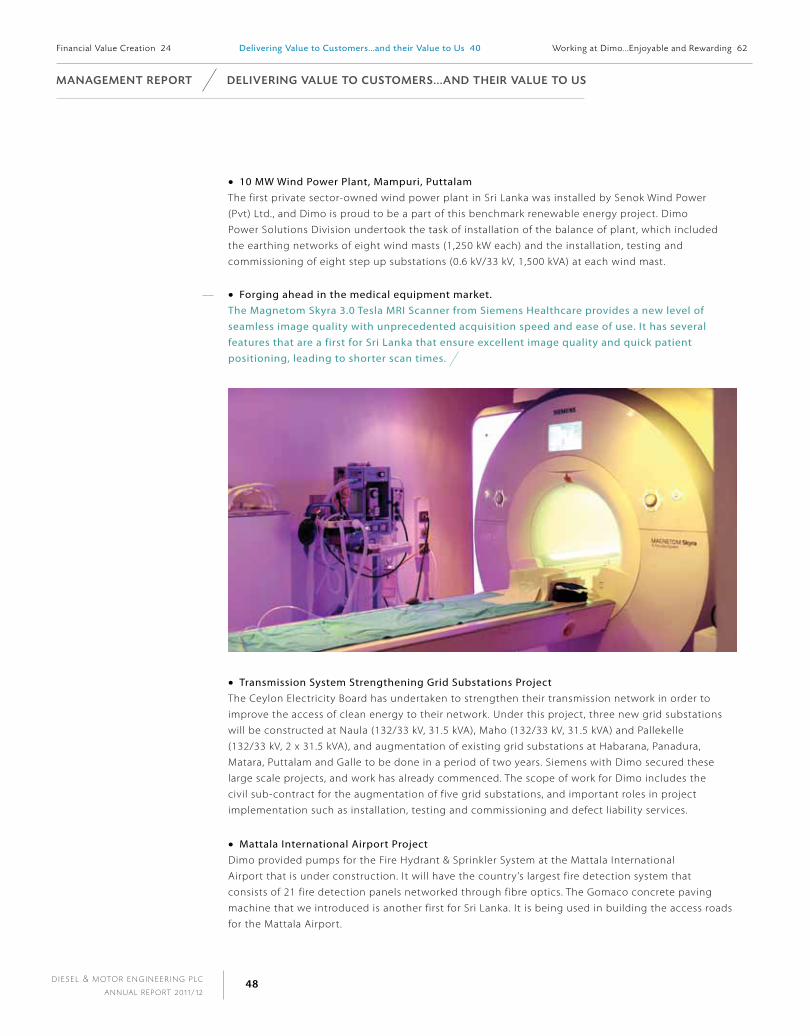
D I E S E L & M OTO R E N G I N E E R I N G P L C
A N N U A L R E P O RT 2 0 1 1 / 1 248
10 MW Wind Power Plant, Mampuri, PuttalamThe first private sector-owned wind power plant in Sri Lanka was installed by Senok Wind Power
(Pvt) Ltd., and Dimo is proud to be a part of this benchmark renewable energy project. Dimo
Power Solutions Division undertook the task of installation of the balance of plant, which included
the earthing networks of eight wind masts (1,250 kW each) and the installation, testing and
commissioning of eight step up substations (0.6 kV/33 kV, 1,500 kVA) at each wind mast.
Forging ahead in the medical equipment market.The Magnetom Skyra 3.0 Tesla MRI Scanner from Siemens Healthcare provides a new level of seamless image quality with unprecedented acquisition speed and ease of use. It has several features that are a first for Sri Lanka that ensure excellent image quality and quick patient positioning, leading to shorter scan times.
Transmission System Strengthening Grid Substations ProjectThe Ceylon Electricity Board has undertaken to strengthen their transmission network in order to
improve the access of clean energy to their network. Under this project, three new grid substations
will be constructed at Naula (132/33 kV, 31.5 kVA), Maho (132/33 kV, 31.5 kVA) and Pallekelle
(132/33 kV, 2 x 31.5 kVA), and augmentation of existing grid substations at Habarana, Panadura,
Matara, Puttalam and Galle to be done in a period of two years. Siemens with Dimo secured these
large scale projects, and work has already commenced. The scope of work for Dimo includes the
civil sub-contract for the augmentation of five grid substations, and important roles in project
implementation such as installation, testing and commissioning and defect liability services.
Mattala International Airport ProjectDimo provided pumps for the Fire Hydrant & Sprinkler System at the Mattala International
Airport that is under construction. It will have the country ’s largest fire detection system that
consists of 21 fire detection panels networked through fibre optics. The Gomaco concrete paving
machine that we introduced is another first for Sri Lanka. It is being used in building the access roads
for the Mattala Airport.
M A n AG e M e n t R e P o Rt d e L I v e R I n G vA LU e to C U Sto M e R S . . . A n d t h e I R vA LU e to U S
Financia l Value Creat ion 24 Del iver ing Value to Customers . . .and their Value to Us 40 Working at Dimo. . .Enjoyable and Rewarding 62
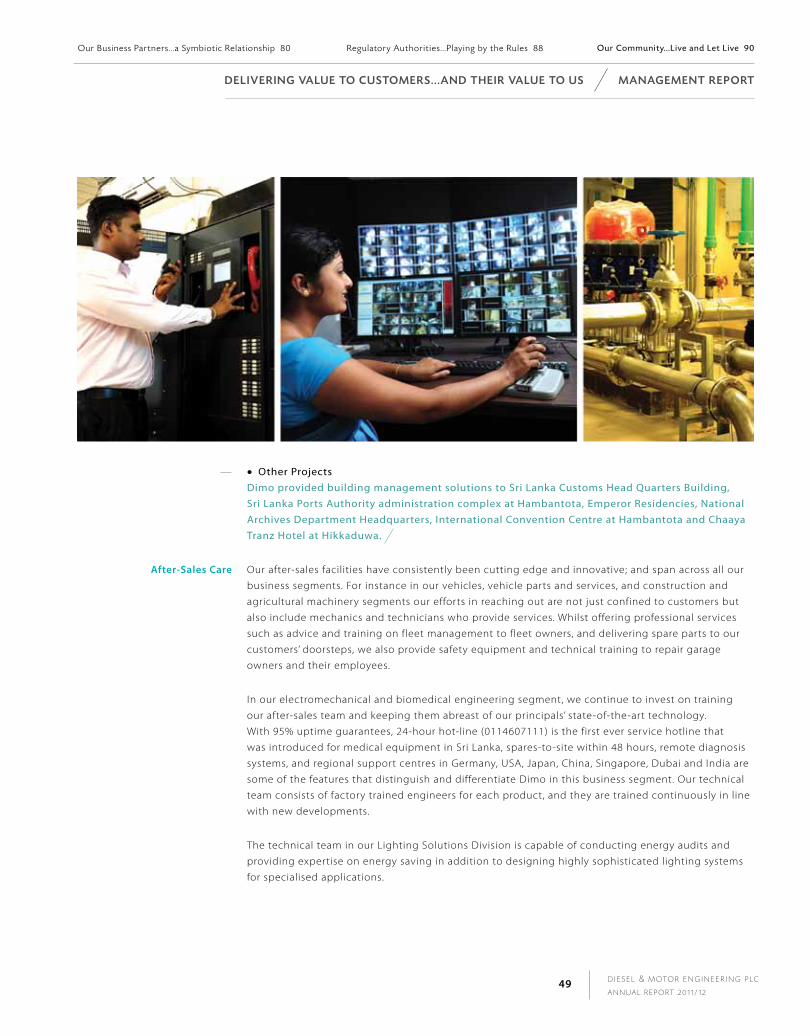
D I E S E L & M OTO R E N G I N E E R I N G P L C
A N N U A L R E P O RT 2 0 1 1 / 1 249
Other ProjectsDimo provided building management solutions to Sri Lanka Customs Head Quarters Building, Sri Lanka Ports Authority administration complex at Hambantota, Emperor Residencies, National Archives Department Headquarters, International Convention Centre at Hambantota and Chaaya Tranz Hotel at Hikkaduwa.
after-Sales Care Our after-sales facilities have consistently been cutting edge and innovative; and span across all our
business segments. For instance in our vehicles, vehicle parts and services, and construction and
agricultural machinery segments our efforts in reaching out are not just confined to customers but
also include mechanics and technicians who provide services. Whilst offering professional services
such as advice and training on fleet management to fleet owners, and delivering spare parts to our
customers’ doorsteps, we also provide safety equipment and technical training to repair garage
owners and their employees.
In our electromechanical and biomedical engineering segment, we continue to invest on training
our after-sales team and keeping them abreast of our principals’ state-of-the-art technology.
With 95% uptime guarantees, 24-hour hot-line (0114607111) is the first ever service hotline that
was introduced for medical equipment in Sri Lanka, spares-to-site within 48 hours, remote diagnosis
systems, and regional support centres in Germany, USA, Japan, China, Singapore, Dubai and India are
some of the features that distinguish and differentiate Dimo in this business segment. Our technical
team consists of factory trained engineers for each product, and they are trained continuously in line
with new developments.
The technical team in our Lighting Solutions Division is capable of conducting energy audits and
providing expertise on energy saving in addition to designing highly sophisticated lighting systems
for specialised applications.
d e L I v e R I n G vA LU e to C U Sto M e R S . . . A n d t h e I R vA LU e to U S M A n AG e M e n t R e P o Rt
Our Bus iness Partners . . .a Symbiot ic Relat ionship 80 Regulatory Authorit ies . . .P lay ing by the Rules 88 Our Community. . .L ive and Let L ive 90

D I E S E L & M OTO R E N G I N E E R I N G P L C
A N N U A L R E P O RT 2 0 1 1 / 1 250
TATA Mahagedara is our flagship service centre and workshop that also provides accommodation facilities for provincial customers. A price menu helps customers to take speedy decisions and also improves transparency and clarity in pricing. The underlying philosophy of this concept is threefold, namely, due respect and due care to customers (Garu Selakili Mahagedara), a 24-hour online roadside assistance to customers (Honda Welawata Mahagedara), and of course customer safety and satisfaction through quality service (Arakshawata Mahagedara). This is another industry- leading example from Dimo.
The TATA Mahagedara was further developed during the year:
The number of wash bays was increased from six to ten to speed up washing and
greasing services.
The number of bays in the accident repair section was increased from twenty seven to thirty
six and the number of hangars increased from two to three; likewise the number of tinkers and
mechanics were also increased.
Five vehicles were added to the 24-hour vehicle breakdown service to improve response time.
TATA Mahagedara launched an engine overhaul scheme with the promise of completing the task
within five days by using our expert knowledge and TATA genuine parts.
M A n AG e M e n t R e P o Rt d e L I v e R I n G vA LU e to C U Sto M e R S . . . A n d t h e I R vA LU e to U S
Financia l Value Creat ion 24 Del iver ing Value to Customers . . .and their Value to Us 40 Working at Dimo. . .Enjoyable and Rewarding 62
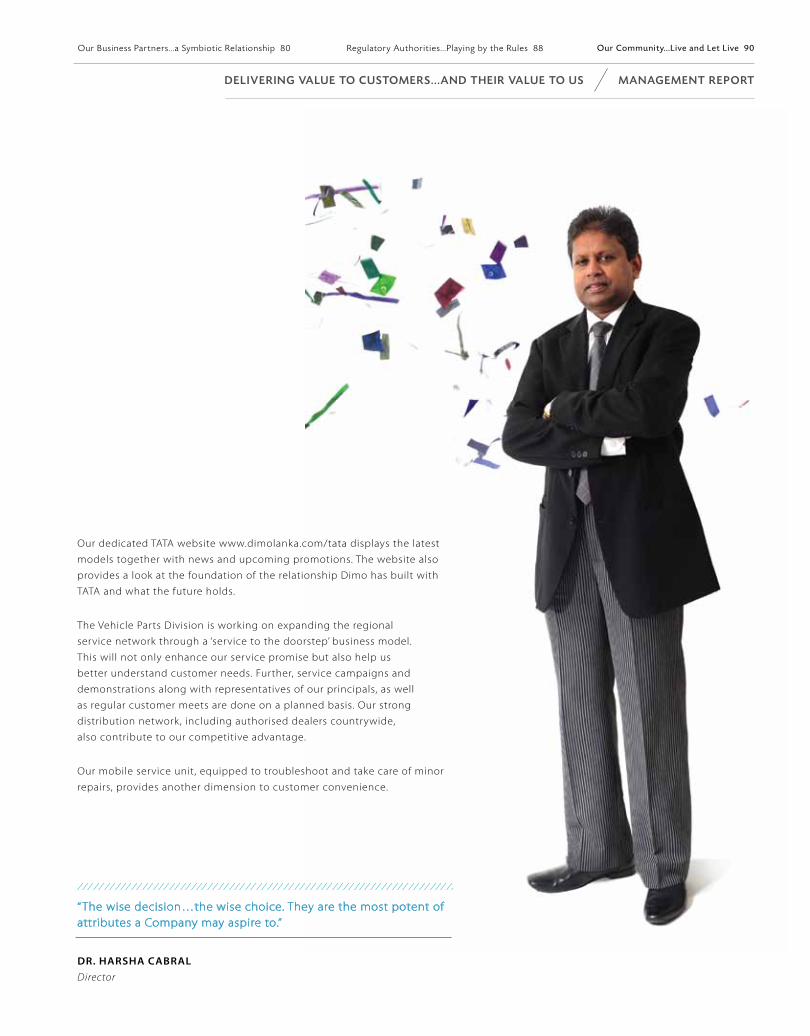
“The wise decision…the wise choice. They are the most potent of attributes a Company may aspire to.”
dr. harSha CaBralDirector
Our dedicated TATA website www.dimolanka.com/tata displays the latest
models together with news and upcoming promotions. The website also
provides a look at the foundation of the relationship Dimo has built with
TATA and what the future holds.
The Vehicle Parts Division is working on expanding the regional
service network through a ‘service to the doorstep’ business model.
This will not only enhance our service promise but also help us
better understand customer needs. Further, service campaigns and
demonstrations along with representatives of our principals, as well
as regular customer meets are done on a planned basis. Our strong
distribution network, including authorised dealers countrywide,
also contribute to our competitive advantage.
Our mobile service unit, equipped to troubleshoot and take care of minor
repairs, provides another dimension to customer convenience.
d e L I v e R I n G vA LU e to C U Sto M e R S . . . A n d t h e I R vA LU e to U S M A n AG e M e n t R e P o Rt
Our Bus iness Partners . . .a Symbiot ic Relat ionship 80 Regulatory Authorit ies . . .P lay ing by the Rules 88 Our Community. . .L ive and Let L ive 90

D I E S E L & M OTO R E N G I N E E R I N G P L C
A N N U A L R E P O RT 2 0 1 1 / 1 252
Our unit repair section was upgraded to enhance capacity and improve service turnaround time.
One of the key products delivered by this unit is known by the name ‘Adi Sathkara’. As the name
implies, the engine gets an ‘intensive care’ treatment. We are working towards a complete engine
overhaul within 24 hours.
Electronic mobile racking systems and a range of other innovative material handling and storage systems have been introduced to the market. These products are backed by expertise for customisation, online after sales support and 24-hour spare parts delivery.
nurturing Customer relationships
The sense of ‘community ’ that we have built into the larger Dimo family is constantly being nurtured
across all business segments. Significant financial resources as well as top management time and
attention are devoted towards this end. Understanding the needs of various customer groups and
innovation are once again the keys to success. For instance, we have developed a range of express
services where, through the employment of special processes, we are able to complete these
services within a guaranteed time frame.
mercedes-Benz Club of Sri lanka
The Club is now in its 22nd year with a membership of over 120, making it one of the oldest,
most active and largest clubs of its kind in the country. During the year the Club conducted a classic
car enthusiast forum, to advise and educate owners of classic cars on restoration and maintenance.
Over 50 classic car owners participated in the event.
M A n AG e M e n t R e P o Rt d e L I v e R I n G vA LU e to C U Sto M e R S . . . A n d t h e I R vA LU e to U S
Financia l Value Creat ion 24 Del iver ing Value to Customers . . .and their Value to Us 40 Working at Dimo. . .Enjoyable and Rewarding 62
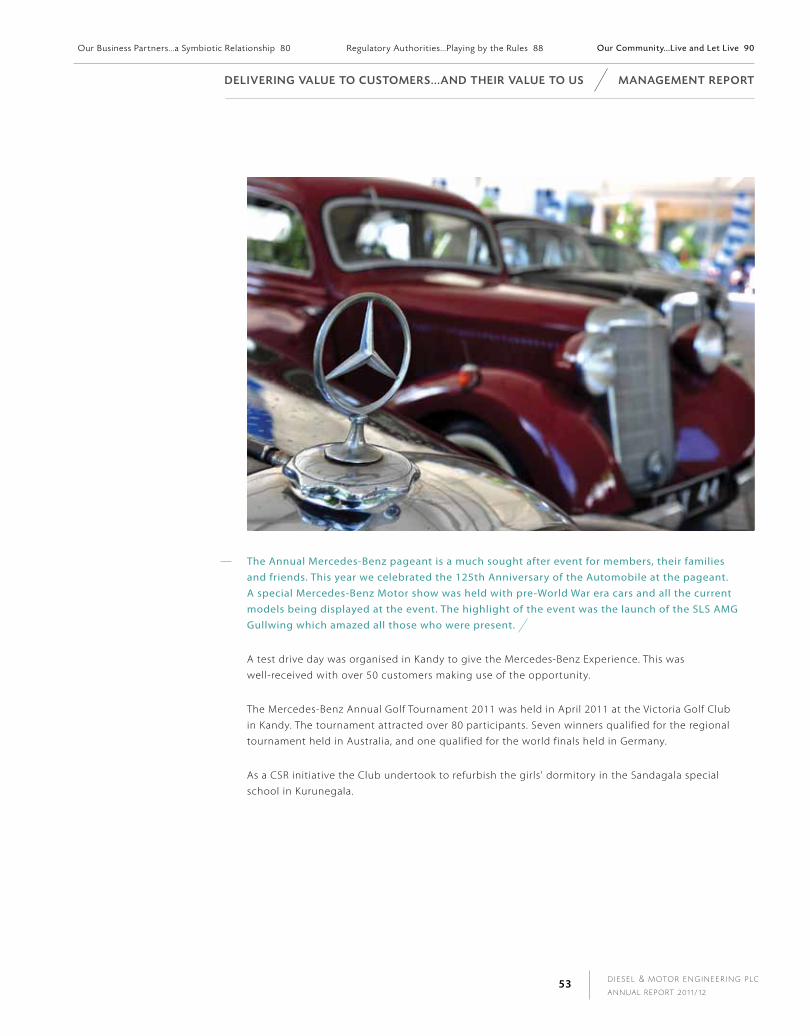
D I E S E L & M OTO R E N G I N E E R I N G P L C
A N N U A L R E P O RT 2 0 1 1 / 1 253
The Annual Mercedes-Benz pageant is a much sought after event for members, their families and friends. This year we celebrated the 125th Anniversary of the Automobile at the pageant. A special Mercedes-Benz Motor show was held with pre-World War era cars and all the current models being displayed at the event. The highlight of the event was the launch of the SLS AMG Gullwing which amazed all those who were present.
A test drive day was organised in Kandy to give the Mercedes-Benz Experience. This was
well-received with over 50 customers making use of the opportunity.
The Mercedes-Benz Annual Golf Tournament 2011 was held in April 2011 at the Victoria Golf Club
in Kandy. The tournament attracted over 80 participants. Seven winners qualified for the regional
tournament held in Australia, and one qualified for the world finals held in Germany.
As a CSR initiative the Club undertook to refurbish the girls' dormitory in the Sandagala special
school in Kurunegala.
d e L I v e R I n G vA LU e to C U Sto M e R S . . . A n d t h e I R vA LU e to U S M A n AG e M e n t R e P o Rt
Our Bus iness Partners . . .a Symbiot ic Relat ionship 80 Regulatory Authorit ies . . .P lay ing by the Rules 88 Our Community. . .L ive and Let L ive 90
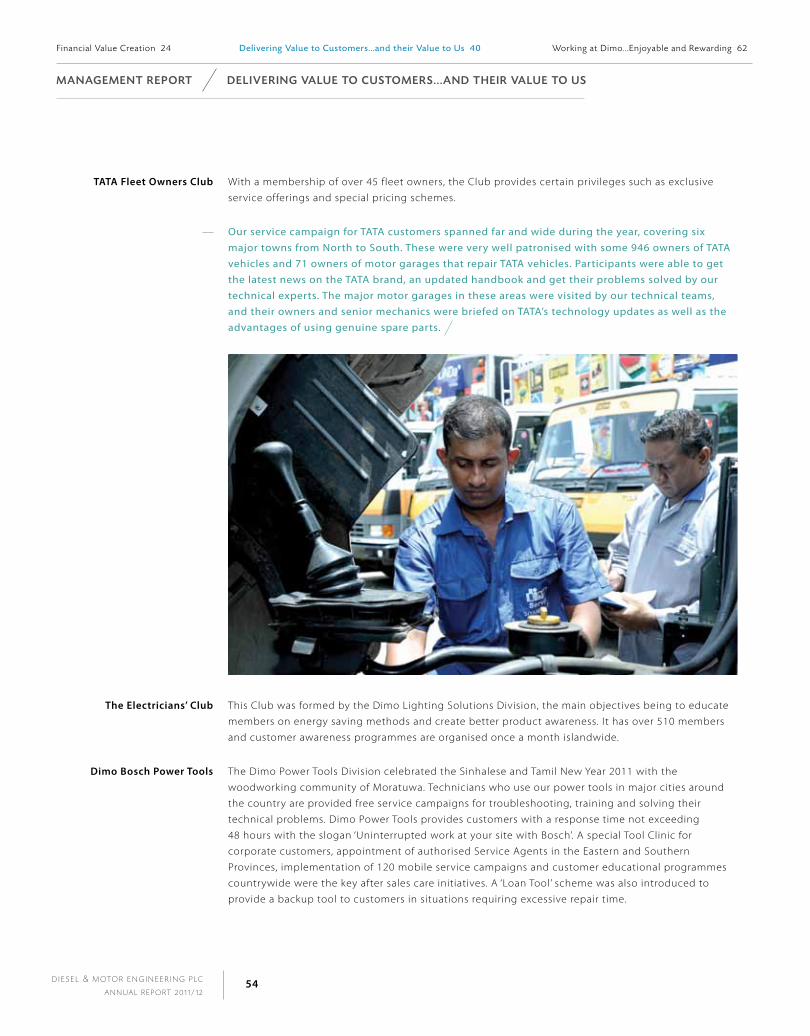
D I E S E L & M OTO R E N G I N E E R I N G P L C
A N N U A L R E P O RT 2 0 1 1 / 1 254
TaTa fleet Owners Club With a membership of over 45 fleet owners, the Club provides certain privileges such as exclusive
service offerings and special pricing schemes.
Our service campaign for TATA customers spanned far and wide during the year, covering six major towns from North to South. These were very well patronised with some 946 owners of TATA vehicles and 71 owners of motor garages that repair TATA vehicles. Participants were able to get the latest news on the TATA brand, an updated handbook and get their problems solved by our technical experts. The major motor garages in these areas were visited by our technical teams, and their owners and senior mechanics were briefed on TATA’s technology updates as well as the advantages of using genuine spare parts.
The Electricians’ Club This Club was formed by the Dimo Lighting Solutions Division, the main objectives being to educate
members on energy saving methods and create better product awareness. It has over 510 members
and customer awareness programmes are organised once a month islandwide.
dimo Bosch power Tools The Dimo Power Tools Division celebrated the Sinhalese and Tamil New Year 2011 with the
woodworking community of Moratuwa. Technicians who use our power tools in major cities around
the country are provided free service campaigns for troubleshooting, training and solving their
technical problems. Dimo Power Tools provides customers with a response time not exceeding
48 hours with the slogan ‘Uninterrupted work at your site with Bosch’. A special Tool Clinic for
corporate customers, appointment of authorised Service Agents in the Eastern and Southern
Provinces, implementation of 120 mobile service campaigns and customer educational programmes
countrywide were the key after sales care initiatives. A ‘Loan Tool’ scheme was also introduced to
provide a backup tool to customers in situations requiring excessive repair time.
M A n AG e M e n t R e P o Rt d e L I v e R I n G vA LU e to C U Sto M e R S . . . A n d t h e I R vA LU e to U S
Financia l Value Creat ion 24 Del iver ing Value to Customers . . .and their Value to Us 40 Working at Dimo. . .Enjoyable and Rewarding 62
D I E S E L & M OTO R E N G I N E E R I N G P L C
A N N U A L R E P O RT 2 0 1 1 / 1 255
Our product responsibility
Life Cycle stages of products are assessed for health and
safety impact
All products marketed by Dimo come with the highest levels of safety. Dimo follows principals’
guidelines and globally accepted best practices to ensure that in the process of after sales care,
the highest levels of safety are afforded to our customers. In addition, all health and safety measures
as per ISO accreditation guidelines are employed.
Educational and communication programmes on the safe disposal of certain products have been
planned for the future.
There were no material incidents reported relating to customer health and safety in the period
under review.
Product and Service Labelling, User Manuals
All Dimo products are adequately labelled, have catalogue references and where required an
accompanying user ’s manual. Labelling also conforms to statutory requirements in respect of
providing diagrams and pictographs, expiry dates, standardisation code numbers and information on
possible environmental impact. The requisite quality certification stamps are also carried.
Ethical Communications Dimo’s marketing communications are fully-based on transparency, honesty, ethical standards and
conformity with statutory requirements. Where applicable, we also adopt our principals’ codes on
the subject. All marketing campaigns are screened against a checklist prior to release to ensure that
Dimo does not engage in unethical marketing practices.
There were no breaches of this code during the year under review. The same standards are promoted
among all customer facing staff in their communications with customers. There were no instances of
non-compliance with any regulation on marketing communications during the year.
Checklist
Consistency in corporate image
Logo and branding guideline
Product claim (product features)
Accuracy and credibility of information
Creative ideas
Standards and credibility of contents
Remarks on and comparison with competitors
Customer Satisfaction
Customer relationship management (Crm)
Measuring and monitoring customer satisfaction and adapting accordingly are both a science and an
art at the Dimo Group. The art of it is deeply ingrained into our ethos and is one that has come down
the generations in a process of continuous improvement. The science of it was instituted nearly a
decade ago, when in 2002, we decided to conduct ongoing customer satisfaction surveys and create
an index for measurement and management. Results of our formal surveys are documented.
They form the basis of the continuous improvement programmes, including training in every area
from sales, to spares, and after sales services across all business segments. Important innovations and
improvements stemming from this exercise are instituted in the training and induction agenda and
employee literature.
d e L I v e R I n G vA LU e to C U Sto M e R S . . . A n d t h e I R vA LU e to U S M A n AG e M e n t R e P o Rt
Our Bus iness Partners . . .a Symbiot ic Relat ionship 80 Regulatory Authorit ies . . .P lay ing by the Rules 88 Our Community. . .L ive and Let L ive 90

D I E S E L & M OTO R E N G I N E E R I N G P L C
A N N U A L R E P O RT 2 0 1 1 / 1 256
“Numbers can tell us the story…to the last decimal. But it's foresight that really makes the story”.
SurESh gOOnEraTnEExecutive Director
A centralised Customer Relationship Management (CRM) Division is
in operation and currently provides a monthly data analysis service
to the vehicle segment. These details are forwarded to business
units monthly. All other business segments analyse their data on a
quarterly basis in consultation with senior management. Both these
quarterly and monthly reports contain customer responses and
complaints that enable the Group to continuously develop its problem
solving capability with timely and effective modifications to business
processes when warranted. Having recognised the importance of CRM,
we are taking steps to widen its scope to cover other divisions as well.
During the year under review, the CRM unit engaged with 21,048
(9,568 in 2010/11) customer interactions by various kinds of activities.
The Dimo Group has the ability to attract new customers and attract
repeat purchase in equal measure. For example, of the Mercedes-Benz
vehicles sold during the year under review, 48% were new customers
and 52% were repeat customers.
voice of the Customer
Dimo’s CRM conducts a series of activities to maintain regular contact
with customers and has positioned itself to get effective and candid
feedback. It plays a central role in problem solving as well. Our CRM
process ensures speedy response to customers’ complaints. Customer
complaints are acknowledged on the same day and a solution is given
within a maximum of three days. Complaints of customers in mission-
critical businesses receive greater priority. A Customer Complaint
Register is maintained in every location across our branch network.
M A n AG e M e n t R e P o Rt d e L I v e R I n G vA LU e to C U Sto M e R S . . . A n d t h e I R vA LU e to U S
Financia l Value Creat ion 24 Del iver ing Value to Customers . . .and their Value to Us 40 Working at Dimo. . .Enjoyable and Rewarding 62

D I E S E L & M OTO R E N G I N E E R I N G P L C
A N N U A L R E P O RT 2 0 1 1 / 1 257
The following diagram details our customer complaint handling process:
Respective Franchise
Customer calls on DIMO Hotline
Completion of task from the CRM Unit
Attend to the Complaint
Provide feedback to customer on estimated
completion date; record same in the system
Problem solved?
Update the Feedback inthe System
Yes No
Customer noti�cation/System update
Escalate the issue to respective General Manager
Call Centre
Collect customer query/complaint
Inform/update the customer
Customer
Assign the issue to respective Business Unit Manager via the Information Management System
d e L I v e R I n G vA LU e to C U Sto M e R S . . . A n d t h e I R vA LU e to U S M A n AG e M e n t R e P o Rt
Our Bus iness Partners . . .a Symbiot ic Relat ionship 80 Regulatory Authorit ies . . .P lay ing by the Rules 88 Our Community. . .L ive and Let L ive 90
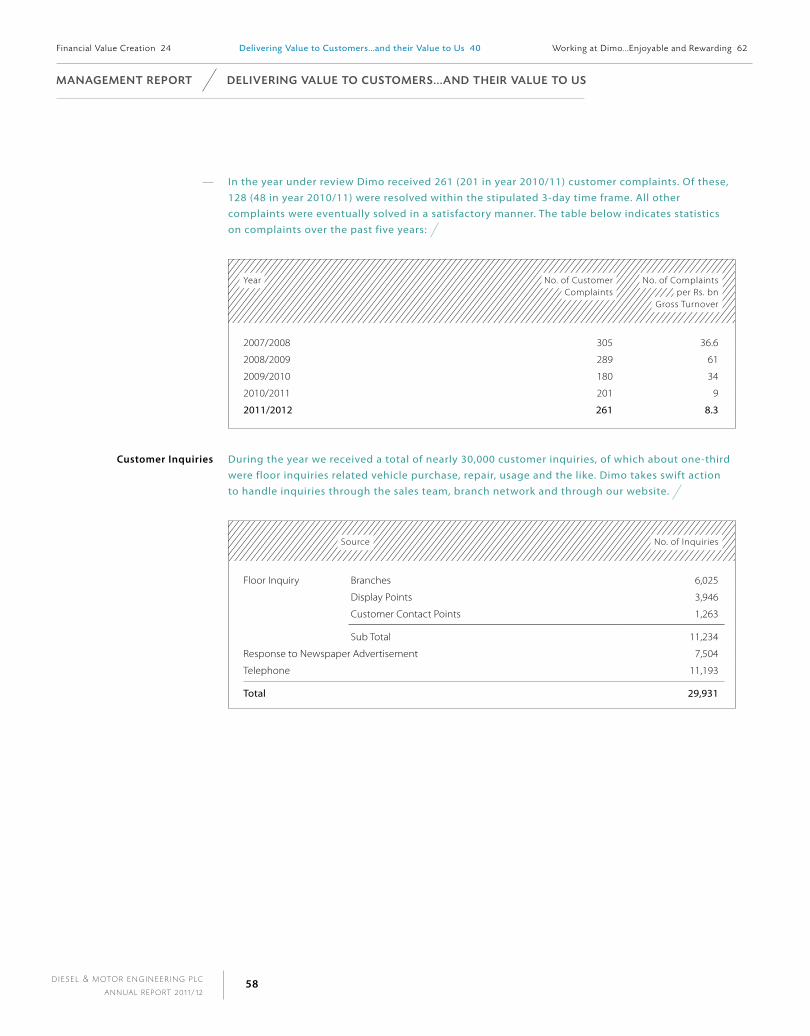
D I E S E L & M OTO R E N G I N E E R I N G P L C
A N N U A L R E P O RT 2 0 1 1 / 1 258
In the year under review Dimo received 261 (201 in year 2010/11) customer complaints. Of these, 128 (48 in year 2010/11) were resolved within the stipulated 3-day time frame. All other complaints were eventually solved in a satisfactory manner. The table below indicates statistics on complaints over the past five years:
Year No. of Customer Complaints
No. of Complaints per Rs. bn
Gross Turnover
2007/2008 305 36.6
2008/2009 289 61
2009/2010 180 34
2010/2011 201 9
2011/2012 261 8.3
Customer inquiries During the year we received a total of nearly 30,000 customer inquiries, of which about one-third were floor inquiries related vehicle purchase, repair, usage and the like. Dimo takes swift action to handle inquiries through the sales team, branch network and through our website.
Source No. of Inquiries
Floor Inquiry Branches 6,025
Display Points 3,946
Customer Contact Points 1,263
Sub Total 11,234
Response to Newspaper Advertisement 7,504
Telephone 11,193
Total 29,931
M A n AG e M e n t R e P o Rt d e L I v e R I n G vA LU e to C U Sto M e R S . . . A n d t h e I R vA LU e to U S
Financia l Value Creat ion 24 Del iver ing Value to Customers . . .and their Value to Us 40 Working at Dimo. . .Enjoyable and Rewarding 62
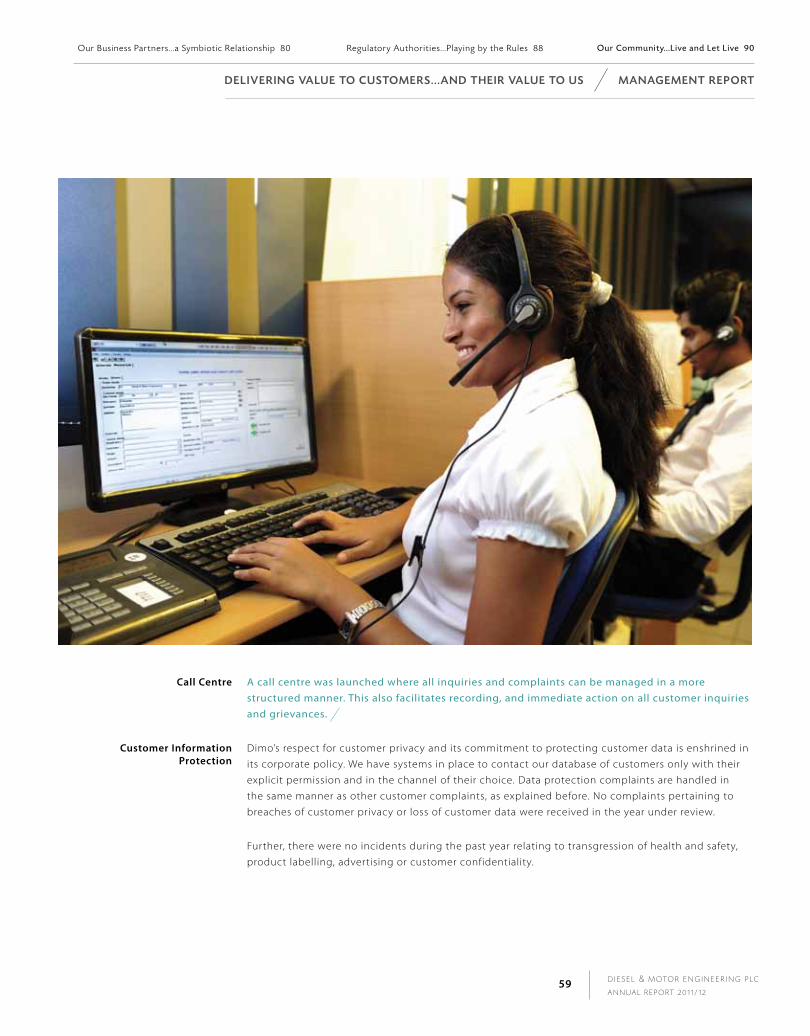
D I E S E L & M OTO R E N G I N E E R I N G P L C
A N N U A L R E P O RT 2 0 1 1 / 1 259
Call Centre A call centre was launched where all inquiries and complaints can be managed in a more structured manner. This also facilitates recording, and immediate action on all customer inquiries and grievances.
Customer information protection
Dimo’s respect for customer privacy and its commitment to protecting customer data is enshrined in
its corporate policy. We have systems in place to contact our database of customers only with their
explicit permission and in the channel of their choice. Data protection complaints are handled in
the same manner as other customer complaints, as explained before. No complaints pertaining to
breaches of customer privacy or loss of customer data were received in the year under review.
Further, there were no incidents during the past year relating to transgression of health and safety,
product labelling, advertising or customer confidentiality.
d e L I v e R I n G vA LU e to C U Sto M e R S . . . A n d t h e I R vA LU e to U S M A n AG e M e n t R e P o Rt
Our Bus iness Partners . . .a Symbiot ic Relat ionship 80 Regulatory Authorit ies . . .P lay ing by the Rules 88 Our Community. . .L ive and Let L ive 90

D I E S E L & M OTO R E N G I N E E R I N G P L C
A N N U A L R E P O RT 2 0 1 1 / 1 260
Environmental-friendly product responsibility
Our principals, representing leading global brands, produce some of the most responsible products
in their respective categories. Hence, every product offered by Dimo is somewhat of a leader in the
area of product responsibility. Dimo, on its part, is committed to keeping abreast of developments
and offering the latest products and innovations of its principals to the Sri Lankan market.
The following are but a handful of some examples:
Osram LED lighting and RZB LED luminaires have the following eco-friendly features:
Up to 90% energy savings compared to conventional incandescent and halogen lamps; mercury-free production; up to 45,000 hours service life; up to 100,000 switching cycles; very high impact and vibration resistance.
Green Building ConceptThe Dimo Lighting Solutions Division has a world class product range that permits customers to
score well in the rating of LEED’s (Leadership in Energy and Environmental Designs) standards.
Further, we are a member of US Green Building Council and are in position to consult/evaluate
construction projects and issue rating reports as per LEED’s standards.
Financia l Value Creat ion 24 Del iver ing Value to Customers . . .and their Value to Us 40 Working at Dimo. . .Enjoyable and Rewarding 62
M A n AG e M e n t R e P o Rt d e L I v e R I n G vA LU e to C U Sto M e R S . . . A n d t h e I R vA LU e to U S

D I E S E L & M OTO R E N G I N E E R I N G P L C
A N N U A L R E P O RT 2 0 1 1 / 1 261
Dimo was the first in Sri Lanka to introduce asbestos-free brake pads for vehicles.
Mercedes-Benz ‘Blue efficiency’ models are up to Euro 5 environmental norms (a European
environmental standard).
Dimo has introduced new models in the small commercial vehicle range such as the Batti, Lokka and Batta. The Dimo Batta, with its best in class fuel efficiency and low GHG emissions, has fast become one of the most popular light commercial vehicles on Sri Lankan roads. We have just introduced another to the commercial vehicle range - the stripped down version of the 207 DIEX single cab pickup truck, branded as the Dimo 207 Bullet. It is also one of the most fuel efficient vehicles in its class.
Dimo Energy Management Services provides capacitor bank design and installation services for
industrial customers who wish to reduce their electricity consumption through power factor
correction. By partnering with Electronicon, a reputed German manufacturer, we are in a position to
assure our customers the highest quality and reliability of all installations.
Our Bus iness Partners . . .a Symbiot ic Relat ionship 80 Regulatory Authorit ies . . .P lay ing by the Rules 88 Our Community. . .L ive and Let L ive 90
d e L I v e R I n G vA LU e to C U Sto M e R S . . . A n d t h e I R vA LU e to U S M A n AG e M e n t R e P o Rt
D I E S E L & M OTO R E N G I N E E R I N G P L C
A N N U A L R E P O RT 2 0 1 1 / 1 262
management approach Just over a 1,300 people work at the Dimo Group. They represent the finest of professionals in their
respective fields. The Group’s goal is to make work ‘enjoyable and rewarding’ while maintaining a
customer-first policy. Every employee living this policy is central to the Group excelling at what it
does. Thus, delivering value to customers and the value of customers to the Dimo Group are deeply
ingrained in our work ethic that drives our human resources development agenda.
High priority is given by the Board and the top management for engaging with employees at all
levels. The engagement process has been instituted through several ongoing initiatives including
one-to-one interviews (conducted by an independent third party), focus group discussions
(conducted by an independent third party), an Employees’ Council, HR clinics, an internal newsletter
'Dimo Handa' and an annual employee satisfaction survey. DimoNet, the Group’s intranet,
has improved access to a wide range of corporate information including promotional campaigns,
employment opportunities, Employees’ Council minutes of meetings and corporate events.
As in the previous year, employee feedback on economic, environmental and social criteria was
obtained through an independent third party, the objective being to ascertain the true and
honest feelings of employees at every level on the above criteria. Stemming from this survey,
the Sustainability Committee set out objectives for the ensuing year. These objectives are given in
the table appearing on pages 112 to 113.
The Dimo Board ensures strict compliance with statutory requirements pertaining to all aspects of
employees and employment, labour rights and human rights. The Board also ensures that freedom
of association is not hindered and that Dimo remains an equal opportunity employer that treats all
employees with respect and equality irrespective of gender, race, religion, social background, caste,
old school ties or any other distinction. Employees have been provided with multiple channels to
voice their concerns. We also promote them in all external organisations that we engage with.
During 2011/12, the Dimo Group spent Rs. 1,164 mn (Rs. 962 mn in 2010/11) on salaries
and wages, defined contribution plan costs (EPF, ETF), retirement benefit plan costs (retiring gratuity)
and training.
The dimo approach to labour, Environment and
human rights
THE VALUES THAT GUIDE US
Customer first;
Partner with the world’s best;
Make work enjoyable and rewarding;
Never compromise Dimo’s ethics;
Benefactor of society and friend of the environment.
M A n AG e M e n t R e P o Rt Wo R K I n G At d I M o . . . E N J OYA B L E A N D R E WA R D I N G
Financia l Value Creat ion 24 Del iver ing Value to Customers . . .and their Value to Us 40 Working at Dimo. . .Enjoyable and Rewarding 62

“The challenge for any individual or organisation is to create value in terms of what it offers, following a set of values and guidelines and in the process creating wealth for itself.”
prOf. udiTha liyanagEDirector
Dimo’s policy is to produce sustainable and rewarding
outcomes for the people within the organisation. Our goal
is to make work enjoyable, rewarding and productive and
to create a work space that is enriching and innovative.
The ‘One Dimo’ concept aims to enhance teamwork
among the Dimo family. Employees are given a good
understanding of all our business activities; which in turn
make them business partners of all businesses that we are
engaged in.
Employees are encouraged to invest in their own
professional development by developing an Individual
Development Plan.
We recognise that employees are the most valuable asset
of the Dimo Group. Their well-being and development are
given top priority. The value placed on employees is
well-reflected in our investment in training and
development, monetary and non-monetary benefits and in
the accolades received for our human resource practices.
Our Bus iness Partners . . .a Symbiot ic Relat ionship 80 Regulatory Authorit ies . . .P lay ing by the Rules 88 Our Community. . .L ive and Let L ive 90
Wo R K I n G At d I M o . . . e n J oYA B L e A n d R eWA R d I n G M A n AG e M e n t R e P o Rt
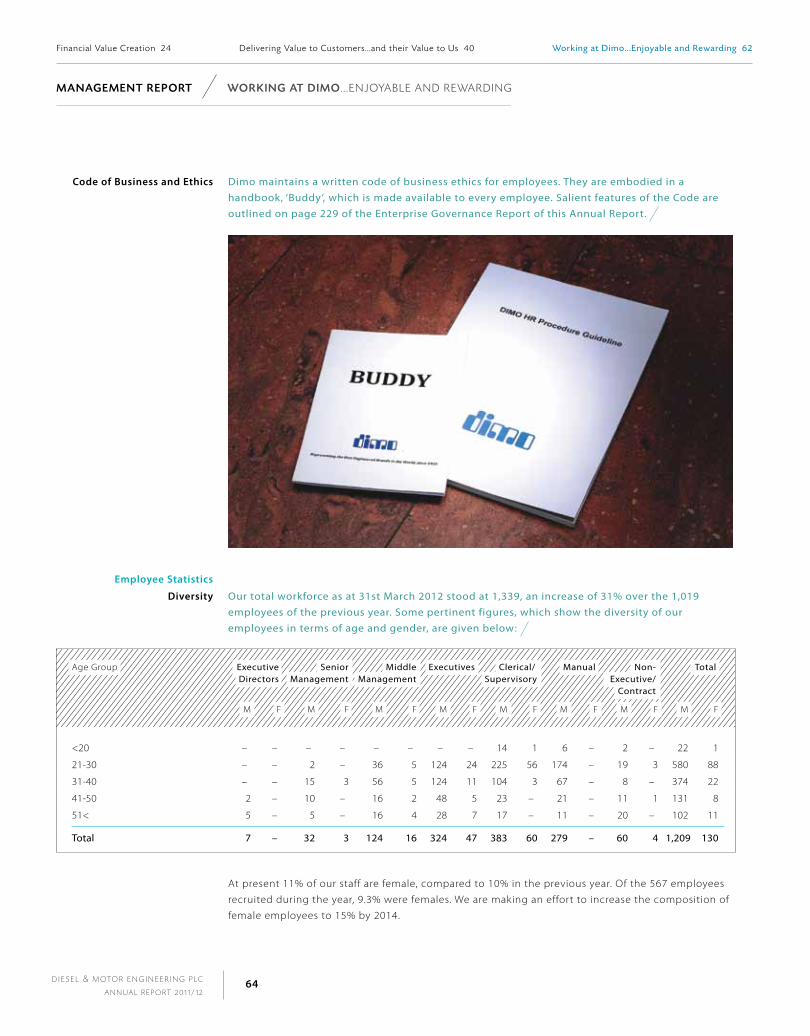
D I E S E L & M OTO R E N G I N E E R I N G P L C
A N N U A L R E P O RT 2 0 1 1 / 1 264
M A n AG e M e n t R e P o Rt Wo R K I n G At d I M o . . . E N J OYA B L E A N D R E WA R D I N G
Code of Business and Ethics Dimo maintains a written code of business ethics for employees. They are embodied in a handbook, ‘Buddy’, which is made available to every employee. Salient features of the Code are outlined on page 229 of the Enterprise Governance Report of this Annual Report.
Employee Statistics
diversity Our total workforce as at 31st March 2012 stood at 1,339, an increase of 31% over the 1,019 employees of the previous year. Some pertinent figures, which show the diversity of our employees in terms of age and gender, are given below:
Age Group Executive Directors
SeniorManagement
Middle Management
Executives Clerical/Supervisory
Manual Non-Executive/
Contract
Total
M F M F M F M F M F M F M F M F
<20 – – – – – – – – 14 1 6 – 2 – 22 1
21-30 – – 2 – 36 5 124 24 225 56 174 – 19 3 580 88
31-40 – – 15 3 56 5 124 11 104 3 67 – 8 – 374 22
41-50 2 – 10 – 16 2 48 5 23 – 21 – 11 1 131 8
51< 5 – 5 – 16 4 28 7 17 – 11 – 20 – 102 11
Total 7 – 32 3 124 16 324 47 383 60 279 – 60 4 1,209 130
At present 11% of our staff are female, compared to 10% in the previous year. Of the 567 employees
recruited during the year, 9.3% were females. We are making an effort to increase the composition of
female employees to 15% by 2014.
Financia l Value Creat ion 24 Del iver ing Value to Customers . . .and their Value to Us 40 Working at Dimo. . .Enjoyable and Rewarding 62
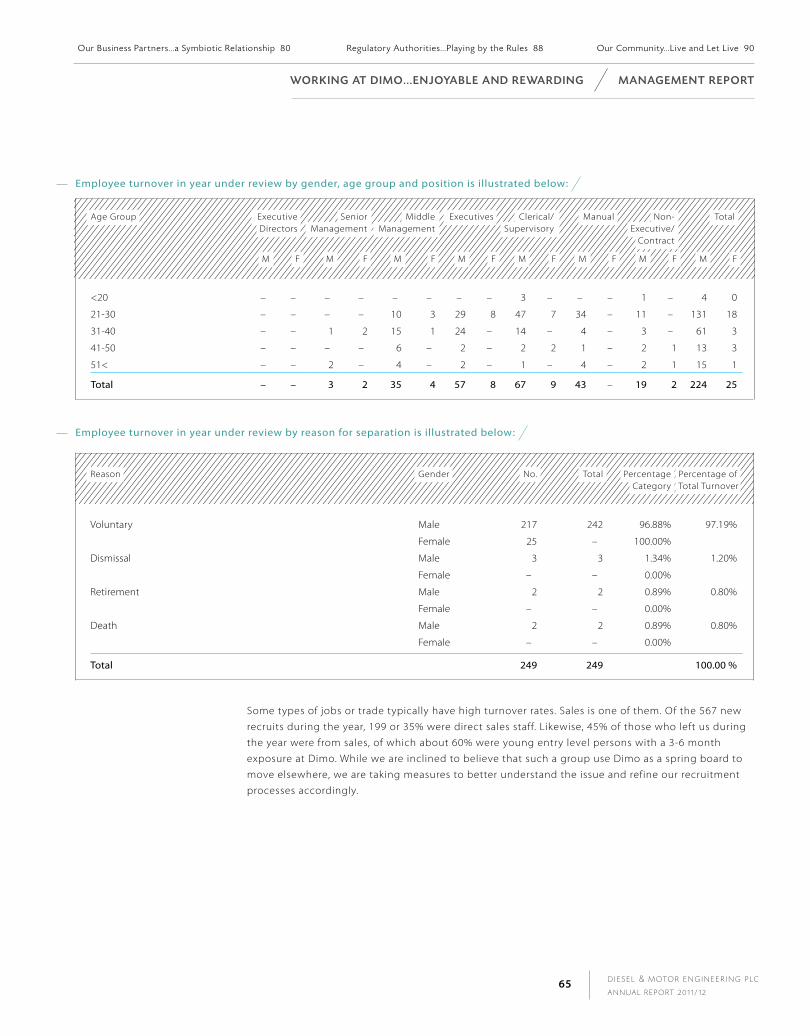
D I E S E L & M OTO R E N G I N E E R I N G P L C
A N N U A L R E P O RT 2 0 1 1 / 1 265
Employee turnover in year under review by gender, age group and position is illustrated below:
Age Group Executive Directors
SeniorManagement
Middle Management
Executives Clerical/Supervisory
Manual Non-Executive/
Contract
Total
M F M F M F M F M F M F M F M F
<20 – – – – – – – – 3 – – – 1 – 4 0
21-30 – – – – 10 3 29 8 47 7 34 – 11 – 131 18
31-40 – – 1 2 15 1 24 – 14 – 4 – 3 – 61 3
41-50 – – – – 6 – 2 – 2 2 1 – 2 1 13 3
51< – – 2 – 4 – 2 – 1 – 4 – 2 1 15 1
Total – – 3 2 35 4 57 8 67 9 43 – 19 2 224 25
Employee turnover in year under review by reason for separation is illustrated below:
Reason Gender No. Total Percentage Category
Percentage of Total Turnover
Voluntary Male 217 242 96.88% 97.19%
Female 25 – 100.00%
Dismissal Male 3 3 1.34% 1.20%
Female – – 0.00%
Retirement Male 2 2 0.89% 0.80%
Female – – 0.00%
Death Male 2 2 0.89% 0.80%
Female – – 0.00%
Total 249 249 100.00 %
Some types of jobs or trade typically have high turnover rates. Sales is one of them. Of the 567 new
recruits during the year, 199 or 35% were direct sales staff. Likewise, 45% of those who left us during
the year were from sales, of which about 60% were young entry level persons with a 3-6 month
exposure at Dimo. While we are inclined to believe that such a group use Dimo as a spring board to
move elsewhere, we are taking measures to better understand the issue and refine our recruitment
processes accordingly.
Our Bus iness Partners . . .a Symbiot ic Relat ionship 80 Regulatory Authorit ies . . .P lay ing by the Rules 88 Our Community. . .L ive and Let L ive 90
Wo R K I n G At d I M o . . . e n J oYA B L e A n d R eWA R d I n G M A n AG e M e n t R e P o Rt
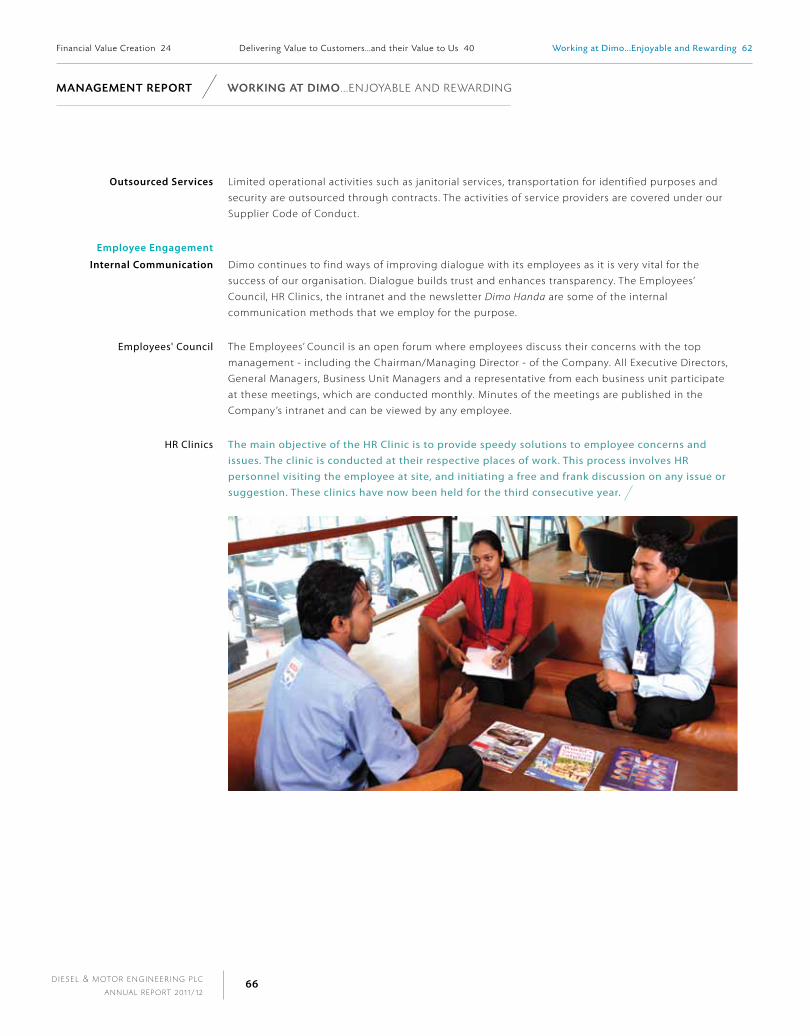
D I E S E L & M OTO R E N G I N E E R I N G P L C
A N N U A L R E P O RT 2 0 1 1 / 1 266
Outsourced Services Limited operational activities such as janitorial services, transportation for identified purposes and
security are outsourced through contracts. The activities of service providers are covered under our
Supplier Code of Conduct.
Employee Engagement
internal Communication Dimo continues to find ways of improving dialogue with its employees as it is very vital for the
success of our organisation. Dialogue builds trust and enhances transparency. The Employees’
Council, HR Clinics, the intranet and the newsletter Dimo Handa are some of the internal
communication methods that we employ for the purpose.
Employees' Council The Employees’ Council is an open forum where employees discuss their concerns with the top
management - including the Chairman/Managing Director - of the Company. All Executive Directors,
General Managers, Business Unit Managers and a representative from each business unit participate
at these meetings, which are conducted monthly. Minutes of the meetings are published in the
Company’s intranet and can be viewed by any employee.
HR Clinics The main objective of the HR Clinic is to provide speedy solutions to employee concerns and issues. The clinic is conducted at their respective places of work. This process involves HR personnel visiting the employee at site, and initiating a free and frank discussion on any issue or suggestion. These clinics have now been held for the third consecutive year.
M A n AG e M e n t R e P o Rt Wo R K I n G At d I M o . . . E N J OYA B L E A N D R E WA R D I N G
Financia l Value Creat ion 24 Del iver ing Value to Customers . . .and their Value to Us 40 Working at Dimo. . .Enjoyable and Rewarding 62
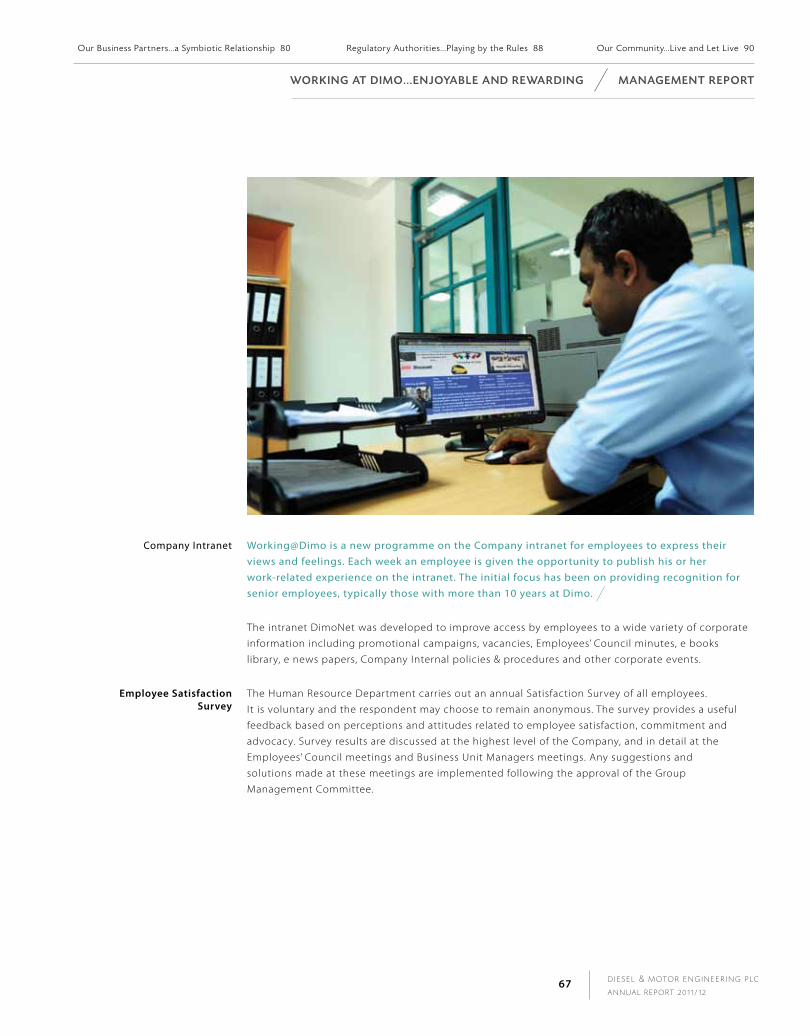
D I E S E L & M OTO R E N G I N E E R I N G P L C
A N N U A L R E P O RT 2 0 1 1 / 1 267
Company Intranet Working@Dimo is a new programme on the Company intranet for employees to express their views and feelings. Each week an employee is given the opportunity to publish his or her work-related experience on the intranet. The initial focus has been on providing recognition for senior employees, typically those with more than 10 years at Dimo.
The intranet DimoNet was developed to improve access by employees to a wide variety of corporate
information including promotional campaigns, vacancies, Employees’ Council minutes, e books
library, e news papers, Company Internal policies & procedures and other corporate events.
Employee Satisfaction Survey
The Human Resource Department carries out an annual Satisfaction Survey of all employees.
It is voluntary and the respondent may choose to remain anonymous. The survey provides a useful
feedback based on perceptions and attitudes related to employee satisfaction, commitment and
advocacy. Survey results are discussed at the highest level of the Company, and in detail at the
Employees’ Council meetings and Business Unit Managers meetings. Any suggestions and
solutions made at these meetings are implemented following the approval of the Group
Management Committee.
Wo R K I n G At d I M o . . . e n J oYA B L e A n d R eWA R d I n G M A n AG e M e n t R e P o Rt
Our Bus iness Partners . . .a Symbiot ic Relat ionship 80 Regulatory Authorit ies . . .P lay ing by the Rules 88 Our Community. . .L ive and Let L ive 90
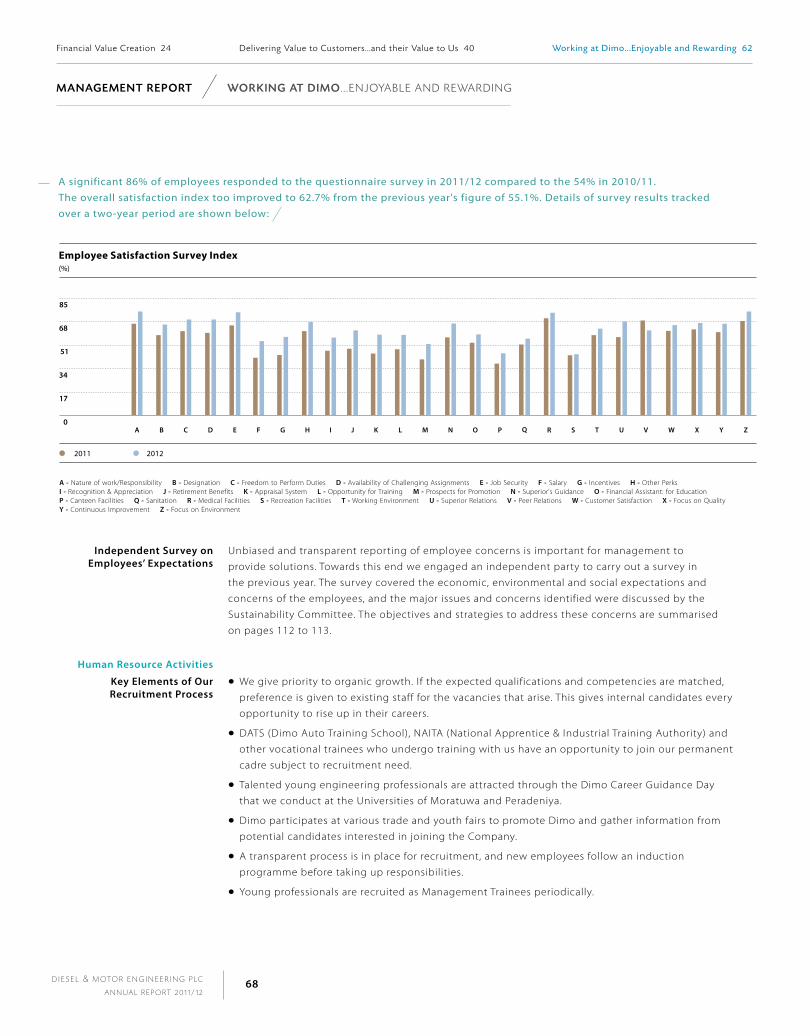
D I E S E L & M OTO R E N G I N E E R I N G P L C
A N N U A L R E P O RT 2 0 1 1 / 1 268
A significant 86% of employees responded to the questionnaire survey in 2011/12 compared to the 54% in 2010/11. The overall satisfaction index too improved to 62.7% from the previous year's figure of 55.1%. Details of survey results tracked over a two-year period are shown below:
independent Survey on Employees’ Expectations
Unbiased and transparent reporting of employee concerns is important for management to
provide solutions. Towards this end we engaged an independent party to carry out a survey in
the previous year. The survey covered the economic, environmental and social expectations and
concerns of the employees, and the major issues and concerns identified were discussed by the
Sustainability Committee. The objectives and strategies to address these concerns are summarised
on pages 112 to 113.
human resource activities
key Elements of Our recruitment process
We give priority to organic growth. If the expected qualifications and competencies are matched,
preference is given to existing staff for the vacancies that arise. This gives internal candidates every
opportunity to rise up in their careers.
DATS (Dimo Auto Training School), NAITA (National Apprentice & Industrial Training Authority) and
other vocational trainees who undergo training with us have an opportunity to join our permanent
cadre subject to recruitment need.
Talented young engineering professionals are attracted through the Dimo Career Guidance Day
that we conduct at the Universities of Moratuwa and Peradeniya.
Dimo participates at various trade and youth fairs to promote Dimo and gather information from
potential candidates interested in joining the Company.
A transparent process is in place for recruitment, and new employees follow an induction
programme before taking up responsibilities.
Young professionals are recruited as Management Trainees periodically.
M A n AG e M e n t R e P o Rt Wo R K I n G At d I M o . . . E N J OYA B L E A N D R E WA R D I N G
Financia l Value Creat ion 24 Del iver ing Value to Customers . . .and their Value to Us 40 Working at Dimo. . .Enjoyable and Rewarding 62
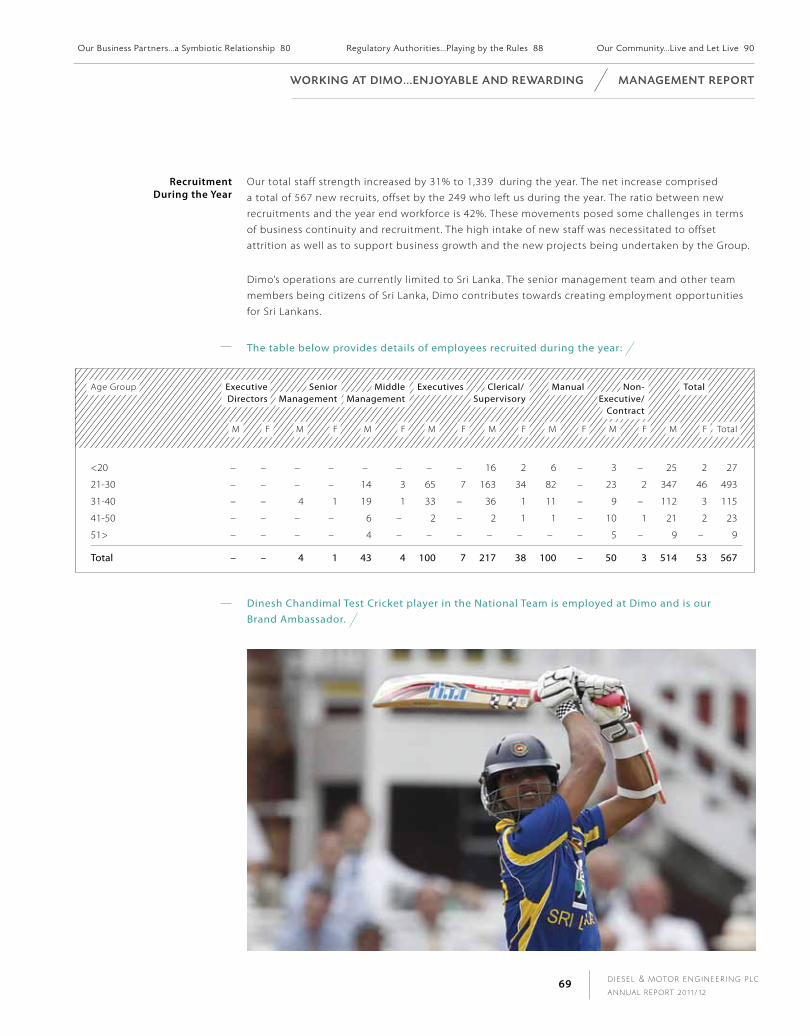
D I E S E L & M OTO R E N G I N E E R I N G P L C
A N N U A L R E P O RT 2 0 1 1 / 1 269
recruitment during the year
Our total staff strength increased by 31% to 1,339 during the year. The net increase comprised
a total of 567 new recruits, offset by the 249 who left us during the year. The ratio between new
recruitments and the year end workforce is 42%. These movements posed some challenges in terms
of business continuity and recruitment. The high intake of new staff was necessitated to offset
attrition as well as to support business growth and the new projects being undertaken by the Group.
Dimo’s operations are currently limited to Sri Lanka. The senior management team and other team
members being citizens of Sri Lanka, Dimo contributes towards creating employment opportunities
for Sri Lankans.
The table below provides details of employees recruited during the year:
Age Group Executive Directors
SeniorManagement
Middle Management
Executives Clerical/Supervisory
Manual Non-Executive/
Contract
Total
M F M F M F M F M F M F M F M F Total
<20 – – – – – – – – 16 2 6 – 3 – 25 2 27
21-30 – – – – 14 3 65 7 163 34 82 – 23 2 347 46 493
31-40 – – 4 1 19 1 33 – 36 1 11 – 9 – 112 3 115
41-50 – – – – 6 – 2 – 2 1 1 – 10 1 21 2 23
51> – – – – 4 – – – – – – – 5 – 9 – 9
Total – – 4 1 43 4 100 7 217 38 100 – 50 3 514 53 567
Dinesh Chandimal Test Cricket player in the National Team is employed at Dimo and is our Brand Ambassador.
Wo R K I n G At d I M o . . . e n J oYA B L e A n d R eWA R d I n G M A n AG e M e n t R e P o Rt
Our Bus iness Partners . . .a Symbiot ic Relat ionship 80 Regulatory Authorit ies . . .P lay ing by the Rules 88 Our Community. . .L ive and Let L ive 90
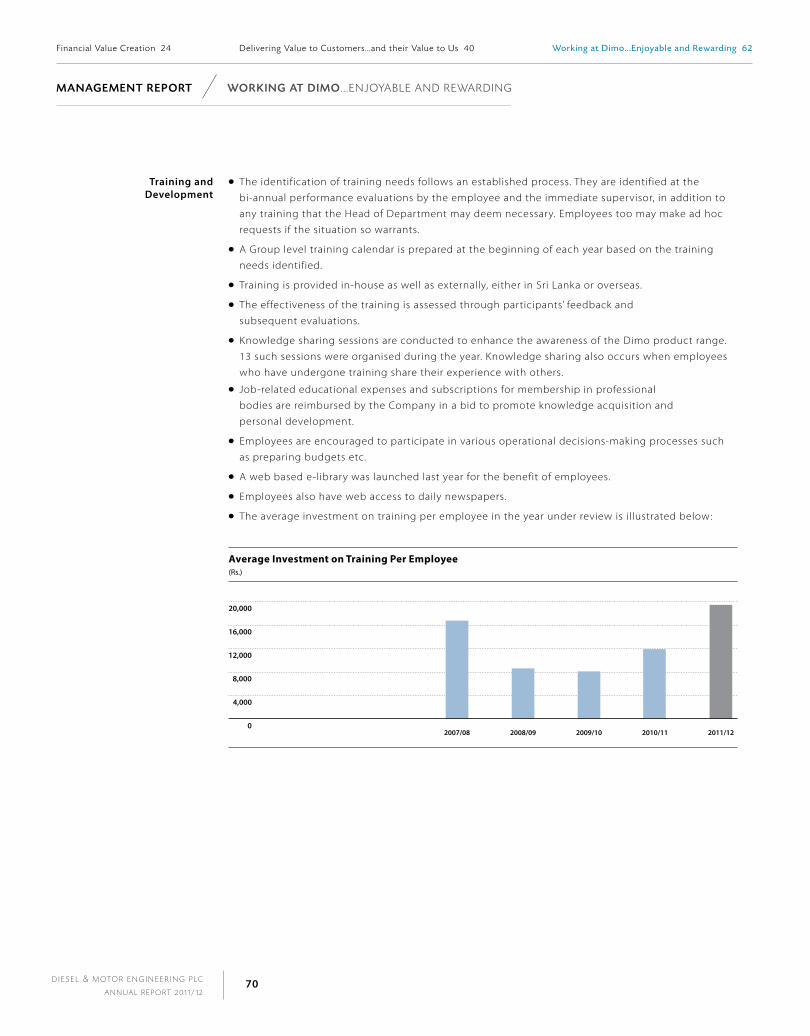
D I E S E L & M OTO R E N G I N E E R I N G P L C
A N N U A L R E P O RT 2 0 1 1 / 1 270
Training and development
The identification of training needs follows an established process. They are identified at the
bi-annual performance evaluations by the employee and the immediate supervisor, in addition to
any training that the Head of Department may deem necessary. Employees too may make ad hoc
requests if the situation so warrants.
A Group level training calendar is prepared at the beginning of each year based on the training
needs identified.
Training is provided in-house as well as externally, either in Sri Lanka or overseas.
The effectiveness of the training is assessed through participants’ feedback and
subsequent evaluations.
Knowledge sharing sessions are conducted to enhance the awareness of the Dimo product range.
13 such sessions were organised during the year. Knowledge sharing also occurs when employees
who have undergone training share their experience with others.
Job-related educational expenses and subscriptions for membership in professional
bodies are reimbursed by the Company in a bid to promote knowledge acquisition and
personal development.
Employees are encouraged to participate in various operational decisions-making processes such
as preparing budgets etc.
A web based e-library was launched last year for the benefit of employees.
Employees also have web access to daily newspapers.
The average investment on training per employee in the year under review is illustrated below:
M A n AG e M e n t R e P o Rt Wo R K I n G At d I M o . . . E N J OYA B L E A N D R E WA R D I N G
Financia l Value Creat ion 24 Del iver ing Value to Customers . . .and their Value to Us 40 Working at Dimo. . .Enjoyable and Rewarding 62

D I E S E L & M OTO R E N G I N E E R I N G P L C
A N N U A L R E P O RT 2 0 1 1 / 1 271
Training hours by category and gender is analysed as below:
Category Gender No. ofPersons
TrainingHours
Training Hours per Person
2011/12
Training Hoursper Person
2010/11
Board of Directors Male 7 330.50 47.21
Female – – –
Total 7 330.50 47.21 34.7
Senior Management Male 32 1,412.00 44.12
Female 3 370.50 123.5
Total 35 1,782.50 50.93 43.8
Middle Management Male 124 4,183.00 33.73
Female 16 196.00 12.25
Total 140 4,379.00 31.28 23.9
Executives Male 324 4,597.00 14.18
Female 47 754.00 16.04
Total 371 5,351.00 114.42 11.8
Clerical/Supervisory Male 383 2,965.00 7.74
Female 60 484.00 8.06
Total 443 3,449.00 7.70 2.6
Manual/Contract Male 339 2,813.50 8.30
Female 4 – –
Total 343 2,813.50 8.2 8.9
Total Male 1,209 16,301.00 13.48
Female 130 1,804.50 13.88
Total 1,339 18,105.50 13.52 10.9
Wo R K I n G At d I M o . . . e n J oYA B L e A n d R eWA R d I n G M A n AG e M e n t R e P o Rt
Our Bus iness Partners . . .a Symbiot ic Relat ionship 80 Regulatory Authorit ies . . .P lay ing by the Rules 88 Our Community. . .L ive and Let L ive 90

D I E S E L & M OTO R E N G I N E E R I N G P L C
A N N U A L R E P O RT 2 0 1 1 / 1 272
“We strive every day to do the things we do, to the best of our ability. If we are honest in this effort, success will follow.”
mOhan pandiThagEDirector
performance review, remuneration and Benefits
We deal fairly and honestly with our employees regarding wages,
benefits and other conditions of employment and recognise the
freedom of association as a human right.
Employees’ performance is evaluated by the business unit
managers bi-annually, and this scheme presently covers 66%
of employees in the Dimo Group. The balance 34% employees
represented new employees who are on probation, whose
performance is monitored on an ongoing basis.
Employees are offered attractive remuneration packages based
on performance and on par with the best in the industry.
Individual salaries are much more than the minimum prescribed
by law.
Business units conduct monthly meetings to review performance
against targets and discuss issues.
The Company conducts benefit surveys to establish external
parity and ensure that our employees’ remuneration levels are
on par or above the industry.
There is no discrimination on remuneration based on gender.
Innovations and new ideas are encouraged.
Company employees are eligible for a benefit plan under
payment of Gratuity Act No. 12 of 1983. Under this Act,
an employee who has completed 5 years of continuous service
is entitled to the equivalent of half a month’s salary for each
completed year in service.
Employees are recognised for a long service award upon
completion of 25 years in service.
M A n AG e M e n t R e P o Rt Wo R K I n G At d I M o . . . E N J OYA B L E A N D R E WA R D I N G
Financia l Value Creat ion 24 Del iver ing Value to Customers . . .and their Value to Us 40 Working at Dimo. . .Enjoyable and Rewarding 62

D I E S E L & M OTO R E N G I N E E R I N G P L C
A N N U A L R E P O RT 2 0 1 1 / 1 273
Employee rewards and recognition
Dimo recognises and rewards extraordinary commitment and performance over and above expected standards. With a variable compensation scheme, we allow employees to share in the Company’s success, and also be rewarded for their individual performance. During the year, Dimo introduced a new rewards and recognition policy, which includes: Bright Idea Award, Customer Service Award, Safety Award, Employee of the Year Sales, Technical and Support Services Category. During the year 2011/12, 32 employees were recognised and rewarded of their extraordinary commitment and performance.
Creating an Employer Brand
The achievement of our goals is dependent on the quality of our people. It is therefore vital that
we continue to attract the best to Dimo while developing those who are already working with us.
In 2011, Dimo launched a People Framework, which describes how we aspire to manage our
employees. Creating an ‘employer brand’ is one such initiative. Becoming an employer of choice is
our prime objective, and we have taken several initiatives to realise this dream, underpinned by
our promise ‘making work enjoyable and rewarding’. We also created a Careers Facebook page
‘Career@Dimo’.
Wo R K I n G At d I M o . . . e n J oYA B L e A n d R eWA R d I n G M A n AG e M e n t R e P o Rt
Our Bus iness Partners . . .a Symbiot ic Relat ionship 80 Regulatory Authorit ies . . .P lay ing by the Rules 88 Our Community. . .L ive and Let L ive 90

D I E S E L & M OTO R E N G I N E E R I N G P L C
A N N U A L R E P O RT 2 0 1 1 / 1 274
Participation in committees by gender and age group is analysed below:
Age Group
Committees Gender <30 years 31-50 years >51 Total
No. % No. % No. % No. %
Board of Directors (Executive Directors) Male – – 2 100 5 100 7 100
Female – – – – – –
Total – – 2 – 5 – 7 –
Group Management Committee Male – – 7 88 5 100 12 92
Female – – 1 12 – – 1 8
Total – – 8 5 – 13 –
Sustainability Committee Male – – 4 80 6 100 10 83
Female 1 100 1 20 – – 2 17
Total 1 – 5 – 6 – 12 –
Health and Safety Committee Male 6 75 13 87 6 100 25 86
Female 2 25 2 13 – – 4 14
Total 8 – 15 – 6 – 29 –
Employees’ Council Male 17 68 67 91 18 86 102 85
Female 8 32 7 9 3 14 18 15
Total 25 – 74 – 21 – 120 –
inauguration of the dimo Toastmasters Club
The Dimo Toastmasters Club was inaugurated in June 2011 with the participation of Toastmasters
from various other companies, followed by the first Speechcraft session for our members.
The programme continued for two months. The primary objectives of the club are to help members
to communicate more effectively, improve social networking skills, increase their leadership potential
and become more successful in their careers.
M A n AG e M e n t R e P o Rt Wo R K I n G At d I M o . . . E N J OYA B L E A N D R E WA R D I N G
Financia l Value Creat ion 24 Del iver ing Value to Customers . . .and their Value to Us 40 Working at Dimo. . .Enjoyable and Rewarding 62
D I E S E L & M OTO R E N G I N E E R I N G P L C
A N N U A L R E P O RT 2 0 1 1 / 1 275
Employee grievance handling
Dimo has an open-door policy and employees may discuss grievances or submit suggestions, and even have access to the Chairman. Employees also have the opportunity of bringing forward their grievances at the monthly Employees' Council meetings. On formal lodgements, it is Company policy to reply to the person within 10 working days. A total of 24 reports and suggestions were submitted during the year and they were satisfactorily addressed.
Category Total No. of Grievances
Grievances related to Human Rights only
Total No. of Grievances resolved
Total No. of Grievances resolved related to Human Rights only
M F M F M F M F
Internal stakeholders 23 1 – – 21 1 – –
Other Welfare and Social activities
An awareness programme on investment planning (management of retirement benefits) was held for
those employees reaching retirement age. The programme, conducted by the International Institute
of Development Training, explained the different savings and investment options available, their risk
and reward structure as well as cash flows, so that one could select the most suitable mix-based on
personal requirements.
A Death Donation Fund is in operation. Employees and the Company contribute equally to this
Fund, which is used to provide financial assistance to the affected family of the employee or to the
employee in the event of a death of an immediate family member.
An annual Christmas Party is organised by the Sports Committee for the children of employees.
In addition, school books and accessories are given away to the children of employees. An Art
Competition for the children of employees was conducted during the year on the theme 5S/Health
and Safety.
Loans to employees are granted at concessionary rates, while meals at the cafeteria are subsidised.
The annual excursion is another welfare measure that also promotes camaraderie and bonding
among employees.
The Company provides encouragement and support for employees to participate in sports.
The Dimo Sports Meet is an annual event organised by the Sports Committee of the Company.
We are proud of our cricket team that was the runner-up at the Mercantile Cricket Association
Tournament ‘C’ Division - 2012. By virtue of being the runner-up, the cricket team qualified to
compete in ‘B’ Division next year.
The annual Dimo Dinner Dance was yet another successful event on the social agenda during the
year under review.
We have a standardised process for employees returning to work from extended child care leave and
career coaching specially-tailored to female employees.
Wo R K I n G At d I M o . . . e n J oYA B L e A n d R eWA R d I n G M A n AG e M e n t R e P o Rt
Our Bus iness Partners . . .a Symbiot ic Relat ionship 80 Regulatory Authorit ies . . .P lay ing by the Rules 88 Our Community. . .L ive and Let L ive 90
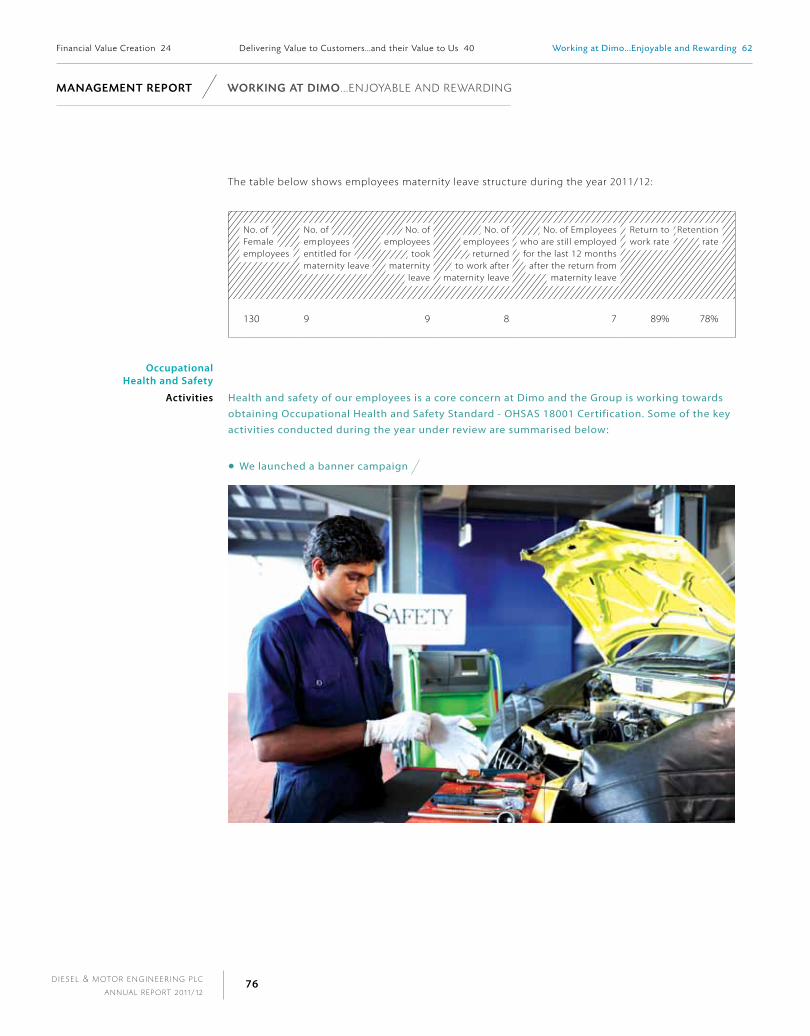
D I E S E L & M OTO R E N G I N E E R I N G P L C
A N N U A L R E P O RT 2 0 1 1 / 1 276
The table below shows employees maternity leave structure during the year 2011/12:
No. of Femaleemployees
No. ofemployees entitled for maternity leave
No. of employees
took maternity
leave
No. of employees
returned to work after
maternity leave
No. of Employees who are still employed for the last 12 months
after the return from maternity leave
Return to work rate
Retention rate
130 9 9 8 7 89% 78%
Occupational health and Safety
activities Health and safety of our employees is a core concern at Dimo and the Group is working towards obtaining Occupational Health and Safety Standard - OHSAS 18001 Certification. Some of the key activities conducted during the year under review are summarised below:
We launched a banner campaign
M A n AG e M e n t R e P o Rt Wo R K I n G At d I M o . . . E N J OYA B L E A N D R E WA R D I N G
Financia l Value Creat ion 24 Del iver ing Value to Customers . . .and their Value to Us 40 Working at Dimo. . .Enjoyable and Rewarding 62

D I E S E L & M OTO R E N G I N E E R I N G P L C
A N N U A L R E P O RT 2 0 1 1 / 1 277
A health and safety risk identification audit was conducted by the National Institute of Safety and
Health, and their recommendations are being implemented.
A 29-member Health and Safety Committee has been established. It comprises representatives
from management (7 members), executives (18 members) and non-executives (4 members).
All new constructions are designed with the required safety features.
Special protective clothing along with eyewear, helmets, gloves and footwear are provided to
employees as needed. Employees are regularly educated on safety practices and the importance of
wearing safety clothing and accessories.
The table below shows our track record on health and safety at work:
Cause 2011/12 2010/11 2009/10
Total No. Rate % Total No. Rate % Total No. Rate %
Injuries 22 1.6 26 2.5 7 0.7Occupational disease – – – – – –Lost working days 129 4.8 165.5 0.1 49 5.2Work-related fatalities – – – – – –
The employee absenteeism ratio reduce to 0.6% during the period under review from 3.6% in 2010/11.
key procedures Significant incidents are reported, discussed and communicated at the appropriate forums in order
to prevent a repetition.
Plant and machinery in the workshops are all equipped with modern safety mechanisms.
They undergo regular maintenance.
Training provided on plant operations includes safety aspects.
Regular fire drills are conducted at all locations and employees are educated on how to act in case
of an emergency.
A doctor visits the Colombo office and the Weliweriya and Siyambalape workshops daily for
consultations. No charge is levied for medicines and tests, as our objective is to ensure the good
health of all our employees. An in-house nurse is also available during working hours.
A First Aid training session was conducted for employees selected from each business unit. First
Aid Boxes are available at all required places.
Education, training, counselling and risk-control programmes are in place to assist employees,
their families, and community members regarding serious diseases. An Osteoporosis awareness
programme was conducted for employees, while a dengue awareness and prevention programme
was carried out through e-mails and posters during the year.
A Medical Insurance Cover is available for employees. Other insurance covers such as Workmen’s
Compensation and Group Term Life Insurance are also available.
Accountability and strict compliance with safety measures are in place, including penalties for
non-compliance.
Wo R K I n G At d I M o . . . e n J oYA B L e A n d R eWA R d I n G M A n AG e M e n t R e P o Rt
Our Bus iness Partners . . .a Symbiot ic Relat ionship 80 Regulatory Authorit ies . . .P lay ing by the Rules 88 Our Community. . .L ive and Let L ive 90

D I E S E L & M OTO R E N G I N E E R I N G P L C
A N N U A L R E P O RT 2 0 1 1 / 1 278
Biggest Loser Wellness Competition
A competition organised during the year to identify the team that can shed those extra pounds and become healthier! Health is Wealth.
Compliance with laws and regulations
The Dimo Group strictly follows all statutory requirements with regard to employee
remuneration, health and working environment. More details are discussed in the management
Report - Regulatory Authorities.
labour rights and freedom of association
We are committed to complying with all applicable labour laws in the country and best practices of
the industry. Employees are given the opportunity to voice their opinion at the Employees’ Council
and HR clinics, and also directly with any officer at any level of management through our open door
policy. We ensure that employees’ rights are not at risk under any circumstances, and we have not
been involved in any activity that hinders the freedom of association.
The employees‘ council provides a forum to discuss any issues that may arise when operational
changes such as change in location of business takes place.
human rights The Dimo Group is committed to all the rights contained in international conventions on human
rights and those rights contained in the Constitution of Sri Lanka.
We are deeply committed to advancing the rights of all those working within the organisation as
well as all other stakeholders with whom we engage. We take action to ensure that our suppliers,
dealers and other business partners also respect and espouse human rights within the scope of
their own businesses.
We do not tolerate discrimination in any form.
We respect the dignity of our employees and we work to ensure our associates’ right to personal
security, a safe, clean and healthy workplace and freedom from harassment or abuse of any kind.
These issues are also addressed in the Dimo Code of Conduct.
The Code of Conduct, to which all employees are adherent, incorporates the tenets of human
rights and compliance.
We undertake to create awareness on sexual harassment among our employees at all levels. It is
our policy to treat all complaints of sexual harassment seriously and confidentially. During the year,
HR Department conducted an awareness session on Harassment in the Workplace.
investment and procurement practices
There were no significant investment agreements entered into during the reporting period.
In the event of an investment in the ensuing year, employee related issues would be addressed
at the employees’ council. Dimo has in palce a Supplier Code of Conduct and Declaratrion for
supplier screening.
M A n AG e M e n t R e P o Rt Wo R K I n G At d I M o . . . E N J OYA B L E A N D R E WA R D I N G
Financia l Value Creat ion 24 Del iver ing Value to Customers . . .and their Value to Us 40 Working at Dimo. . .Enjoyable and Rewarding 62
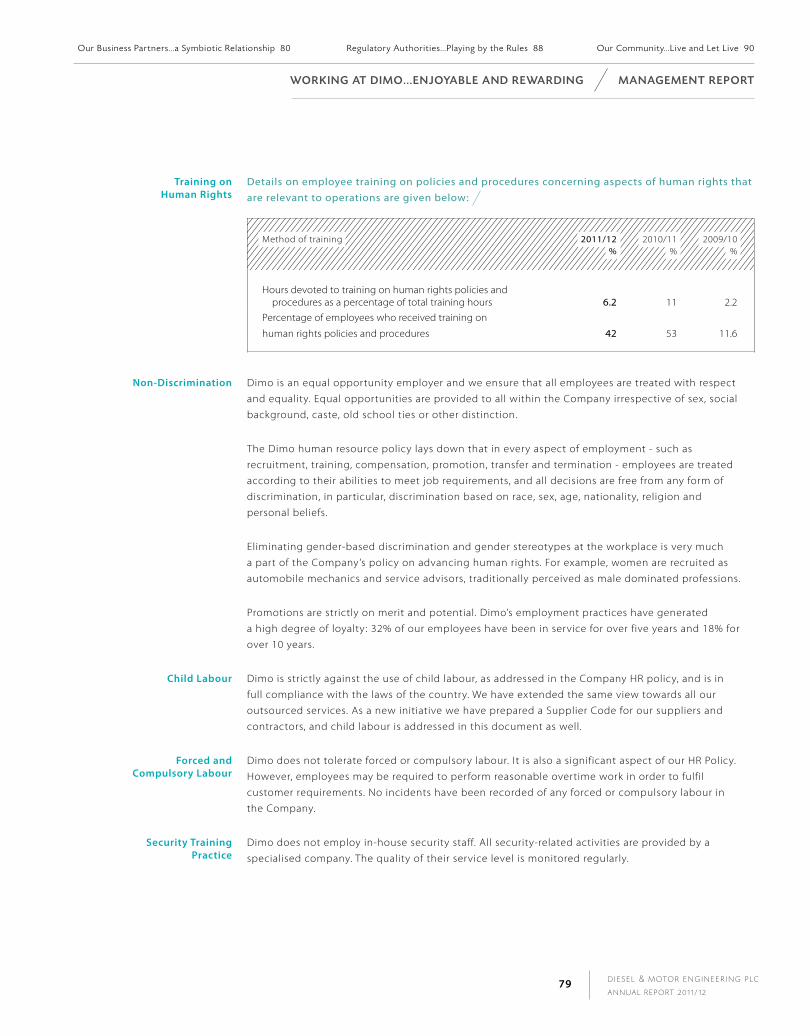
D I E S E L & M OTO R E N G I N E E R I N G P L C
A N N U A L R E P O RT 2 0 1 1 / 1 279
Training on human rights
Details on employee training on policies and procedures concerning aspects of human rights that are relevant to operations are given below:
Method of training 2011/12%
2010/11%
2009/10%
Hours devoted to training on human rights policies and procedures as a percentage of total training hours 6.2 11 2.2Percentage of employees who received training on
human rights policies and procedures 42 53 11.6
non-discrimination Dimo is an equal opportunity employer and we ensure that all employees are treated with respect
and equality. Equal opportunities are provided to all within the Company irrespective of sex, social
background, caste, old school ties or other distinction.
The Dimo human resource policy lays down that in every aspect of employment - such as
recruitment, training, compensation, promotion, transfer and termination - employees are treated
according to their abilities to meet job requirements, and all decisions are free from any form of
discrimination, in particular, discrimination based on race, sex, age, nationality, religion and
personal beliefs.
Eliminating gender-based discrimination and gender stereotypes at the workplace is very much
a part of the Company’s policy on advancing human rights. For example, women are recruited as
automobile mechanics and service advisors, traditionally perceived as male dominated professions.
Promotions are strictly on merit and potential. Dimo’s employment practices have generated
a high degree of loyalty : 32% of our employees have been in service for over five years and 18% for
over 10 years.
Child labour Dimo is strictly against the use of child labour, as addressed in the Company HR policy, and is in
full compliance with the laws of the country. We have extended the same view towards all our
outsourced services. As a new initiative we have prepared a Supplier Code for our suppliers and
contractors, and child labour is addressed in this document as well.
forced and Compulsory labour
Dimo does not tolerate forced or compulsory labour. It is also a significant aspect of our HR Policy.
However, employees may be required to perform reasonable overtime work in order to fulfil
customer requirements. No incidents have been recorded of any forced or compulsory labour in
the Company.
Security Training practice
Dimo does not employ in-house security staff. All security-related activities are provided by a
specialised company. The quality of their service level is monitored regularly.
Wo R K I n G At d I M o . . . e n J oYA B L e A n d R eWA R d I n G M A n AG e M e n t R e P o Rt
Our Bus iness Partners . . .a Symbiot ic Relat ionship 80 Regulatory Authorit ies . . .P lay ing by the Rules 88 Our Community. . .L ive and Let L ive 90

“It is a fine line that lies between Management and Leadership. Good management sees things done right. Good leadership sees the right things done, always.”
gladWin pEiriSDirector
M A n AG e M e n t R e P o Rt o U R B U S I n e S S PA Rt n e R S . . . A SY M B I OT I C R E L AT I O N S h I P
management approach
Our business partner network comprises principals of the
brands that we represent, local and foreign suppliers of
materials and organisations that provide various support
services. Our value creation begins with the products and
services provided by them. Delivering the highest quality
requires consistent execution - by us, our principals,
our suppliers, our distributors and our agents. Because quality,
in all its manifestations, is at the very core of our business, the
success of our business partners is essential to our very own.
As a standard setter in many of the market segments we
serve, Dimo believes in partnering with the world’s best.
We serve our customers with the best of products and services
in their respective categories, and stretch ourselves to the
highest standards that our principals expect of us - without
compromising on quality, ethics and trust.
In today’s economic environment, achieving lower costs,
improving quality and managing a sustainable business require
an unprecedented level of co-operation with suppliers and
the maintenance of strong supplier relationships. We engage
with our principals in a systematic manner, and deliver on our
promise, year after year. The long lasting relationships that
we have nurtured have held us in good stead. We continue
to receive competitive prices for supplies. Our transparency
and accountability in our business approach remains another
differentiator that has helped to blossom many mutually
beneficial relationships.
Financia l Value Creat ion 24 Del iver ing Value to Customers . . .and their Value to Us 40 Working at Dimo. . .Enjoyable and Rewarding 62
D I E S E L & M OTO R E N G I N E E R I N G P L C
A N N U A L R E P O RT 2 0 1 1 / 1 281
Expectations of Our Business partners
Representing some of the world’s best brands comes with its obligations. Our service delivery too is
required to be on par with the global brand image. Through regular supplier engagement we stay
abreast of developments and the expectations of our principals, while keeping them informed on
changing market conditions and the ever-evolving demands of customers.
These expectations include relentless investment in people, facilities and inventories in both good
times and bad.
The availability of products at any time with easy access to customers is a main concern of suppliers.
Meeting sales targets, maintaining superior after sales service, attracting new customers while
retaining existing ones, and introducing new products are other key expectations of suppliers. It also
means keeping and growing our market share in a sustainable manner.
keeping Our promise
We understand these expectations. During the year, we invested heavily on establishing state-of-the-
art product display points countrywide, and moved on to upgrade our service stations beyond the
standards set by our principals.
We continued to invest in training and development of our employees, both locally and abroad, to
bring them on par with international standards. We also introduced measures to keep our technical
and support staff updated on technological developments.
To benchmark ourselves, we conduct research, surveys and face to face interviews with stakeholders
from time to time. These are usually carried by independent specialist organisations. The valuable
insights we gain as a result help us initiate further improvements on the products and services we
offer. We share these findings and our response with our principals.
Dimo is a market leader in many of the market segments that it serves. Remaining there requires
continuous improvement and innovation as we strive to meet sales targets while growing our
market share.
Strategic fit Some of our relationships with our principals are as long as Dimo’s own existence. At the same time,
we seek new business avenues based on emerging opportunities and our core competencies, and as
a result we have also been adding new principals who represent a strategic fit.
Conflict resolution We maintain open two-way channels of communication with our suppliers, and procedures are in
place to voice any issue. The business unit managers also provide regular feedback to principals in
order to keep them aware of changing conditions.
Our Business Partners . . .a Symbiotic Relat ionship 80 Regulatory Authorit ies . . .P lay ing by the Rules 88 Our Community. . .L ive and Let L ive 90
o U R B U S I n e S S PA Rt n e R S . . . A SYM B I ot I C R e L At I o n S h I P M A n AG e M e n t R e P o Rt

D I E S E L & M OTO R E N G I N E E R I N G P L C
A N N U A L R E P O RT 2 0 1 1 / 1 282
relationship Building We value the lasting relationships with our suppliers, some of them going back more than 50 years.
As a Company that uses the cutting edge technology of our principals as a key market differentiator,
the development of our human capital plays an important role in our success. Thus, a major part of
Dimo’s training and development inputs come from our principals.
We engage with our principals in a methodical and regular manner. These engagements could range from one-to-one meetings at the top level, both in Sri Lanka as well as in the principals’ home countries. Engagement also takes the form of familiarisation tours, training programmes and workshops for our staff as well as for representatives of principals. Discussions may include performance, economic and market trends, competitor issues, targets, training needs, resource utilisation and other processes.
Through these engagements we keep abreast of the developments and aspirations of our principals, while keeping them posted on changing market conditions and the ever-evolving needs of our customers.
M A n AG e M e n t R e P o Rt o U R B U S I n e S S PA Rt n e R S . . . A SY M B I OT I C R E L AT I O N S h I P
Financia l Value Creat ion 24 Del iver ing Value to Customers . . .and their Value to Us 40 Working at Dimo. . .Enjoyable and Rewarding 62
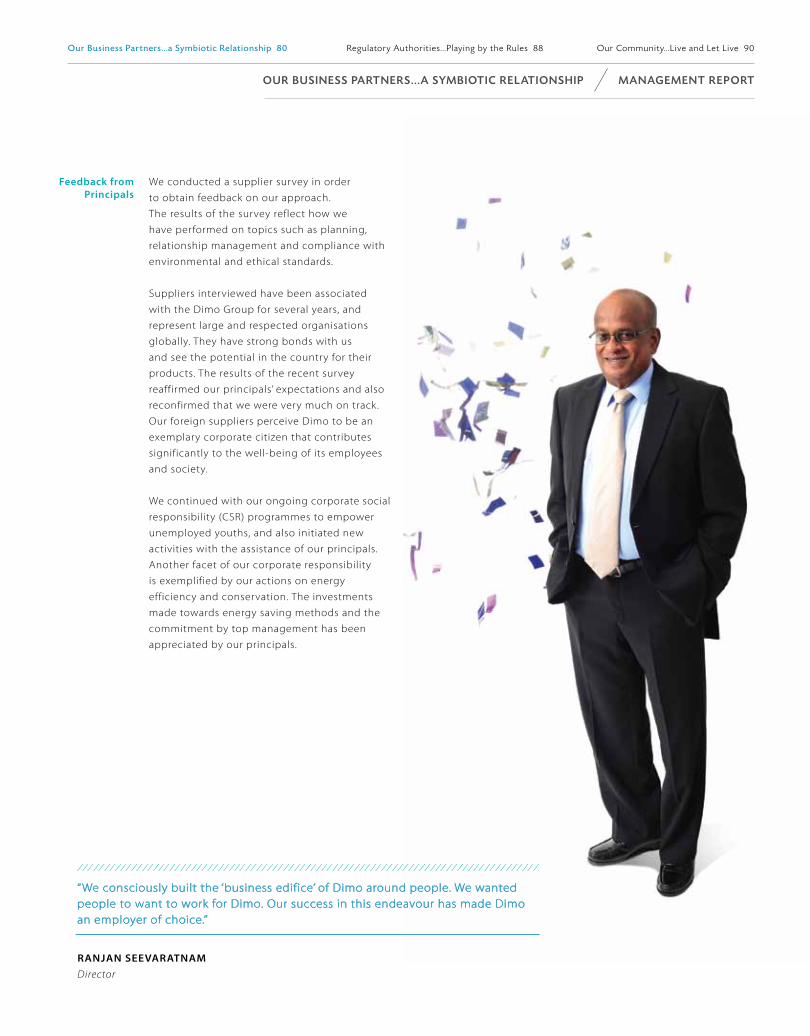
“We consciously built the ‘business edifice’ of Dimo around people. We wanted people to want to work for Dimo. Our success in this endeavour has made Dimo an employer of choice.”
ranjan SEEvaraTnamDirector
feedback from principals
We conducted a supplier survey in order
to obtain feedback on our approach.
The results of the survey reflect how we
have performed on topics such as planning,
relationship management and compliance with
environmental and ethical standards.
Suppliers interviewed have been associated
with the Dimo Group for several years, and
represent large and respected organisations
globally. They have strong bonds with us
and see the potential in the country for their
products. The results of the recent survey
reaffirmed our principals’ expectations and also
reconfirmed that we were very much on track.
Our foreign suppliers perceive Dimo to be an
exemplary corporate citizen that contributes
significantly to the well-being of its employees
and society.
We continued with our ongoing corporate social
responsibility (CSR) programmes to empower
unemployed youths, and also initiated new
activities with the assistance of our principals.
Another facet of our corporate responsibility
is exemplified by our actions on energy
efficiency and conservation. The investments
made towards energy saving methods and the
commitment by top management has been
appreciated by our principals.
Our Business Partners . . .a Symbiotic Relat ionship 80 Regulatory Authorit ies . . .P lay ing by the Rules 88 Our Community. . .L ive and Let L ive 90
o U R B U S I n e S S PA Rt n e R S . . . A SYM B I ot I C R e L At I o n S h I P M A n AG e M e n t R e P o Rt

“Excellence can often be measured by the degree to which one has challenged the status quo…and it ’s worth noting that it is through challenge that one achieves the highest degree of self worth.”
Channa WEEraWardanEExecutive Director
Supplier Evaluation process
Embedding sustainability throughout the supply chain is clearly not
something Dimo can do alone. As well as working with our own suppliers,
we engage with others in our industry to promote a wider action
through joint activities. As a responsible corporate citizen we support the
development of a cross industry approach to improve our accountability
as an industry.
At Dimo, supplier evaluation is a continuous process by all our supply
chain management units. Both new and existing suppliers are selected and
evaluated not only on the basis of economic criteria, but also on standards
for environmental protection, occupational safety and social responsibility.
Our Code of Conduct for suppliers is based on internationally recognised
guidelines which is the driving force in selecting, retaining and sustaining
the most appropriate business partners. It includes environmental
protection and compliance with human rights and labour laws, as well as
anti-discrimination and anti-corruption policies. Our key criteria are
noted below:
Pricing of products
Response time
Quality of product
Repair handling
Credit terms
Warranty handling
Shipment period
M A n AG e M e n t R e P o Rt o U R B U S I n e S S PA Rt n e R S . . . A SY M B I OT I C R E L AT I O N S h I P
Financia l Value Creat ion 24 Del iver ing Value to Customers . . .and their Value to Us 40 Working at Dimo. . .Enjoyable and Rewarding 62

D I E S E L & M OTO R E N G I N E E R I N G P L C
A N N U A L R E P O RT 2 0 1 1 / 1 285
In addition to the criteria noted above, we also review the supplier ’s standards and practices,
particularly in respect of compliance with environmental laws, Dimo's Code of Conduct on business
ethics and working conditions of employees. This approach has helped improve the sustainability of
our supply chain and has led to long-term relationships with suppliers.
Openness and trust are important aspects when working together with suppliers and driving
compliance and performance improvements. We find that some suppliers have well-developed
corporate responsibility programmes, while others need more support.
Our existing and prospective suppliers are required to make a declaration on four principles, namely:
(i) labour and human rights, (ii) health and safety at work, (iii) sound environmental practices, and (iv)
business ethics when dealing with workers, suppliers and customers.
Our key principalsName Country Brands No. of Years of
Relationship
Daimler AG Germany Mercedes-Benz 73
Robert Bosch GmbH Germany Bosch/Dremel 58
KHD Humbldt Wedag AG Germany KHD 52
Siemens Germany/India Siemens 52
Tata Motors Ltd. India Tata 51
Bosch Ltd. India Bosch 43
Komatsu Asia & Pacific Pte. Ltd. Singapore Komatsu 43
Komatsu Ltd. Japan Komatsu 43
KSB AG Germany KSB 43
Johnson Controls (S) Pte. Ltd. Singapore York/Sabroe/Star/Frick 35
Bomag GmbH Germany Bomag 33
Bosch Automotive Systems Corporation Japan Zexel 28
Robert Bosch Ew Germany Bosch 28
Carl Zeiss Meditec Germany Zeiss 27
Tognum Asia Pte. Ltd. Singapore MTU/DDC 25
Mahindra & Mahindra Ltd. India Mahindra 22
Michelin France Michelin 19
OSRAM GmbH Germany OSRAM 18
DEMAG Cranes & Components GmbH Germany DEMAG 18
Rane Brake Linings Ltd. India Rane 18
WOMA GmbH Germany WOMA 18
Blaupunkt GmbH Germany Blaupunkt 17
Daimler South East Asia Pte. Ltd. Singapore Mercedes-Benz 17
India Pistons Ltd. India IPL 17
Fenner (India) Ltd. India Fenner/Pioneer 15
Our Business Partners . . .a Symbiotic Relat ionship 80 Regulatory Authorit ies . . .P lay ing by the Rules 88 Our Community. . .L ive and Let L ive 90
o U R B U S I n e S S PA Rt n e R S . . . A SYM B I ot I C R e L At I o n S h I P M A n AG e M e n t R e P o Rt

D I E S E L & M OTO R E N G I N E E R I N G P L C
A N N U A L R E P O RT 2 0 1 1 / 1 286
Name Country Brands No. of Years of Relationship
Vossloh-Schwabe GmbH Germany VS 15
Bimetal Bearings Ltd. India Bimite 14
SiTeco Lighting (M) Sdn Bhd Malaysia SiTeco 13
John Deere Asia (Pvt) Ltd. Singapore John Deere 11
MRF India MRF 11
Davex Engineering (M) Sdn Bhd Malaysia Davis 10
Draeger Medical Germany Draeger 10
Schaefer Systems International Pte. Ltd. Malaysia Schaefer 10
Claas India Ltd. India CLAAS 9
MHE-Demag (s) Pte. Ltd. Singapore MHE-Demag 9
Chrysler Group LLC USA Chrysler/Jeep 8
Everdigm Corp. South Korea Everdigm 8
Schwing Stetter (India) Pvt Ltd. India Stetter 7
Zenoah Japan Zenoah 7
Fischer Werke GmbH Germany Fischer 6
Snap-on Tools (Pvt) Ltd. USA Hoffmann/JBC 6
Sri Bhavani Castings Ltd. India SBP 6
VE Commercial Vehicles Ltd. India Eihcer Dem 6
Victor Gaskets India Ltd. India Victor 6
See Hau Global Sdn Bhd Malaysia Intraco Pallet 4
Turbo Bearings (P) Ltd. India Turbo 3
Sri Ramadas Motor Transport Ltd. India SRMT 3
RZB Rudolf Zimmermann Germany RZB 2
WD 40 Company USA WD 40 2
Haulotte Group France Haulotte 2
Auto & Construction Equipment Corp. India Jabsco, Rule, Flojet,
Yamada
2
Technology Ventures Middle East FZC UAE Technology Ventures 2
Fujiwa Corpoaration Japan Fujiwa 2
Kumho Tires Korea Kumho 1
Manitowoc Cranes India Manitowoc/Potain/
Grove
1
Sany Port Machinery Company China Sany 1
Shardlow Co. Ltd. India Shardlow 1
EC Smith & Sons (Marine Factors) Ltd. UK ecs 1
M A n AG e M e n t R e P o Rt o U R B U S I n e S S PA Rt n e R S . . . A SY M B I OT I C R E L AT I O N S h I P
Financia l Value Creat ion 24 Del iver ing Value to Customers . . .and their Value to Us 40 Working at Dimo. . .Enjoyable and Rewarding 62
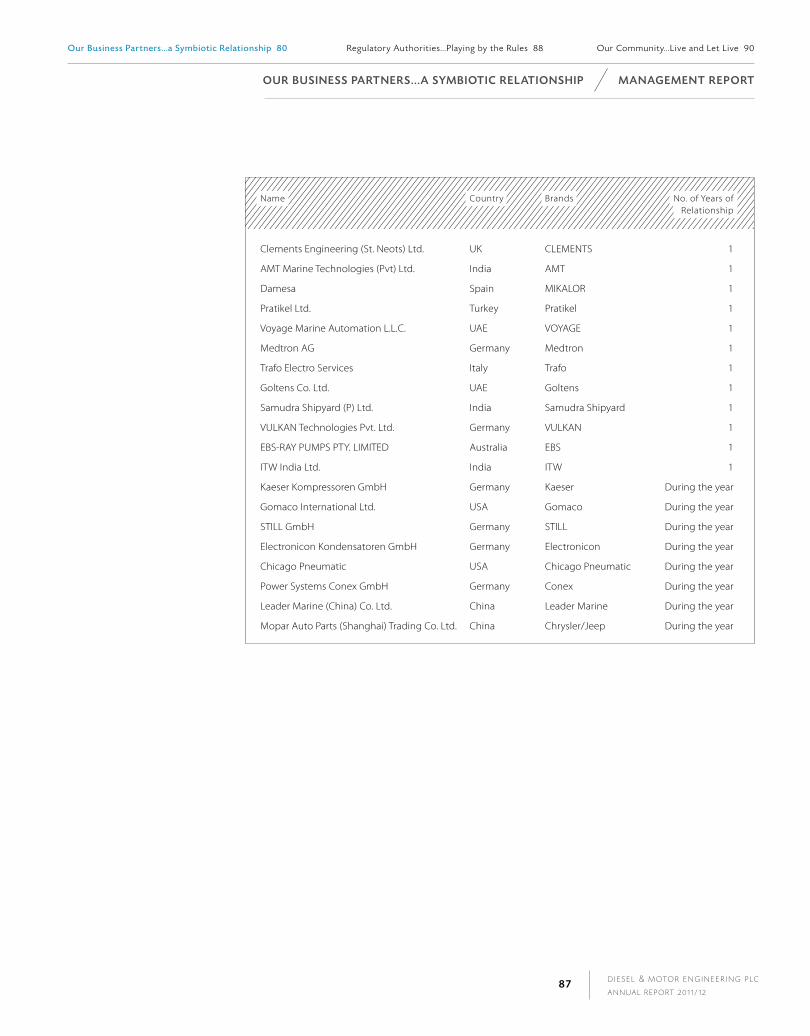
D I E S E L & M OTO R E N G I N E E R I N G P L C
A N N U A L R E P O RT 2 0 1 1 / 1 287
Name Country Brands No. of Years of Relationship
Clements Engineering (St. Neots) Ltd. UK CLEMENTS 1
AMT Marine Technologies (Pvt) Ltd. India AMT 1
Damesa Spain MIKALOR 1
Pratikel Ltd. Turkey Pratikel 1
Voyage Marine Automation L.L.C. UAE VOYAGE 1
Medtron AG Germany Medtron 1
Trafo Electro Services Italy Trafo 1
Goltens Co. Ltd. UAE Goltens 1
Samudra Shipyard (P) Ltd. India Samudra Shipyard 1
VULKAN Technologies Pvt. Ltd. Germany VULKAN 1
EBS-RAY PUMPS PTY. LIMITED Australia EBS 1
ITW India Ltd. India ITW 1
Kaeser Kompressoren GmbH Germany Kaeser During the year
Gomaco International Ltd. USA Gomaco During the year
STILL GmbH Germany STILL During the year
Electronicon Kondensatoren GmbH Germany Electronicon During the year
Chicago Pneumatic USA Chicago Pneumatic During the year
Power Systems Conex GmbH Germany Conex During the year
Leader Marine (China) Co. Ltd. China Leader Marine During the year
Mopar Auto Parts (Shanghai) Trading Co. Ltd. China Chrysler/Jeep During the year
Our Business Partners . . .a Symbiotic Relat ionship 80 Regulatory Authorit ies . . .P lay ing by the Rules 88 Our Community. . .L ive and Let L ive 90
o U R B U S I n e S S PA Rt n e R S . . . A SYM B I ot I C R e L At I o n S h I P M A n AG e M e n t R e P o Rt
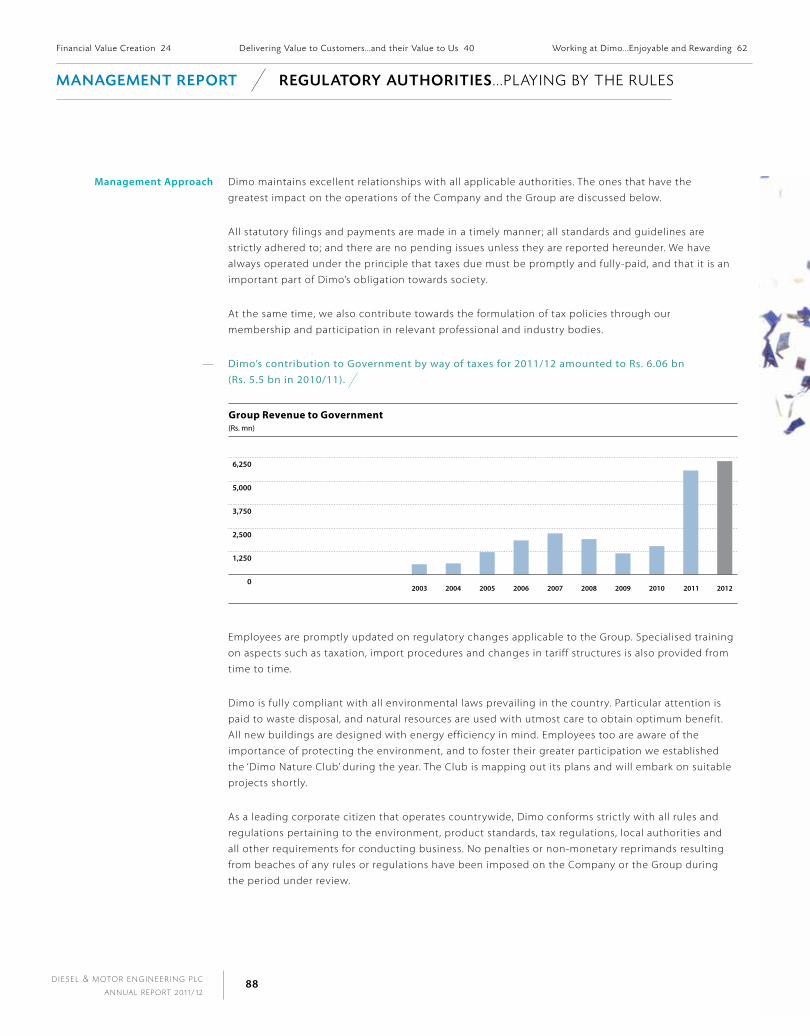
D I E S E L & M OTO R E N G I N E E R I N G P L C
A N N U A L R E P O RT 2 0 1 1 / 1 288
M A n AG e M e n t R e P o Rt R eG U L Ato RY AU t h o R I t I e S . . . P L AY I N G BY T h E R U L E S
management approach Dimo maintains excellent relationships with all applicable authorities. The ones that have the
greatest impact on the operations of the Company and the Group are discussed below.
All statutory filings and payments are made in a timely manner; all standards and guidelines are
strictly adhered to; and there are no pending issues unless they are reported hereunder. We have
always operated under the principle that taxes due must be promptly and fully-paid, and that it is an
important part of Dimo’s obligation towards society.
At the same time, we also contribute towards the formulation of tax policies through our
membership and participation in relevant professional and industry bodies.
Dimo’s contribution to Government by way of taxes for 2011/12 amounted to Rs. 6.06 bn (Rs. 5.5 bn in 2010/11).
Employees are promptly updated on regulatory changes applicable to the Group. Specialised training
on aspects such as taxation, import procedures and changes in tariff structures is also provided from
time to time.
Dimo is fully compliant with all environmental laws prevailing in the country. Particular attention is
paid to waste disposal, and natural resources are used with utmost care to obtain optimum benefit.
All new buildings are designed with energy efficiency in mind. Employees too are aware of the
importance of protecting the environment, and to foster their greater participation we established
the ‘Dimo Nature Club’ during the year. The Club is mapping out its plans and will embark on suitable
projects shortly.
As a leading corporate citizen that operates countrywide, Dimo conforms strictly with all rules and
regulations pertaining to the environment, product standards, tax regulations, local authorities and
all other requirements for conducting business. No penalties or non-monetary reprimands resulting
from beaches of any rules or regulations have been imposed on the Company or the Group during
the period under review.
Financia l Value Creat ion 24 Del iver ing Value to Customers . . .and their Value to Us 40 Working at Dimo. . .Enjoyable and Rewarding 62
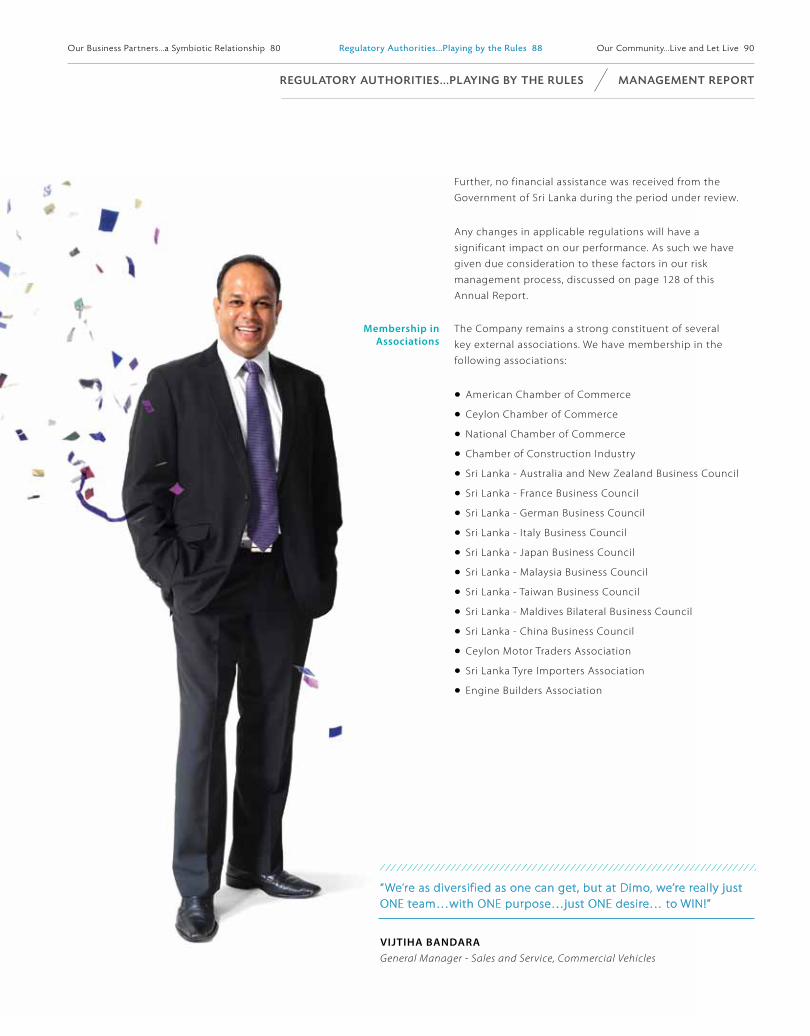
“We’re as diversified as one can get, but at Dimo, we’re really just ONE team…with ONE purpose…just ONE desire… to WIN!”
vijTiha BandaraGeneral Manager - Sales and Service, Commercial Vehicles
Further, no financial assistance was received from the
Government of Sri Lanka during the period under review.
Any changes in applicable regulations will have a
significant impact on our performance. As such we have
given due consideration to these factors in our risk
management process, discussed on page 128 of this
Annual Report.
membership in associations
The Company remains a strong constituent of several
key external associations. We have membership in the
following associations:
American Chamber of Commerce
Ceylon Chamber of Commerce
National Chamber of Commerce
Chamber of Construction Industry
Sri Lanka - Australia and New Zealand Business Council
Sri Lanka - France Business Council
Sri Lanka - German Business Council
Sri Lanka - Italy Business Council
Sri Lanka - Japan Business Council
Sri Lanka - Malaysia Business Council
Sri Lanka - Taiwan Business Council
Sri Lanka - Maldives Bilateral Business Council
Sri Lanka - China Business Council
Ceylon Motor Traders Association
Sri Lanka Tyre Importers Association
Engine Builders Association
Our Bus iness Partners . . .a Symbiot ic Relat ionship 80 Regulatory Authorit ies . . .P laying by the Rules 88 Our Community. . .L ive and Let L ive 90
R eG U L Ato RY AU t h o R I t I e S . . . P L AY I n G BY t h e R U L e S M A n AG e M e n t R e P o Rt

“Brain and brawn can help you offer the best product solution to your customer…but it ’s when you add heart that you put environmental and societal consciousness ‘on the same page’ as core business.”
anuradha diaSGeneral Manager - Tyres
M A n AG e M e n t R e P o Rt o U R Co M M U n I t Y . . . L I V E A N D L E T L I V E
management approach
Our 1,300+ employees and their families represent the single
largest ‘community ’ that we interact with on a daily basis.
Our engagement with them was discussed in a previous section
of the Annual Report. The next group or community closest to
the Dimo Group is the local youth who aspire to making a career
in the field of automotive engineering or the various other
fields that we are engaged in. Whilst these two communities
receive our primary focus, we are always ready to engage with
others in the localities where we operate and partner mutually
beneficial relationships.
What Our Communities
Expect of us
Following an independent stakeholder engagement process in
the previous year, we learned that the local communities would
like to see our greater involvement in the development of social
and economic infrastructure as well as education. These aspects
have been discussed regularly by the Group Sustainability
Committee, and we have already embarked on projects that are
discussed below as well as taken initiatives to set objectives and
targets (for more details refer pages 112 to 113).
impact assessment of Community
The group has business locations spread across the country.
These business locations interact with local communities at
different levels and given below are some of the interactive
sessions held.
Siyambalpe Workshop - TATA Commercial workshop - Meeting
with members of Village society (Eksath Annoyadara Samithiya)
in order to repair the access road to the workshop and village.
Kandy Workshop - Participating in transportation sector
infrastructure development lobby organised by the Central
Provincial Council.
Kurunegala Workshop - Support extended to Dengue
prevention programmes.
Matara Workshop - Participation in streamlining the garbage
collection process.
Special emphasis has also been placed on waste disposal, air,
water and noise emissions at these locations. They are also
constantly monitored to keep them at permissible levels.
Financia l Value Creat ion 24 Del iver ing Value to Customers . . .and their Value to Us 40 Working at Dimo. . .Enjoyable and Rewarding 62
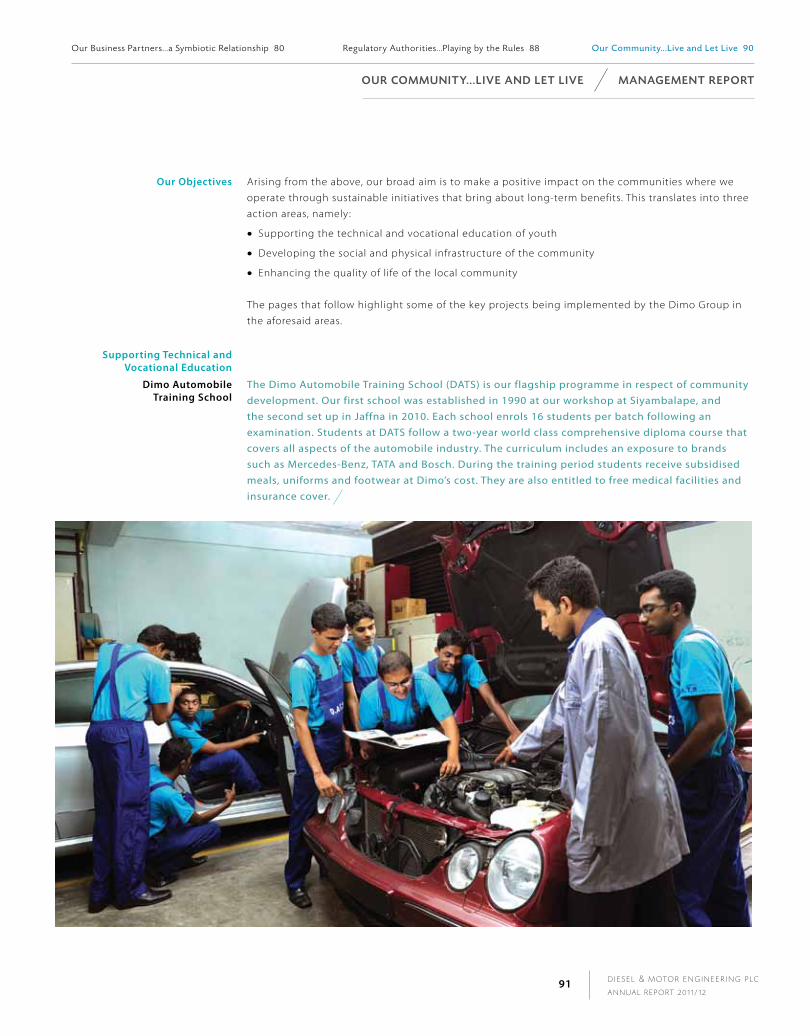
D I E S E L & M OTO R E N G I N E E R I N G P L C
A N N U A L R E P O RT 2 0 1 1 / 1 291
o U R Co M M U n I t Y. . . L I v e A n d L et L I v e M A n AG e M e n t R e P o Rt
Our Objectives Arising from the above, our broad aim is to make a positive impact on the communities where we
operate through sustainable initiatives that bring about long-term benefits. This translates into three
action areas, namely:
Supporting the technical and vocational education of youth
Developing the social and physical infrastructure of the community
Enhancing the quality of life of the local community
The pages that follow highlight some of the key projects being implemented by the Dimo Group in
the aforesaid areas.
Supporting Technical and vocational Education
dimo automobile Training School
The Dimo Automobile Training School (DATS) is our flagship programme in respect of community development. Our first school was established in 1990 at our workshop at Siyambalape, and the second set up in Jaffna in 2010. Each school enrols 16 students per batch following an examination. Students at DATS follow a two-year world class comprehensive diploma course that covers all aspects of the automobile industry. The curriculum includes an exposure to brands such as Mercedes-Benz, TATA and Bosch. During the training period students receive subsidised meals, uniforms and footwear at Dimo’s cost. They are also entitled to free medical facilities and insurance cover.
Our Bus iness Partners . . .a Symbiot ic Relat ionship 80 Regulatory Authorit ies . . .P lay ing by the Rules 88 Our Community. . .L ive and Let L ive 90
D I E S E L & M OTO R E N G I N E E R I N G P L C
A N N U A L R E P O RT 2 0 1 1 / 1 292
The two-year course ends with a competitive examination. The Dimo certificate is well recognised
by the Sri Lankan and overseas engineering community. The DATS programme offers the additional
advantage of giving trainees the opportunity of spending time with our principals in Germany and
being exposed to a high-tech environment. Depending on the availability of vacancies,
DATS diploma holders are offered a position at Dimo. However, there is no obligation to accept such
employment, and they are free to make any other career choice.
Over the years DATS has produced 291 diploma holders, while 53 students are currently undergoing
training. A total of 87 were recruited by the Dimo Group, while the others have found employment in
other establishments in Sri Lanka or are employed in companies overseas.
Expenditure incurred on the two schools during the year 2011/12 totalled Rs. 16.6 mn compared to
Rs. 10.0 mn in the year 2010/11.
vocational Training As a benefit to society Dimo provides students from selected institutions training on motor
mechanism and repairs. As practical knowledge is a requirement for students following diploma and
degree courses as well, they too seek training in our facilities. The duration of these programmes
range from less than one year to four years, as they cater to a wide range of beneficiaries with
differing needs. We provide all such training on a voluntary basis. A total of 168 students were
enrolled during the year 2011/12, while the corresponding figure was 148 in 2010/11.
The following are the institutions that were accommodated during the year under review:
NAITA (National Apprentice & Industrial Training Authority)
Ceylon-German Technical Training Institute
Vocational Training Authority of Sri Lanka
Automobile Engineering Training Institute
Ministry of Vocational & Technical Training
CETRAC (Construction Equipment Training Centre)
Asian Aviation Centre (Pvt) Ltd.
University of Moratuwa
University of Peradeniya
University of Sri Jayewardenepura
University of Kelaniya
The Open University of Sri Lanka
Financia l Value Creat ion 24 Del iver ing Value to Customers . . .and their Value to Us 40 Working at Dimo. . .Enjoyable and Rewarding 62
M A n AG e M e n t R e P o Rt o U R Co M M U n I t Y. . . L I v e A n d L et L I v e
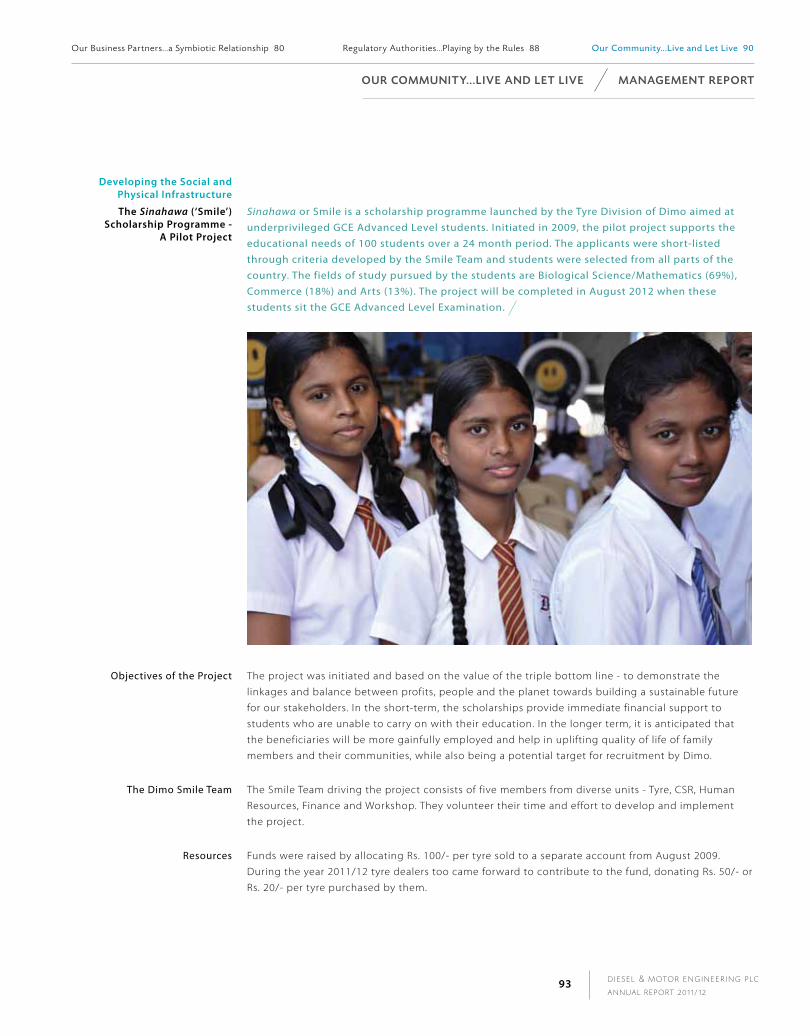
D I E S E L & M OTO R E N G I N E E R I N G P L C
A N N U A L R E P O RT 2 0 1 1 / 1 293
developing the Social and physical infrastructure
The Sinahawa (‘Smile’) Scholarship programme -
a pilot project
Sinahawa or Smile is a scholarship programme launched by the Tyre Division of Dimo aimed at underprivileged GCE Advanced Level students. Initiated in 2009, the pilot project supports the educational needs of 100 students over a 24 month period. The applicants were short-listed through criteria developed by the Smile Team and students were selected from all parts of the country. The fields of study pursued by the students are Biological Science/Mathematics (69%), Commerce (18%) and Arts (13%). The project will be completed in August 2012 when these students sit the GCE Advanced Level Examination.
Objectives of the Project The project was initiated and based on the value of the triple bottom line - to demonstrate the
linkages and balance between profits, people and the planet towards building a sustainable future
for our stakeholders. In the short-term, the scholarships provide immediate financial support to
students who are unable to carry on with their education. In the longer term, it is anticipated that
the beneficiaries will be more gainfully employed and help in uplifting quality of life of family
members and their communities, while also being a potential target for recruitment by Dimo.
The Dimo Smile Team The Smile Team driving the project consists of five members from diverse units - Tyre, CSR, Human
Resources, Finance and Workshop. They volunteer their time and effort to develop and implement
the project.
Resources Funds were raised by allocating Rs. 100/- per tyre sold to a separate account from August 2009.
During the year 2011/12 tyre dealers too came forward to contribute to the fund, donating Rs. 50/- or
Rs. 20/- per tyre purchased by them.
Our Bus iness Partners . . .a Symbiot ic Relat ionship 80 Regulatory Authorit ies . . .P lay ing by the Rules 88 Our Community. . .L ive and Let L ive 90
o U R Co M M U n I t Y. . . L I v e A n d L et L I v e M A n AG e M e n t R e P o Rt

D I E S E L & M OTO R E N G I N E E R I N G P L C
A N N U A L R E P O RT 2 0 1 1 / 1 294
“My team and I do a fair amount of ‘number crunching’ each day to keep our business on course. My take on this ‘course of business’ is not getting ahead of others…but getting ahead of ourselves…challenging and exceeding our own goals.”
ChandEna kOdiTuWakkuGeneral Manager - Finance & Controlling
Project Implementation Initially all employees were educated on the Smile
scholarship programme at the Employees’ Council meeting.
We next created awareness among our tyre dealers and
customers through a poster campaign at our dealer
networks, Dimo branches and display points. Sales teams
extended their support by spreading the word and also
visited rural schools in their areas to distribute application
forms, posters and leaflets.
Expected Outcomes The outcome of the project will be evaluated after the
students complete their examinations and the results are
known. Nevertheless, in the short term we are targeting
a 100% attendance at all six end-of-term examinations
conducted by the respective schools and for all scholarship
students to obtain a minimum 80% average score in
each subject stream. For the longer term we are aiming
for a minimum 80% pass rate at the GCE Advanced Level
Examination in each subject stream with at least 30% of
students being eligible for university admission.
Benefits to Students
Financial support is provided through a grant of
Rs. 1,500/- per month per student over a two-year period.
Non-financial benefits include school bags, books and
stationery, knowledge and skills on career development
and prospects for seeking employment at Dimo.
Financia l Value Creat ion 24 Del iver ing Value to Customers . . .and their Value to Us 40 Working at Dimo. . .Enjoyable and Rewarding 62
M A n AG e M e n t R e P o Rt o U R Co M M U n I t Y. . . L I v e A n d L et L I v e
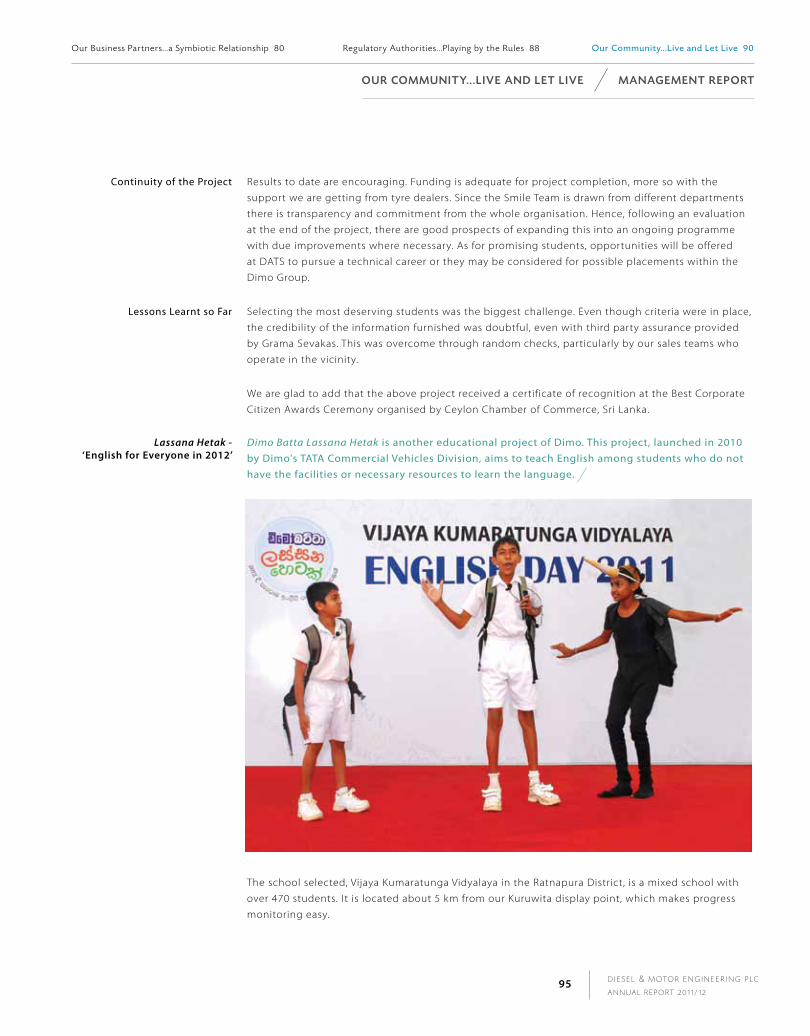
D I E S E L & M OTO R E N G I N E E R I N G P L C
A N N U A L R E P O RT 2 0 1 1 / 1 295
Continuity of the Project Results to date are encouraging. Funding is adequate for project completion, more so with the
support we are getting from tyre dealers. Since the Smile Team is drawn from different departments
there is transparency and commitment from the whole organisation. Hence, following an evaluation
at the end of the project, there are good prospects of expanding this into an ongoing programme
with due improvements where necessary. As for promising students, opportunities will be offered
at DATS to pursue a technical career or they may be considered for possible placements within the
Dimo Group.
Lessons Learnt so Far Selecting the most deserving students was the biggest challenge. Even though criteria were in place,
the credibility of the information furnished was doubtful, even with third party assurance provided
by Grama Sevakas. This was overcome through random checks, particularly by our sales teams who
operate in the vicinity.
We are glad to add that the above project received a certificate of recognition at the Best Corporate
Citizen Awards Ceremony organised by Ceylon Chamber of Commerce, Sri Lanka.
Lassana Hetak - ‘English for Everyone in 2012’
Dimo Batta Lassana Hetak is another educational project of Dimo. This project, launched in 2010 by Dimo's TATA Commercial Vehicles Division, aims to teach English among students who do not have the facilities or necessary resources to learn the language.
The school selected, Vijaya Kumaratunga Vidyalaya in the Ratnapura District, is a mixed school with
over 470 students. It is located about 5 km from our Kuruwita display point, which makes progress
monitoring easy.
Our Bus iness Partners . . .a Symbiot ic Relat ionship 80 Regulatory Authorit ies . . .P lay ing by the Rules 88 Our Community. . .L ive and Let L ive 90
o U R Co M M U n I t Y. . . L I v e A n d L et L I v e M A n AG e M e n t R e P o Rt
D I E S E L & M OTO R E N G I N E E R I N G P L C
A N N U A L R E P O RT 2 0 1 1 / 1 296
Lacking the required expertise to handle this project by ourselves, we enlisted the support of the
British Council, Colombo in this venture. The British Council helped us in (i) conducting a needs
assessment in the school to find out the current standard of English, (ii) selecting and training a
group of teachers for the project, (iii) developing an additional language curriculum for the school,
and (iv) developing the course materials.
The project targets students from Grades 3 to 10. A total of 18 teachers were recruited from the
Ratnapura District, including the two current English language teachers at the school. Following
an aptitude test for both teachers and students, the British Council proceeded with curriculum
development and teacher training. Currently the students follow English classes twice a week after
school hours, which will continue till October 2012.
Objectives of the Project Knowledge of English in both speech and writing is an important requirement in today’s corporate
world. In the short term, our goal is to enable all students of the school to speak English by end
2012. In the longer term, this will open new avenues for the students to better their prospects as well
as those around them, while also having a demonstration effect for other schools to emulate.
Resources A sum of Rs. 500 from every Dimo Batta vehicle sold is allocated to the project fund. In addition,
employees have voluntarily provided labour to refurbish the school.
Project Implementation The Dimo Team created awareness among all employees through presentations at the Employees’
Council meetings as well as through internal branding. The next step was to create awareness among
our customers. Branding was done in all customer contact points (Dimo branches) and the Dimo
Batta product leaflets carried the message. Sales teams extended their support by spreading the
word in their respective areas. The project is managed by the TATA Commercial Vehicles Division with
full support from senior management and employees.
Expected Outcomes The project is ongoing, and its effectiveness will be measured after completion in October 2012.
For the short term, we are targeting a 95% attendance at the English classes. For the longer term, our
goal is to achieve a 100% pass rate at the oral examination to be administered at the end of two years.
Benefits The immediate beneficiaries are the students (as well as some parents who attend these classes) and
the 18 teachers selected for the project. Further, as 16 teachers are from other schools in the district, the
teaching methods learnt are shared with their own schools as well, which leads to a multiplier effect.
Continuity The specially designed training modules have been handed over to the Provincial Education Ministry
for continuing with the project. Teachers from other schools who were trained on the project are
expected to share the knowledge gained in their respective schools. Promising students will be
considered for employment at Dimo later on.
Lessons Learnt so Far We were uncertain about student participation, as many of them attend tuition classes after school
and help parents with their work. So we first ran an awareness creation programme for both students
and parents and explained the pros and cons of the project in detail. Transparency and determining
genuine demand were essential. The response was positive, and so we decided to go ahead - a bold
decision then, now vindicated, with a near 100% attendance at the two-hour English classes that are
held after school twice a week.
Financia l Value Creat ion 24 Del iver ing Value to Customers . . .and their Value to Us 40 Working at Dimo. . .Enjoyable and Rewarding 62
M A n AG e M e n t R e P o Rt o U R Co M M U n I t Y. . . L I v e A n d L et L I v e

D I E S E L & M OTO R E N G I N E E R I N G P L C
A N N U A L R E P O RT 2 0 1 1 / 1 297
dimo Technical institute - Sooriyawewa, hambantota
As part of the Naa Sevena Community Development Project in Sooriyawewa, Dimo is setting up a
state-of-the-art driving and technical training school. The school will also have accommodation
facilities for students and instructors, and a training track. This over Rs. 100 mn facility funded
by Dimo will offer theory and practical education in the driving and operation of passenger and
commercial vehicles, construction and earth moving equipment, material handling and agricultural
machinery as well as their maintenance and repair.
Dimo’s principals will assist in the design, development and delivery of the various training modules,
as our objective is to meet international standards. The Dimo Technical Institute is expected to open
in August 2012.
Enhancing the Quality of life of the local Community
nikaweratiya School development project
This is an ongoing project where we continue to make our own little contribution to a humble
school in Nikaweratiya. During the year we put up window grills for four class rooms and also
provided the children with school bags and books necessary for the new calendar year.
dimo-ndB automobile Service and maintenance
programme
This too is an ongoing programme that Dimo partners with NDB Bank to provide training to youth
in our Ampara and Jaffna branches. The technical training is offered at concessionary rates, and
accommodates 30 trainees at each branch every six months. The curriculum covers automotive
repair and maintenance with a focus on commercial vehicles and tractors. Once trained, they will be
assisted by NDB Bank by way of concessionary personal loans to venture out.
donations and Sponsorships for
Community development
Two Dimo Battas were donated during the year to the Seva Vanitha Army Branch and the Southern
Youth Development Foundation. Regarding the latter, the vehicle will be used to transport disabled
students in Hambantota, and serve as a mobile library during weekends. Dimo staff members have
also donated books for this mobile library.
Dimo also participates in the Divi Neguma Programme, a national countrywide initiative that utilises the community participation methodology. The Dimo Group provided 500 Dimo Batta light trucks at concessionary rates through the Ministry of Economic Development for use in several community development projects.
Our Bus iness Partners . . .a Symbiot ic Relat ionship 80 Regulatory Authorit ies . . .P lay ing by the Rules 88 Our Community. . .L ive and Let L ive 90
o U R Co M M U n I t Y. . . L I v e A n d L et L I v e M A n AG e M e n t R e P o Rt

“You don’t design the person to fit the process…you design the process to fit the person. One of the most criminal errors one can commit is to kill talent to comply with process.”
dilrukShi kurukulaSuriyaGeneral Manager - Human Resources
Dimo was the main sponsor of the Murunkan - Mannar Exhibition
2011 that focused on agriculture, livestock technology and
machinery, a co-sponsor of the East Expo 2011 held in Trincomalee,
the platinum sponsor of the Jaffna Trade Fair 2012 and platinum
sponsor for the Centenary Walk 2012 of the Deaf and Blind School.
Cash donations amounting to Rs. 4 mn to the Jetavanarama
Viharasta Building Fund and Rs. 20 mn to the Brave Hearts Project
of the Seva Vanitha Army Branch were also made during the year
under review.
Career fairs and visits
Dimo continues to actively participate in career fairs organised
by various bodies as well as carries out independent visits
to institutions to meet with prospective candidates. Dimo
participated in the following events during the year under review:
Career fair organised in Colombo by the Women in
Management - Sri Lanka, targeting graduates and
undergraduates
Visit to Dimo by students from the Automobile Engineering
Training Institute - Orugodawatta
Interviews at the Ceylon - German Technical Training Institute -
Moratuwa
Career Fair organised by the University of Sri Jayewardenepura
Batticaloa International Trade Exhibition
Interviews at the Mirijjawila Technical College
Interviews at the Aruppana Technical College
Visit to Dimo by students of the Vocational Training Centre -
Hambantota
Careers Fair organised by the University of Moratuwa - 2011
Careers Fair organised by the District Vocational Training Centre -
Marawila
Financia l Value Creat ion 24 Del iver ing Value to Customers . . .and their Value to Us 40 Working at Dimo. . .Enjoyable and Rewarding 62
M A n AG e M e n t R e P o Rt o U R Co M M U n I t Y. . . L I v e A n d L et L I v e

D I E S E L & M OTO R E N G I N E E R I N G P L C
A N N U A L R E P O RT 2 0 1 1 / 1 299
Corporate Conduct
anti-Corruption Dimo espouses a zero tolerance policy on corruption. Likewise, Dimo does not tolerate ethically
unsound or corrupt practices on the part of our business partners either. The Group’s Code of
Conduct and Ethics contain specific clauses covering a wide range of situations that could arise
when dealing with different types of stakeholders. The Code is understood by employees and they
are required to commit themselves to the principles and policies contained therein.
The Dimo Group maintains vigilance across all its constituents. There were no incidents of corruption
reported during the year under review.
anti-Competitive Behaviour Dimo does not engage in anti-competitive behaviour. No legal action has been instituted against
the Dimo Group regarding this.
public policy We work closely with regulatory and non-regulatory authorities in different sectors to support
them in their development efforts. We also hold memberships in several national and international
associations that play an important thought leadership role concerning the different business sectors
we are engaged in.
No contributions were made to political parties in cash or in kind during the year under review.
donations and Sponsorships Including the projects discussed above, the Dimo Group spent a total of Rs. 51 mn during the year 2011/12 (Rs. 30 mn in 2010/11) on CSR projects and charitable causes countrywide. This represents 1.9% of profit after tax. Some of the funds were matched with voluntary fund rasing by employees. A summary is given below:
Type of Service Amount Rs. %
Science 75,000 0.15
Social Projects 20,211,486 39.59
Culture 4,000,000 7.83
Sports 10,000 0.02
Education 26,748,877 52.39
Other sponsorships 10,000 0.02
Total 51,055,363 100.00
Compliance
Product Responsibility There were no incidents during the year relating to transgression of health and safety, product
labelling, advertising or customer confidentiality.
Environment The Dimo Group has not been fined or penalised for non-compliance with legislation, including
environmental regulations in force. All legal requirements have been complied with.
Society As a responsible corporate citizen the Dimo Group conforms strictly with all applicable laws,
regulations and local customs in the conduct of its business. It has not been subject to any penalties
or warnings resulting from any breaches thereof.
Our Bus iness Partners . . .a Symbiot ic Relat ionship 80 Regulatory Authorit ies . . .P lay ing by the Rules 88 Our Community. . .L ive and Let L ive 90
o U R Co M M U n I t Y. . . L I v e A n d L et L I v e M A n AG e M e n t R e P o Rt

D I E S E L & M OTO R E N G I N E E R I N G P L C
A N N U A L R E P O RT 2 0 1 1 / 1 2100
M A n AG e M e n t R e P o Rt t h e e n v I Ro n M e n t . . . N OW A N D F O R G E N E R AT I O N S Y E T U N B O R N
management approach QUALITY and ENVIRONMENT POLICY
“We at Dimo are committed to:
Continuously improving our systems and processes
Total customer satisfaction
Develop human resources
Conservation of resources
Reducing waste
Compliance with legal, statutory and principals’ requirements.
We employ an integrated approach towards quality and environmental management at every stage
of our business processes. Group Management Committee and the Sustainability Committee ensure
that Group guidelines and policies are adhered to and practised. In addition, senior management
staff have specific responsibility for managing environmental as well as occupational health and
safety issues related to their respective business units.
Our systems and processes are continuously reviewed, and revised as appropriate. Significant risk
factors are identified and managed closely. The Environmental Management System (EMS) enables
us to measure and monitor the impact of our operations on the environment, which in turn leads to
suitable mitigation measures being put in place.
Our EMS is guided by the Triple R concept: reduce, reuse and recycle. Dimo obtained the ISO 14001
certification in 2005. Our Environmental Management System is accredited with ISO 14001 (2004),
which is a leading global standard for managing environmental issues.
Noise Management
Six Strategic
Areas
Management of Atmospheric Emissions
and Climate Change
Water Management
Waste Management
Materials Management
Energy and Fuel Management
1
2
3
4
5
6
Regulatory Authorit ies . . .P lay ing by the Rules 88 Our Community. . .L ive and Let L ive 90 The Environment. . .Now and for Generat ions Yet Unborn 100
D I E S E L & M OTO R E N G I N E E R I N G P L C
A N N U A L R E P O RT 2 0 1 1 / 1 2101
Six strategic areas have been identified for active environmental management, namely:
(i) management of atmospheric emissions and climate change, (ii) energy and fuel management, (iii) water management, (iv) waste management, (v) materials management, and (vi) noise management. These are translated into action through the respective business units as well as
through four Go Green Teams that are made up of members drawn from the Dimo Group. The four
Go Green Teams are:
Green Team 1: Flood Prevention. To prevent flooding by ensuring that drainage systems are in
place and they are regularly maintained
Green Team 2: Electricity Conservation. To identify electricity consumption of all key locations and
eliminate waste or unproductive use
Green Team 3: Waste Management. To minimise land contamination due to garbage generated by
the Group
Green Team 4: Water Conservation. To minimise water wastage as a result of unproductive
consumption by processes and employees
In addition, the Dimo Nature Club was set up during the year as a voluntary initiative for protecting
the environment. It is open to all members of the Dimo Group. The Club aims to undertake projects
that will address both internal and external environmental concerns. Two meetings were convened
during the year to plan the Club's agenda and operating mechanism for the period ahead.
Stakeholder Expectations As reported last year, we continue to be guided by the results of an independent third party
assessment of stakeholder expectations on environmental issues. They are summarised in the table
appearing on pages 8 to 9 including the actions that we have already taken or are planning to take.
atmospheric Emissions and Climate Change
Carbon footprint Among our several initiatives towards environmental protection, the mitigation of climate change
is one of high priority. Measuring and managing our direct and indirect greenhouse gas (GHG)
emissions, or carbon footprint, is one such initiative, now in its fourth consecutive year.
The table on page 102 gives a breakdown of our carbon footprint over the last three financial years,
measured using the WBCSD/WRI Greenhouse Gas Protocol’s Corporate Standard (revised edition).
The organisational boundary comprises the Dimo Group, i.e., Dimo and its subsidiaries including
operations in all parts of the country. Reporting is under Scopes 1 and 2, together with some aspects
of the optional Scope 3 based on data availability.
t h e e n v I Ro n M e n t. . . n oW A n d F o R G e n e R At I o n S Y et U n B o R n M A n AG e M e n t R e P o Rt
Susta inabi l i ty Performance Object ives . . . In 2011/12 112 Enterpr ise Governance 116 Risk Management 128

D I E S E L & M OTO R E N G I N E E R I N G P L C
A N N U A L R E P O RT 2 0 1 1 / 1 2102
ghg Emissions by Source
Emission Source 2011/12 2010/11 2009/10
Units Consumption EmissionstCO2e
Consumption EmissionstCO2e
Consumption EmissionstCO2e
Scope 1
Diesel for generators litre 3,389 8.96 8,192 22.03 3,088 8.16
Diesel for vehicles litre 471,923 1,247.43 447,996 1,196.15 361,359 955.18
Petrol for vehicles litre 378,114 872.20 243,992 568.50 192,214 443.38
Diesel for vehicle delivery to customer and service processes litre 1,030,789 2,724.68 – – – –
Petrol for vehicle delivery to customer and service processes litre 40,298 92.96 – – – –
LPG kg 7,138 15.55 8,550 18.81 8,550 22.92
Scope 2
Purchased electricity kWh 2,227,384 1,514.62 1,890,897 1,285.82 1,630,474 1,108.72
Scope 3
International air travel km 119.29 1,066,602 100.99 791,596 66.24
Fuel utilized by outsourced party - Diesel litre 62,889 167.91 – – – –
Fuel utilized by outsourced party - Petrol litre 6,804 15.85 – – – –
Total tCO2e 6,779.45 3,192.30 2,604.60
It will be seen that direct GHG emissions from diesel for vehicles and vehicle delivery and service
processes amounted to 3,972 tCO2e. At 59% of the total, this was the single largest contributor to our
carbon footprint during the year (37% in the previous year). This increase was largely due to extending
our calculation to include delivery of vehicles to customers, service processes and company vehicles.
During the year under review our total GHG emissions increased by 3,587 tonnes carbon dioxide
equivalent (tCO2e). The increase was primarily due to capacity expansion and business growth as well the
inclusion of new categories of indirect emissions that were not measured earlier.
When compared against an activity level, our GHG emissions during the year 2011/12 increased to 0.1674
tCO2e per Rs. 1 mn of Group net turnover, compared to the 0.1064 tCO2e per Rs. 1 mn in the previous
year. This increase is largely due to direct GHG emission from diesel as discussed above.
Further, as can be seen in the above table, the current year figures include fuel consumed for product
delivery operations by an outsourced party. This is an optional item coming under Scope 3 that was not
measured in previous years. It accounted for an additional 183 tCO2e in the current year (3% of the total).
As a pioneer in reporting our carbon footprint in the country, we will continue to refine and expand our
scope of reporting in the years to come.
M A n AG e M e n t R e P o Rt t h e e n v I Ro n M e n t. . . n oW A n d F o R G e n e R At I o n S Y et U n B o R n
Regulatory Authorit ies . . .P lay ing by the Rules 88 Our Community. . .L ive and Let L ive 90 The Environment. . .Now and for Generat ions Yet Unborn 100

“Too many of us are afraid to be ourselves…we give up too easily on our dreams…we are too ready to ‘follow the herd’. We need to get ‘outrageously energetic and madly alive’ in fashioning a life of true fulfilment.”
ananda mapalagamaGeneral Manager - Auto Components, Power Tools and Outdoor Equipment
management of atmospheric
Emissions
All Dimo Group and rented vehicles are subject to emission
tests for compliance with national standards. Going further, our
vehicles are also required to comply with our own standards
which are more stringent than national standards.
Exhaust gas and dust extractors are installed in vulnerable
locations to deal with emissions typically emanating from engine
testing and the cleaning of air filters and brake assemblies.
Paint booths are equipped with filteration systems to prevent
the release of toxic fumes and particles into the atmosphere.
A fresh air validation system was installed in the Repair Business
Unit to monitor temperature, humidity and CO2 levels.
To curb indirect GHG emissions from air travel, alternative
approaches such as tele and video conferencing are used
where appropriate.
Dimo’s activities do not result in the emission of ozone depleting
substances. CFC-free gases are used for air conditioning
(buildings and vehicles), and they are captured in specialised
equipment and recycled when units are serviced.
Monitoring is done annually for compliance with tolerance levels
stipulated by the Central Environmental Authority.
t h e e n v I Ro n M e n t. . . n oW A n d F o R G e n e R At I o n S Y et U n B o R n M A n AG e M e n t R e P o Rt
Susta inabi l i ty Performance Object ives . . . In 2011/12 112 Enterpr ise Governance 116 Risk Management 128

D I E S E L & M OTO R E N G I N E E R I N G P L C
A N N U A L R E P O RT 2 0 1 1 / 1 2104
dimo’s Emissions vs Tolerance levels
Emission type SPM SO2 NO2 CO2
Tolerance level 0.35 mg/m3 0.12 mg/m3 0.15 mg/m3 9 ppm
Location 2011/12 2010/11 2009/10 2011/12 2010/11 2009/10 2011/12 2010/11 2009/10 2011/12 2010/11 2009/10
Colombo - 1 0.06 0.04 0.10 0.04 0.02 0.01 0.10 0.03 0.01 4.4 4.20 1.0
Colombo - 2 0.05 0.04 0.12 0.03 0.02 0.01 0.06 0.03 0.01 4.2 3.80 1.0
Anuradhapura 0.06 0.03 0.08 0.01 0.01 0.01 0.01 0.02 0.01 3.2 3.10 1.0
Siyambalape 0.04 0.03 0.10 0.05 0.02 0.01 0.05 0.03 0.01 4.6 2.80 1.0
Kurunegala 0.06 0.03 0.05 0.02 0.01 0.01 0.02 0.02 0.01 3 2.50 1.0
Matara 0.06 – – 0.01 – – 0.02 – – 2.6 – –
Weliweriya 0.06 – – 0.03 – – 0.07 – – 3 – –
Kandy 0.07 – – 0.04 – – 0.04 – – 3.2 – –
Ratnapura 0.02 – – 0.02 – – 0.04 – – 2.6 – –
Energy and fuel management The Dimo Group’s main sources of energy are purchased electricity, diesel, petrol and liquefied
petroleum gas (LPG), the last three fuels being used mainly in company vehicles. The bulk of our
electricity is purchased from the national grid (Ceylon Electricity Board) while a relatively small
amount is self-generated through in house generator sets when required. Likewise, a relatively small
quantity of LPG is also used in our staff cafeteria and workshops.
Details of energy consumption over the last four years are given in the section on Carbon Footprint
discussed previously.
Source Units Consumption
2011/12 2010/11 2009/10
Diesel for Vehicles* MJ 55,858,112 16,857,448 13,597,460
Diesel for Generators* MJ 81,654 310,507 169,329
Petrol for Vehicles* MJ 13,834,681 8,067,539 6,355,506
LP Gas* MJ 328,732 220,521 220,521
Electricity** MJ 8,081,582 6,807,229 5,868,162
78,184,761 32,263244 26,210,978
* Direct Energy Consumption **Indirect Energy Consumption
The energy consumption increased due to high volume of diesel consumption for vehicles delivered
to customers, which represents 71% (2010/11 - 52%) from total energy consumption.
M A n AG e M e n t R e P o Rt t h e e n v I Ro n M e n t. . . n oW A n d F o R G e n e R At I o n S Y et U n B o R n
Regulatory Authorit ies . . .P lay ing by the Rules 88 Our Community. . .L ive and Let L ive 90 The Environment. . .Now and for Generat ions Yet Unborn 100

D I E S E L & M OTO R E N G I N E E R I N G P L C
A N N U A L R E P O RT 2 0 1 1 / 1 2105
Energy audit As a certified Company for energy diagnosis and audit (accredited by the Sri Lanka Sustainable
Energy Authority), Dimo conducts both in-house as well as external energy audits as an ongoing
exercise. The latter is conducted as an energy management consultancy service. During the
year we conducted five external energy audits for clients, leading to the implementation of our
recommendations for improving energy efficiency and conservation.
The energy saved as a result of implementing the recommendations arising from these audits are
estimated at 400,000 kWh per annum (632,019 kWh per annum in 2010/11).
t h e e n v I Ro n M e n t. . . n oW A n d F o R G e n e R At I o n S Y et U n B o R n M A n AG e M e n t R e P o Rt
Susta inabi l i ty Performance Object ives . . . In 2011/12 112 Enterpr ise Governance 116 Risk Management 128

D I E S E L & M OTO R E N G I N E E R I N G P L C
A N N U A L R E P O RT 2 0 1 1 / 1 2106
Energy Efficiency and Conservation
Internal energy audits are carried out regularly throughout the Dimo Group, and these serve to
highlight areas for minimising waste as well as improving energy efficiency. Measures include the use
of capacitor banks for power factor correction, replacement of incandescent light bulbs with energy
saving CFL bulbs and LED lighting technologies, programming computers to revert to standby mode
within five minutes of idling, setting thermostats of air conditioning systems to 24oC for optimum
comfort, and developing a culture of ‘switching off ’ lights and appliances when not in use.
New constructions make maximum use of natural light and adopt energy efficient building codes.
Dimo is also considering investments in renewable energy technologies for power generation.
Energy Efficient products
In addition to practising energy efficiency and conservation internally, the Dimo Group is also
mindful of applying the same principles to the products that it markets.
In the vehicles sector, the Dimo Batta light truck and the newly introduced TATA Nano subcompact
passenger car are excellent examples of fuel efficiency. The same could be said even in the luxury
range, exemplified by Mercedes-Benz’s Blue Efficiency technology. Our Lighting Division markets the
energy efficient Osram CFLs that are gaining acceptance and popularity in the local market.
Water management
The national supply is our main source of water. Ground water is also tapped in some of our locations, while rainwater harvesting is being introduced where feasible. Water is mainly used for vehicle repairs and servicing as for well as for domestic purposes.
Description Water usage (m3) Reused water (m3) Reused percentage
2011/12 2010/11 2009/10 2011/12 2010/11 2009/10 2011/12 2010/11 2009/10
Municipal Water 42,329 28,479 25,666 – – – – – –
Ground Water 33,151 17,929 15,897 4,863 4,281 3,991 15% 24% 25%
Rain Water Harvesting 160 – – – – – – – –
Total 75,640 46,408 41,563 4,863 4,281 3,991 6% 10% 10%
Total Water Consumed and recycled and reused
The above table shows the volume of water consumed from these three sources and the amount
reused. It will be seen that 6% (10% in 2010/11) of the total water consumption was reused during
the year under review. All water that is released to the environment is subject to treatment,
recycle and monitoring on a continuous basis.
M A n AG e M e n t R e P o Rt t h e e n v I Ro n M e n t. . . n oW A n d F o R G e n e R At I o n S Y et U n B o R n
Regulatory Authorit ies . . .P lay ing by the Rules 88 Our Community. . .L ive and Let L ive 90 The Environment. . .Now and for Generat ions Yet Unborn 100
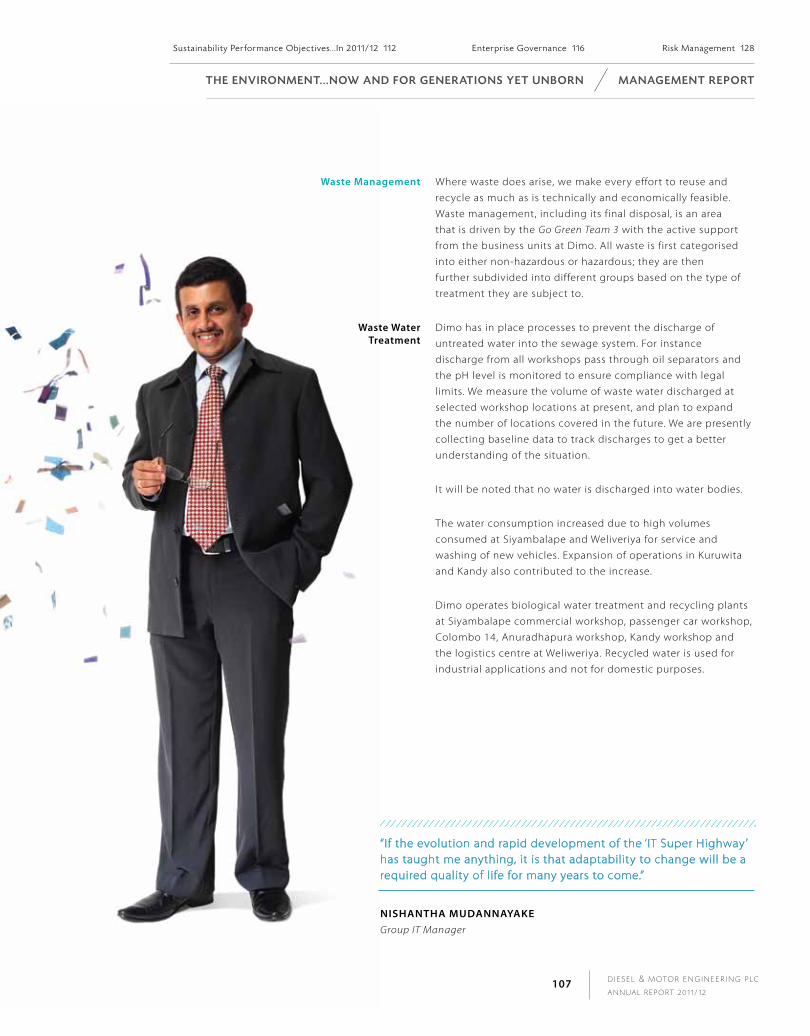
D I E S E L & M OTO R E N G I N E E R I N G P L C
A N N U A L R E P O RT 2 0 1 1 / 1 2107
Waste management Where waste does arise, we make every effort to reuse and
recycle as much as is technically and economically feasible.
Waste management, including its final disposal, is an area
that is driven by the Go Green Team 3 with the active support
from the business units at Dimo. All waste is first categorised
into either non-hazardous or hazardous; they are then
further subdivided into different groups based on the type of
treatment they are subject to.
Waste Water Treatment
Dimo has in place processes to prevent the discharge of
untreated water into the sewage system. For instance
discharge from all workshops pass through oil separators and
the pH level is monitored to ensure compliance with legal
limits. We measure the volume of waste water discharged at
selected workshop locations at present, and plan to expand
the number of locations covered in the future. We are presently
collecting baseline data to track discharges to get a better
understanding of the situation.
It will be noted that no water is discharged into water bodies.
The water consumption increased due to high volumes
consumed at Siyambalape and Weliveriya for service and
washing of new vehicles. Expansion of operations in Kuruwita
and Kandy also contributed to the increase.
Dimo operates biological water treatment and recycling plants
at Siyambalape commercial workshop, passenger car workshop,
Colombo 14, Anuradhapura workshop, Kandy workshop and
the logistics centre at Weliweriya. Recycled water is used for
industrial applications and not for domestic purposes.
“If the evolution and rapid development of the ‘IT Super Highway’ has taught me anything, it is that adaptability to change will be a required quality of life for many years to come.”
niShanTha mudannayakEGroup IT Manager
t h e e n v I Ro n M e n t. . . n oW A n d F o R G e n e R At I o n S Y et U n B o R n M A n AG e M e n t R e P o Rt
Susta inabi l i ty Performance Object ives . . . In 2011/12 112 Enterpr ise Governance 116 Risk Management 128

D I E S E L & M OTO R E N G I N E E R I N G P L C
A N N U A L R E P O RT 2 0 1 1 / 1 2108
non-hazardous Solid Waste management
We have an established system to segregate non-hazardous solid waste into organic, paper,
polythene and plastic under the Go Green Project. Colour coded bins are provided in dining areas
to segregate food from wrapping materials, as waste food is given to a third party for use as animal
feed. As the Local Authorities are not yet equipped to handle segregated waste, we have found our
own solutions. During the year we signed an MOU with a Central Environmental Authority-accredited
third party - Holcim Geocycle - to provide a total waste management solution for our hazardous and
non-hazardous waste.
The table below gives statistics on our non-hazardous solid waste management.
Waste Category Quantity, Kg
2011/12 2010/11 Method of Disposal
Organic 48,033 – To third party as animal feed
Paper - A4 621 31,210
Contaminated paper 5,390 –
Cardboard boxes 2,576 4,719 To third party for recycling
Polythene 2,577 987 To third party for recycling
Plastic 1,062 1,043 Collected as garbage by Local Authority
Pallet racks 5,730 – To third party for recycling
hazardous Waste management
Chemical spillages at our workshops are virtually non-existent. In the event they do, we have well
documented rules and guidelines in place to respond. Employees are regularly trained on safe
practices and the proper handling of materials. Suitable equipment is in place in the event of an
accident, such as oil suckers to clean up a spillage. Waste is handed over to authorised third parties
for recycling (e.g. lead in batteries), reuse (e.g. tyre retreading) or safe disposal.
M A n AG e M e n t R e P o Rt t h e e n v I Ro n M e n t. . . n oW A n d F o R G e n e R At I o n S Y et U n B o R n
Regulatory Authorit ies . . .P lay ing by the Rules 88 Our Community. . .L ive and Let L ive 90 The Environment. . .Now and for Generat ions Yet Unborn 100
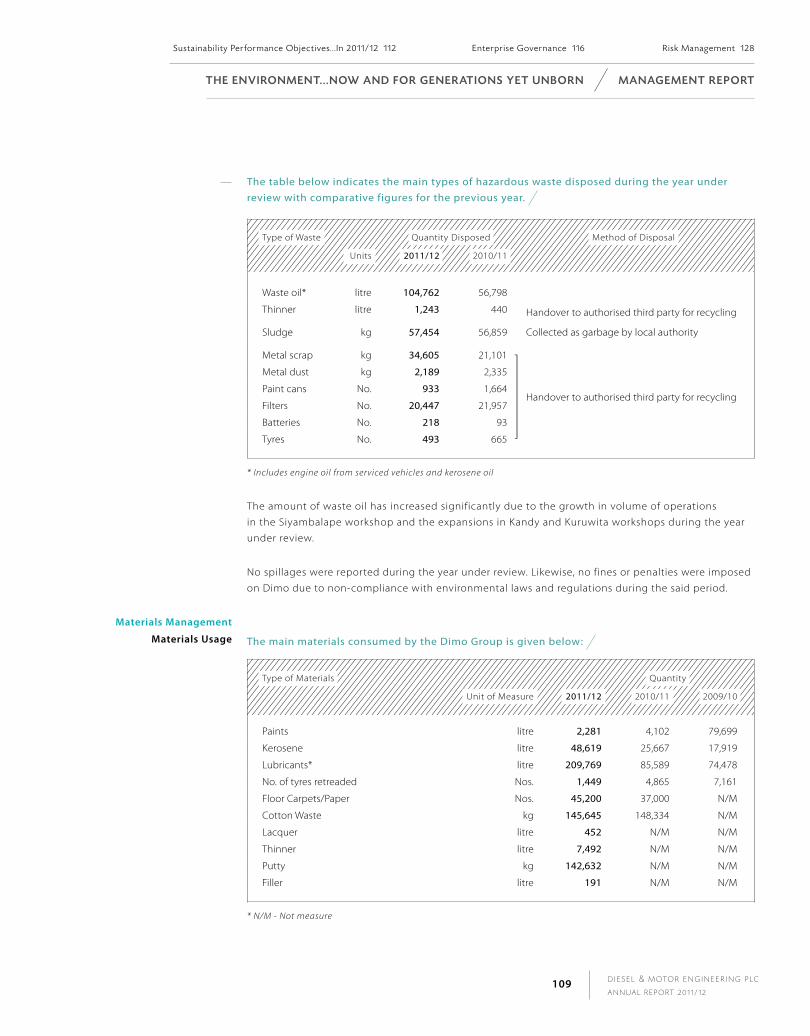
D I E S E L & M OTO R E N G I N E E R I N G P L C
A N N U A L R E P O RT 2 0 1 1 / 1 2109
The table below indicates the main types of hazardous waste disposed during the year under review with comparative figures for the previous year.
Type of Waste Quantity Disposed Method of Disposal
Units 2011/12 2010/11
Waste oil* litre 104,762 56,798
Handover to authorised third party for recycling Thinner litre 1,243 440
Sludge kg 57,454 56,859 Collected as garbage by local authority
Metal scrap kg 34,605 21,101
Handover to authorised third party for recycling
Metal dust kg 2,189 2,335
Paint cans No. 933 1,664
Filters No. 20,447 21,957
Batteries No. 218 93
Tyres No. 493 665
* Includes engine oil from serviced vehicles and kerosene oil
The amount of waste oil has increased significantly due to the growth in volume of operations
in the Siyambalape workshop and the expansions in Kandy and Kuruwita workshops during the year
under review.
No spillages were reported during the year under review. Likewise, no fines or penalties were imposed
on Dimo due to non-compliance with environmental laws and regulations during the said period.
materials management
materials usage The main materials consumed by the Dimo Group is given below:
Type of Materials Quantity
Unit of Measure 2011/12 2010/11 2009/10
Paints litre 2,281 4,102 79,699
Kerosene litre 48,619 25,667 17,919
Lubricants* litre 209,769 85,589 74,478
No. of tyres retreaded Nos. 1,449 4,865 7,161
Floor Carpets/Paper Nos. 45,200 37,000 N/M
Cotton Waste kg 145,645 148,334 N/M
Lacquer litre 452 N/M N/M
Thinner litre 7,492 N/M N/M
Putty kg 142,632 N/M N/M
Filler litre 191 N/M N/M
* N/M - Not measure
t h e e n v I Ro n M e n t. . . n oW A n d F o R G e n e R At I o n S Y et U n B o R n M A n AG e M e n t R e P o Rt
Susta inabi l i ty Performance Object ives . . . In 2011/12 112 Enterpr ise Governance 116 Risk Management 128

D I E S E L & M OTO R E N G I N E E R I N G P L C
A N N U A L R E P O RT 2 0 1 1 / 1 2110
Kerosene oil consumption showed an increase in the year under review as the data capturing
mechanism was extended to TATA passenger workshop in Colombo. This data was not available in the
previous reporting period. The expansions in Kandy and Kuruwita workshops too have contributed to
this increase in consumption. Consumption of lubricants has drastically increased by 70% due to high
usage in Siyambalape and regional workshops located in Kandy, Kuruwita, Matara and Kurunegala.
Data relating to TATA passenger car workshop and Bosch Diesel Centre were also taken into account.
recycling and reuse
reusing kerosene Oil
Kerosene oil is used as a solvent to clean or degrease components or assemblies before they
are dismantled for repairs. Dimo operates a kerosene oil recycling process in the Colombo and
Siyambalape workshops where once-used oil is collected and filtered for a second and possible third
use where permissible. Such reuse reduces kerosene consumption by about 28%. Used kerosene and
sludge are disposed of in an environmentally accepted manner through a third party.
retreading Tyres We retread used but undamaged tyres for subsequent use in the secondary market, while we also
collect damaged tyres for a third party. During the year under review we retreaded 1,449 tyres
(4,865 in the previous year).
disposal of Office Equipment and Components (E-waste)
Used computer equipment, accessories and consumables are sent to authorised third parties for
reuse, recycling or safe disposal.
Items 2011/12 2010/11 Method of Disposal
CPUs/UPSs 22 3Handedover to authorised
third party for recycling/
reuse
Laptop 7 1Monitors 18 5Printers 14 1Toners/Cartridges 97 202
paper management Dimo’s long-term goal is to create a paperless environment. In the meantime we continue to take
steps to reduce our consumption of paper, particularly for internal communications and information
sharing, through the use of emails, intranet and the web. We conduct regular awareness programmes
for all staff on this aspect, thus making them think twice before printing any document or message.
Paper consumption by the Dimo Group is given below:
Type of Paper Consumed Consumption, kg Consumption per Average Number of Employees, kg/emp.
2011/12 2010/11 2011/12 2010/11
A4, A3 16,698 14,126 14.16 15.00
M A n AG e M e n t R e P o Rt t h e e n v I Ro n M e n t. . . n oW A n d F o R G e n e R At I o n S Y et U n B o R n
Regulatory Authorit ies . . .P lay ing by the Rules 88 Our Community. . .L ive and Let L ive 90 The Environment. . .Now and for Generat ions Yet Unborn 100
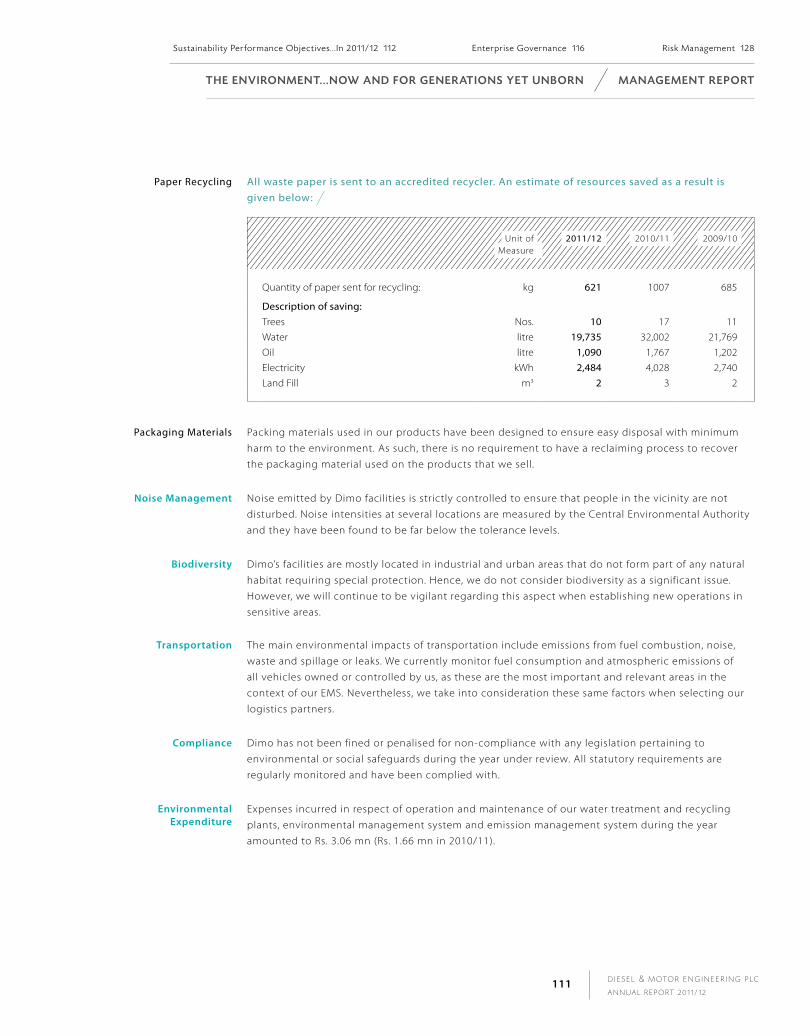
D I E S E L & M OTO R E N G I N E E R I N G P L C
A N N U A L R E P O RT 2 0 1 1 / 1 2111
Paper Recycling All waste paper is sent to an accredited recycler. An estimate of resources saved as a result is given below:
Unit of Measure
2011/12 2010/11 2009/10
Quantity of paper sent for recycling: kg 621 1007 685
Description of saving:Trees Nos. 10 17 11Water litre 19,735 32,002 21,769Oil litre 1,090 1,767 1,202Electricity kWh 2,484 4,028 2,740Land Fill m3 2 3 2
Packaging Materials Packing materials used in our products have been designed to ensure easy disposal with minimum
harm to the environment. As such, there is no requirement to have a reclaiming process to recover
the packaging material used on the products that we sell.
noise management Noise emitted by Dimo facilities is strictly controlled to ensure that people in the vicinity are not
disturbed. Noise intensities at several locations are measured by the Central Environmental Authority
and they have been found to be far below the tolerance levels.
Biodiversity Dimo’s facilities are mostly located in industrial and urban areas that do not form part of any natural
habitat requiring special protection. Hence, we do not consider biodiversity as a significant issue.
However, we will continue to be vigilant regarding this aspect when establishing new operations in
sensitive areas.
Transportation The main environmental impacts of transportation include emissions from fuel combustion, noise,
waste and spillage or leaks. We currently monitor fuel consumption and atmospheric emissions of
all vehicles owned or controlled by us, as these are the most important and relevant areas in the
context of our EMS. Nevertheless, we take into consideration these same factors when selecting our
logistics partners.
Compliance Dimo has not been fined or penalised for non-compliance with any legislation pertaining to
environmental or social safeguards during the year under review. All statutory requirements are
regularly monitored and have been complied with.
Environmental Expenditure
Expenses incurred in respect of operation and maintenance of our water treatment and recycling
plants, environmental management system and emission management system during the year
amounted to Rs. 3.06 mn (Rs. 1.66 mn in 2010/11).
t h e e n v I Ro n M e n t. . . n oW A n d F o R G e n e R At I o n S Y et U n B o R n M A n AG e M e n t R e P o Rt
Susta inabi l i ty Performance Object ives . . . In 2011/12 112 Enterpr ise Governance 116 Risk Management 128
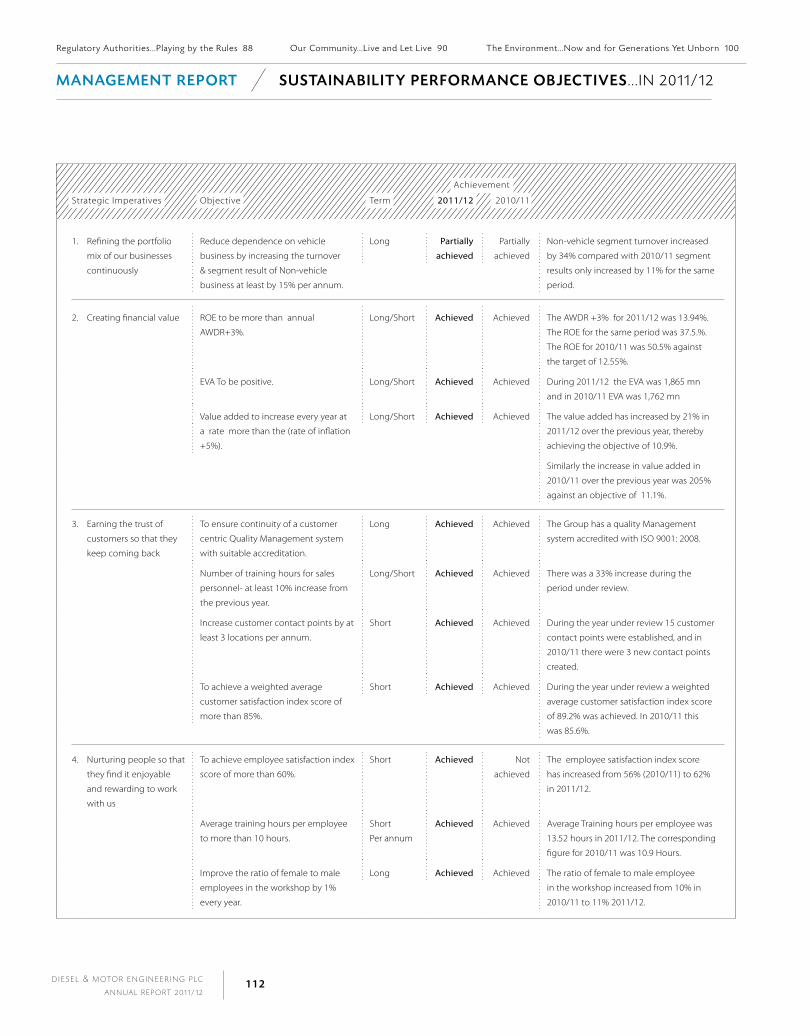
D I E S E L & M OTO R E N G I N E E R I N G P L C
A N N U A L R E P O RT 2 0 1 1 / 1 2112
M A n AG e M e n t R e P o Rt S U StA I n A B I L I t Y P e R F o R M A n C e o B J eC t I v e S . . . I N 2 0 1 1 / 1 2
Achievement
Strategic Imperatives Objective Term 2011/12 2010/11
1. Refining the portfolio
mix of our businesses
continuously
Reduce dependence on vehicle
business by increasing the turnover
& segment result of Non-vehicle
business at least by 15% per annum.
Long Partially
achieved
Partially
achieved
Non-vehicle segment turnover increased
by 34% compared with 2010/11 segment
results only increased by 11% for the same
period.
2. Creating financial value ROE to be more than annual
AWDR+3%.
Long/Short Achieved Achieved The AWDR +3% for 2011/12 was 13.94%.
The ROE for the same period was 37.5.%.
The ROE for 2010/11 was 50.5% against
the target of 12.55%.
EVA To be positive. Long/Short Achieved Achieved During 2011/12 the EVA was 1,865 mn
and in 2010/11 EVA was 1,762 mn
Value added to increase every year at
a rate more than the (rate of inflation
+5%).
Long/Short Achieved Achieved The value added has increased by 21% in
2011/12 over the previous year, thereby
achieving the objective of 10.9%.
Similarly the increase in value added in
2010/11 over the previous year was 205%
against an objective of 11.1%.
3. Earning the trust of
customers so that they
keep coming back
To ensure continuity of a customer
centric Quality Management system
with suitable accreditation.
Long Achieved Achieved The Group has a quality Management
system accredited with ISO 9001: 2008.
Number of training hours for sales
personnel- at least 10% increase from
the previous year.
Long/Short Achieved Achieved There was a 33% increase during the
period under review.
Increase customer contact points by at
least 3 locations per annum.
Short Achieved Achieved During the year under review 15 customer
contact points were established, and in
2010/11 there were 3 new contact points
created.
To achieve a weighted average
customer satisfaction index score of
more than 85%.
Short Achieved Achieved During the year under review a weighted
average customer satisfaction index score
of 89.2% was achieved. In 2010/11 this
was 85.6%.
4. Nurturing people so that
they find it enjoyable
and rewarding to work
with us
To achieve employee satisfaction index
score of more than 60%.
Short Achieved Not
achieved
The employee satisfaction index score
has increased from 56% (2010/11) to 62%
in 2011/12.
Average training hours per employee
to more than 10 hours.
Short
Per annum
Achieved Achieved Average Training hours per employee was
13.52 hours in 2011/12. The corresponding
figure for 2010/11 was 10.9 Hours.
Improve the ratio of female to male
employees in the workshop by 1%
every year.
Long Achieved Achieved The ratio of female to male employee
in the workshop increased from 10% in
2010/11 to 11% 2011/12.
Regulatory Authorit ies . . .P lay ing by the Rules 88 Our Community. . .L ive and Let L ive 90 The Environment . . .Now and for Generat ions Yet Unborn 100
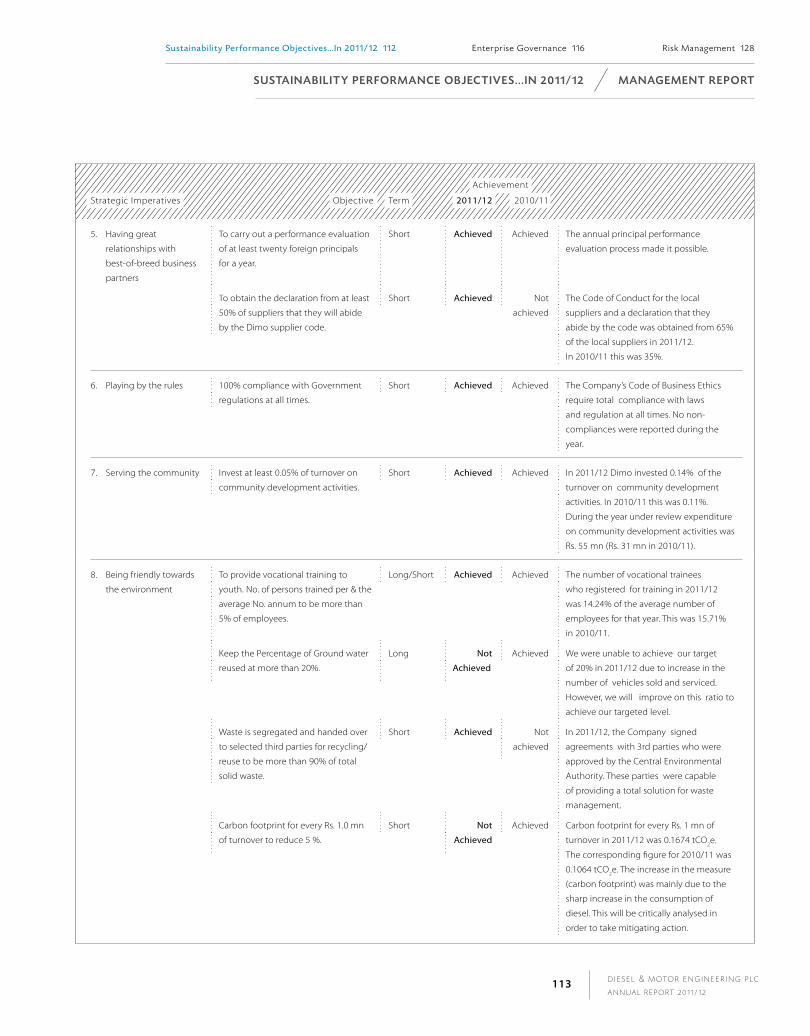
D I E S E L & M OTO R E N G I N E E R I N G P L C
A N N U A L R E P O RT 2 0 1 1 / 1 2113
Achievement
Strategic Imperatives Objective Term 2011/12 2010/11
5. Having great
relationships with
best-of-breed business
partners
To carry out a performance evaluation
of at least twenty foreign principals
for a year.
Short Achieved Achieved The annual principal performance
evaluation process made it possible.
To obtain the declaration from at least
50% of suppliers that they will abide
by the Dimo supplier code.
Short Achieved Not
achieved
The Code of Conduct for the local
suppliers and a declaration that they
abide by the code was obtained from 65%
of the local suppliers in 2011/12.
In 2010/11 this was 35%.
6. Playing by the rules 100% compliance with Government
regulations at all times.
Short Achieved Achieved The Company’s Code of Business Ethics
require total compliance with laws
and regulation at all times. No non-
compliances were reported during the
year.
7. Serving the community Invest at least 0.05% of turnover on
community development activities.
Short Achieved Achieved In 2011/12 Dimo invested 0.14% of the
turnover on community development
activities. In 2010/11 this was 0.11%.
During the year under review expenditure
on community development activities was
Rs. 55 mn (Rs. 31 mn in 2010/11).
8. Being friendly towards
the environment
To provide vocational training to
youth. No. of persons trained per & the
average No. annum to be more than
5% of employees.
Long/Short Achieved Achieved The number of vocational trainees
who registered for training in 2011/12
was 14.24% of the average number of
employees for that year. This was 15.71%
in 2010/11.
Keep the Percentage of Ground water
reused at more than 20%.
Long Not
Achieved
Achieved We were unable to achieve our target
of 20% in 2011/12 due to increase in the
number of vehicles sold and serviced.
However, we will improve on this ratio to
achieve our targeted level.
Waste is segregated and handed over
to selected third parties for recycling/
reuse to be more than 90% of total
solid waste.
Short Achieved Not
achieved
In 2011/12, the Company signed
agreements with 3rd parties who were
approved by the Central Environmental
Authority. These parties were capable
of providing a total solution for waste
management.
Carbon footprint for every Rs. 1.0 mn
of turnover to reduce 5 %.
Short Not
Achieved
Achieved Carbon footprint for every Rs. 1 mn of
turnover in 2011/12 was 0.1674 tCO2e.
The corresponding figure for 2010/11 was
0.1064 tCO2e. The increase in the measure
(carbon footprint) was mainly due to the
sharp increase in the consumption of
diesel. This will be critically analysed in
order to take mitigating action.
S U StA I n A B I L I t Y P e R F o R M A n C e o B J eC t I v e S . . . I n 2 0 1 1 / 1 2 M A n AG e M e n t R e P o Rt
Sustainabi l i ty Performance Object ives . . . In 2011/12 112 Enterpr ise Governance 116 Risk Management 128
D I E S E L & M OTO R E N G I N E E R I N G P L C
A N N U A L R E P O RT 2 0 1 1 / 1 2114
Topics Page
Enterprise Governance 116
Risk Management 128
Chairman/Managing Director and
Chief Financial Officer’s Responsibility Statement 141
Report of the Audit Committee 142
The Remuneration Committee Report 144
Report of the Nomination Committee 145
STEWardShipThis section is presented based on statutory requirements as well as best
practices. It does not spare detail but is presented in a manner that makes
reference easy.

D I E S E L & M OTO R E N G I N E E R I N G P L C
A N N U A L R E P O RT 2 0 1 1 / 1 2115
D I E S E L & M OTO R E N G I N E E R I N G P L C
A N N U A L R E P O RT 2 0 1 1 / 1 2116
Chairman’s message It ’s all in our Strategic Imperatives.
The spirit of stewardship, trusteeship and accountability form the nucleus of the governance
philosophy of Dimo. One does not have to reach far into corporate literature of Dimo to find
evidence of this spirit. It is embedded in the eight strategic imperatives. The Board of Directors and
the Group Management Committee are conscious of the governance - related responsibilities placed
upon them by the strategic imperatives. How we create our stakeholder wealth matters to us,
as much as how much we create.
The Strategic Imperatives provide the path to enterprise governance. Conformance and performance
aspects of each strategic imperative are considered when formulating and executing measures
relating to enterprise governance. The same approach has been adopted in reporting too.
As Chairman, I am duty bound to facilitate effective discharge of the responsibilities of the Board.
Towards meeting this end, I make every endeavour to ensure that the Board meetings are conducted
in a manner that encourages effective participation. I am thankful to the members of the Board for
the effective manner in which they contribute to govern our Company.
As a company, we are committed to upholding Dimo ethics uncompromisingly. As required by
Section D.4.2 of the Code of Best Practices of Corporate Governance issued jointly by the Securities
Exchange Commission and The Institute of Chartered Accountants of Sri Lanka, I confirm that I am
not aware of any material violation of the Code of Business Ethics of the Company.
The Enterprise Governance Report that follows presents a detailed account of as to how the
Company has institutionalised governance. I trust that the Report will assist the readers in
understanding governance at Dimo via strategic imperatives.
Yours Sincerely,
A. Ranjith PandithageChairman/Managing Director
Colombo
30th May 2012
St eWA R d S h I P e n t e R P R I S e G OV E R N A N C E
Regulatory Authorit ies . . .P lay ing by the Rules 88 Our Community. . .L ive and Let L ive 90 The Environment . . .Now and for Generat ions Yet Unborn 100
D I E S E L & M OTO R E N G I N E E R I N G P L C
A N N U A L R E P O RT 2 0 1 1 / 1 2117
Senior independent director’s Statement
‘Code of Best Practice on Corporate Governance’ ( The Code) issued jointly by the Securities
and Exchange Commission of Sri Lanka and The Institute of Chartered Accountants of Sri Lanka
recommends that a Senior Independent Director (SID) be appointed in the event of the Chairman
heading the executive function of the Company.
The presence of SID provides a workable mechanism to review the role played by the Chairman.
Whilst the role of the Chairman entails providing leadership in observing best practices of corporate
governance, my role as the SID calls for a review of the Board’s effectiveness. The presence of the SID
also provides emphasis to transparency in matters relating to governance.
Dimo is committed to principles of good governance and always strives to live by the Best Practices
of Corporate Governance. The governance culture of the Company is strongly embraced by the Board
of Directors. The Company follows a policy of strict compliance with laws, regulatory requirements
and the Code of Ethics.
A Director is permitted to obtain independent professional advice that may be required in
discharging his responsibilities, at the Company’s expense.
As the SID, which role I have played since May 2009, I am consulted by Chairman on major strategic
and governance issues. As the SID, I make myself available to any Director to have any confidential
discussions on the affairs of the Company, should the need arise. By virtue of being the Chairman of
the Audit Committee, I also meet Independent Auditors and Internal Auditors and obtain their views
on any matters of concern.
R. SeevaratnamSenior independent Director
Colombo
30th May 2012
e n t e R P R I S e G ov e R n A n C e St eWA R d S h I P
Susta inabi l i ty Performance Object ives . . . In 2011/12 112 Enterprise Governance 116 Risk Management 128
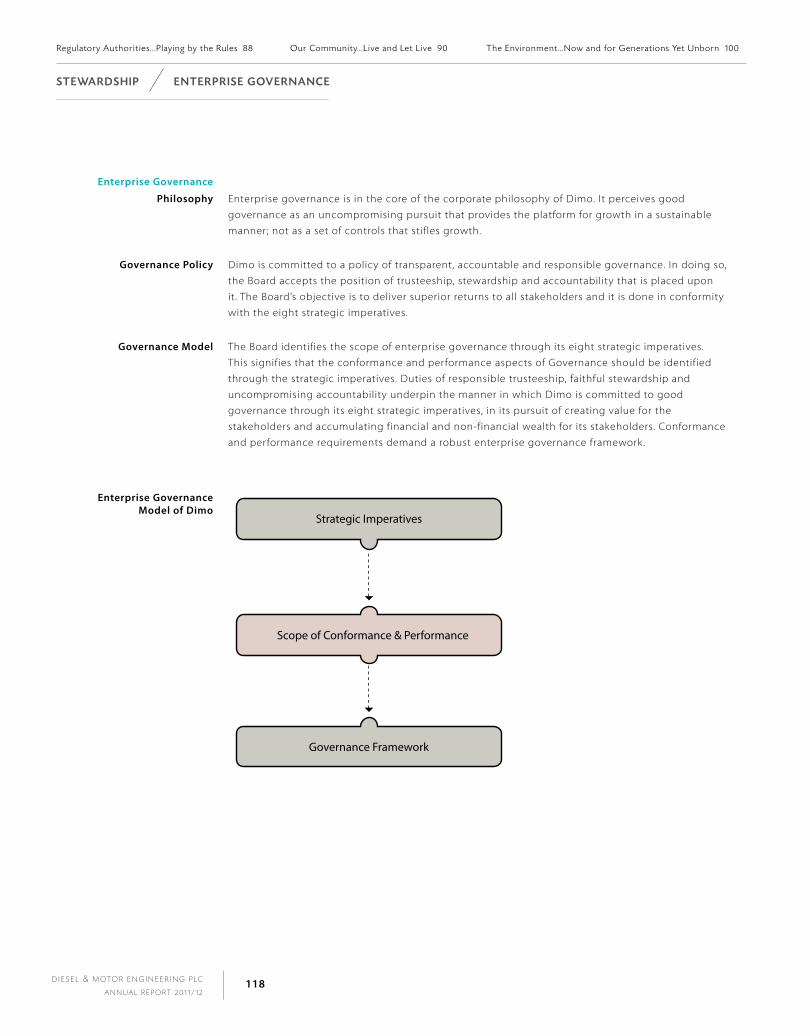
D I E S E L & M OTO R E N G I N E E R I N G P L C
A N N U A L R E P O RT 2 0 1 1 / 1 2118
Enterprise governance
philosophy Enterprise governance is in the core of the corporate philosophy of Dimo. It perceives good
governance as an uncompromising pursuit that provides the platform for growth in a sustainable
manner; not as a set of controls that stifles growth.
governance policy Dimo is committed to a policy of transparent, accountable and responsible governance. In doing so,
the Board accepts the position of trusteeship, stewardship and accountability that is placed upon
it. The Board’s objective is to deliver superior returns to all stakeholders and it is done in conformity
with the eight strategic imperatives.
governance model The Board identifies the scope of enterprise governance through its eight strategic imperatives.
This signifies that the conformance and performance aspects of Governance should be identified
through the strategic imperatives. Duties of responsible trusteeship, faithful stewardship and
uncompromising accountability underpin the manner in which Dimo is committed to good
governance through its eight strategic imperatives, in its pursuit of creating value for the
stakeholders and accumulating financial and non-financial wealth for its stakeholders. Conformance
and performance requirements demand a robust enterprise governance framework.
Enterprise governance model of dimo
Enterprise Governance Model of DIMO
Scope of Conformance & Performance
Strategic Imperatives
Governance Framework
Regulatory Authorit ies . . .P lay ing by the Rules 88 Our Community. . .L ive and Let L ive 90 The Environment . . .Now and for Generat ions Yet Unborn 100
St eWA R d S h I P e n t e R P R I S e G ov e R n A n C e

D I E S E L & M OTO R E N G I N E E R I N G P L C
A N N U A L R E P O RT 2 0 1 1 / 1 2119
governance framework The ultimate responsibility for good governance rests with the Board of Directors. In order to
effectively fulfil this responsibility, the Board has in place a governance structure and a process to
monitor its effectiveness. The Audit Committee, the Remuneration Committee and the Nomination
Committee together with the Group Management Committee play a leading role in ensuring
effective enterprise governance.
The governance framework is designed taking into consideration the demands placed by the aspects
of conformance and performance along with legislative and regulatory requirements and best
practices of enterprise governance. It includes a governance structure, regulatory framework and
sources of assurance.
Board Committees
REGULATION FRAMWORK
INDEPENDENT CERTIFICATION
Independent Audit
Internal Audit
EMS Audit & Certi�cation
Assurance ofNon-FinancialInformation
INTERNAL REGULATION
EXTERNAL REGULATION
Code of Best Practice on Corporate Governance issued jointly by SEC and ICASL
Companies Act No. 07 of 2007
Articles of Association
Environment Management System (EMS)
Quality Management System (QMS)
Internal Control System
Risk Management Framework
QMS Audit & Certi�cation
Corporate Governance rules published by the CSE
ASSURANCE &CERTIFICATION
GOVERNANCE STRUCTURE
GOVERNANCE FRAMEWORK
BOARD OF DIRECTORS
ASSURANCE OF FINANCIAL INFORMATION
INDEPENDENT REVIEW
Management Committees
Business Unit ManagersEmployees' Councils
Group Management Committee
Sustainability Committee
Remuneration Committee
Nomination Committee
Audit Committee
Code of Business Ethics
GRI Guidelines on Sustainability
e n t e R P R I S e G ov e R n A n C e St eWA R d S h I P
Susta inabi l i ty Performance Object ives . . . In 2011/12 112 Enterprise Governance 116 Risk Management 128

D I E S E L & M OTO R E N G I N E E R I N G P L C
A N N U A L R E P O RT 2 0 1 1 / 1 2120
Conformance and performance
Despite there being many laws, regulations, best
practices and expectations that shape conformance and
performance dimensions of governance, it is trusteeship,
stewardship and accountability that drive them.
Arising from the responsibilities placed upon it, the Board
endeavors to meet the demands through the structures
and the processes that are in place.
The table below shows some conformance and
performance aspects that strategic imperatives of
Dimo give rise to and the point of reference through
which they are addressed and reported. The point
of reference is the source that provides guidance for
conformance or performance. A point of reference could
be a code of best practice, guideline, standard, system,
process or even a body of persons that could provide
guidance and direction.
“Apart from allowing one to ‘construct’ a fruitful career, Dimo really is an exemplary ‘enabler ’…all of us have ample scope to work freely and innovatively, knowing we have the full support of the Company. How great is that?”
Chaminda ranaWanaGeneral Manager - Construction and Material Handling
Regulatory Authorit ies . . .P lay ing by the Rules 88 Our Community. . .L ive and Let L ive 90 The Environment . . .Now and for Generat ions Yet Unborn 100
St eWA R d S h I P e n t e R P R I S e G ov e R n A n C e

D I E S E L & M OTO R E N G I N E E R I N G P L C
A N N U A L R E P O RT 2 0 1 1 / 1 2121
Conformance and performance aspects Based on Strategic imperatives
Conformance Performance
Strategic Imperative Key Conformance Aspects Point of Reference Key Performance Aspects Point of Reference
1. Refining the portfolio
mix of our businesses
continuously
Meet regulatory standards
with regard to products and
services and its delivery.
Quality Management
System
Code of Business Ethics
Managing the product
and service portfolio
Quality Management
System
Product responsibility Quality Management
System
2. Creating financial value Internal Control Audit Committee Business Strategy
Formulation
Strategic Imperatives
Group Management
CommitteeInternal Audit Audit Committee Operational Excellence Group Management
CommitteeQuality Management
SystemUncertainty
Management
Risk Management
Framework
Environmental
Management SystemAssurance Audit Committee
Independent
Auditors
3. Earning the trust
of customers so that
they keep coming back
Customer Health and
Safety
Quality Management
System
Customer Satisfaction Quality Management
SystemCustomer Privacy Quality Management
System
Meeting Customer
Expectations
Quality Management
SystemCode of Business Ethics Customer Relationship
Management
Quality Management
SystemCustomer Complaint
Handling
Quality Management
System
4. Nurturing people
so that they find
it enjoyable and
rewarding to
work with us
Employee safety Quality Management
System
Employee Satisfaction HR Scorecard
Employee Rights UN Global Compact
Principles
Training and
development
HR Scorecard
Code of Business Ethics Retention HR ScorecardEqual opportunities UN Global Compact
Principles
Employee Engagement HR Scorecard
Comply with legislation
and regulations relating to
employees
Code of Business Ethics
e n t e R P R I S e G ov e R n A n C e St eWA R d S h I P
Susta inabi l i ty Performance Object ives . . . In 2011/12 112 Enterprise Governance 116 Risk Management 128
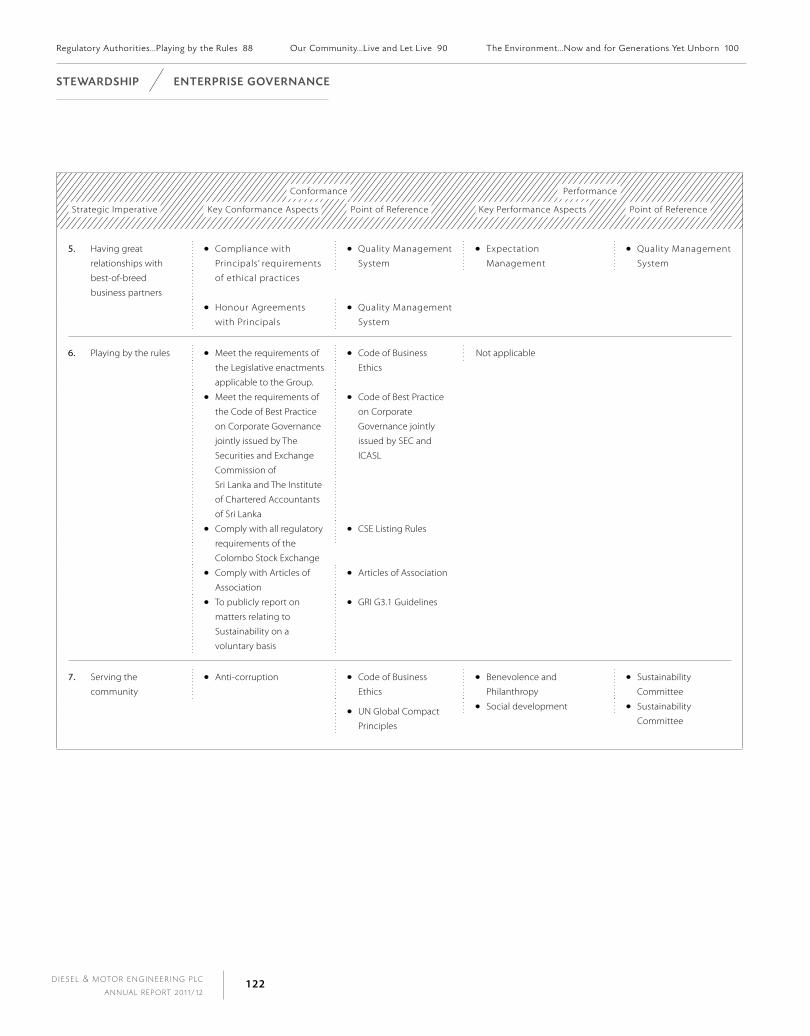
D I E S E L & M OTO R E N G I N E E R I N G P L C
A N N U A L R E P O RT 2 0 1 1 / 1 2122
Conformance Performance
Strategic Imperative Key Conformance Aspects Point of Reference Key Performance Aspects Point of Reference
5. Having great
relationships with
best-of-breed
business partners
Compliance with
Principals’ requirements
of ethical practices
Quality Management
System
Expectation
Management
Quality Management
System
Honour Agreements
with Principals
Quality Management
System
6. Playing by the rules Meet the requirements of
the Legislative enactments
applicable to the Group.
Code of Business
Ethics
Not applicable
Meet the requirements of
the Code of Best Practice
on Corporate Governance
jointly issued by The
Securities and Exchange
Commission of
Sri Lanka and The Institute
of Chartered Accountants
of Sri Lanka
Code of Best Practice
on Corporate
Governance jointly
issued by SEC and
ICASL
Comply with all regulatory
requirements of the
Colombo Stock Exchange
CSE Listing Rules
Comply with Articles of
Association
Articles of Association
To publicly report on
matters relating to
Sustainability on a
voluntary basis
GRI G3.1 Guidelines
7. Serving the
community
Anti-corruption Code of Business
Ethics
UN Global Compact
Principles
Benevolence and
Philanthropy
Sustainability
CommitteeSocial development Sustainability
Committee
Regulatory Authorit ies . . .P lay ing by the Rules 88 Our Community. . .L ive and Let L ive 90 The Environment . . .Now and for Generat ions Yet Unborn 100
St eWA R d S h I P e n t e R P R I S e G ov e R n A n C e

D I E S E L & M OTO R E N G I N E E R I N G P L C
A N N U A L R E P O RT 2 0 1 1 / 1 2123
Conformance Performance
Strategic Imperative Key Conformance Aspects Point of Reference Key Performance Aspects Point of Reference
8. Being friendly towards
the environment
Comply with all
requirements of
the Environment
Management System
Environmental
Management System
UN Global compact
principles
Carbon foot-print
Management
Environmental
Management System
Meet Legal and Regulatory
requirements regarding
Environment
Environmental
Management SystemUN Global Compact
Principles
Water Management
Code of Business
Ethics
Waste Management
Material Usage
Noise and Air Emissions
Recycle and Reuse
level of Compliance and adherence of point of reference
Point of Reference Aspect of Regulation Status
The Code of Best Practices on Corporate
Governance jointly issued by the Securities
and Exchange Commission of Sri Lanka and
The Institute of Chartered Accountants of
Sri Lanka (The Code)
Best practices of Corporate Governance Requirements of the code and the compliance level
is given on the table laid out from pages 206 to 235.
Listing Rules of the Colombo Stock
Exchange
Listing rules to be followed by Listed companies
in Sri Lanka including on Corporate Governance
relating to:
- Non-Executive Directors
- Independent Directors
- Disclosures relating to Directors
- Remuneration Committee
- Audit Committee
Complied. The compliance level is given on the
table laid out from pages 233 to 234.
Legislative enactments applicable
to the Group
Legal requirements that the Group is subject to The Code of Business Ethics specifically requires
that all employees comply with all applicable laws.
Employees sign a declaration to the effect that they
will follow the Code of Business Ethics.
Articles of Association Requirements prescribed by the Articles of
Association
Complied
e n t e R P R I S e G ov e R n A n C e St eWA R d S h I P
Susta inabi l i ty Performance Object ives . . . In 2011/12 112 Enterprise Governance 116 Risk Management 128
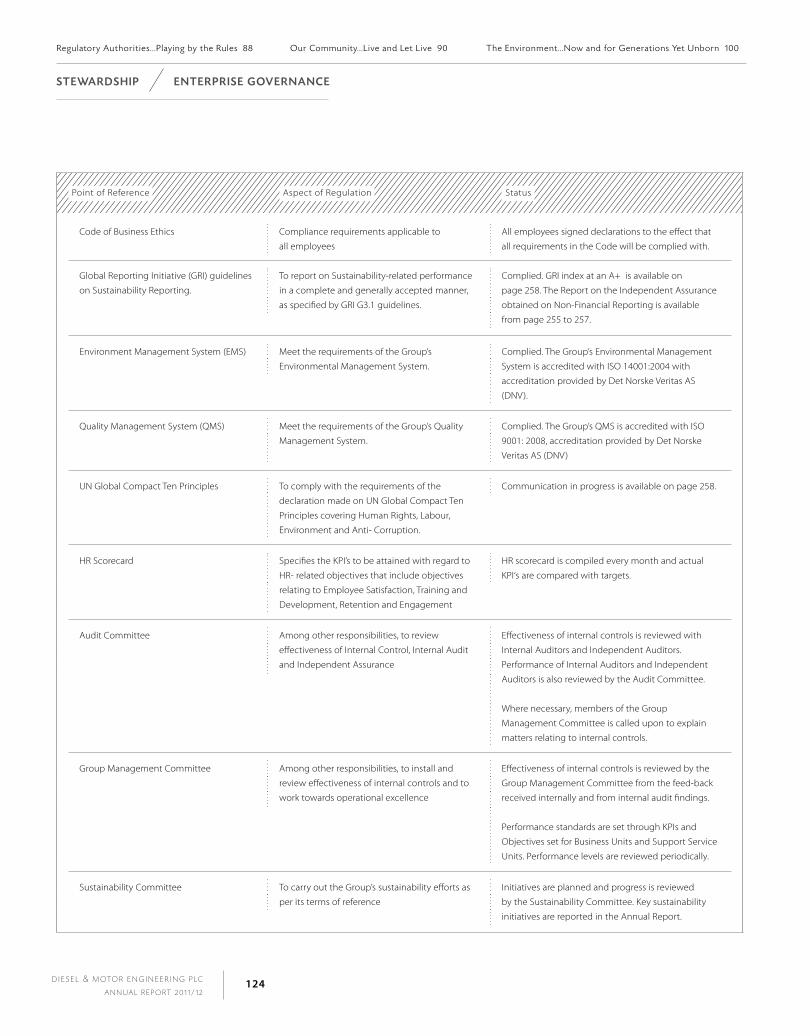
D I E S E L & M OTO R E N G I N E E R I N G P L C
A N N U A L R E P O RT 2 0 1 1 / 1 2124
Point of Reference Aspect of Regulation Status
Code of Business Ethics Compliance requirements applicable to
all employees
All employees signed declarations to the effect that
all requirements in the Code will be complied with.
Global Reporting Initiative (GRI) guidelines
on Sustainability Reporting.
To report on Sustainability-related performance
in a complete and generally accepted manner,
as specified by GRI G3.1 guidelines.
Complied. GRI index at an A+ is available on
page 258. The Report on the Independent Assurance
obtained on Non-Financial Reporting is available
from page 255 to 257.
Environment Management System (EMS) Meet the requirements of the Group’s
Environmental Management System.
Complied. The Group’s Environmental Management
System is accredited with ISO 14001:2004 with
accreditation provided by Det Norske Veritas AS
(DNV).
Quality Management System (QMS) Meet the requirements of the Group’s Quality
Management System.
Complied. The Group’s QMS is accredited with ISO
9001: 2008, accreditation provided by Det Norske
Veritas AS (DNV)
UN Global Compact Ten Principles To comply with the requirements of the
declaration made on UN Global Compact Ten
Principles covering Human Rights, Labour,
Environment and Anti- Corruption.
Communication in progress is available on page 258.
HR Scorecard Specifies the KPI’s to be attained with regard to
HR- related objectives that include objectives
relating to Employee Satisfaction, Training and
Development, Retention and Engagement
HR scorecard is compiled every month and actual
KPI‘s are compared with targets.
Audit Committee Among other responsibilities, to review
effectiveness of Internal Control, Internal Audit
and Independent Assurance
Effectiveness of internal controls is reviewed with
Internal Auditors and Independent Auditors.
Performance of Internal Auditors and Independent
Auditors is also reviewed by the Audit Committee.
Where necessary, members of the Group
Management Committee is called upon to explain
matters relating to internal controls.
Group Management Committee Among other responsibilities, to install and
review effectiveness of internal controls and to
work towards operational excellence
Effectiveness of internal controls is reviewed by the
Group Management Committee from the feed-back
received internally and from internal audit findings.
Performance standards are set through KPIs and
Objectives set for Business Units and Support Service
Units. Performance levels are reviewed periodically.
Sustainability Committee To carry out the Group’s sustainability efforts as
per its terms of reference
Initiatives are planned and progress is reviewed
by the Sustainability Committee. Key sustainability
initiatives are reported in the Annual Report.
Regulatory Authorit ies . . .P lay ing by the Rules 88 Our Community. . .L ive and Let L ive 90 The Environment . . .Now and for Generat ions Yet Unborn 100
St eWA R d S h I P e n t e R P R I S e G ov e R n A n C e

“Being passionate about all we do; adding value towards improving the quality of life of society through offering the best products we can; being one with the Dimo value system - these help me enjoy working at Dimo”.
WijiTh puShpaWElaGeneral Manager - Power & Medical Engineering
managing Conformance and
performance
Upon deciding the aspects of conformance and performance,
a point of reference or points of reference are established for each
aspect with a view to providing guidance on what is expected
or what is to be complied with. Once the point of reference is
identified, guidance for execution or compliance will be provided
by the point of reference so identified. The points of reference for
each aspect of conformance and performance are given in the
table on pages 121 to 123.
adherence The governance practices of the Company are conceived
out of the corporate philosophy of achieving sustainable
growth through good governance. Whilst, being fully-compliant
with demands of laws and regulations relating to corporate
governance, the Company recognises that best practices
provide a robust framework for sustainable growth and meeting
stakeholder expectations.
Enterprise Governance requires high levels of commitment across
the organisation and it is essential that an enabling governance
culture is created. This envisages creation of awareness at all levels.
All employees are expected to respect the strategic imperatives in
achieving their own objectives and the objectives of the Company.
Financial value creation is not encouraged at the cost of any
strategic imperative. In fact, financial value creation is encouraged
through subscribing towards strategic imperatives. The sustenance
of enterprise governance principles is facilitated by aligning the
strategic imperatives into its value adding process, and making
a conscious effort to continually improving the governance
framework and processes.
e n t e R P R I S e G ov e R n A n C e St eWA R d S h I P
Susta inabi l i ty Performance Object ives . . . In 2011/12 112 Enterprise Governance 116 Risk Management 128

D I E S E L & M OTO R E N G I N E E R I N G P L C
A N N U A L R E P O RT 2 0 1 1 / 1 2126
Compliance Compliance is monitored through the monitoring of the points of reference. In the event of the point
of reference being a code of best practice, guideline, legislation or a rule, the compliance is monitored
through ascertainment of compliance with the point of reference. On the other hand where the point
of reference is a body of persons such as a Management Committee, the compliance is monitored by
comparing the stated expectations or goals of such committee with the actual status.
assurance and Comfort Independent assurance, independent review, oversight and independent certification are key sources
of assurance and comfort with regard to integrity and due functioning of the enterprise governance
framework. This is depicted in the governance framework appearing on page 119. The Three Lines of
Defence approach, which is described below, provides comfort on the effective implementation of
internal controls and risk management.
lines of defence The comfort level derived from assurance is reliant upon on the internal controls that are in place.
Whilst the internal controls focus on the current operations and decisions, the risk management
process focuses on the uncertainties that the Group is exposed to. The ‘Three Lines of Defence’ model
given below depicts the approach followed in ensuring effective implementation of the internal
controls and risk management.
Own Internal Controls and Manage Risks
Line of Defence
Owner Line of Defence
Oversight of Internal Controls & Risk Management
Independent Assurance
Group Management Committee
Independent Auditor
Heads of Business Units
Audit Committee
1st
2nd
3rd
Line of Defence
Line of Defence
Regulatory Authorit ies . . .P lay ing by the Rules 88 Our Community. . .L ive and Let L ive 90 The Environment . . .Now and for Generat ions Yet Unborn 100
St eWA R d S h I P e n t e R P R I S e G ov e R n A n C e
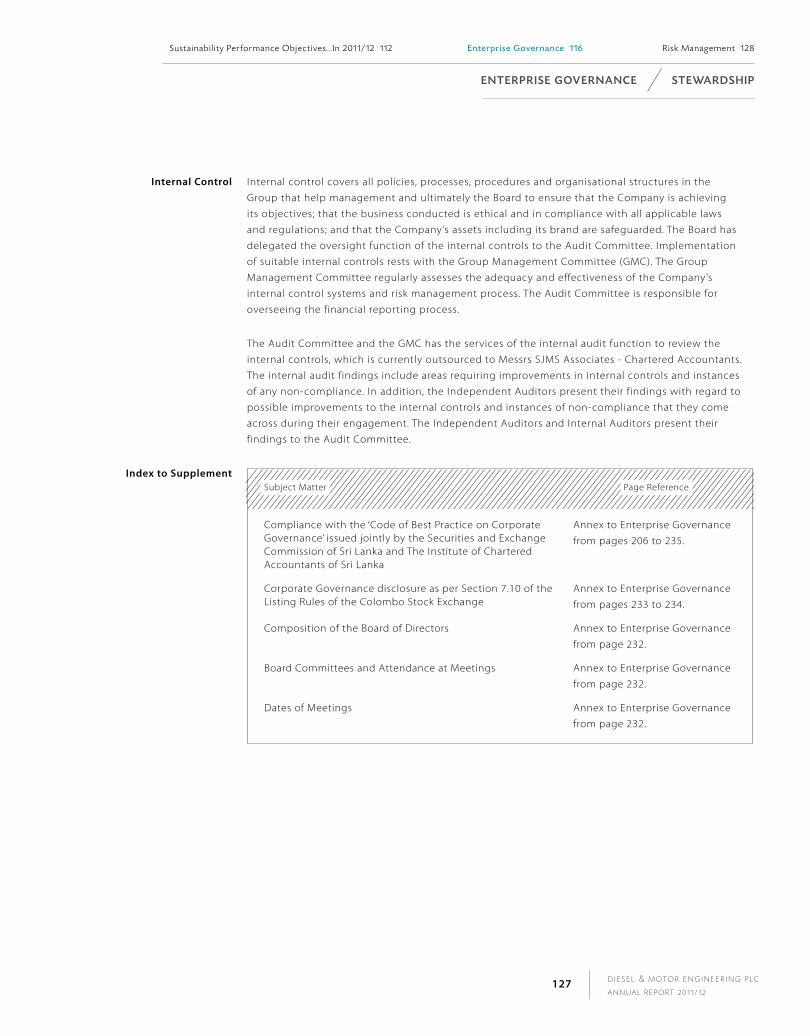
D I E S E L & M OTO R E N G I N E E R I N G P L C
A N N U A L R E P O RT 2 0 1 1 / 1 2127
internal Control Internal control covers all policies, processes, procedures and organisational structures in the
Group that help management and ultimately the Board to ensure that the Company is achieving
its objectives; that the business conducted is ethical and in compliance with all applicable laws
and regulations; and that the Company’s assets including its brand are safeguarded. The Board has
delegated the oversight function of the internal controls to the Audit Committee. Implementation
of suitable internal controls rests with the Group Management Committee (GMC). The Group
Management Committee regularly assesses the adequacy and effectiveness of the Company’s
internal control systems and risk management process. The Audit Committee is responsible for
overseeing the financial reporting process.
The Audit Committee and the GMC has the services of the internal audit function to review the
internal controls, which is currently outsourced to Messrs SJMS Associates - Chartered Accountants.
The internal audit findings include areas requiring improvements in internal controls and instances
of any non-compliance. In addition, the Independent Auditors present their findings with regard to
possible improvements to the internal controls and instances of non-compliance that they come
across during their engagement. The Independent Auditors and Internal Auditors present their
findings to the Audit Committee.
index to SupplementSubject Matter Page Reference
Compliance with the ‘Code of Best Practice on Corporate Governance’ issued jointly by the Securities and Exchange Commission of Sri Lanka and The Institute of Chartered Accountants of Sri Lanka
Annex to Enterprise Governance
from pages 206 to 235.
Corporate Governance disclosure as per Section 7.10 of the Listing Rules of the Colombo Stock Exchange
Annex to Enterprise Governance
from pages 233 to 234.
Composition of the Board of Directors Annex to Enterprise Governance
from page 232.
Board Committees and Attendance at Meetings Annex to Enterprise Governance
from page 232.
Dates of Meetings Annex to Enterprise Governance
from page 232.
e n t e R P R I S e G ov e R n A n C e St eWA R d S h I P
Susta inabi l i ty Performance Object ives . . . In 2011/12 112 Enterprise Governance 116 Risk Management 128
D I E S E L & M OTO R E N G I N E E R I N G P L C
A N N U A L R E P O RT 2 0 1 1 / 1 2128
Overview Taking risks is an integral part of entrepreneurship. Uncertainty provides both risk and opportunity
with a potential to erode or enhance value. The challenge for the management is to determine
acceptable limits of uncertainty. Striking a balance between risk and opportunity in the context of
the Group’s risk appetite is the cornerstone of the performance aspect of Corporate Governance.
A well structured risk management process encourages management to take risks in a controlled
manner resulting benefits to the Group. While the Group remains committed to increasing
shareholder value by developing and growing the business within the Board-determined risk
appetite, the Group is committed towards achieving this objective in line with the interests of
all stakeholders.
The constantly evolving environment and the interactions with our stakeholders present the
Company with risks and opportunities. In addition, the Group has to manage risks that arise from
its operations. Thus, a need arises to identify and systematically manage risks. The systematic
approach required for risk management calls for a framework that ensures that risks are identified
on time, evaluated in terms of risk appetite of the Group and effective management and monitoring
mechanisms are installed.
risk management Structure
The Board is primarily responsible for ensuring that the risks are identified and appropriately
managed across the Group. The Audit Committee has been delegated the responsibility for reviewing
the effectiveness of the Group’s Risk Management Framework, including the systems established
to identify, assess, manage and monitor risks. The Internal Audit function also plays a key role in
risk identification.
The Group Management Committee (GMC) takes the lead at the implementation level in identifying
risks. A bottom-up approach is taken by the GMC in the process of risk identification. The GMC
examines processes and events that expose the Company into situations that could seriously reduce
earnings, impair its liquidity position or create legal, regulatory or reputation risks. The GMC also
evaluates options available to mitigate risks and to identify risks that do not match the risk appetite
of the Group. Monitoring of risk management measures is a responsibility that rests with the GMC.
Heads of Business Units provide useful information and feed back to the GMC for risk management
with the assistance of the employees of the Group.
St eWA R d S h I P R I S K M A N AG E M E N T
Regulatory Authorit ies . . .P lay ing by the Rules 88 Our Community. . .L ive and Let L ive 90 The Environment . . .Now and for Generat ions Yet Unborn 100
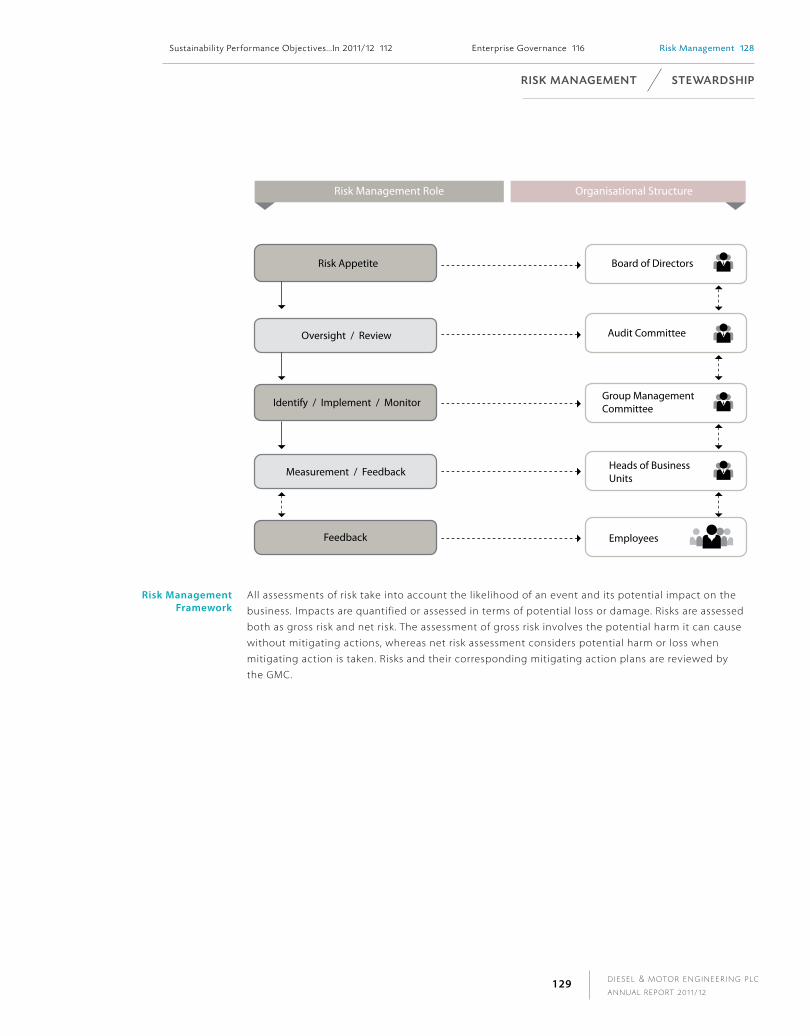
D I E S E L & M OTO R E N G I N E E R I N G P L C
A N N U A L R E P O RT 2 0 1 1 / 1 2129
Risk Management Structure
Risk Appetite
Oversight / Review
Identify / Implement / Monitor
Measurement / Feedback
Feedback
Organisational StructureRisk Management Role
Board of Directors
Group Management Committee
Heads of Business Units
Audit Committee
Employees
risk management framework
All assessments of risk take into account the likelihood of an event and its potential impact on the
business. Impacts are quantified or assessed in terms of potential loss or damage. Risks are assessed
both as gross risk and net risk. The assessment of gross risk involves the potential harm it can cause
without mitigating actions, whereas net risk assessment considers potential harm or loss when
mitigating action is taken. Risks and their corresponding mitigating action plans are reviewed by
the GMC.
R I S K M A n AG e M e n t St eWA R d S h I P
Susta inabi l i ty Performance Object ives . . . In 2011/12 112 Enterpr ise Governance 116 Risk Management 128
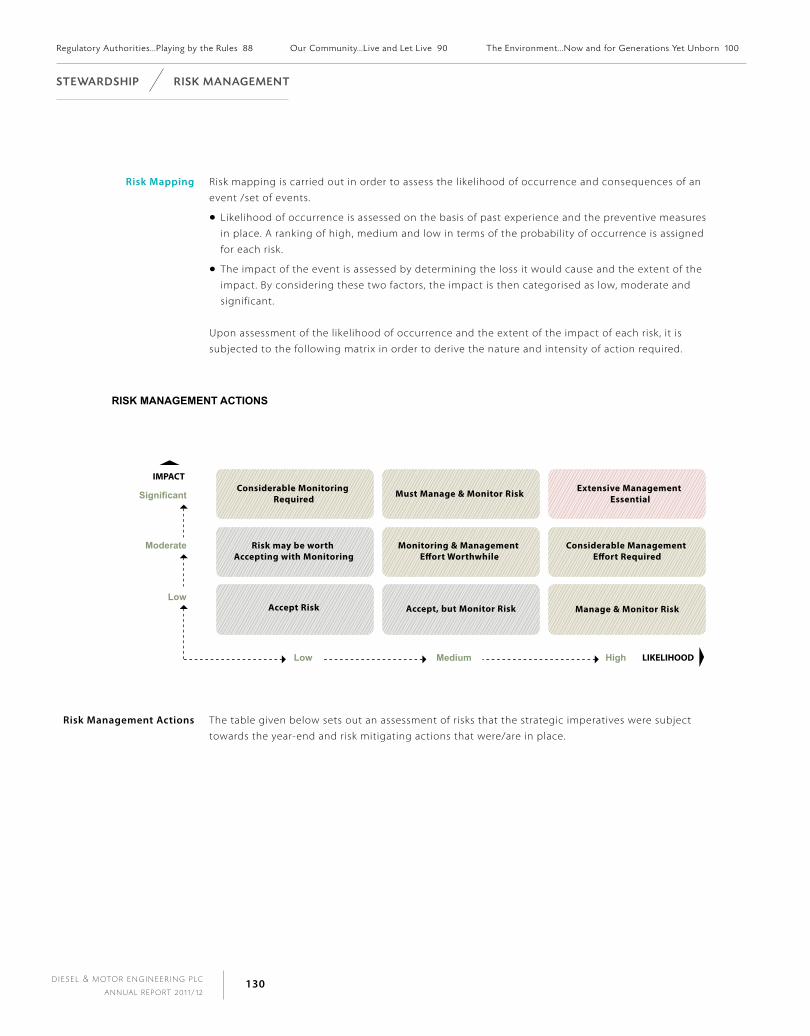
D I E S E L & M OTO R E N G I N E E R I N G P L C
A N N U A L R E P O RT 2 0 1 1 / 1 2130
risk mapping Risk mapping is carried out in order to assess the likelihood of occurrence and consequences of an
event /set of events.
Likelihood of occurrence is assessed on the basis of past experience and the preventive measures
in place. A ranking of high, medium and low in terms of the probability of occurrence is assigned
for each risk.
The impact of the event is assessed by determining the loss it would cause and the extent of the
impact. By considering these two factors, the impact is then categorised as low, moderate and
significant.
Upon assessment of the likelihood of occurrence and the extent of the impact of each risk, it is
subjected to the following matrix in order to derive the nature and intensity of action required.
RISK MANAGEMENT ACTIONS
Moderate
Low
Significant
Low Medium High
IMPACT
LIKELIHOOD
Accept Risk Accept, but Monitor Risk
Considerable Monitoring Required Must Manage & Monitor Risk Extensive Management
Essential
Risk may be worth Accepting with Monitoring
Monitoring & Management E�ort Worthwhile
Considerable Management E�ort Required
Manage & Monitor Risk
risk management actions The table given below sets out an assessment of risks that the strategic imperatives were subject
towards the year-end and risk mitigating actions that were/are in place.
St eWA R d S h I P R I S K M A n AG e M e n t
Regulatory Authorit ies . . .P lay ing by the Rules 88 Our Community. . .L ive and Let L ive 90 The Environment . . .Now and for Generat ions Yet Unborn 100
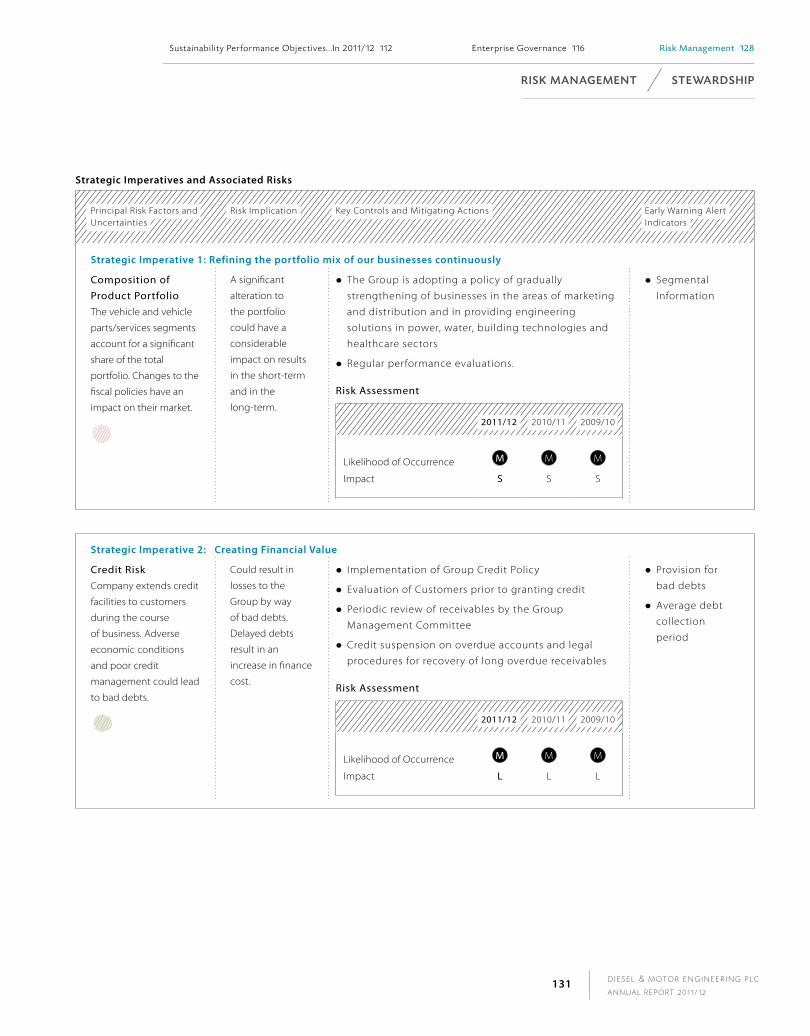
D I E S E L & M OTO R E N G I N E E R I N G P L C
A N N U A L R E P O RT 2 0 1 1 / 1 2131
Strategic imperatives and associated risks
Principal Risk Factors andUncertainties
Risk Implication Key Controls and Mitigating Actions Early Warning AlertIndicators
Strategic imperative 1: refining the portfolio mix of our businesses continuously
Composition of Product PortfolioThe vehicle and vehicle
parts/services segments
account for a significant
share of the total
portfolio. Changes to the
fiscal policies have an
impact on their market.
A significant
alteration to
the portfolio
could have a
considerable
impact on results
in the short-term
and in the
long-term.
The Group is adopting a policy of gradually
strengthening of businesses in the areas of marketing
and distribution and in providing engineering
solutions in power, water, building technologies and
healthcare sectors
Regular performance evaluations.
Risk Assessment
2011/12 2010/11 2009/10
Likelihood of Occurrence M M M
Impact S S S
Segmental
Information
Strategic imperative 2: Creating financial value
Credit Risk Company extends credit
facilities to customers
during the course
of business. Adverse
economic conditions
and poor credit
management could lead
to bad debts.
Could result in
losses to the
Group by way
of bad debts.
Delayed debts
result in an
increase in finance
cost.
Implementation of Group Credit Policy
Evaluation of Customers prior to granting credit
Periodic review of receivables by the Group
Management Committee
Credit suspension on overdue accounts and legal
procedures for recovery of long overdue receivables
Risk Assessment
2011/12 2010/11 2009/10
Likelihood of Occurrence M M M
Impact L L L
Provision for
bad debts
Average debt
collection
period
R I S K M A n AG e M e n t St eWA R d S h I P
Susta inabi l i ty Performance Object ives . . . In 2011/12 112 Enterpr ise Governance 116 Risk Management 128
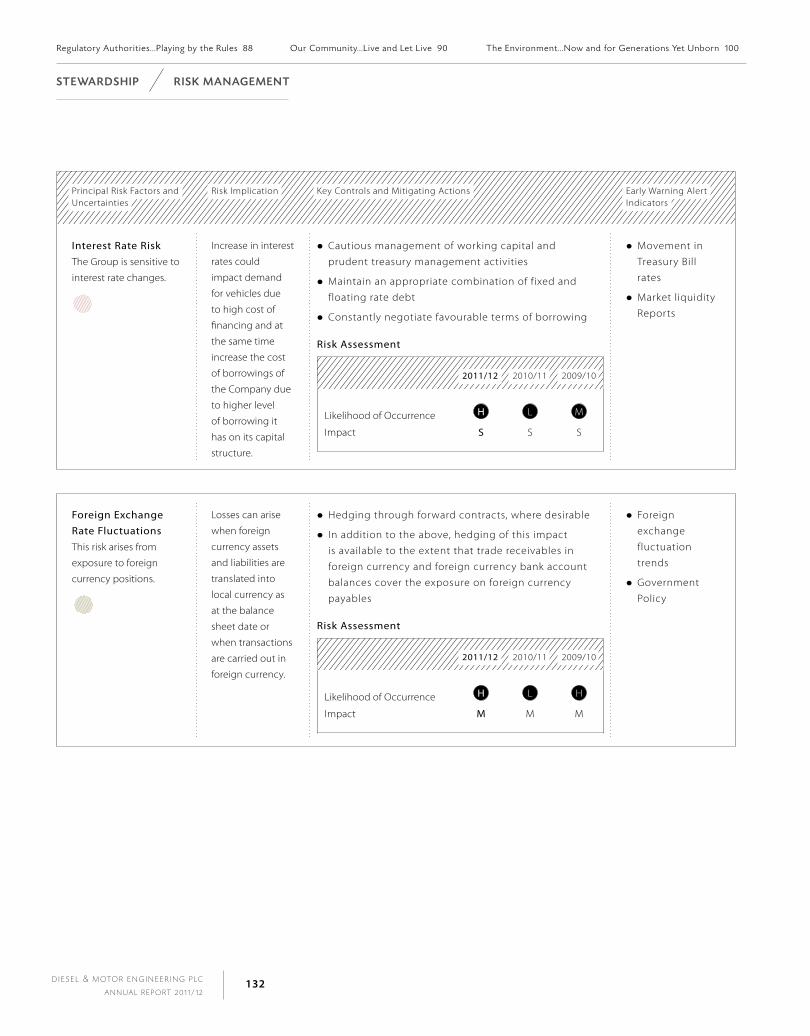
D I E S E L & M OTO R E N G I N E E R I N G P L C
A N N U A L R E P O RT 2 0 1 1 / 1 2132
Principal Risk Factors andUncertainties
Risk Implication Key Controls and Mitigating Actions Early Warning AlertIndicators
Interest Rate RiskThe Group is sensitive to
interest rate changes.
Increase in interest
rates could
impact demand
for vehicles due
to high cost of
financing and at
the same time
increase the cost
of borrowings of
the Company due
to higher level
of borrowing it
has on its capital
structure.
Cautious management of working capital and
prudent treasury management activities
Maintain an appropriate combination of fixed and
floating rate debt
Constantly negotiate favourable terms of borrowing
Risk Assessment
2011/12 2010/11 2009/10
Likelihood of Occurrence H L M
Impact S S S
Movement in
Treasury Bill
rates
Market liquidity
Reports
Foreign Exchange Rate FluctuationsThis risk arises from
exposure to foreign
currency positions.
Losses can arise
when foreign
currency assets
and liabilities are
translated into
local currency as
at the balance
sheet date or
when transactions
are carried out in
foreign currency.
Hedging through forward contracts, where desirable
In addition to the above, hedging of this impact
is available to the extent that trade receivables in
foreign currency and foreign currency bank account
balances cover the exposure on foreign currency
payables
Risk Assessment
2011/12 2010/11 2009/10
Likelihood of Occurrence H L H
Impact M M M
Foreign
exchange
fluctuation
trends
Government
Policy
St eWA R d S h I P R I S K M A n AG e M e n t
Regulatory Authorit ies . . .P lay ing by the Rules 88 Our Community. . .L ive and Let L ive 90 The Environment . . .Now and for Generat ions Yet Unborn 100
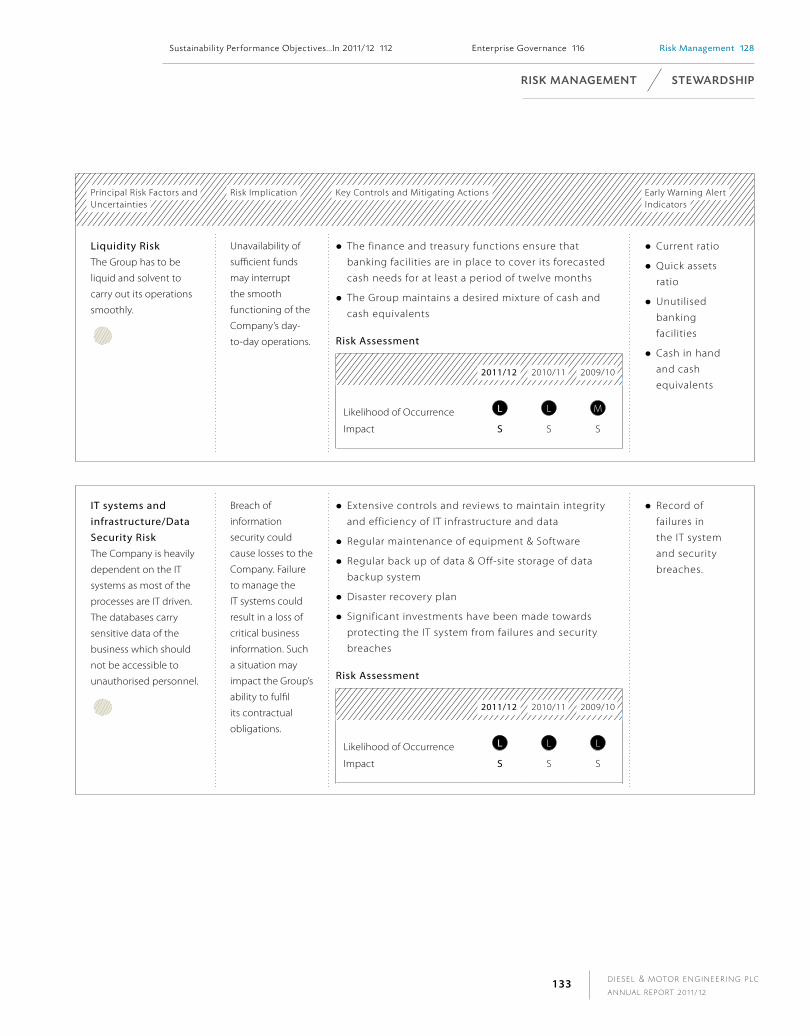
D I E S E L & M OTO R E N G I N E E R I N G P L C
A N N U A L R E P O RT 2 0 1 1 / 1 2133
Principal Risk Factors andUncertainties
Risk Implication Key Controls and Mitigating Actions Early Warning AlertIndicators
Liquidity RiskThe Group has to be
liquid and solvent to
carry out its operations
smoothly.
Unavailability of
sufficient funds
may interrupt
the smooth
functioning of the
Company’s day-
to-day operations.
The finance and treasury functions ensure that
banking facilities are in place to cover its forecasted
cash needs for at least a period of twelve months
The Group maintains a desired mixture of cash and
cash equivalents
Risk Assessment
2011/12 2010/11 2009/10
Likelihood of Occurrence L L M
Impact S S S
Current ratio
Quick assets
ratio
Unutilised
banking
facilities
Cash in hand
and cash
equivalents
IT systems and infrastructure/Data Security RiskThe Company is heavily
dependent on the IT
systems as most of the
processes are IT driven.
The databases carry
sensitive data of the
business which should
not be accessible to
unauthorised personnel.
Breach of
information
security could
cause losses to the
Company. Failure
to manage the
IT systems could
result in a loss of
critical business
information. Such
a situation may
impact the Group’s
ability to fulfil
its contractual
obligations.
Extensive controls and reviews to maintain integrity
and efficiency of IT infrastructure and data
Regular maintenance of equipment & Software
Regular back up of data & Off-site storage of data
backup system
Disaster recovery plan
Significant investments have been made towards
protecting the IT system from failures and security
breaches
Risk Assessment
2011/12 2010/11 2009/10
Likelihood of Occurrence L L L
Impact S S S
Record of
failures in
the IT system
and security
breaches.
R I S K M A n AG e M e n t St eWA R d S h I P
Susta inabi l i ty Performance Object ives . . . In 2011/12 112 Enterpr ise Governance 116 Risk Management 128
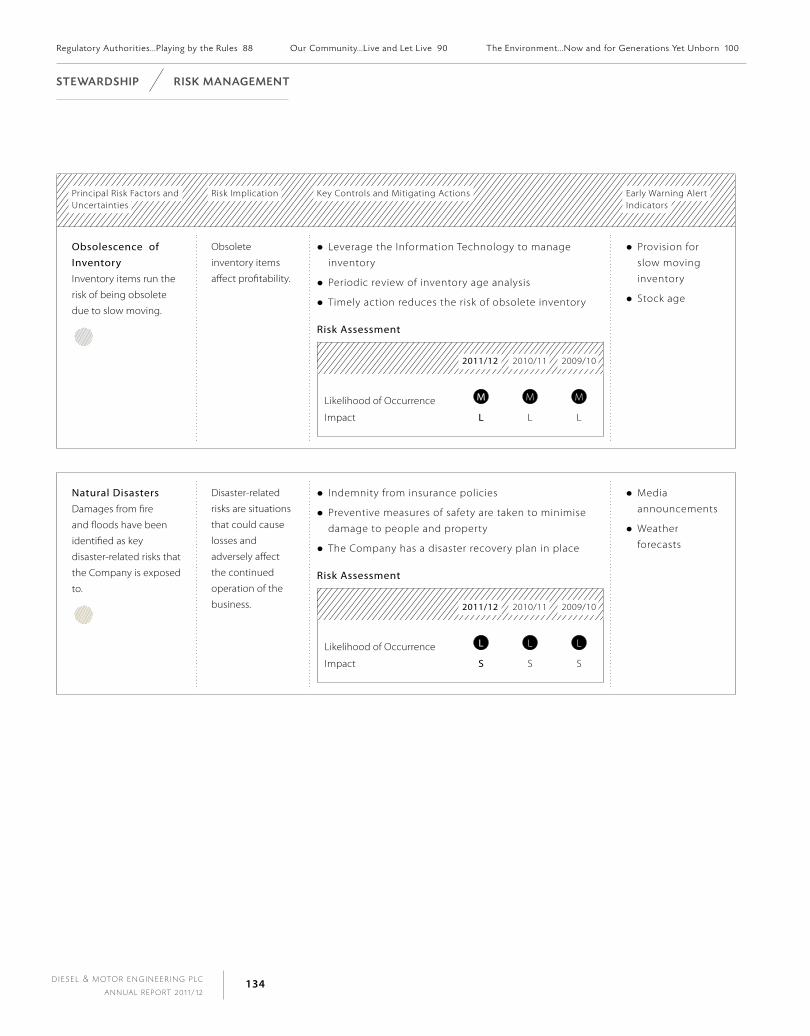
D I E S E L & M OTO R E N G I N E E R I N G P L C
A N N U A L R E P O RT 2 0 1 1 / 1 2134
Principal Risk Factors andUncertainties
Risk Implication Key Controls and Mitigating Actions Early Warning AlertIndicators
Obsolescence of Inventory Inventory items run the
risk of being obsolete
due to slow moving.
Obsolete
inventory items
affect profitability.
Leverage the Information Technology to manage
inventory
Periodic review of inventory age analysis
Timely action reduces the risk of obsolete inventory
Risk Assessment
2011/12 2010/11 2009/10
Likelihood of Occurrence M M M
Impact L L L
Provision for
slow moving
inventory
Stock age
Natural DisastersDamages from fire
and floods have been
identified as key
disaster-related risks that
the Company is exposed
to.
Disaster-related
risks are situations
that could cause
losses and
adversely affect
the continued
operation of the
business.
Indemnity from insurance policies
Preventive measures of safety are taken to minimise
damage to people and property
The Company has a disaster recovery plan in place
Risk Assessment
2011/12 2010/11 2009/10
Likelihood of Occurrence L L L
Impact S S S
Media
announcements
Weather
forecasts
St eWA R d S h I P R I S K M A n AG e M e n t
Regulatory Authorit ies . . .P lay ing by the Rules 88 Our Community. . .L ive and Let L ive 90 The Environment . . .Now and for Generat ions Yet Unborn 100

D I E S E L & M OTO R E N G I N E E R I N G P L C
A N N U A L R E P O RT 2 0 1 1 / 1 2135
Principal Risk Factors andUncertainties
Risk Implication Key Controls and Mitigating Actions Early Warning AlertIndicators
Reputational Risk
The stakeholders of the
Group could negatively
react to a loss of
reputation of the Group.
Loss of reputation
may make the
companies in
the Group lose
its stakeholders
including
customers,
suppliers and
employees.
The Company adopts the code of corporate
governance jointly issued by the Securities and
Exchange Commission and The Institute of Chartered
Accountants of Sri Lanka
The Code of Business Ethics of the Company
prescribes ethical practices that the Company
employees are subject to. All employees are required
to provide a written affirmation on following the
Code of Business Ethics
’Dimo Buddy’ provides guidance for employees on
their conduct
An exercise is carried out to identify stakeholder
expectations and this provides guidance as to
whether the Company has necessary processes to
deliver their expectations
The sustainability framework of the Group addresses
the economic, social and environmental impact of
Company’s operations
Risk Assessment
2011/12 2010/11 2009/10
Likelihood of Occurrence M M M
Impact S S S
Negative
reactions from
stakeholders
Breaches
in Code of
Business Ethics
R I S K M A n AG e M e n t St eWA R d S h I P
Susta inabi l i ty Performance Object ives . . . In 2011/12 112 Enterpr ise Governance 116 Risk Management 128
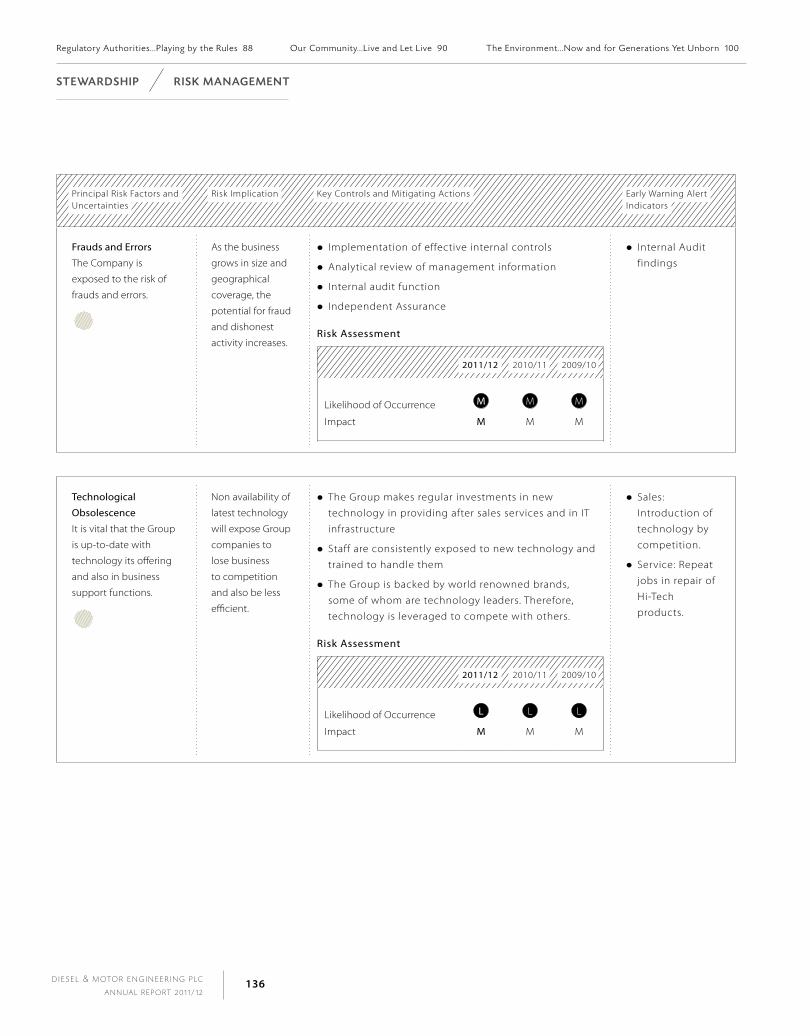
D I E S E L & M OTO R E N G I N E E R I N G P L C
A N N U A L R E P O RT 2 0 1 1 / 1 2136
Principal Risk Factors andUncertainties
Risk Implication Key Controls and Mitigating Actions Early Warning AlertIndicators
Frauds and Errors
The Company is
exposed to the risk of
frauds and errors.
As the business
grows in size and
geographical
coverage, the
potential for fraud
and dishonest
activity increases.
Implementation of effective internal controls
Analytical review of management information
Internal audit function
Independent Assurance
Risk Assessment
2011/12 2010/11 2009/10
Likelihood of Occurrence M M M
Impact M M M
Internal Audit
findings
Technological
Obsolescence
It is vital that the Group
is up-to-date with
technology its offering
and also in business
support functions.
Non availability of
latest technology
will expose Group
companies to
lose business
to competition
and also be less
efficient.
The Group makes regular investments in new
technology in providing after sales services and in IT
infrastructure
Staff are consistently exposed to new technology and
trained to handle them
The Group is backed by world renowned brands,
some of whom are technology leaders. Therefore,
technology is leveraged to compete with others.
Risk Assessment
2011/12 2010/11 2009/10
Likelihood of Occurrence L L L
Impact M M M
Sales:
Introduction of
technology by
competition.
Service: Repeat
jobs in repair of
Hi-Tech
products.
St eWA R d S h I P R I S K M A n AG e M e n t
Regulatory Authorit ies . . .P lay ing by the Rules 88 Our Community. . .L ive and Let L ive 90 The Environment . . .Now and for Generat ions Yet Unborn 100

D I E S E L & M OTO R E N G I N E E R I N G P L C
A N N U A L R E P O RT 2 0 1 1 / 1 2137
Principal Risk Factors andUncertainties
Risk Implication Key Controls and Mitigating Actions Early Warning AlertIndicators
Strategic Imperative 3: Earning the trust of customers so that they keep coming back
Loosing Customer Relationships As a profit making entity,
customers are sovereign
to the Company.
Maintaining positive
relationships with
customers is vital.
Loss of customers
or unhappy
customers may
result in a financial
loss to the
Company. Such
a situation could
affect turnover
and hinder the
ability to acquire
new customers.
Quality Management System accredited with ISO
9001:2008
Customer Relationship Management led by a
dedicated unit
Continuous training of employees on customer care
and aftercare
Inclusion of customer care and customer satisfaction
index in employees’ and business unit objectives
A detailed narrative on delivering value to customers is
available from pages 40 to page 61.
Risk Assessment
2011/12 2010/11 2009/10
Likelihood of Occurrence M M M
Impact S S S
Customer
satisfaction
index
Repeat
customer ratio
Customer
complaints
Industry Trends RiskIndustry risks arise from
sudden changes in the
industry. These could be
driven by new trends,
entry of new/alternative
products into the
market.
Loss of sales
due to sudden
changes in the
industry would
result in financial
losses. A situation
of continued loss
of sales can result
under utilisation
of resources
allocated.
Closely monitoring developments in its business
domain, including competitor strategies
Explore every available opportunity for the
introduction of new and innovative products
The Company represents global leaders and is in
a position of advantage through technologically
evolving innovative products
Risk Assessment
2011/12 2010/11 2009/10
Likelihood of Occurrence M M L
Impact S S S
Reports from
Principals
Introduction of
new products
by competitors
R I S K M A n AG e M e n t St eWA R d S h I P
Susta inabi l i ty Performance Object ives . . . In 2011/12 112 Enterpr ise Governance 116 Risk Management 128

D I E S E L & M OTO R E N G I N E E R I N G P L C
A N N U A L R E P O RT 2 0 1 1 / 1 2138
Principal Risk Factors andUncertainties
Risk Implication Key Controls and Mitigating Actions Early Warning AlertIndicators
Strategic imperative 4: nurturing people so that they find it enjoyable and rewarding to work with us
Sourcing and Retaining Human Resources Failure to recruit and
retain appropriately
skilled employees.
Unavailability
of appropriately
skilled employees
can adversely
impact the
Company’s ability
to compete and
grow.
Due importance given to the Human Resources
Management function of the Group
Top management involvement in talent management
led by the Human Resources Department
Adoption of Best Practices in Human Resources
Management
Conducting employee satisfaction surveys
Heavy investment in training and development
Policy of Competitive Remuneration
More employee related information is available from
pages 62 to page 79.
Risk Assessment
2011/12 2010/11 2009/10
Likelihood of Occurrence L L L
Impact S S S
Staff turnover
ratio (business
unite wise)
Employees
satisfaction
index
Labour Relations
Healthy industrial
relations is required
for uninterrupted
operations.
Industrial disputes
could cause lower
productivity/
output and
lower employee
engagement.
An 'Open door policy’ is in place to discuss
grievances with superiors
An employee council meets every month to provide
for employee representation
HR clinics are held at all locations where
representatives from HR department visit every
location to listen to employee grievances.
Risk Assessment
2011/12 2010/11 2009/10
Likelihood of Occurrence L L L
Impact S S S
Increases in
number of
grievances.
Unresolved
disputes
between
management
and employees.
St eWA R d S h I P R I S K M A n AG e M e n t
Regulatory Authorit ies . . .P lay ing by the Rules 88 Our Community. . .L ive and Let L ive 90 The Environment . . .Now and for Generat ions Yet Unborn 100
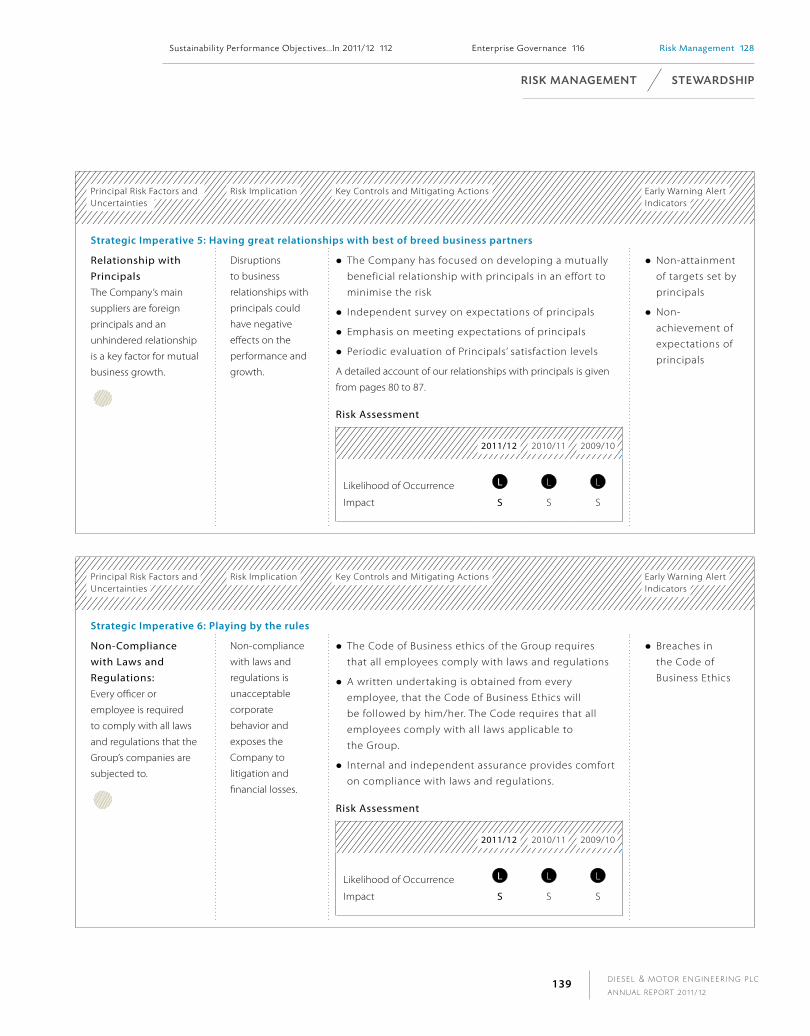
D I E S E L & M OTO R E N G I N E E R I N G P L C
A N N U A L R E P O RT 2 0 1 1 / 1 2139
Principal Risk Factors andUncertainties
Risk Implication Key Controls and Mitigating Actions Early Warning AlertIndicators
Strategic imperative 5: having great relationships with best of breed business partners
Relationship with Principals The Company’s main
suppliers are foreign
principals and an
unhindered relationship
is a key factor for mutual
business growth.
Disruptions
to business
relationships with
principals could
have negative
effects on the
performance and
growth.
The Company has focused on developing a mutually
beneficial relationship with principals in an effort to
minimise the risk
Independent survey on expectations of principals
Emphasis on meeting expectations of principals
Periodic evaluation of Principals’ satisfaction levels
A detailed account of our relationships with principals is given
from pages 80 to 87.
Risk Assessment
2011/12 2010/11 2009/10
Likelihood of Occurrence L L L
Impact S S S
Non-attainment
of targets set by
principals
Non-
achievement of
expectations of
principals
Principal Risk Factors andUncertainties
Risk Implication Key Controls and Mitigating Actions Early Warning AlertIndicators
Strategic imperative 6: playing by the rules
Non-Compliance with Laws and Regulations:Every officer or
employee is required
to comply with all laws
and regulations that the
Group’s companies are
subjected to.
Non-compliance
with laws and
regulations is
unacceptable
corporate
behavior and
exposes the
Company to
litigation and
financial losses.
The Code of Business ethics of the Group requires
that all employees comply with laws and regulations
A written undertaking is obtained from every
employee, that the Code of Business Ethics will
be followed by him/her. The Code requires that all
employees comply with all laws applicable to
the Group.
Internal and independent assurance provides comfort
on compliance with laws and regulations.
Risk Assessment
2011/12 2010/11 2009/10
Likelihood of Occurrence L L L
Impact S S S
Breaches in
the Code of
Business Ethics
R I S K M A n AG e M e n t St eWA R d S h I P
Susta inabi l i ty Performance Object ives . . . In 2011/12 112 Enterpr ise Governance 116 Risk Management 128
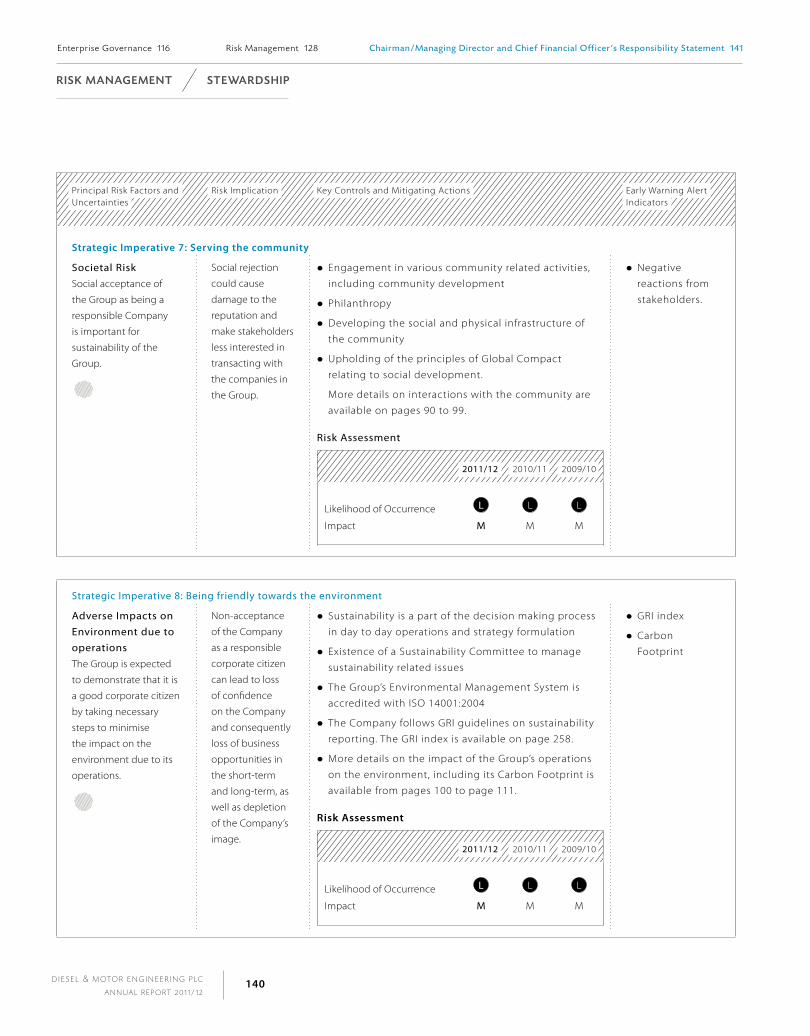
D I E S E L & M OTO R E N G I N E E R I N G P L C
A N N U A L R E P O RT 2 0 1 1 / 1 2140
Principal Risk Factors andUncertainties
Risk Implication Key Controls and Mitigating Actions Early Warning AlertIndicators
Strategic imperative 7: Serving the community
Societal RiskSocial acceptance of
the Group as being a
responsible Company
is important for
sustainability of the
Group.
Social rejection
could cause
damage to the
reputation and
make stakeholders
less interested in
transacting with
the companies in
the Group.
Engagement in various community related activities,
including community development
Philanthropy
Developing the social and physical infrastructure of
the community
Upholding of the principles of Global Compact
relating to social development.
More details on interactions with the community are
available on pages 90 to 99.
Risk Assessment
2011/12 2010/11 2009/10
Likelihood of Occurrence L L L
Impact M M M
Negative
reactions from
stakeholders.
Strategic Imperative 8: Being friendly towards the environment
Adverse Impacts on Environment due to operationsThe Group is expected
to demonstrate that it is
a good corporate citizen
by taking necessary
steps to minimise
the impact on the
environment due to its
operations.
Non-acceptance
of the Company
as a responsible
corporate citizen
can lead to loss
of confidence
on the Company
and consequently
loss of business
opportunities in
the short-term
and long-term, as
well as depletion
of the Company’s
image.
Sustainability is a part of the decision making process
in day to day operations and strategy formulation
Existence of a Sustainability Committee to manage
sustainability related issues
The Group’s Environmental Management System is
accredited with ISO 14001:2004
The Company follows GRI guidelines on sustainability
reporting. The GRI index is available on page 258.
More details on the impact of the Group’s operations
on the environment, including its Carbon Footprint is
available from pages 100 to page 111.
risk assessment
2011/12 2010/11 2009/10
Likelihood of Occurrence L L L
Impact M M M
GRI index
Carbon
Footprint
R I S K M A n AG e M e n t St eWA R d S h I P
Enterpr ise Governance 116 Risk Management 128 Chairman/Managing Director and Chief F inancia l Off icer’s Responsibi l i ty Statement 141

D I E S E L & M OTO R E N G I N E E R I N G P L C
A N N U A L R E P O RT 2 0 1 1 / 1 2141
C h A I R M A n / M A n AG I n G d I R eC to R A n d St eWA R d S h I P
C h I E f f I N A N C I A L O f f I C E R ’ S R E S P O N S I b I L I T y STAT E M E N T
The Financial Statements are prepared in compliance with the requirements of the followings;
Sri Lanka Accounting Standards issued by The Institute of Chartered Accountants of Sri Lanka,
Companies Act No. 07 of 2007,
Listing Rules of the Colombo Stock Exchange and
Sri Lanka Accounting and Auditing Standards Act No. 15 of 1995.
The Accounting Policies used in the preparation of the Financial Statements are appropriate and
are consistently applied, except unless otherwise stated in the notes accompanying the Financial
Statements. Comparative information has been reclassified wherever necessary to comply with the
current presentation. The Significant Accounting Policies and estimates that involved a high degree
of judgment and complexity were discussed with the Audit Committee.
The Board of Directors and the management of the Company accept responsibility for the integrity
and objectivity of these Financial Statements. The estimates and judgments relating to the Financial
Statements were made on a prudent and reasonable basis, in order that the Financial Statements
reflect in a true and fair manner, the form and substance of transactions, and reasonably present
the Company’s state of affairs.
To ensure this, the Company has taken proper and sufficient care in installing a system of internal
control and accounting records, for safeguarding assets, and for preventing and detecting frauds as
well as other irregularities, which is reviewed, evaluated and updated on an ongoing basis.
The Internal Auditors have conducted periodic audits to provide reasonable assurance that the
established policies and procedures of the Company were consistently followed. However, there are
inherent limitations that should be recognised in weighing the assurances provided on any system of
internal controls and accounting.
The Financial Statements were audited by Messrs KPMG, the Independent Auditors.
The Audit Committee of the Company meets periodically with the Internal Auditors and the
Independent Auditors to review the manner in which these auditors are performing their
responsibilities, and to discuss auditing, internal control and financial reporting issues. To ensure
complete independence, the Independent Auditors and the Internal Auditors have full and free
access to the members of the Audit Committee to discuss any matter of substance.
a.r. pandithage B.C.S.a.p. gooneratneChairman/Managing Director Chief Financial Officer
Colombo
30th May 2012
Report of the Audit Committee 142 The Remunerat ion Committee Report 144 Report of the Nominat ion Committee 145
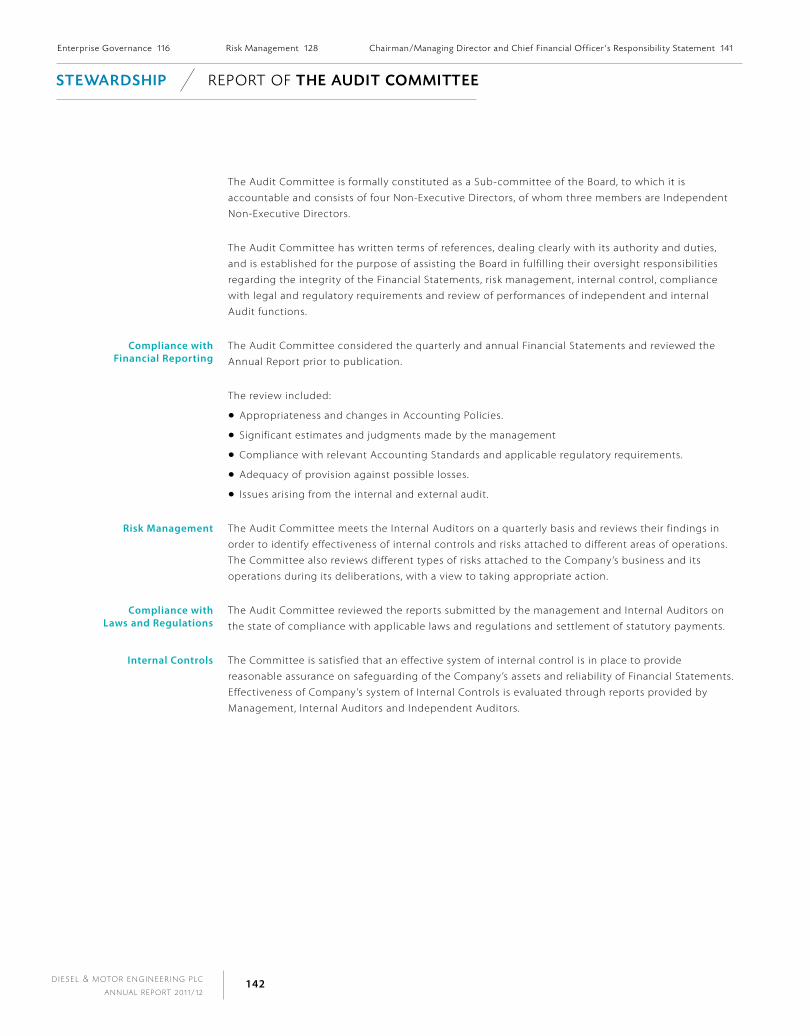
D I E S E L & M OTO R E N G I N E E R I N G P L C
A N N U A L R E P O RT 2 0 1 1 / 1 2142
St eWA R d S h I P R E P O RT O F t h e AU d I t Co M M I tt e e
The Audit Committee is formally constituted as a Sub-committee of the Board, to which it is
accountable and consists of four Non-Executive Directors, of whom three members are Independent
Non-Executive Directors.
The Audit Committee has written terms of references, dealing clearly with its authority and duties,
and is established for the purpose of assisting the Board in fulfilling their oversight responsibilities
regarding the integrity of the Financial Statements, risk management, internal control, compliance
with legal and regulatory requirements and review of performances of independent and internal
Audit functions.
Compliance with financial reporting
The Audit Committee considered the quarterly and annual Financial Statements and reviewed the
Annual Report prior to publication.
The review included:
Appropriateness and changes in Accounting Policies.
Significant estimates and judgments made by the management
Compliance with relevant Accounting Standards and applicable regulatory requirements.
Adequacy of provision against possible losses.
Issues arising from the internal and external audit.
risk management The Audit Committee meets the Internal Auditors on a quarterly basis and reviews their findings in
order to identify effectiveness of internal controls and risks attached to different areas of operations.
The Committee also reviews different types of risks attached to the Company’s business and its
operations during its deliberations, with a view to taking appropriate action.
Compliance with laws and regulations
The Audit Committee reviewed the reports submitted by the management and Internal Auditors on
the state of compliance with applicable laws and regulations and settlement of statutory payments.
internal Controls The Committee is satisfied that an effective system of internal control is in place to provide
reasonable assurance on safeguarding of the Company’s assets and reliability of Financial Statements.
Effectiveness of Company’s system of Internal Controls is evaluated through reports provided by
Management, Internal Auditors and Independent Auditors.
Enterpr ise Governance 116 Risk Management 128 Chairman/Managing Director and Chief F inancia l Off icer ’s Responsib i l i ty Statement 141
D I E S E L & M OTO R E N G I N E E R I N G P L C
A N N U A L R E P O RT 2 0 1 1 / 1 2143
internal auditors The internal audit function is outsourced to Messrs SJMS Associates, a firm of Chartered Accountants.
Internal Auditors directly submitted their findings to Audit Committee quarterly and their reports are
made available to Independent Auditors.
The Audit Committee monitors and reviews:
The coverage of the annual audit plan
The follow-up action taken on the recommendation of the Internal Auditors
The internal audit programmers and results of the internal audit process.
Effectiveness of the internal audit function.
independent auditors The Audit Committee reviewed the independence and objectivity of the Independent Auditors
Messrs KPMG, Chartered Accountants. The Audit Committee has met with the External Auditors to
review the annual audit plan and Financial Statements during the annual audit.
The Committee has received a declaration from the Independent Auditors, confirming that they do
not have any relationship or interest in the Company or its subsidiaries as required by the Companies
Act No. 07 of 2007.
The Committee reviewed the non-audit services and its impact on the independence of the
Independent Auditors.
The Audit Committee has approved the extension of period of engagement of Independent Auditors,
by one year, and recommended to the Board their reappointment.
meetings of audit Committee Seven Audit Committee meetings were held during the year ended 31st March 2012. The attendance
details are given on page 232. The Internal Auditors attend the meetings quarterly.
Conclusion The Audit Committee is satisfied that the effectiveness of the organisational structure of the Group
and of the implementation of the Group’s Accounting Policies and operational controls provide
reasonable assurance that the affairs of the Group are managed in accordance with Group policies
and that the Group assets are properly accounted for and adequately safeguarded.
r. SeevaratnamChairman - Audit Committee
Colombo
30th May 2012
Report of the Audit Committee 142 The Remunerat ion Committee Report 144 Report of the Nominat ion Committee 145
R e P o Rt o F t h e AU d I t Co M M I tt e e St eWA R d S h I P

D I E S E L & M OTO R E N G I N E E R I N G P L C
A N N U A L R E P O RT 2 0 1 1 / 1 2144
St eWA R d S h I P t h e R e M U n e R At I o n CO M M I TT E E R E P O RT
The Remuneration Committee is a subcommittee of the Board. The members of the committee consist
of three Independent Directors and a Non-Executive Director. The Chairman of the Committee who is
an Independent Director and the members of the Committee were appointed by the Board.
The committee was established for the purpose of recommending the remuneration of the Board of
Directors including Chairman/Managing Director, Chief Executive Officer and the Executive Directors.
The Committee has acted within the parameters set by its terms of reference.
The Chairman attends the Committee meetings by invitation. He does not participate in any
discussion pertaining to his remuneration. The decisions on matters relating to remuneration of
Executive Directors and Senior Members of the management team were arrived at in consultation
with Chairman/Managing Director. No Director is involved in determining his own remuneration.
Our remuneration policy is designed to reward, motivate and retain the Company’s executive team,
with market competitive remuneration and benefits to support the continued success of our business
and the creation of stakeholder value.
The remuneration packages which are linked to individual performances are aligned with the
Company’s short-term and long-term strategy. The Committee makes every endeavor to maintain
remuneration levels that are sufficient to attract and retain Executive Directors and Members of the
Senior Management team.
All Non-Executive Directors receive a fee for serving on the Board meetings and on sub-committees.
They do not receive any performance-based incentive payments.
The Directors’ emoluments are disclosed on page 184.
The Committee meets as and when a need arises. The Remuneration Committee meetings and
members attendance is given on page 232.
prof. u.p. liyanageChairman - Remuneration Committee
Colombo
30th May 2012
Enterpr ise Governance 116 Risk Management 128 Chairman/Managing Director and Chief F inancia l Off icer ’s Responsib i l i ty Statement 141
D I E S E L & M OTO R E N G I N E E R I N G P L C
A N N U A L R E P O RT 2 0 1 1 / 1 2145
R E P O RT O F t h e n o M I n At I o n Co M M I tt e e St eWA R d S h I P
introduction The main purpose of the Committee is to assist the Board by keeping the composition of the
Board under review and conducting a rigorous and transparent process when making or renewing
appointments of Directors to the Board. It also advises the Board on issues of Directors’ conflicts
of interest and independence. The Chairman and the members of the Nomination Committee are
appointed by the Board of Directors.
Committee Composition and its key activities
The Committee composition and their attendance details are given in page 232 of Corporate
Governance Report.
The Committee has acted within the parameters set by its terms of reference.
The Committee met on one occasion in 2011/12 and the members’ attendance record is set out in
the Enterprises Governance report on page 232.
The key activities carried out during the year by the Committee are as follows:
Review the structure, size and composition of the Board.
Evaluate the independence and effectiveness of the Non-Executive Directors.
Review the process for succession planning to ensure that the Board has the correct balance of
individuals to discharge its duties effectively.
Evaluate performance of Executive Directors.
The Committee is satisfied that the combined knowledge and experience of the Board matches the
strategic demands faced by the Company.
dr. h. CabralChairman - Nomination Committee
Colombo 30th May 2012
Report of the Audit Committee 142 The Remunerat ion Committee Report 144 Report of the Nomination Committee 145


Topics Page
Annual Report of the Board of Directors 149
Annex to the Annual Report of the Board of Directors 157
Statement of Directors’ Responsibilities for the Financial Statements 159
Independent Auditors’ Report 161
Income Statement 162
Balance Sheet 163
Statement of Changes in Equity 164
Cash Flow Statement 165
Notes to the Financial Statements 167
Financial RepoRTsThe Financial Reports that follow are prepared and presented in accordance
with Sri Lanka Accounting Standards and also comply with the requirements
of the Companies Act No. 07 of 2007.

FINANCIAL CALENDAR
Interim Financial Statements Three months ended 30th June 2011 - 9th August 2011Six months ended 30th September 2011 - 27th October 2011Nine months ended 31st December 2011 - 13th February 2012Twelve months ended 31st March 2012 - 30th May 2012
Dividends1st Interim Dividend paid for 2011/12 - 6th December 20112nd Interim Dividend paid for 2011/12 - 5th March 2012Final Dividend for 2011/12 - 20th June 2012
Annual Report - Financial year ended 31st March 2012 - 30th May 201267th Annual General Meeting - 29th June 2012

D I E S E L & M OTO R E N G I N E E R I N G P L C
A N N U A L R E P O RT 2 0 1 1 / 1 2149
General
The Board of Directors of Diesel & Motor Engineering PLC has pleasure in presenting the Annual
Report of the Board of Directors and audited Group Financial Statements for the year ended
31st March 2012.
principal activities
The principal activities of the Company/Group include import, sale and repair of passenger cars,
commercial vehicles, material handling machinery, storage systems, construction machinery,
agri machinery, medical equipment, power engineering solutions, power engines, power tools,
import & sale of vehicle spares, components, accessories and lighting products.
There was no significant change in the nature of business of the Company or its subsidiaries during
the year that may have a significant impact on the state of the Company’s affairs.
Group structure
A diagram depicting the Group Structure is available on page 246.
Business Review and Future Developments
A review of financial and operational performance and future business developments of the Group
is contained in the Chairman’s Letter (pages 10 to 15), Management Report (pages 1 to 113) and in
the section identified as ‘This is Dimo’ (Inner Front Cover). These Reports together with the Audited
Financial Statements reflect the state of affairs of the Company and the Group.
Financial statements
The Financial Statements of the Company and the Group appearing on pages 162 to 203 are prepared
in conformity with the Sri Lanka Accounting Standards as required by Sri Lanka Accounting and
Auditing Standards Act No. 15 of 1995 and comply with the requirements of the Companies Act
No. 07 of 2007.
Financial Statements of the Company and the Group for the year ended 31st March 2012 which
have been certified by the General Manager - Finance and Controlling that they conform to the
requirements of the Companies Act No. 07 of 2007 and duly signed by the Chairman/Managing
Director and the Chief Financial Officer, are given on page 163, which form an integral part of the
Annual Report of the Directors.
auditors’ Report
The Financial Statements for the year ended 31st March 2012 have been audited by Messrs KPMG,
(Chartered Accountants) and their Report is given on page 161.
significant accounting policies
The Significant Accounting Policies adopted in the preparation of Financial Statements are given on
pages 167 to 180 of the Annual Report.
There were no material changes in the Accounting Policies adopted with those of last year.
A n n uA l R e p o Rt o f t h e b oa r d o f d i r ec to r s f I n A n C I A l R e p o RtS
annex to the annual report of the board of directors 157 statement of directors ’ responsib i l i t ies for the f inancia l statements 159
D I E S E L & M OTO R E N G I N E E R I N G P L C
A N N U A L R E P O RT 2 0 1 1 / 1 2150
f I n A n C I A l R e p o RtS A n n uA l R e p o Rt o f t h e b oA R d o f d I R eC to R S
impairment assessment
The Board of Directors has evaluated impairment loss in relation to property, plant & equipment,
intangible assets and long-term investments.
Based on an assessment of impairment carried out by the Board of Directors as at 31st March 2012,
a reversal of Rs. 2.795 mn was made in respect of investments in subsidiaries, the details of which are
given in Note 18.1 of the Financial Statements appearing on page 191.
Directorate
list of Directors
As at 31st March 2012, the Board of Directors of Diesel & Motor Engineering PLC consisted of
eleven members. Qualifications and experience of the Directors are given on page 235.
of this Annual Report.
Following were the Directors of the Company at the end of the financial year:
A.R. Pandithage (Chairman, Managing Director and Chief Executive Officer)
A.G. Pandithage (Deputy Chief Executive Officer)
A.N. Algama (Executive Director)
S.C. Algama (Executive Director)
Dr. H. Cabral (Independent Non-Executive Director)
B.C.S.A.P. Gooneratne (Executive Director)
Prof. U.P. Liyanage (Independent Non-Executive Director)
A.M. Pandithage (Non-Executive Director)
T.G.H. Peries (Executive Director)
R. Seevaratnam (Independent Non-Executive Director)
R.C. Weerawardane (Executive Director)
Resignations, new appointments and Re-elections to the Board
There were no new appointments made to the Board, during the financial year ended
31st March 2012.
Mr. A.G. Pandithage, Director, was appointed the Chief Executive Officer with effect from
1st April 2012. Mr. A.R. Pandithage will hold the position of Chairman/Managing Director with
effect from 1st April 2012.
Dr. H. Cabral, Mr. B.C.S.A.P. Gooneratne, Mr. A.G. Pandithage and Mr. R.C. Weerawardane retired by
rotation at the Annual General Meeting held on 30th June 2011 and were reappointed to the Board in
accordance with the Articles by re-election at the same meeting.
Mr. A.N. Algama, Mr. S.C. Algama, Mr. A.M. Pandithage and Prof. U.P. Liyanage retire by rotation in
accordance with the Articles of Association and being eligible offer themselves for re-election at the
forthcoming Annual General Meeting.
Directors’ Responsibilities for the Financial statements
The Directors are responsible for the preparation and presentation of Financial Statements of
the Company to reflect a true and fair view of the state of its affairs. The Statement of Directors’
Responsibilities for the Financial Statements is given on pages 159 and 160 of this Annual Report.
the remunerat ion committee report 144 report of the Nominat ion committee 145 annual report of the board of directors 149
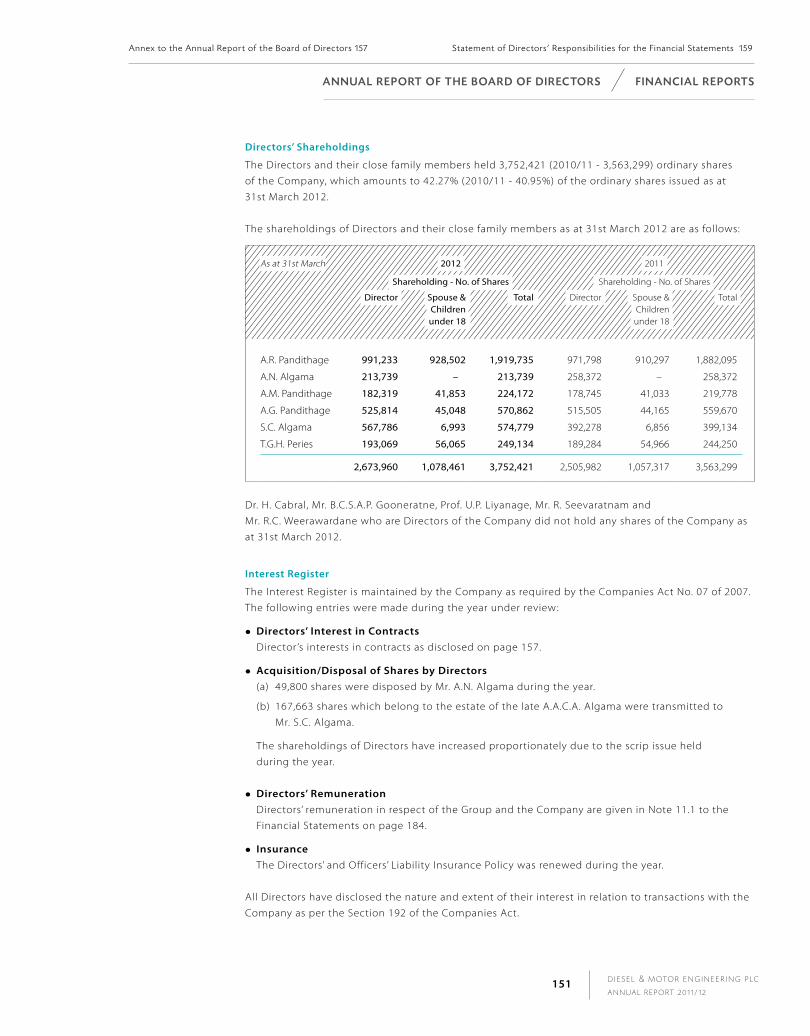
D I E S E L & M OTO R E N G I N E E R I N G P L C
A N N U A L R E P O RT 2 0 1 1 / 1 2151
A n n uA l R e p o Rt o f t h e b oA R d o f d I R eC to R S f I n A n C I A l R e p o RtS
Directors’ shareholdings
The Directors and their close family members held 3,752,421 (2010/11 - 3,563,299) ordinary shares
of the Company, which amounts to 42.27% (2010/11 - 40.95%) of the ordinary shares issued as at
31st March 2012.
The shareholdings of Directors and their close family members as at 31st March 2012 are as follows:
As at 31st March 2012 2011
Shareholding - No. of Shares Shareholding - No. of Shares
Director Spouse & Children under 18
Total Director Spouse &Childrenunder 18
Total
A.R. Pandithage 991,233 928,502 1,919,735 971,798 910,297 1,882,095
A.N. Algama 213,739 – 213,739 258,372 – 258,372
A.M. Pandithage 182,319 41,853 224,172 178,745 41,033 219,778
A.G. Pandithage 525,814 45,048 570,862 515,505 44,165 559,670
S.C. Algama 567,786 6,993 574,779 392,278 6,856 399,134
T.G.H. Peries 193,069 56,065 249,134 189,284 54,966 244,250
2,673,960 1,078,461 3,752,421 2,505,982 1,057,317 3,563,299
Dr. H. Cabral, Mr. B.C.S.A.P. Gooneratne, Prof. U.P. Liyanage, Mr. R. Seevaratnam and
Mr. R.C. Weerawardane who are Directors of the Company did not hold any shares of the Company as
at 31st March 2012.
interest Register
The Interest Register is maintained by the Company as required by the Companies Act No. 07 of 2007.
The following entries were made during the year under review:
Directors’ interest in contracts Director ’s interests in contracts as disclosed on page 157.
acquisition/Disposal of shares by Directors(a) 49,800 shares were disposed by Mr. A.N. Algama during the year.
(b) 167,663 shares which belong to the estate of the late A.A.C.A. Algama were transmitted to
Mr. S.C. Algama.
The shareholdings of Directors have increased proportionately due to the scrip issue held
during the year.
Directors’ Remuneration Directors’ remuneration in respect of the Group and the Company are given in Note 11.1 to the
Financial Statements on page 184.
insurance The Directors’ and Officers’ Liability Insurance Policy was renewed during the year.
All Directors have disclosed the nature and extent of their interest in relation to transactions with the
Company as per the Section 192 of the Companies Act.
annex to the annual report of the board of directors 157 statement of directors ’ responsib i l i t ies for the f inancia l statements 159

D I E S E L & M OTO R E N G I N E E R I N G P L C
A N N U A L R E P O RT 2 0 1 1 / 1 2152
During the year, there were no instances pertaining to the voting on matters on which Directors had
a material interest.
Board and Board committee Meetings
The number of Directors’ meetings which comprise Board meetings, Audit Committee meetings,
Nomination Committee meetings and Remuneration Committee meetings and the attendance of
Directors at these meetings are given on page 232.
internal control system and Risk Management
The Board considers that strong internal controls are integral to sound management of the Company
and is committed to maintaining financial, operational and risk management controls over all its
activities. The Group Management Committee has put in place an effective and comprehensive
system of internal controls.
The Enterprise Risk Management Report is available on pages 128 to 140.
The Board is satisfied with the effectiveness of the system of internal controls for the year under
review and up to the date of approval of the Annual Report and the Financial Statements.
Board committees
The Board, while assuming the overall responsibility and accountability for the affairs in the
management of the Company, has appointed committees with specific terms of reference.
Accordingly, the following committees have been constituted by the Board:
Audit Committee
Remuneration Committee
Nomination Committee
The reports of the above committees are given on pages 142 to 145 of this Annual Report.
auditors
The Company’s Independent Auditors during the period under review were Messrs KPMG,
Chartered Accountants.
The Auditors were paid Rs. 1.928 mn for the year ended 31st March 2012 (2010/11 - 1.746 mn) as
audit fees by the Group. In addition, Auditors were paid Rs. 0.991 mn (2010/11 - Rs. 0.262 mn) for
audit-related services and Rs. 2.272 mn (2010/11 - Rs. 2.470 mn) for non-audit services, by the Group.
f I n A n C I A l R e p o RtS A n n uA l R e p o Rt o f t h e b oA R d o f d I R eC to R S
the remunerat ion committee report 144 report of the Nominat ion committee 145 annual report of the board of directors 149
D I E S E L & M OTO R E N G I N E E R I N G P L C
A N N U A L R E P O RT 2 0 1 1 / 1 2153
Based on the declaration made by Messrs KPMG, Chartered Accountants and as far as the Directors are
aware, the Auditors do not have any other relationship or interest in contracts with the Company or
with any of its Subsidiaries.
appointment of auditors
The retiring Auditors - Messrs KPMG, (Chartered Accountants) are willing to continue in office.
A resolution on reappointing them as Auditors and granting authority to the Directors to decide their
remuneration will be proposed at the Annual General Meeting.
Turnover
The Company recorded a turnover of Rs. 38,937 mn in 2011/12 (2010/11 - Rs. 28,662 mn). The Group
turnover for 2011/12 was Rs. 39,899 mn (2010/11 - Rs. 29,357 mn).
Segment turnover and other segment information are available on pages 181 and 182.
Human Resources
The Group promotes to its employees the need for the highest standards of integrity and ethics in
business dealings, including compliance with all relevant legislation and codes of practice. Employees
are regarded as the key to translating policies and strategies into commercial success. The Group is
committed to providing a working environment in which this process can succeed.
Adequate measures are taken to ensure that all employees have the opportunity to understand
and appreciate the Group’s objectives and policies. The employment policy of the Group embodies
the principle of equal opportunity. The Group aims to create an opportunity for participation and
involvement, identification and development of skills and promote use of initiative and personal
advancement. Reward systems recognise success at both the corporate and individual level.
The number of persons employed by the Company and its Subsidiaries at the year end was 1,339
(2010/11 - 1,019).
Health and safety
The Group safeguards occupational health and hygiene of its employees by providing a safe working
environment and complying with all relevant statutory obligations. The Group also has an employees’
medical scheme and expenditure in relation to this for the year was Rs. 25.1 mn (2010/11 - Rs. 9.47 mn).
Quality
The Group is committed to maintain its long established reputation of being a symbol of quality.
All employees are encouraged to regard continuous improvement of quality standards as a key to
competitive advantage.
A n n uA l R e p o Rt o f t h e b oA R d o f d I R eC to R S f I n A n C I A l R e p o RtS
annex to the annual report of the board of directors 157 statement of directors ’ responsib i l i t ies for the f inancia l statements 159

D I E S E L & M OTO R E N G I N E E R I N G P L C
A N N U A L R E P O RT 2 0 1 1 / 1 2154
operational Results and Dividends of the Group
2011/12Rs. ’000
2010/11 Rs. ‘000
Turnover
Gross Turnover 39,898,589 29,357,271
Profit
After making provision for bad and doubtful debts and all known liabilities
and after charging a sum of Rs. 135.164 mn (2010/11 - Rs. 93.100 mn) for
Depreciation of property, plant & equipment the profit made by the Group
before tax was 3,716,034 3,395,980
Income tax expense (1,018,709) (1,274,228)
Group profit after taxation 2,697,325 2,121,752
Retained earnings brought forward 2,213,445 563,526
Appropriations
Dividend paid (Cash and Scrip dividend) (554,777) (121,833)
Transfers to general reserve (1,648,000) (350,000)
Available for appropriation 2,707,993 2,213,445
Dividends on ordinary shares
Two interim dividends of Rs. 5.00 and Rs. 7.50 per share were paid during the year 2011/12 (2010/11 - Two
interim dividend of Rs. 5.00 per share each). Information on dividends is given in Note 14 to the Financial
Statements on page 187.
The Directors approved a final dividend of Rs. 27.50 per share payable to the shareholders of the
Company for the year ended 31st March 2012 (2010/11 Final dividend of Rs. 51.00 per share of which
Rs. 23.10 per share was a cash dividend and Rs. 27.90 in the form of a scrip dividend).
As required by Section 56 (2) of the Companies Act No. 07 of 2007, the Board of Directors determined
that the Company has satisfied the solvency test in accordance with Section 57 of the Companies Act
and obtained a certificate from the Independent Auditors to this effect, prior to payment of dividends.
income Tax
It is the Group’s policy to provide for deferred taxation on all known temporary differences under
liability method, as permitted by Sri Lanka Accounting Standard No. 14 on ‘Income Taxes’. The income
tax rate that was applicable to all companies in the Group for the financial year was 28%. Tax on
export profit was 12%. Information on Income Tax Expense and Deferred Taxes of the Group and
the Company is given in Notes 12 and 27 to the Financial Statements on pages 185,186, 195 and
196 respectively.
statutory payments
The Directors, to the best of their knowledge and belief, confirm that all statutory payments due to
the Government, other regulatory institutions and related to employees have been made on time
during the financial year.
Donations
The Donations made during the year amounted to Rs. 27.10 mn (2010/11 - Rs. 22.42 mn).
f I n A n C I A l R e p o RtS A n n uA l R e p o Rt o f t h e b oA R d o f d I R eC to R S
the remunerat ion committee report 144 report of the Nominat ion committee 145 annual report of the board of directors 149
D I E S E L & M OTO R E N G I N E E R I N G P L C
A N N U A L R E P O RT 2 0 1 1 / 1 2155
property, plant & equipment
Group investment on property, plant & equipment, capital work in progress and intangible assets
during the year amounted to Rs. 951 mn (2010/11 - Rs. 1,082 mn). Information relating to movement
in property, plant & equipment is given in Notes 15, 16 and 17 to the Financial Statements.
Market Value of Freehold land
A qualified independent valuer carried out a revaluation of the Company’s freehold land on
30th September 2011 and the carrying value of the freehold land has been adjusted accordingly.
The details of the freehold land owned by the Company are given in Note 15.a to the Financial
Statements on page 189.
Group investment
There were no new equity investments made during the year. Information relating to investments
other than in subsidiaries is available in Notes 19 to the Financial Statement on page 192.
changes to Business operations
There were no significant changes in the nature of the principal activities of the Company and the
Group during the financial year under review.
stated capital
The stated capital of the Company as at 31st March 2012 was Rs. 425.3 mn (2010/11 - Rs. 182.5 mn).
The number of shares in issue as at 31st March 2012 was 8,876,437 (2010/11 - 8,702,389). The increase
in stated capital and number of shares in issue was due to the scrip dividend in May 2011.
Reserves
The total reserves as at 31st March 2012 stood at Rs. 7,040 mn (2010/11 - Rs. 4,018.3 mn), comprising
capital reserves of Rs. 2,014.8 mn (2010/11 - Rs. 1,135.6 mn) and revenue reserves of Rs. 5,025.3 mn
(2010/11 - Rs. 2,882.7 mn). The movement in reserves during the year is set out in the Statement of
Changes in Equity on page 164.
share information
Information relating to shareholding, earnings, net assets per share, market value of shares, dividends
and share trading is available on pages 237 to 240.
shareholding
There were 1,865 registered shareholders as at 31st March 2012. The percentage of shares held by
the public as at 31st March 2012 was 44.29% of the issued shares. The twenty major shareholders as at
31st March 2012 and the number of shares held and their percentage shareholdings are given on
page 240.
equitable Treatment to shareholders
The Company at all times ensures that all shareholders are treated equitably.
compliance with laws and Regulations
To the best of knowledge and belief of the Directors, the Company has not engaged in any activity
contravening the laws and regulations of the country.
A n n uA l R e p o Rt o f t h e b oA R d o f d I R eC to R S f I n A n C I A l R e p o RtS
annex to the annual report of the board of directors 157 statement of directors ’ responsib i l i t ies for the f inancia l statements 159

D I E S E L & M OTO R E N G I N E E R I N G P L C
A N N U A L R E P O RT 2 0 1 1 / 1 2156
outstanding litigation
In the opinion of the Directors and in consultation with the Company Lawyers and legal counsel,
litigations currently pending against the Company will not have a material impact on the reported
financial results or future operations of the Company. The details of the litigation against the
Company are given in Note 34.3 to the Financial Statements on page 203.
convergence with slFRs/lKas
The Institute of Chartered Accountants of Sri Lanka has issued a new volume of Sri Lanka Accounting
Standards which has become applicable for financial periods beginning on or after 1st January
2012. These Sri Lanka Accounting Standards comprise Accounting Standards prefixed both SLFRS
(Corresponding to IFRS) and LKAS (corresponding to IAS). Accordingly, the Company/Group will be
reporting under the new financial reporting framework with SLFRS and LKAS, from the next financial
year. The Company/Group has evaluated the potential impact on adoption of the new reporting
framework and based on the assessment of the management, there will be no significant impact on
the Financial Statements.
events occurring after the Balance sheet Date
There were no material events that occurred subsequent to the date of the Balance Sheet, which
require adjustments to or disclosure in the Financial Statements, except what is stated in Note 35 to
the Financial Statements on page 203.
commitments and contingencies
Information on contingent liabilities and capital commitments as at 31st March 2012 is given in
Note 34 to the Financial Statements on page 203.
Going concern
The Board of Directors has reviewed Group’s Budget, availability of banking facilities and other
necessary information and is satisfied that the Group has adequate resources to continue in business
for the foreseeable future. Accordingly, going concern basis has been adopted in preparation of the
Financial Statements.
annual General Meeting
The Annual General Meeting will be held at the Registered Office of the Company, No. 65, Jetawana
Road, Colombo 14 on 29th June 2012. The Notice of Annual General Meeting is given on page 261.
By order of the Board of Directors,
a.R. pandithage a.G. pandithageChairman/Managing Director Director/Chief Executive Officer
B.c.s.a.p. GooneratneDirector/Secretary
Colombo
30th May 2012
f I n A n C I A l R e p o RtS A n n uA l R e p o Rt o f t h e b oA R d o f d I R eC to R S
the remunerat ion committee report 144 report of the Nominat ion committee 145 annual report of the board of directors 149
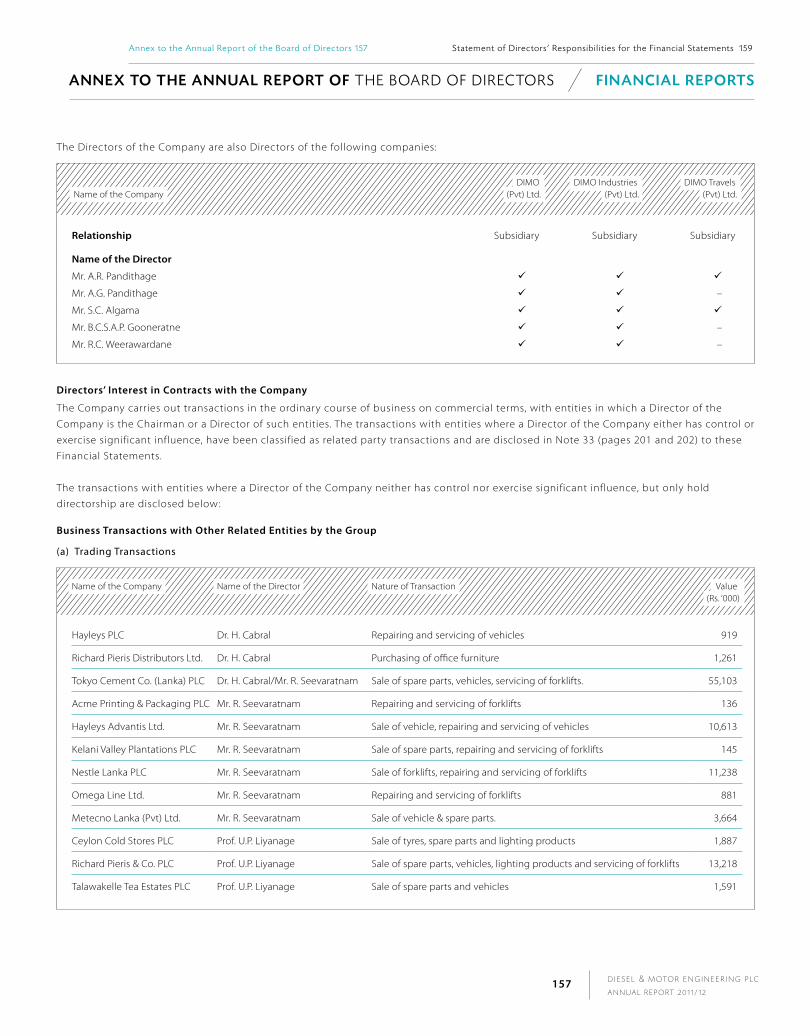
D I E S E L & M OTO R E N G I N E E R I N G P L C
A N N U A L R E P O RT 2 0 1 1 / 1 2157
The Directors of the Company are also Directors of the following companies:
Name of the CompanyDIMO
(Pvt) Ltd.DIMO Industries
(Pvt) Ltd.DIMO Travels
(Pvt) Ltd.
Relationship Subsidiary Subsidiary Subsidiary
name of the Director
Mr. A.R. Pandithage
Mr. A.G. Pandithage –
Mr. S.C. Algama
Mr. B.C.S.A.P. Gooneratne –
Mr. R.C. Weerawardane –
Directors’ interest in contracts with the company
The Company carries out transactions in the ordinary course of business on commercial terms, with entities in which a Director of the
Company is the Chairman or a Director of such entities. The transactions with entities where a Director of the Company either has control or
exercise significant influence, have been classified as related party transactions and are disclosed in Note 33 (pages 201 and 202) to these
Financial Statements.
The transactions with entities where a Director of the Company neither has control nor exercise significant influence, but only hold
directorship are disclosed below:
Business Transactions with other Related entities by the Group
(a) Trading Transactions
Name of the Company Name of the Director Nature of Transaction Value (Rs. ‘000)
Hayleys PLC Dr. H. Cabral Repairing and servicing of vehicles 919
Richard Pieris Distributors Ltd. Dr. H. Cabral Purchasing of office furniture 1,261
Tokyo Cement Co. (Lanka) PLC Dr. H. Cabral/Mr. R. Seevaratnam Sale of spare parts, vehicles, servicing of forklifts. 55,103
Acme Printing & Packaging PLC Mr. R. Seevaratnam Repairing and servicing of forklifts 136
Hayleys Advantis Ltd. Mr. R. Seevaratnam Sale of vehicle, repairing and servicing of vehicles 10,613
Kelani Valley Plantations PLC Mr. R. Seevaratnam Sale of spare parts, repairing and servicing of forklifts 145
Nestle Lanka PLC Mr. R. Seevaratnam Sale of forklifts, repairing and servicing of forklifts 11,238
Omega Line Ltd. Mr. R. Seevaratnam Repairing and servicing of forklifts 881
Metecno Lanka (Pvt) Ltd. Mr. R. Seevaratnam Sale of vehicle & spare parts. 3,664
Ceylon Cold Stores PLC Prof. U.P. Liyanage Sale of tyres, spare parts and lighting products 1,887
Richard Pieris & Co. PLC Prof. U.P. Liyanage Sale of spare parts, vehicles, lighting products and servicing of forklifts 13,218
Talawakelle Tea Estates PLC Prof. U.P. Liyanage Sale of spare parts and vehicles 1,591
A n n e x to t h e A n n uA l R e p o Rt o f t h e b oa r d o f d i r ec to r s f I n A n C I A l R e p o RtS
annex to the annual report of the board of directors 157 statement of directors ’ responsib i l i t ies for the f inancia l statements 159

D I E S E L & M OTO R E N G I N E E R I N G P L C
A N N U A L R E P O RT 2 0 1 1 / 1 2158
(b) Banking Facilities
Banking FacilitiesName of the Bank Name of the Director Nature of Transaction Limit
(Rs. ‘000)Outstanding
as at 31st March 2012
(Rs. ‘000)
Commercial Bank of
Ceylon PLC
Prof. U.P. Liyanage Long-term loan 400,000 236,830
Import loan 1,675,000 462,256
Letter of Credit facility 1,725,000 497,219
Overdraft facility 65,000 51,940
Guarantee facility 700,000 81,689
Shipping guarantee/Advance documents 800,000 218,434
f I n A n C I A l R e p o RtS A n n e x to t h e A n n uA l R e p o Rt o f t h e b oA R d o f d I R eC to R S
the remunerat ion committee report 144 report of the Nominat ion committee 145 annual report of the board of directors 149
D I E S E L & M OTO R E N G I N E E R I N G P L C
A N N U A L R E P O RT 2 0 1 1 / 1 2159
The Companies Act No. 07 of 2007 requires the Directors to prepare and present Financial Statements
for each financial year giving a true and fair view of the state of affairs of the Company and the
Group as at the end of the financial year and the profit or loss of the Company and the Group for the
financial year.
The responsibilities of the Directors in relation to the Financial Statements of the Company and the
Group are set out in this statement. As per the provisions of the Companies Act No. 07 of 2007,
the Directors are required to prepare for each financial year and place before the Annual General
Meeting of shareholders, the Financial Statements, which comprise:
1. A Statement of Income, which presents a true and fair view of the profit or loss of the Group for the
financial year; and
2. A Balance Sheet, which presents a true and fair view of the state of affairs of the Company and its
Subsidiaries as at the end of the financial year.
In addition, the Directors have to ensure that Financial Statements present fairly for each financial
year the Group’s financial position, financial performance and cash flows. This requires faithful
representation of the effects of transactions, other events and conditions in accordance with
the definitions and recognition criteria for assets, liabilities, income and expenses set out in the
‘framework for the preparation and presentation of Financial Statements’ set out in the Sri Lanka
Accounting Standards. Virtually in all circumstances, a fair presentation will be achieved by
compliance with all applicable Sri Lanka Accounting Standards.
The Directors also have to ensure that:
Appropriate accounting policies have been used in a consistent manner;
Where necessary, prudent judgments and estimates have been made;
Requirements of the Sri Lanka Accounting and Auditing Standards Act No. 15 of 1995 have been
followed;
Listing Rules of the Colombo Stock Exchange are complied with.
The Directors are responsible for ensuring that the companies within the Group keep sufficient
accounting records to disclose with reasonable accuracy, the financial position of the Company and
the Group, and to ensure that the Financial Statements presented comply with the requirements of
the Companies Act No. 07 of 2007.
The Board of Directors accepts responsibility for the integrity and objectivity of the Financial
Statements presented.
The Directors are required to provide the Auditors with every opportunity to take whatever steps
necessary to enable them to form their audit opinion.
The responsibility of the Auditors in relation to the Financial Statements appears in the Report of the
Auditors on page 161.
StAt e m e n t o f d I R eC to R S ’ R e S p o n S I b I l I t I e S f o r t h e f i N a N c i a l stat e m e N ts
f I n A n C I A l R e p o RtS
annex to the annual report of the board of directors 157 statement of directors ’ responsib i l i t ies for the f inancia l statements 159
D I E S E L & M OTO R E N G I N E E R I N G P L C
A N N U A L R E P O RT 2 0 1 1 / 1 2160
f I n A n C I A l R e p o RtS StAt e m e n t o f d I R eC to R S ’ R e S p o n S I b I l I t I e S f o R t h e f I n A n C I A l StAt e m e n tS
Messrs KPMG, Chartered Accountants, the independent auditors of the Company have examined the
Financial Statements and the related records and information. Their opinion on Financial Statements
is given on page 161.
The Directors are also responsible for taking reasonable measures to safeguard the assets of the Group and in
that context to have proper regard to the establishment of appropriate systems of internal control with a view to
prevention and detection of fraud and other irregularities. The Directors, having reviewed the financial budget
and cash flows for the year to 31st March 2013 and the bank facilities, consider that the Group has adequate
resources to continue in operation, and have continued to adopt the going concern basis in preparing the
Financial Statements.
By Order of the Board,
B.C.S.A.P. GooneratneSecretary
Colombo
30th May 2012
statement of directors ’ responsib i l i t ies for the f inancia l statements 159 independent auditors ’ report 161 income statement 162
D I E S E L & M OTO R E N G I N E E R I N G P L C
A N N U A L R E P O RT 2 0 1 1 / 1 2161
To THe sHaReHolDeRs oF Diesel & MoToR enGineeRinG plc
Report on the Financial statements
We have audited the accompanying financial statements of Diesel & Motor Engineering PLC (“Company”), the consolidated financial statements of the Company and its subsidiaries as at March 31, 2012 which comprise the balance sheet as at March 31, 2012, and the income statement, statement of changes in equity and cash flow statement for the year then ended, and a summary of significant accounting policies and other explanatory notes as set out on pages 162 to 203 of this Annual Report.
Management’s Responsibility for the Financial statements
Management is responsible for the preparation and fair presentation of these financial statements in accordance with Sri Lanka Accounting Standards. This responsibility includes: designing, implementing and maintaining internal control relevant to the preparation and fair presentation of financial statements that are free from material misstatement, whether due to fraud or error; selecting and applying appropriate accounting policies; and making accounting estimates that are reasonable in the circumstances.
scope of audit and Basis of opinion
Our responsibility is to express an opinion on these financial statements based on our audit. We conducted our audit in accordance with Sri Lanka Auditing Standards. Those standards require that we plan and perform the audit to obtain reasonable assurance whether the financial statements are free from material misstatement.
An audit includes examining, on a test basis, evidence supporting the amounts and disclosures in the financial statements. An audit also includes assessing the accounting policies used and significant estimates made by management, as well as evaluating the overall financial statement presentation.
We have obtained all the information and explanations which to the best of our knowledge and belief were necessary for the purposes of our audit. We therefore believe that our audit provides a reasonable basis for our opinion.
opinion
In our opinion, so far as appears from our examination, the Company maintained proper accounting records for the year ended March 31, 2012 and the financial statements give a true and fair view of the Company’s state of affairs as at March 31, 2012 and its profit and cash flows for the year then ended in accordance with Sri Lanka Accounting Standards.
In our opinion, the consolidated financial statements give a true and fair view of the state of affairs as at March 31, 2012 and the profit and cash flows for the year then ended, in accordance with Sri Lanka Accounting Standards, of the Company and its subsidiaries dealt with thereby, so far as concerns the shareholders of the Company.
Report on Other Legal and Regulatory Requirements
These financial statements also comply with the requirements of Section 153 (2) to 153 (7) of the Companies Act No. 07 of 2007.
chartered accountants30th May 2012Colombo
I n d e p e n d e n t au d i to r s ’ r e p o rt f I n A n C I A l R e p o RtS
balance sheet 163 statement of changes in equity 164 cash f low statement 165 Notes to the f inancia l statements 167
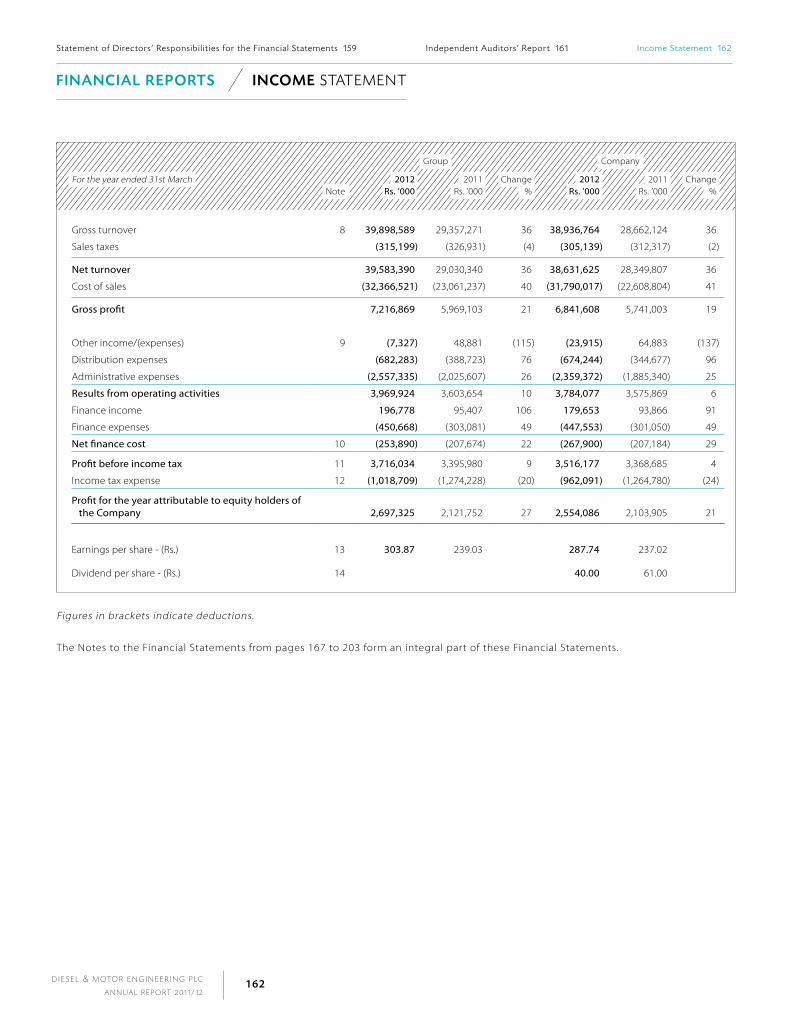
D I E S E L & M OTO R E N G I N E E R I N G P L C
A N N U A L R E P O RT 2 0 1 1 / 1 2162
Group Company
For the year ended 31st March Note
2012Rs. ’000
2011Rs. ’000
Change%
2012Rs. ’000
2011Rs. ’000
Change%
Gross turnover 8 39,898,589 29,357,271 36 38,936,764 28,662,124 36
Sales taxes (315,199) (326,931) (4) (305,139) (312,317) (2)
Net turnover 39,583,390 29,030,340 36 38,631,625 28,349,807 36
Cost of sales (32,366,521) (23,061,237) 40 (31,790,017) (22,608,804) 41
Gross profit 7,216,869 5,969,103 21 6,841,608 5,741,003 19
Other income/(expenses) 9 (7,327) 48,881 (115) (23,915) 64,883 (137)
Distribution expenses (682,283) (388,723) 76 (674,244) (344,677) 96
Administrative expenses (2,557,335) (2,025,607) 26 (2,359,372) (1,885,340) 25
Results from operating activities 3,969,924 3,603,654 10 3,784,077 3,575,869 6
Finance income 196,778 95,407 106 179,653 93,866 91
Finance expenses (450,668) (303,081) 49 (447,553) (301,050) 49
Net finance cost 10 (253,890) (207,674) 22 (267,900) (207,184) 29
Profit before income tax 11 3,716,034 3,395,980 9 3,516,177 3,368,685 4
Income tax expense 12 (1,018,709) (1,274,228) (20) (962,091) (1,264,780) (24)
Profit for the year attributable to equity holders of the Company 2,697,325 2,121,752 27 2,554,086 2,103,905 21
Earnings per share - (Rs.) 13 303.87 239.03 287.74 237.02
Dividend per share - (Rs.) 14 40.00 61.00
Figures in brackets indicate deductions.
The Notes to the Financial Statements from pages 167 to 203 form an integral part of these Financial Statements.
f I n A n C I A l R e p o RtS I n Co m e stat e m e N t
statement of directors ’ responsib i l i t ies for the f inancia l statements 159 independent auditors ’ report 161 income statement 162

D I E S E L & M OTO R E N G I N E E R I N G P L C
A N N U A L R E P O RT 2 0 1 1 / 1 2163
Group Company
As at 31st March Note
2012Rs. ’000
2011Rs. ’000
2012Rs. ’000
2011Rs. ’000
AssetsNon-Current AssetsProperty, plant & equipment 15 4,658,274 3,060,039 4,620,754 3,026,027Leasehold property 16 35,551 37,756 35,551 37,756Intangible assets 17 3,079 702 3,079 702Investment in subsidiaries 18 – – 11,145 8,350Long-term investments 19 1,012 1,012 1,005 1,005
Total non-current assets 4,697,916 3,099,509 4,671,534 3,073,840
Current AssetsInventories 20 8,401,338 2,640,498 8,075,867 2,419,515 Trade and other receivables 21 2,078,274 3,328,428 1,813,722 3,255,689 Cash and cash equivalents 22 317,090 1,871,046 178,996 1,801,370
Total current assets 10,796,702 7,839,972 10,068,585 7,476,574
Total assets 15,494,618 10,939,481 14,740,119 10,550,414
Equity and LiabilitiesEquityStated capital 23 425,297 182,500 425,297 182,500Capital reserve 24 2,014,752 1,135,612 2,014,752 1,135,612Revenue reserves 25 5,025,283 2,882,735 4,634,060 2,634,751
Total equity attributable to the equity holders of the Company 7,465,332 4,200,847 7,074,109 3,952,863
Non-Current LiabilitiesEmployee benefits 26 224,434 182,327 216,824 173,713 Deferred tax liabilities 27 28,357 58,157 27,252 57,155 Interest bearing borrowings 28 770,203 316,830 770,203 316,830 Deferred income 29 36,746 7,977 4,786 7,976
Total non-current liabilities 1,059,740 565,291 1,019,065 555,674
Current LiabilitiesTrade and other payables 30 2,569,805 2,422,220 2,251,841 2,181,728 Interest bearing borrowings 28 229,960 93,015 229,960 93,015 Current tax liabilities 31 124,115 999,487 95,902 1,006,205 Short-term interest bearing borrowings 32 4,045,666 2,658,621 3,970,625 2,647,224
Amounts due to subsidiaries 33 – – 98,617 113,705
Total current liabilities 6,969,546 6,173,343 6,646,945 6,041,877
Total liabilities 8,029,286 6,738,634 7,666,010 6,597,551
Total equity and liabilities 15,494,618 10,939,481 14,740,119 10,550,414
It is certified that the Financial Statements as set out on pages 162 to 203 have been prepared in accordance with the requirements of the Companies Act No. 07 of 2007 and give a true and fair view of the state of affairs of Diesel & Motor Engineering PLC and the Group as at 31st March 2012 and the profit for the year ended.
e.D.c. KodituwakkuGeneral Manager - Finance & Controlling/Member - Group Management Committee
The Directors are responsible for the preparation and presentation of these Financial Statements.Signed for and on behalf of the Board,
a.R. pandithage B.c.s.a.p. GooneratneChairman, Managing Director Director/Chief Financial Officer
30th May 2012Colombo
Figures in brackets indicate deductions.The Notes to the Financial Statements from pages 167 to 203 form an integral part of these Financial Statements.
bA l A n C e s h e e t f I n A n C I A l R e p o RtS
balance sheet 163 statement of changes in equity 164 cash f low statement 165 Notes to the f inancia l statements 167
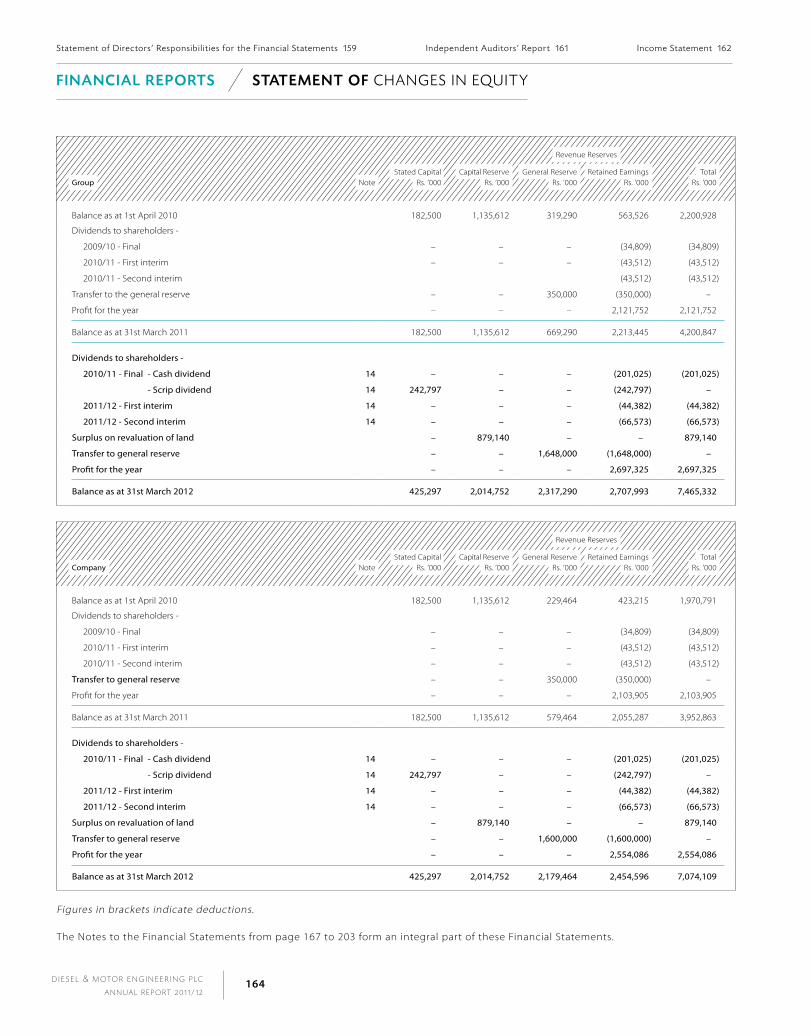
D I E S E L & M OTO R E N G I N E E R I N G P L C
A N N U A L R E P O RT 2 0 1 1 / 1 2164
Revenue Reserves
Group NoteStated Capital
Rs. ’000Capital Reserve
Rs. ’000General Reserve
Rs. ’000Retained Earnings
Rs. ’000Total
Rs. ’000
Balance as at 1st April 2010 182,500 1,135,612 319,290 563,526 2,200,928
Dividends to shareholders -
2009/10 - Final – – – (34,809) (34,809)
2010/11 - First interim – – – (43,512) (43,512)
2010/11 - Second interim (43,512) (43,512)
Transfer to the general reserve – – 350,000 (350,000) –
Profit for the year – – – 2,121,752 2,121,752
Balance as at 31st March 2011 182,500 1,135,612 669,290 2,213,445 4,200,847
Dividends to shareholders -
2010/11 - Final - Cash dividend 14 – – – (201,025) (201,025)
- Scrip dividend 14 242,797 – – (242,797) –
2011/12 - First interim 14 – – – (44,382) (44,382)
2011/12 - Second interim 14 – – – (66,573) (66,573)
Surplus on revaluation of land – 879,140 – – 879,140
Transfer to general reserve – – 1,648,000 (1,648,000) –
Profit for the year – – – 2,697,325 2,697,325
Balance as at 31st March 2012 425,297 2,014,752 2,317,290 2,707,993 7,465,332
Revenue Reserves
Company NoteStated Capital
Rs. ’000Capital Reserve
Rs. ’000General Reserve
Rs. ’000Retained Earnings
Rs. ’000Total
Rs. ’000
Balance as at 1st April 2010 182,500 1,135,612 229,464 423,215 1,970,791
Dividends to shareholders -
2009/10 - Final – – – (34,809) (34,809)
2010/11 - First interim – – – (43,512) (43,512)
2010/11 - Second interim – – – (43,512) (43,512)
Transfer to general reserve – – 350,000 (350,000) –
Profit for the year – – – 2,103,905 2,103,905
Balance as at 31st March 2011 182,500 1,135,612 579,464 2,055,287 3,952,863
Dividends to shareholders -
2010/11 - Final - Cash dividend 14 – – – (201,025) (201,025)
- Scrip dividend 14 242,797 – – (242,797) –
2011/12 - First interim 14 – – – (44,382) (44,382)
2011/12 - Second interim 14 – – – (66,573) (66,573)
Surplus on revaluation of land – 879,140 – – 879,140
Transfer to general reserve – – 1,600,000 (1,600,000) –
Profit for the year – – – 2,554,086 2,554,086
Balance as at 31st March 2012 425,297 2,014,752 2,179,464 2,454,596 7,074,109
Figures in brackets indicate deductions.
The Notes to the Financial Statements from page 167 to 203 form an integral part of these Financial Statements.
f I n A n C I A l R e p o RtS StAt e m e n t o f c h a N g e s i N eq u i t y
statement of directors ’ responsib i l i t ies for the f inancia l statements 159 independent auditors ’ report 161 income statement 162

D I E S E L & M OTO R E N G I N E E R I N G P L C
A N N U A L R E P O RT 2 0 1 1 / 1 2165
Group Company
For the year ended 31st March Note
2012Rs. ’000
2011Rs. ’000
2012Rs. ’000
2011Rs. ’000
Profit before taxation 3,716,034 3,395,980 3,516,177 3,368,685
Non-cash adjustment to reconcile profit before tax to net cash flows
Depreciation on property, plant & equipment 15 135,164 93,100 129,855 85,853
Amortisation of intangible assets and leasehold property 16/17 3,364 1,785 3,364 1,785
Deferred income net of amortisation 29 28,769 (3,798) (3,190) (3,263)
Impairment loss/(reversal) on investment in subsidiary 18.1 – – (2,795) 15,000
(Profit)/loss on disposal of property, plant & equipment 9 67,847 (2,627) 67,883 (3,312)
Interest expenses 10 450,668 303,081 447,553 301,050
Interest income 10 (136,648) (74,094) (135,290) (73,671)
Dividend income 9 (165) (139) (3,765) (13,638)
Provision/(reversal) for bad and doubtful debts 181,129 1,413 201,941 (8,537)
Provision/(reversal) for slow moving inventories 99,989 (6,738) 105,092 7,782
Provision for employee benefits 26 56,087 57,667 56,656 55,951
Profit from disposal of equity accounted investee 9.1 – (5,431) – (31,750)
Operating profit before working capital changes 4,602,238 3,760,199 4,383,481 3,701,935
Working capital adjustments:
(Increase)/decrease in inventories (5,860,829) (1,317,247) (5,761,444) (1,190,536)
(Increase)/decrease in trade and other receivables 1,069,025 (1,341,698) 1,240,026 (1,459,723)
(Increase)/decrease in amounts due from subsidiaries – – – 23,265
Increase/(decrease) in trade creditors and other payables 133,910 1,262,591 56,438 1,106,851
Increase/(decrease) in amounts due to subsidiaries – – (15,088) 76,454
Cash generated from/(used in) operating activities (55,656) 2,363,845 (96,587) 2,258,246
Interest paid (436,557) (302,494) (433,442) (300,463)
Gratuity paid 26 (13,980) (17,478) (13,545) (14,845)
Income tax paid 31 (1,923,881) (250,025) (1,902,297) (227,315)
Net cash generated from/(used in) operations (2,430,074) 1,793,848 (2,445,871) 1,715,623
Cash Flow from Investing Activities
Proceeds from disposal of property, plant & equipment 25,257 31,723 25,222 5,796
Proceeds from disposal of investment in equity accounted investee – 38,500 – 38,500
Dividend received 9 165 139 3,765 13,638
Interest received 10 136,648 74,094 135,290 73,671
Acquisition and construction of property, plant & equipment and capital work-in-progress 15 (947,363) (1,044,628) (938,547) (1,034,741)
Acquisition of leasehold property 16 – (37,538) – (37,538)
Acquisition of intangible assets 17 (3,536) – (3,536) –
Net cash used in investing activities (788,829) (937,710) (777,806) (940,674)
C A S h f low stat e m e N t f I n A n C I A l R e p o RtS
balance sheet 163 statement of changes in equity 164 cash f low statement 165 Notes to the f inancia l statements 167

D I E S E L & M OTO R E N G I N E E R I N G P L C
A N N U A L R E P O RT 2 0 1 1 / 1 2166
f I n A n C I A l R e p o RtS C A S h f low StAt e m e n t
Group Company
For the year ended 31st March Note
2012Rs. ’000
2011Rs. ’000
2012Rs. ’000
2011Rs. ’000
Cash Flow from Financing Activities
Proceeds from long-term loans 28.1 750,000 – 750,000 –
Repayment of long-term loans 28.1 (158,594) (254,126) (158,594) (254,126)
Dividend paid (311,980) (121,833) (311,980) (121,833)
Payment of finance lease rentals 28.4 (1,524) (1,699) (1,524) (1,699)
Net cash from/(used in) financing activities 277,902 (377,658) 277,902 (377,658)
Net increase/(decrease) in cash and cash equivalents (2,941,001) 478,480 (2,945,775) 397,291
Cash and cash equivalents at the beginning of the year (787,575) (1,266,055) (845,854) (1,243,145)
Cash and cash equivalents at end of the year (Note A) (3,728,576) (787,575) (3,791,629) (845,854)
Note A
Analysis of Cash and Cash Equivalents
Cash and bank balances 22 317,090 1,871,046 178,996 1,801,370
Short-term interest bearing loans and borrowings 32 (4,045,666) (2,658,621) (3,970,625) (2,647,224)
Cash and cash equivalents (3,728,576) (787,575) (3,791,629) (845,854)
Figures in brackets indicate deductions.
The Notes to the Financial Statements from pages 167 to 203 form an integral part of these Financial Statements.
statement of directors ’ responsib i l i t ies for the f inancia l statements 159 independent auditors ’ report 161 income statement 162

D I E S E L & M OTO R E N G I N E E R I N G P L C
A N N U A L R E P O RT 2 0 1 1 / 1 2167
1. corporate information
Reporting entity
Diesel & Motor Engineering PLC (the Company) is a public limited liability Company listed on the
Colombo Stock Exchange, incorporated and domiciled in Sri Lanka. The Company and its Subsidiaries
have the registered office at No. 65, Jetawana Road, Colombo 14. The ordinary shares of the Company,
are being traded in the Colombo Stock Exchange.
The staff strength of the Company as at 31st March 2012 is 1,222 (2010/11 - 920).
consolidated Financial statements
The Consolidated Financial Statements of Diesel & Motor Engineering PLC as at and for the year ended
31st March 2012 comprise the Company and its fully-owned Subsidiaries (together referred to as the
‘Group’ and individually as ‘Group Entities’).
Diesel & Motor Engineering PLC does not have any identifiable parent of its own.
The Financial Statements of all companies in the Group are prepared to a common financial year,
which ends on 31st March.
1.1 principal activities and nature of operations
1.1.1 The Company
The principal activities of the Company are import, sale and repair of passenger cars, commercial
vehicles, material handling machinery, construction machinery, agri machinery, power tools, import &
sale of vehicle spares, components, accessories, providing lighting solutions and storage systems.
1.1.2 Subsidiaries
The principal activities of the Company’s Subsidiaries, namely,
Dimo (Pvt) Ltd. - sale and after sales services of biomedical equipment, power engineering
solutions, building technologies, generator sets, diesel engines for marine propulsion, rail traction
and fluid management systems.
Dimo Travels (Pvt)Ltd. - Provision of transportation facilities.
Dimo Industries (Pvt) Ltd. - retreading of tyres. Business operations of the Company was ceased and
its business activities were transferred to Diesel & Motor Engineering PLC in December 2010.
Activities of the Group are described in more detail in the ‘Group Structure’ on page 246.
All subsidiaries of the Company have been incorporated in Sri Lanka.
The Directors have made an assessment of the Group’s ability to continue as a going concern in the
foreseeable future, and they do not intend to liquidate or to cease trading of any Group entities.
n ot e S to t h e f i N a N c i a l stat e m e N ts f I n A n C I A l R e p o RtS
balance sheet 163 statement of changes in equity 164 cash f low statement 165 Notes to the f inancia l statements 167
D I E S E L & M OTO R E N G I N E E R I N G P L C
A N N U A L R E P O RT 2 0 1 1 / 1 2168
f I n A n C I A l R e p o RtS n ot e S to t h e f I n A n C I A l StAt e m e n tS
2. Basis of preparation
2.1 statement of compliance
The Consolidated Financial Statements of the Group and the separate Financial Statements of
the Company, which have been prepared and presented in accordance with Sri Lanka Accounting
Standards (SLAS) issued by The Institute of Chartered Accountants of Sri Lanka (ICASL), and comply
with the requirements of the Companies Act No. 07 of 2007.
The Company and the Group did not adopt any accounting treatment which did not comply with the
requirements of Sri Lanka Accounting Standards and Companies Act No. 07 of 2007 governing the
preparation and presentation of the Financial Statements.
2.2 Responsibilities for the Financial statements
The Board of Directors is responsible for the preparation and presentation of the Financial Statements
of the Company and its subsidiaries as per provisions of Companies Act No. 07 of 2007 and the
Sri Lanka Accounting Standards.
The Board of Directors acknowledges this responsibility as set out in the ‘Statement of Directors’
Responsibilities for Financial Statements’, ‘Annual Report of the Board of Directors’ and in the
statement following the Balance Sheet on pages 159 to 160, 149 to 158 and 163 respectively, of this
Annual Report.
The Financial Statements include following components:
Income Statement providing information on the financial performance of the Company and the
Group for the year end.
The Balance Sheet providing information on the financial position of the Company and the Group
as at the year end.
The Statement of Changes in Equity providing information on the movements of stated capital
and reserves of the Company and the Group during the period under review.
The Cash Flow Statement providing information to the users, on generating cash and cash
equivalent and utilisation of the same.
Notes to the Financial Statements comprising accounting policies and other notes.
2.3 approval of Financial statements by the Board of Directors
The Financial Statements for the year ended 31st March 2012, were authorised for issue by the
Board of Directors on 30th May 2012.
2.4 Basis of Measurement
The Consolidated Financial Statements have been prepared on the historical cost basis, except for
the following:
Land included under property, plant & equipment is measured at cost at the time of acquisition
and subsequently at revalued amounts, which are the fair values at the date of revaluation,
less accumulated impairment loss, if any. More details are given in Note 15 to these
Financial Statements.
statement of directors ’ responsib i l i t ies for the f inancia l statements 159 independent auditors ’ report 161 income statement 162
D I E S E L & M OTO R E N G I N E E R I N G P L C
A N N U A L R E P O RT 2 0 1 1 / 1 2169
n ot e S to t h e f I n A n C I A l StAt e m e n tS f I n A n C I A l R e p o RtS
2.5 Functional and presentation currency
The Financial Statements are presented in Sri Lankan Rupees, which is the Group’s functional currency.
2.6 significant accounting Judgments, estimates and assumptions
The preparation of Financial Statements in conformity with SLAS requires management to make
judgments, estimates and assumptions that affect the application of accounting policies and the
reported amounts of assets, liabilities, income and expenses. Actual results may differ from these
estimates. Judgments and estimates are based on historical experience and other factors, including
expectations that are believed to be reasonable under the circumstances. Hence, actual experience
and results may differ from these judgments and estimates. Estimates and underlying assumptions
are reviewed on an ongoing basis. Revisions to accounting estimates are recognised in the period in
which the estimate is revised and in any future periods affected.
Information about critical judgments in applying accounting policies that have most significant effect
on the amounts recognised in the Financial Statements is included in the following Notes:
Note 3.3.1.7 - Economic useful lives of property, plant & equipment
Note 3.3.9 - Assessment of impairment
Note 3.4.1.2 - Measurement of employee benefits
Note 3.4 & 3.4.3 - Provisions and contingencies
Note 3.7.5 (b) - Deferred taxation-utilisation of tax losses
2.7 Materiality and aggregation
Each material class of similar items is presented separately in the Financial Statements. Items of
dissimilar nature or function are presented separately unless they are immaterial as permitted by
Sri Lanka Accounting Standard No. 3 (Revised 2005) - ‘Presentation of Financial Statements’.
2.8 offsetting
Assets and liabilities and income and expenses are not set off unless permitted by Sri Lanka
Accounting Standards.
2.9 Rounding
The amounts in the Financial Statements have been rounded off to the nearest Rupees thousand,
except where otherwise indicated, as permitted by Sri Lanka Accounting Standard No. 3 (Revised
2005) - ‘Presentation of Financial Statements’.
balance sheet 163 statement of changes in equity 164 cash f low statement 165 Notes to the f inancia l statements 167

D I E S E L & M OTO R E N G I N E E R I N G P L C
A N N U A L R E P O RT 2 0 1 1 / 1 2170
f I n A n C I A l R e p o RtS n ot e S to t h e f I n A n C I A l StAt e m e n tS
3. significant accounting policies
The accounting policies set out below have been applied consistently to all periods presented in
these Financial Statements and have been applied consistently by Group entities.
3.1 Basis of consolidation
3.1.1 Subsidiaries
Subsidiaries are those entities controlled by the Company. Control is existed where the Company has
the power to govern the financial and operating policies of an entity so as to obtain benefits from
its activities. In assessing control, potential voting rights that are currently exercisable are also taken
into account. The Financial Statements of subsidiaries are included in the Consolidated Financial
Statements from the date that control commences until the date that control ceases.
A list of the Group’s subsidiaries is set out in Note 18 to the Financial Statements.
The Consolidated Financial Statements incorporating all subsidiaries in the Group are prepared to a
common financial year ending 31st March, using uniform accounting policies. Transactions and events
in similar circumstances are applied with said accounting policies on a consistent basis.
There are no restrictions on the ability of subsidiaries to transfer funds to the Company ( The Parent) in
the form of cash dividend or repayment of loans and advances.
3.1.2 Transactions Eliminated on Consolidation
Intra-group balances and transactions, income and expenses and any unrealised gains arising from
intra-group transactions are eliminated in preparing the Consolidated Financial Statements.
Unrealised losses are also eliminated in the same way as unrealised gains, but only to the extent that
there is no evidence of impairment.
3.1.3 Loss of Control
Upon the loss of control, the Group derecognises the assets and liabilities of the subsidiary, any
non-controlling interest and other components of equity related to the subsidiary. Any surplus or,
deficit on loss of control is recognised in the Income Statement. If the Group retains any interest in
the previous subsidiary, then such interest is subsequently accounted for as an available for sale asset,
long-term investment or equity accounted investee depending on the level of influence.
3.2 Foreign currency Transactions and Balances
Transactions in foreign currencies are translated to the respective functional currencies of Group
entities at exchange rates applicable on the dates of the transactions. Monetary assets and liabilities
denominated in foreign currencies at the reporting date are retranslated to the functional currency
at the exchange rate ruling at that date. Foreign currency differences arising on translation are
recognised in Income Statement.
statement of directors ’ responsib i l i t ies for the f inancia l statements 159 independent auditors ’ report 161 income statement 162

D I E S E L & M OTO R E N G I N E E R I N G P L C
A N N U A L R E P O RT 2 0 1 1 / 1 2171
n ot e S to t h e f I n A n C I A l StAt e m e n tS f I n A n C I A l R e p o RtS
3.3 assets and Bases of their Valuation
3.3.1 Property, Plant & Equipment
3.3.1.1 Recognition and Measurement
Items of property, plant & equipment are measured at cost (or at revaluation in the case of land) less
accumulated depreciation and accumulated impairment loss.
3.3.1.2 Cost
The cost of property, plant & equipment (excluding land) includes expenditure that is directly
attributable to the acquisition of the asset. The cost of self-constructed assets includes the cost of
materials and direct labour, any other costs directly attributable to bringing the asset to a working
condition for its intended use.
Purchased software that is integral to the functionality of the related equipment is capitalised as a
part of that equipment.
3.3.1.3 Revaluation Model
Initially, freehold land is recognised at cost and subsequently such properties are carried at a
revalued amount, being their fair value at the date of revaluation less any subsequent accumulated
impairment loss.
Revaluation of entire freehold lands of the Company is carried out in every three years or when there
is a substantial difference between the fair value and the carrying amount to ensure that the carrying
amounts do not differ from materially from the fair values at the Balance Sheet date. Revaluation is
undertaken by a professionally qualified valuer.
Increases in the carrying amount on revaluation are credited to the capital reserve in shareholders’
equity. Decreases that offset previous increases of the same individual asset are charged against
capital reserve directly in equity. All other decreases are expensed in the Income Statement.
3.3.1.4 Cost Model
Items of property, plant & equipment excluding land are recognised at cost less accumulated
depreciation and accumulated impairment loss.
3.3.1.5 Leased Assets
Leases in terms of which the Group assumes substantially all the risks and rewards of ownership
are classified as finance leases. Upon initial recognition, the leased asset is measured at an amount
equal to the lower of its fair value and the present value of minimum lease payments. Subsequent to
initial recognition, the asset is accounted for in accordance with the accounting policy applicable to
that asset.
3.3.1.6 Subsequent Costs
Subsequent expenditure is capitalised only when it is probable that in the future economic benefits
associated with the expenditure will flow to the Group/Company. Ongoing repair and maintenance
expenses are recorded in Income Statement.
balance sheet 163 statement of changes in equity 164 cash f low statement 165 Notes to the f inancia l statements 167

D I E S E L & M OTO R E N G I N E E R I N G P L C
A N N U A L R E P O RT 2 0 1 1 / 1 2172
f I n A n C I A l R e p o RtS n ot e S to t h e f I n A n C I A l StAt e m e n tS
3.3.1.7 Derecognition
An item of property, plant & equipment and any significant part initially recognised is derecognised
upon disposal or when no future economic benefits are expected from its use or disposal. Any gain
or loss arising on derecognition of the asset (calculated as the difference between the net disposal
proceeds and the carrying amount of the asset) is included in the Income Statement when the asset
is derecognised.
3.3.1.8 Depreciation
Depreciation is recognised in the Income Statement on a straight-line basis over the estimated useful
lives of items of each part of an item of property, plant & equipment. Assets held under finance leases
are depreciated over the shorter of the lease term and their useful lives unless it is reasonably certain
that the Group will have ownership by the end of the lease term. Freehold land is not depreciated.
Depreciation of an asset begins when it is available for use and ceases at the earlier of the date that
the asset is classified as held for sale and the date that the asset is derecognised.
Depreciation is calculated on a straight-line basis over the estimated useful life of the asset as follows:
Years
Buildings 36-40
Plant & machinery 08-13
Workshop implements 03-04
Motor vehicles 03-04
Furniture & fittings 09-13
Office equipment & electrical fittings 06-10
Computer hardware & software 03-04
The assets’ residual values, useful lives and methods of depreciation are reviewed at each financial
year end, and adjusted prospectively, if appropriate.
3.3.1.9 Capital Work-in-Progress
Capital expenditure incurred during the year, which is not completed as at the Balance Sheet date is
stated as capital work-in-progress.
3.3.2 Intangible Assets
An intangible asset is recognised if it is probable that future economic benefits that are attributable
to the asset will flow to the entity and the cost of the asset can be measured reliably in accordance
with SLAS 37 - ‘Intangible Assets’. Accordingly, these assets are stated in the Balance Sheet at cost less
accumulated amortisation and accumulated impairment loss.
3.3.2.1 Derecognition of Intangible Assets
Intangible assets are derecognised on disposal or when no future economic benefits are expected
from its use. Gains or losses arising from derecognition of intangible assets are measured as the
difference between the net disposal proceeds and the carrying amount of the assets and are
recognised in the Income Statement.
statement of directors ’ responsib i l i t ies for the f inancia l statements 159 independent auditors ’ report 161 income statement 162
D I E S E L & M OTO R E N G I N E E R I N G P L C
A N N U A L R E P O RT 2 0 1 1 / 1 2173
n ot e S to t h e f I n A n C I A l StAt e m e n tS f I n A n C I A l R e p o RtS
The Group’s intangible assets, with the reconciliation of carrying amount, accumulated amortisation
at the beginning and the end of the year is given in Note 17 to the Financial Statements on Page 190
of this Annual Report.
Amortisation expenses which are connected with intangible assets are included in administrative
expenses in the Income Statement.
3.3.2.2 Subsequent Expenditure
Subsequent expenditure is capitalised only when it increases the future economic benefits embodied
in the specific asset to which it relates. All other expenditure is recognised in the Income Statement
when incurred.
3.3.2.3 Amortisation of Intangible Assets
Amortisation is recognised in the Income Statement on a straight-line basis over the estimated
useful lives of intangible assets, from the date that they are available for use. The intangible assets
included in the Financial Statements represent cost of computer software. The estimated useful life of
computer software is four years.
3.3.3 Investments
3.3.3.1 Long-Term Investments
Quoted and unquoted investments in shares held on long-term basis are measured at cost.
In the Company’s Financial Statements, investments in subsidiaries are carried at cost in accordance
with the parent company’s accounting policy for long-term investments.
Provision for fall in value is made when in the opinion of the Directors there has been a decline, other
than temporary, in the value of the investment.
3.3.4 Inventories
Inventories are measured at the lower of cost and net realisable value. The general basis on which
cost is determined is as follows.
All inventory items and work-in-progress are measured at weighted average of the directly
attributable cost and includes expenditure incurred in acquiring the inventories and bringing them to
their present location and condition but excluding borrowing costs.
Net realisable value is the estimated selling price in the ordinary course of business less the estimated
cost of selling expenses.
3.3.5 Trade and Other Receivables
Trade receivables are stated at their estimated realisable value net of provisions.
Bad debts are written-off when those are known to be uncollectable.
3.3.6 Cash and Cash Equivalents
Cash and cash equivalents comprise cash balances, investments in Government Treasury Bills and
demand deposits with an original maturity of three months or less. Bank overdrafts and short-
term borrowings that are repayable on demand and forming an integral part of the Group’s cash
management, are included as a component of cash and cash equivalents for the purpose of the
Statement of Cash Flows.
balance sheet 163 statement of changes in equity 164 cash f low statement 165 Notes to the f inancia l statements 167

D I E S E L & M OTO R E N G I N E E R I N G P L C
A N N U A L R E P O RT 2 0 1 1 / 1 2174
f I n A n C I A l R e p o RtS n ot e S to t h e f I n A n C I A l StAt e m e n tS
3.3.7 Investments Treasury Bills
Investments in Treasury Bills are recorded under cash and cash equivalent in the Financial Statements
at cost. The difference between the purchase price and discount price represents interest income and
is recorded in the Income Statement over the period of resale agreement.
3.3.8 Leasehold Property
Leasehold property is stated at cost less accumulated amortisation. Such carrying amounts are
amortised over the remaining lease period or useful life of the leasehold property whichever is
shorter. Details of leasehold property are given in Note 16 to the Financial Statements.
3.3.9 Impairment of Assets
The carrying amounts of the Group’s assets, other than inventories and deferred tax assets are
reviewed at each reporting date to determine whether there is any indication of impairment.
If any such indication exists, then the asset’s recoverable amount is estimated.
The recoverable amount of an asset or cash-generating unit is the greater of its value in use and its
fair value, less cost to sell. In assessing value in use, the estimated future cash flows are discounted
to their present value using a pre-tax discount rate that reflects current market assessments of
the time value of money and the risks specific to the asset. A cash-generating unit is the smallest
identifiable asset group that generates cash flows that largely are independent from other asset and
asset groups.
An impairment loss recognised if the carrying amount of an asset or its cash-generating unit exceeds
its estimated recoverable amount. Impairment losses are recognised in the Income Statement.
Impairment losses is recognised in prior periods are assessed at each reporting date for any
indications that the loss has decreased or no longer exists. An impairment loss is reversed if there
has been a change in the estimates used to determine the recoverable amount. An impairment loss
is reversed only to the extent that the asset’s carrying amount does not exceed the carrying amount
that would have been determined, net of depreciation or amortisation, if no impairment loss had
been recognised.
3.4 liabilities and provisions
Liabilities classified as current liabilities in the Balance Sheet are those which fall due for payment on
demand or within one year from the reporting date. Non-current liabilities are those balances that fall
due for payment later than one year from the reporting date.
The Group recognises provisions in the Balance Sheet when the Group has a legal or constructive
obligations as a result of past event and it is probable that an outflow of economic benefits will
be required to settle the obligation and the amount of the provision can be measured reliably in
accordance with SLAS 36 - ‘Provisions, Contingent Liabilities and Contingent Assets’. The amount
recognised is the best estimation of the consideration required to settle the present obligation at the
Balance Sheet date, taking to account the risk and uncertainties surrounding the obligations at that
date. Where a provision is measured using the cash flows estimated to settle the present obligations,
its carrying amount is determined based on the present value of those cash flows.
All known liabilities and provisions have been accounted for in preparing the Financial Statements.
statement of directors ’ responsib i l i t ies for the f inancia l statements 159 independent auditors ’ report 161 income statement 162
D I E S E L & M OTO R E N G I N E E R I N G P L C
A N N U A L R E P O RT 2 0 1 1 / 1 2175
n ot e S to t h e f I n A n C I A l StAt e m e n tS f I n A n C I A l R e p o RtS
3.4.1 Employee Benefits
3.4.1.1 Defined Contribution Plans
A defined contribution plan is a post-employment benefit plan under which an entity pays fixed
contributions into a separate entity and will have no legal or constructive obligation to pay further
amounts. Employees are eligible for Employees’ Provident Fund (EPF) contributions and Employees’
Trust Fund (ETF) contributions in line with respective statutes and regulations.
The Company and employees contribute to an approved provident fund at 12% and 8% on the salaries
of each employee respectively. The said provident fund is being managed by the Central Bank of
Sri Lanka.
The Group contributes to the Employees’ Trust Fund at 3% of the Gross Salary of each employee.
3.4.1.2 Defined Benefits Plans - Retiring Gratuity
A defined benefit plan is a post-employment benefit plan other than a defined contribution plan.
The liability recognised in the Financial Statements in respect of defined benefit plans is the present
value of the defined benefit obligation as at the reporting date. The defined benefit obligation
is calculated by a qualified actuary as at the reporting date using the Projected Unit Credit (PUC)
method as recommended by Sri Lanka Accounting Standard No. 16 - ‘Employee Benefits’. The actuarial
valuation involves making assumptions about discount rate, salary increment rate and balance
service period of employees. Due to the long-term nature of the plans such estimates are subject to
significant uncertainty.
Under the Payment of Gratuity Act No. 12 of 1983, the liability to an employee arises only on
completion of 5 years of continued service.
The liability is not externally funded.
Actuarial Gains and Losses
Actuarial gains or losses are recognised immediately in the Income Statement.
3.4.1.3 Short-Term Benefits
Short-term employees benefit obligations are measured on an undiscounted basis and are expensed
as the related service is provided.
3.4.2 Trade and Other Payables
Trade and other payables are stated at their costs.
3.4.3 Capital Commitments and Contingencies
Contingent liabilities are possible obligations whose existence will be confirmed only by uncertain
future events to present obligations where the transfer of economic benefit is not probable or cannot
be reliably measured. Contingent liabilities are not recognised in the Balance Sheet but are disclosed
unless they are remote.
Capital commitments and contingent liabilities of the Group are disclosed in Note 34 to the
Financial Statements.
balance sheet 163 statement of changes in equity 164 cash f low statement 165 Notes to the f inancia l statements 167
D I E S E L & M OTO R E N G I N E E R I N G P L C
A N N U A L R E P O RT 2 0 1 1 / 1 2176
f I n A n C I A l R e p o RtS n ot e S to t h e f I n A n C I A l StAt e m e n tS
3.5 Deferred income
The excess of sales proceeds over the carrying amount of an asset in a sale and lease back transaction
is classified as deferred income. Deferred income is systematically amortised to the Income Statement
over the lease period.
Value of an asset received free of charge is also classified as deferred income. This will be amortised
over the contract period.
3.6 Dividend on ordinary shares
Dividend on ordinary shares are recognised as a liability and deducted from equity when they are
approved by the Board of Directors. Interim dividends are deducted from equity when they are
declared. Final dividends on ordinary shares for the year ended that are approved by the Directors after
the Balance Sheet date are disclosed as an event after the Balance Sheet date.
3.7 income statement
For the purpose of presentation of the Income Statement, the function of expenses method is
adopted, as it represents fairly the elements of the Company performance.
3.7.1 Revenue Recognition
Revenue is recognised to the extent that it is probable that the economic benefits will flow to
the Company and the revenue and associated costs incurred or to be incurred can be reliably
measured. Revenue is measured at the fair value of the consideration received or receivable net of
trade discounts and sales taxes. The following specific criteria are used for the purpose of
recognition of revenue.
(a) Sale of Goods
Revenue from the sale of goods is measured at the fair value of the consideration received or
receivable, net of returns and trade discounts. Revenue is recognised when the significant risks and
rewards of ownership have been transferred to the buyer, recovery of the consideration is probable,
the associated costs and possible return of goods can be reliably estimated, there is no continuing
management involvement with the goods and the amount of revenue can be measured reliably.
(b) Rendering of Services
Revenue from services rendered is recognised in the Income Statement on the invoicing of the job
after completion. In instances where the revenue from services spreads over a period of time, revenue
is recognised in the Income Statement in proportion to the stage of completion of the transaction at
the reporting date.
(c) Service Support Income
Service support commission which is included in revenue represents commission received from
foreign principals on indent sales. Such commission is recognised on an accrual basis once the
shipment is effected.
(d) Rent Income
Rent income is recognised in the Income Statement as it accrues.
statement of directors ’ responsib i l i t ies for the f inancia l statements 159 independent auditors ’ report 161 income statement 162

D I E S E L & M OTO R E N G I N E E R I N G P L C
A N N U A L R E P O RT 2 0 1 1 / 1 2177
n ot e S to t h e f I n A n C I A l StAt e m e n tS f I n A n C I A l R e p o RtS
(e) Dividend Income
Dividend income is recognised in the Income Statement on the date the entity’s right to receive
dividend is established.
(f ) Gains/(Loss) on Disposal of Investments
Gains and losses on the disposal of investments held by the Group are recognised in the
Income Statement.
Gains and losses on disposal of an item of property, plant & equipment are determined by comparing
the net sales proceeds with the carrying amounts of property, plant & equipment and are recognised
net within ‘other operating income’ in the Income Statement. When revalued assets are sold, the
amounts included in the revaluation surplus reserve are transferred to retained earnings.
3.7.2 Expenses
All expenditure incurred in the running of the business has been charged to income in arriving at the
profit for the year.
Repairs and renewals are charged to profit and loss in the year in which the expenditure is incurred.
3.7.3 Borrowing Costs
Borrowing costs are recognised as an expense in the period in which they are incurred, except to
the extent that they are directly attributable to the acquisition, construction or production of a
qualifying asset of property, plant & equipment in which case they are capitalised as part of the cost
of that asset.
3.7.4 Finance Income and Expenses
Finance income comprises interest income on funds invested, and gains on translation of foreign
currency. Interest income is recognised in the profit and loss as it accrues.
Finance expenses comprise interest payable on borrowings and losses on translation of foreign
currency. The interest expense component of finance lease payments is allocated to each period
during the lease term so as to produce a constant periodic rate of interest on the remaining balance
of the liability.
3.7.5 Income Tax Expense
The Group recognises liabilities for anticipated tax, based on estimates of taxable income. Where the
final tax outcome of these matters is different from the amounts that were initially recorded, such
differences will be adjusted in the current year ’s income tax charge and/or in the deferred assets/
liabilities as appropriate in the period in which such determination is made.
Income tax expense comprises current and deferred tax. Income tax expense is recognised in profit
and loss except to the extent that it relates to items recognised directly in equity, when it is recognised
in equity.
3.7.5 (a) Current Tax
Current tax is the expected tax payable on the taxable income for the year, using tax rates enacted at
the reporting date and any adjustments to tax payable in respect of previous years.
balance sheet 163 statement of changes in equity 164 cash f low statement 165 Notes to the f inancia l statements 167
D I E S E L & M OTO R E N G I N E E R I N G P L C
A N N U A L R E P O RT 2 0 1 1 / 1 2178
f I n A n C I A l R e p o RtS n ot e S to t h e f I n A n C I A l StAt e m e n tS
3.7.5 (b) Deferred Taxation
Deferred tax is provided using liability method on temporary difference at the Balance Sheet date
between the tax written down value and their carrying amounts in financial reporting, for all
Group entities.
Deferred tax is measured at the tax rates that are expected to be applied to the temporary differences
when they reverse, based on the laws that have been enacted or substantively enacted by the
reporting date.
A deferred tax asset is recognised only to the extent that it is probable that future taxable profits will
be available against which the temporary difference can be utilised.
The carrying amount of deferred tax assets is reviewed at each Balance Sheet date and reduced to the
extent that is no longer probable that sufficient taxable profits will be available to allow all or part of
the deferred tax assets to be utilised. Unrecognised deferred tax assets are reassessed at each Balance
Sheet date and are recognised to the extent that it is probable that future taxable profits will allow
the deferred tax assets to be recovered.
3.7.5 (c) Withholding Tax on Dividends, Distributed by the Company and Group
Withholding Tax ( WHT ) on dividend arising from the distribution of dividends by the Company is
recognised at the time the liability to pay the related dividend is recognised.
Tax withheld on dividend income from subsidiaries is recognised as an expense in the Group Income
Statement at the time the liability to pay the related dividend is recognised.
3.7.5 (d) Value Added Tax (VAT )
As per provision of the VAT Act No. 14 of 2002 (and amendments thereto), VAT is charged on taxable
supply of goods and services at the rate of 12%. Company is registered as a Registered Identified
Supplier (RIS) under the Simplified Value Added Tax (SVAT ) scheme and hence VAT at the rate of
12% is suspended on the taxable supply of goods and services for Registered Identified Purchaser
(RIP). Disallowed value added tax is charged to the Income Statement in determining the profits for
the period.
3.7.5 (e) Nation Building Tax (NBT )
Nation Building Tax has been calculated at the rate of 2% on the liable turnover, for services and items
imported and supplied and at the effective rate of 1% on liable turnover of wholesale and
retail supplies, in terms of the Nation Building Tax Act No. 09 of 2009 and subsequent amendment
Act No. 10 of 2011.
3.8 events occurring after the Balance sheet Date
Events after the Balance Sheet date are those events that occurs between the Balance Sheet date and
the date when the Financial Statements are authorised to issue. All material Post Balance Sheet events
have been considered and where appropriate adjustments or disclosures have been made in the
respective Notes to the Financial Statements.
statement of directors ’ responsib i l i t ies for the f inancia l statements 159 independent auditors ’ report 161 income statement 162
D I E S E L & M OTO R E N G I N E E R I N G P L C
A N N U A L R E P O RT 2 0 1 1 / 1 2179
n ot e S to t h e f I n A n C I A l StAt e m e n tS f I n A n C I A l R e p o RtS
3.9 earnings per share (eps)
EPS is calculated by dividing the profit or loss attributable to ordinary shareholders of the Company
by the weighted average number of ordinary shares outstanding during the period.
4. cash Flow statement
The Cash Flow Statement has been prepared using the ‘indirect method’ in accordance with Sri Lanka
Accounting Standard No. 9 - ‘Cash Flow Statements’. Cash and cash equivalents comprise cash in
hand and cash at bank that are readily convertible to known amounts of cash and are subject to an
insignificant risk of changes in value.
Interest paid is classified under operating cash flow. Dividends received and interest income are
classified under cash flows from investing activities. Dividends paid are classified under cash flow
from financing activities.
5. segment Reporting
A segment is a distinguishable component of the Group that is engaged either in providing related
products or services (business segment), or in providing products or services within a particular
economic environment (geographical segment), which is subject to risks and rewards that are
different from those of other segments.
The segment reporting is presented on the primary format, business segments, as per Sri Lanka
Accounting Standard No. 28 - ‘Segment Reporting’. Inter-segment pricing is determined on an arm’s
length basis. Segment information includes revenue, segment result, assets, liabilities and cash flows.
Segment expenses consist of direct expenses pertaining to and directly attributable to the segment.
Considering activities of the operations, segment information based on geographical segments does
not arise.
Inter-segment transfers are based on fair market prices. Segment results, assets and liabilities include
items directly attributable to a segment as well as those that can be allocated on a reasonable basis.
Unallocated items comprise mainly investments, borrowings, income tax assets & liabilities,
investment related revenue and borrowing related expenses.
Segmental capital expenditure is the total cost incurred during the period to acquire property, plant &
equipment and intangible assets other than goodwill.
6. comparative information
Comparative Information is disclosed in respect of the previous period for all amounts reported in
the Financial Statements, in order to enhance the understanding of the current periods Financial
Statements and to enhance the inter period comparability.
balance sheet 163 statement of changes in equity 164 cash f low statement 165 Notes to the f inancia l statements 167
D I E S E L & M OTO R E N G I N E E R I N G P L C
A N N U A L R E P O RT 2 0 1 1 / 1 2180
f I n A n C I A l R e p o RtS n ot e S to t h e f I n A n C I A l StAt e m e n tS
7. new accounting standards issued but not effective as at Balance sheet Date
The Institute of Chartered Accountants of Sri Lanka has issued a new volume of Sri Lanka Accounting
Standards which will become applicable for financial periods beginning on or after 1st January 2012.
Accordingly, these standards have not been applied in preparing these Financial Statements as they
were not effective for the year ended 31st March 2012.
These Sri Lanka Accounting Standards comprise Accounting Standards prefixed both SLFRS
(corresponding to IFRS) and LKAS (corresponding to IAS). Application of Sri Lanka Accounting
Standards prefixed SLFRS and LKAS for the first time shall be deemed to be an adoption of SLFRSs.
The Company/Group has completed the assessment on identifying potential impact on the Financial
Statements on adoption of SLFRS with effect from 1st April 2012 and is in the process of quantifying
the impact on the net assets as at 31st March 2012, the reported net profits after tax for the year then
ended and disclosure requirements arising from the following areas.
lKas 39 - Financial instruments - Recognition and Measurement
According to LKAS 39, trade receivable (debt instrument) is impaired if there is an objective
evidence of impairment exist or a loss event has occurred and it has an impact on the estimated
future cash flows.
The present provisioning policy considers non-recoverability of the debt which would give different
results from what is envisaged by LKAS 39.
The Company/Group is in the process of quantifying the impact on the Financial Statements.
slFRs 8 - operation segments
According to SLFRS 8, the operating segments are identified based on the way in which financial
information is organised and reported to the Chief Operating Decision-Maker. The Group is in the
process of identifying reportable segments under SLFRS 8.
The management is of the view that the implications arising from other are not significant.
statement of directors ’ responsib i l i t ies for the f inancia l statements 159 independent auditors ’ report 161 income statement 162
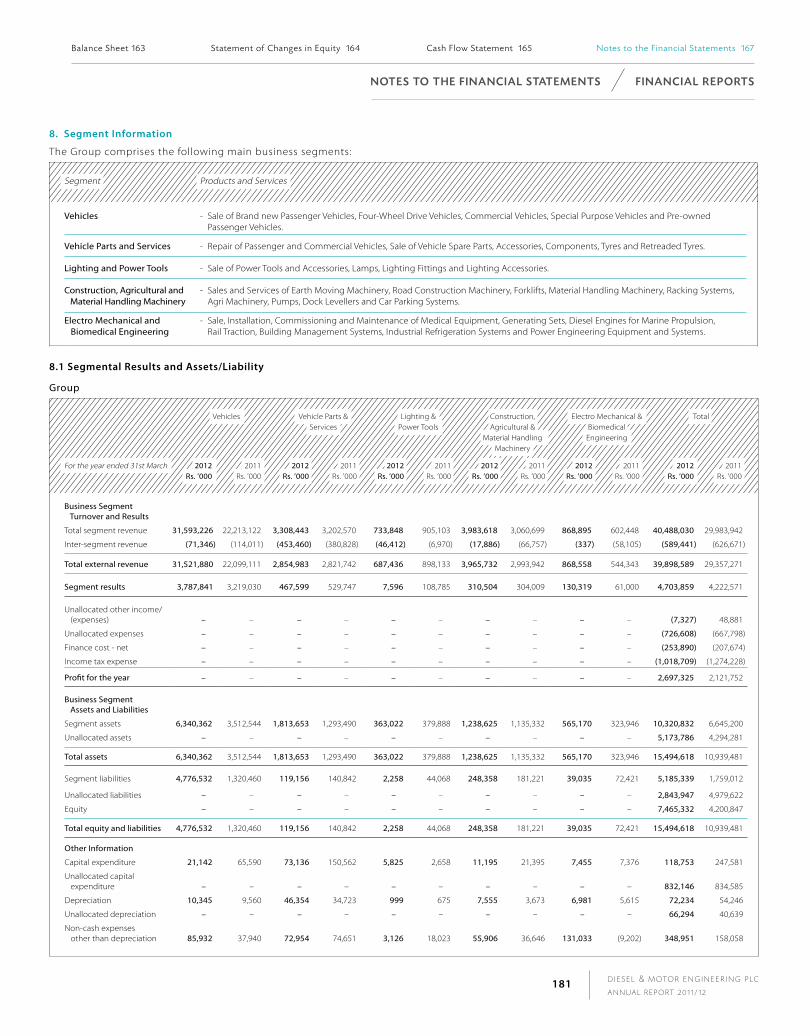
D I E S E L & M OTO R E N G I N E E R I N G P L C
A N N U A L R E P O RT 2 0 1 1 / 1 2181
n ot e S to t h e f I n A n C I A l StAt e m e n tS f I n A n C I A l R e p o RtS
8. segment information
The Group comprises the following main business segments:
Segment Products and Services
Vehicles - Sale of Brand new Passenger Vehicles, Four-Wheel Drive Vehicles, Commercial Vehicles, Special Purpose Vehicles and Pre-owned Passenger Vehicles.
Vehicle Parts and Services - Repair of Passenger and Commercial Vehicles, Sale of Vehicle Spare Parts, Accessories, Components, Tyres and Retreaded Tyres.
Lighting and Power Tools - Sale of Power Tools and Accessories, Lamps, Lighting Fittings and Lighting Accessories.
Construction, Agricultural and Material Handling Machinery
- Sales and Services of Earth Moving Machinery, Road Construction Machinery, Forklifts, Material Handling Machinery, Racking Systems, Agri Machinery, Pumps, Dock Levellers and Car Parking Systems.
Electro Mechanical and Biomedical Engineering
- Sale, Installation, Commissioning and Maintenance of Medical Equipment, Generating Sets, Diesel Engines for Marine Propulsion, Rail Traction, Building Management Systems, Industrial Refrigeration Systems and Power Engineering Equipment and Systems.
8.1 segmental Results and assets/liability
Group
Vehicles Vehicle Parts & Services
Lighting & Power Tools
Construction, Agricultural & Material Handling Machinery
Electro Mechanical & Biomedical Engineering
Total
For the year ended 31st March 2012Rs. ’000
2011Rs. ’000
2012Rs. ’000
2011Rs. ’000
2012Rs. ’000
2011Rs. ’000
2012Rs. ’000
2011Rs. ’000
2012Rs. ’000
2011Rs. ’000
2012Rs. ’000
2011Rs. ’000
Business Segment Turnover and Results
Total segment revenue 31,593,226 22,213,122 3,308,443 3,202,570 733,848 905,103 3,983,618 3,060,699 868,895 602,448 40,488,030 29,983,942
Inter-segment revenue (71,346) (114,011) (453,460) (380,828) (46,412) (6,970) (17,886) (66,757) (337) (58,105) (589,441) (626,671)
Total external revenue 31,521,880 22,099,111 2,854,983 2,821,742 687,436 898,133 3,965,732 2,993,942 868,558 544,343 39,898,589 29,357,271
Segment results 3,787,841 3,219,030 467,599 529,747 7,596 108,785 310,504 304,009 130,319 61,000 4,703,859 4,222,571
Unallocated other income/ (expenses) – – – – – – – – – – (7,327) 48,881
Unallocated expenses – – – – – – – – – – (726,608) (667,798)
Finance cost - net – – – – – – – – – – (253,890) (207,674)
Income tax expense – – – – – – – – – – (1,018,709) (1,274,228)
Profit for the year – – – – – – – – – – 2,697,325 2,121,752
Business Segment Assets and Liabilities
Segment assets 6,340,362 3,512,544 1,813,653 1,293,490 363,022 379,888 1,238,625 1,135,332 565,170 323,946 10,320,832 6,645,200
Unallocated assets – – – – – – – – – – 5,173,786 4,294,281
Total assets 6,340,362 3,512,544 1,813,653 1,293,490 363,022 379,888 1,238,625 1,135,332 565,170 323,946 15,494,618 10,939,481
Segment liabilities 4,776,532 1,320,460 119,156 140,842 2,258 44,068 248,358 181,221 39,035 72,421 5,185,339 1,759,012
Unallocated liabilities – – – – – – – – – – 2,843,947 4,979,622
Equity – – – – – – – – – – 7,465,332 4,200,847
Total equity and liabilities 4,776,532 1,320,460 119,156 140,842 2,258 44,068 248,358 181,221 39,035 72,421 15,494,618 10,939,481
Other Information
Capital expenditure 21,142 65,590 73,136 150,562 5,825 2,658 11,195 21,395 7,455 7,376 118,753 247,581
Unallocated capital expenditure – – – – – – – – – – 832,146 834,585
Depreciation 10,345 9,560 46,354 34,723 999 675 7,555 3,673 6,981 5,615 72,234 54,246
Unallocated depreciation – – – – – – – – – – 66,294 40,639
Non-cash expenses other than depreciation 85,932 37,940 72,954 74,651 3,126 18,023 55,906 36,646 131,033 (9,202) 348,951 158,058
balance sheet 163 statement of changes in equity 164 cash f low statement 165 Notes to the f inancia l statements 167
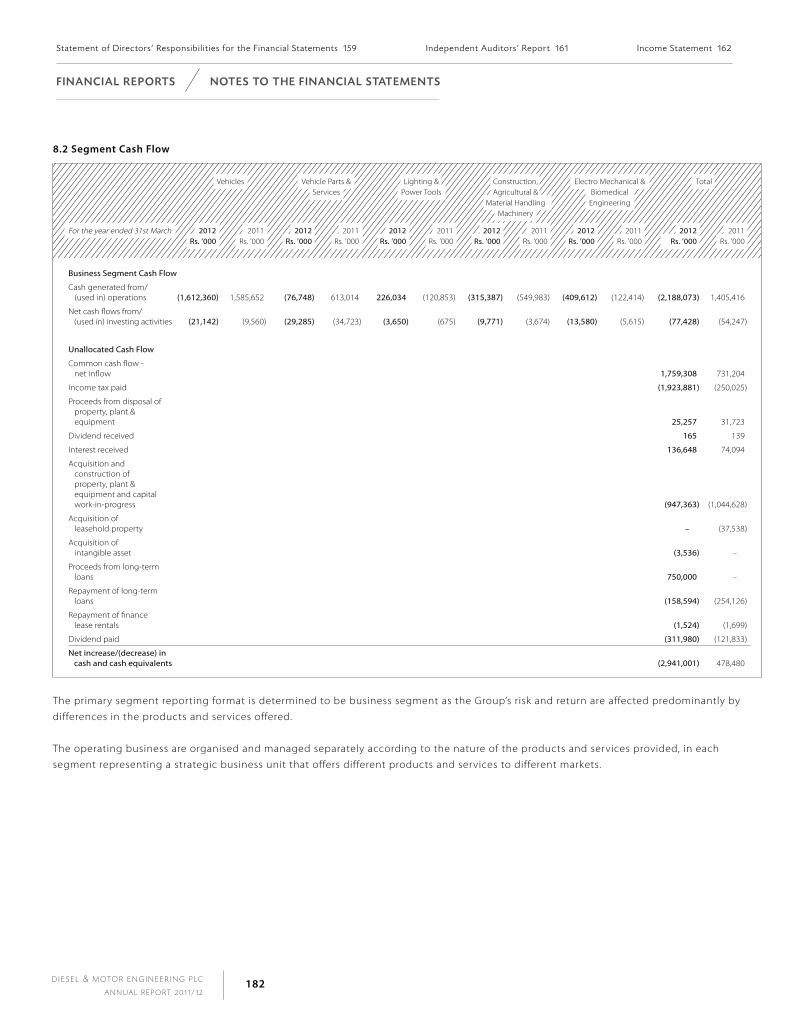
D I E S E L & M OTO R E N G I N E E R I N G P L C
A N N U A L R E P O RT 2 0 1 1 / 1 2182
f I n A n C I A l R e p o RtS n ot e S to t h e f I n A n C I A l StAt e m e n tS
8.2 segment cash Flow
Vehicles Vehicle Parts & Services
Lighting & Power Tools
Construction, Agricultural & Material Handling Machinery
Electro Mechanical & Biomedical Engineering
Total
For the year ended 31st March 2012Rs. ’000
2011Rs. ’000
2012Rs. ’000
2011Rs. ’000
2012Rs. ’000
2011Rs. ’000
2012Rs. ’000
2011Rs. ’000
2012Rs. ’000
2011Rs. ’000
2012Rs. ’000
2011Rs. ’000
Business Segment Cash Flow
Cash generated from/ (used in) operations (1,612,360) 1,585,652 (76,748) 613,014 226,034 (120,853) (315,387) (549,983) (409,612) (122,414) (2,188,073) 1,405,416
Net cash flows from/ (used in) investing activities (21,142) (9,560) (29,285) (34,723) (3,650) (675) (9,771) (3,674) (13,580) (5,615) (77,428) (54,247)
Unallocated Cash Flow
Common cash flow - net inflow 1,759,308 731,204
Income tax paid (1,923,881) (250,025)
Proceeds from disposal of property, plant & equipment 25,257 31,723
Dividend received 165 139
Interest received 136,648 74,094
Acquisition and construction of property, plant & equipment and capital work-in-progress (947,363) (1,044,628)
Acquisition of leasehold property – (37,538)
Acquisition of intangible asset (3,536) –
Proceeds from long-term loans 750,000 –
Repayment of long-term loans (158,594) (254,126)
Repayment of finance lease rentals (1,524) (1,699)
Dividend paid (311,980) (121,833)
Net increase/(decrease) in cash and cash equivalents (2,941,001) 478,480
The primary segment reporting format is determined to be business segment as the Group’s risk and return are affected predominantly by
differences in the products and services offered.
The operating business are organised and managed separately according to the nature of the products and services provided, in each
segment representing a strategic business unit that offers different products and services to different markets.
statement of directors ’ responsib i l i t ies for the f inancia l statements 159 independent auditors ’ report 161 income statement 162

D I E S E L & M OTO R E N G I N E E R I N G P L C
A N N U A L R E P O RT 2 0 1 1 / 1 2183
n ot e S to t h e f I n A n C I A l StAt e m e n tS f I n A n C I A l R e p o RtS
9. other income/(expenses)
Group Company
For the year ended 31st March 2012Rs. ’000
2011Rs. ’000
2012Rs. ’000
2011Rs. ’000
Rent income 10,210 10,541 2,983 3,105
Amortisation of deferred income (Note 29) 3,190 4,004 3,190 3,469
Gain on disposals of investments (Note 9.1) – 5,431 – 31,750
Sundry income 46,955 26,139 34,030 9,609
Dividend income 165 139 3,765 13,638
Gain/(loss) on disposal of property, plant & equipment (67,847) 2,627 (67,883) 3,312
(7,327) 48,881 (23,915) 64,883
9.1 Gain on Disposals of investments
Group Company
For the year ended 31st March 2012Rs. ’000
2011Rs. ’000
2012Rs. ’000
2011Rs. ’000
Sales proceeds – 38,500 – 38,500
Less: Net assets – (33,069) – (6,750)
Gain from disposals – 5,431 – 31,750
The Company divested its 45% of shareholding in Browns Dimo Industrial Products (Pvt) Ltd. in 2010/11.
10. net Finance cost
Group Company
For the year ended 31st March 2012Rs. ’000
2011Rs. ’000
2012Rs. ’000
2011Rs. ’000
Finance Income
Interest income 136,648 74,094 135,290 73,671
Exchange gain on translation of foreign currency 60,130 21,313 44,363 20,195
Total finance income 196,778 95,407 179,653 93,866
Finance Costs
Interest on long-term borrowings (59,738) (60,658) (59,738) (60,658)
Interest on short-term borrowings (390,461) (240,571) (387,346) (238,540)
Interest on finance lease (469) (1,852) (469) (1,852)
Total finance cost (450,668) (303,081) (447,553) (301,050)
Net finance cost (253,890) (207,674) (267,900) (207,184)
balance sheet 163 statement of changes in equity 164 cash f low statement 165 Notes to the f inancia l statements 167
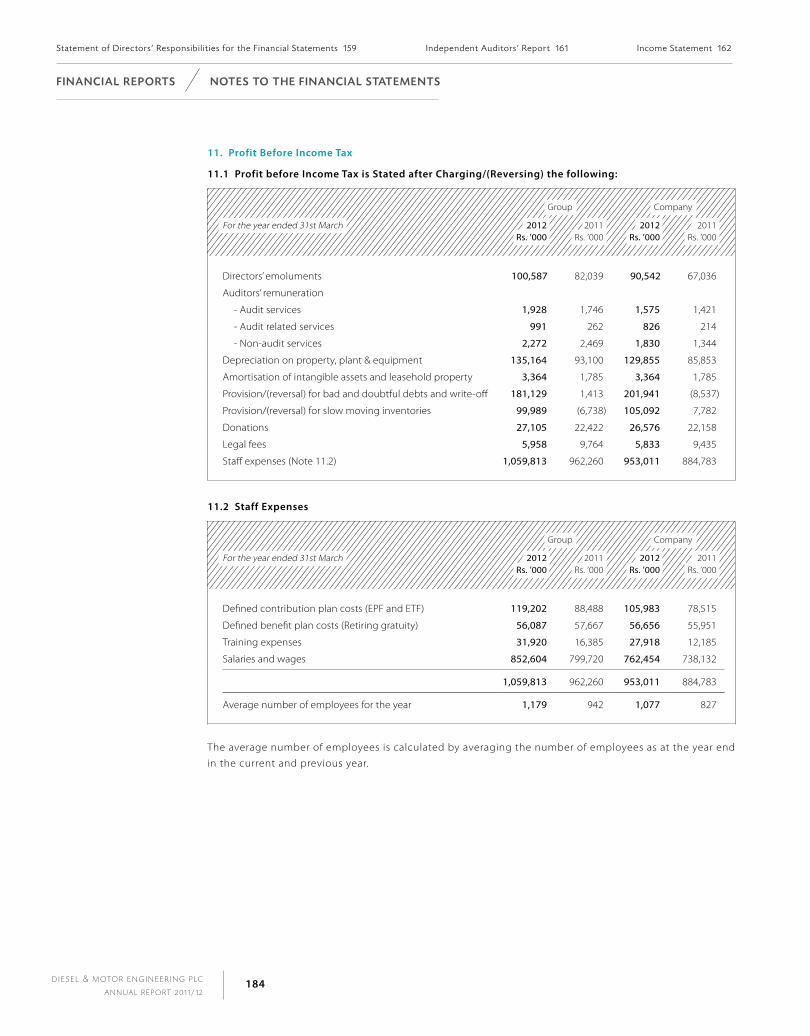
D I E S E L & M OTO R E N G I N E E R I N G P L C
A N N U A L R E P O RT 2 0 1 1 / 1 2184
f I n A n C I A l R e p o RtS n ot e S to t h e f I n A n C I A l StAt e m e n tS
11. profit Before income Tax
11.1 profit before income Tax is stated after charging/(Reversing) the following:
Group Company
For the year ended 31st March 2012Rs. ’000
2011Rs. ’000
2012Rs. ’000
2011Rs. ’000
Directors’ emoluments 100,587 82,039 90,542 67,036
Auditors’ remuneration
- Audit services 1,928 1,746 1,575 1,421
- Audit related services 991 262 826 214
- Non-audit services 2,272 2,469 1,830 1,344
Depreciation on property, plant & equipment 135,164 93,100 129,855 85,853
Amortisation of intangible assets and leasehold property 3,364 1,785 3,364 1,785
Provision/(reversal) for bad and doubtful debts and write-off 181,129 1,413 201,941 (8,537)
Provision/(reversal) for slow moving inventories 99,989 (6,738) 105,092 7,782
Donations 27,105 22,422 26,576 22,158
Legal fees 5,958 9,764 5,833 9,435
Staff expenses (Note 11.2) 1,059,813 962,260 953,011 884,783
11.2 staff expenses
Group Company
For the year ended 31st March 2012Rs. ’000
2011Rs. ’000
2012Rs. ’000
2011Rs. ’000
Defined contribution plan costs (EPF and ETF) 119,202 88,488 105,983 78,515
Defined benefit plan costs (Retiring gratuity) 56,087 57,667 56,656 55,951
Training expenses 31,920 16,385 27,918 12,185
Salaries and wages 852,604 799,720 762,454 738,132
1,059,813 962,260 953,011 884,783
Average number of employees for the year 1,179 942 1,077 827
The average number of employees is calculated by averaging the number of employees as at the year end
in the current and previous year.
statement of directors ’ responsib i l i t ies for the f inancia l statements 159 independent auditors ’ report 161 income statement 162
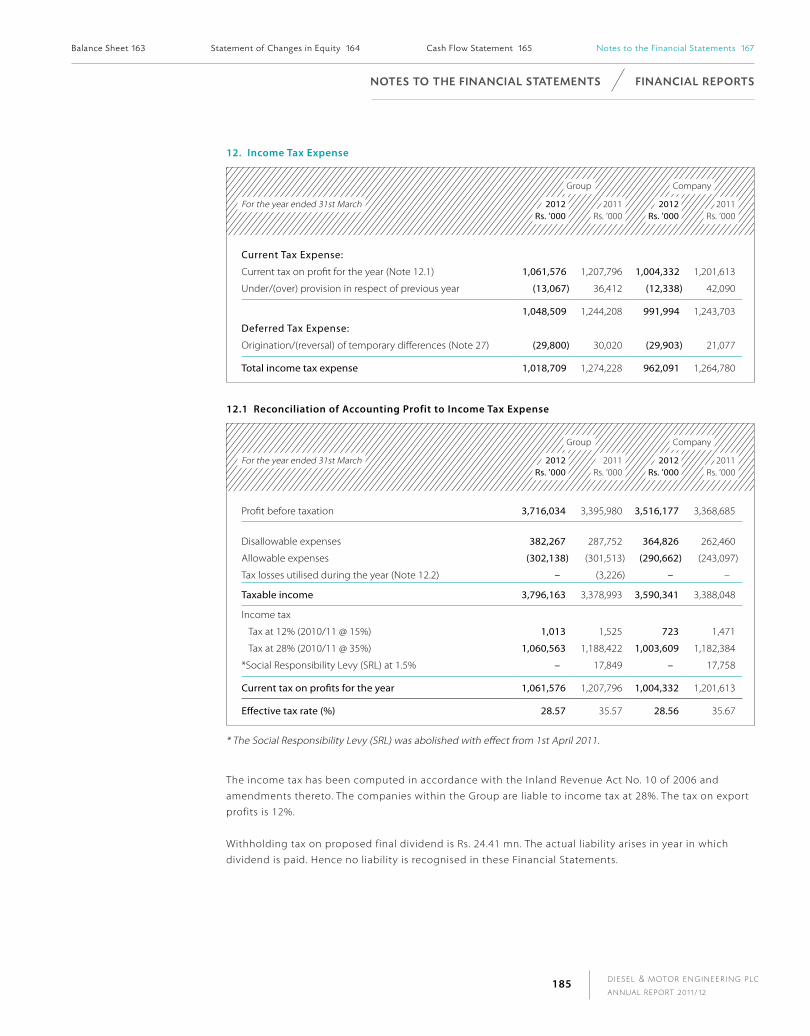
D I E S E L & M OTO R E N G I N E E R I N G P L C
A N N U A L R E P O RT 2 0 1 1 / 1 2185
n ot e S to t h e f I n A n C I A l StAt e m e n tS f I n A n C I A l R e p o RtS
12. income Tax expense
Group Company
For the year ended 31st March 2012Rs. ’000
2011Rs. ’000
2012Rs. ’000
2011Rs. ’000
Current Tax Expense:
Current tax on profit for the year (Note 12.1) 1,061,576 1,207,796 1,004,332 1,201,613
Under/(over) provision in respect of previous year (13,067) 36,412 (12,338) 42,090
1,048,509 1,244,208 991,994 1,243,703
Deferred Tax Expense:
Origination/(reversal) of temporary differences (Note 27) (29,800) 30,020 (29,903) 21,077
Total income tax expense 1,018,709 1,274,228 962,091 1,264,780
12.1 Reconciliation of accounting profit to income Tax expense
Group Company
For the year ended 31st March 2012Rs. ’000
2011Rs. ’000
2012Rs. ’000
2011Rs. ’000
Profit before taxation 3,716,034 3,395,980 3,516,177 3,368,685
Disallowable expenses 382,267 287,752 364,826 262,460
Allowable expenses (302,138) (301,513) (290,662) (243,097)
Tax losses utilised during the year (Note 12.2) – (3,226) – –
Taxable income 3,796,163 3,378,993 3,590,341 3,388,048
Income tax
Tax at 12% (2010/11 @ 15%) 1,013 1,525 723 1,471
Tax at 28% (2010/11 @ 35%) 1,060,563 1,188,422 1,003,609 1,182,384
*Social Responsibility Levy (SRL) at 1.5% – 17,849 – 17,758
Current tax on profits for the year 1,061,576 1,207,796 1,004,332 1,201,613
Effective tax rate (%) 28.57 35.57 28.56 35.67
* The Social Responsibility Levy (SRL) was abolished with effect from 1st April 2011.
The income tax has been computed in accordance with the Inland Revenue Act No. 10 of 2006 and
amendments thereto. The companies within the Group are liable to income tax at 28%. The tax on export
profits is 12%.
Withholding tax on proposed final dividend is Rs. 24.41 mn. The actual liability arises in year in which
dividend is paid. Hence no liability is recognised in these Financial Statements.
balance sheet 163 statement of changes in equity 164 cash f low statement 165 Notes to the f inancia l statements 167

D I E S E L & M OTO R E N G I N E E R I N G P L C
A N N U A L R E P O RT 2 0 1 1 / 1 2186
f I n A n C I A l R e p o RtS n ot e S to t h e f I n A n C I A l StAt e m e n tS
12.2 Tax losses Brought Forward and Utilised During the Year
Group Company
For the year ended 31st March 2012Rs. ’000
2011Rs. ’000
2012Rs. ’000
2011Rs. ’000
Tax losses at the beginning of the year 9,580 12,805 – –
Loss incurred during the year 966 1 – –
Utilised during the year – (3,226) – –
Tax losses at the end of the year 10,546 9,580 – –
As explained in Note 27.3 the loss arising from Dimo Industries (Pvt) Ltd. has not been recognised for
deferred tax computation.
13. earnings per share
13.1 Earnings per share has been calculated by dividing the net profit for the year attributable to equity
holders of the Company by the weighted average number of ordinary shares outstanding during the year.
The weighted average number of ordinary shares outstanding during the year and the previous year are
adjusted for events that have changed the number of ordinary shares outstanding during the year, as per
the requirements of the Sri Lanka Accounting Standard No. 34 - ‘Earnings per Share’.
13.2 calculation of earnings per share
Group Company
For the year ended 31st March 2012 2011 2012 2011
Profit attributable to ordinary shareholders (Rs. ’000) 2,697,325 2,121,752 2,554,086 2,103,905
Weighted average number of ordinary shares 8,876,437 8,876,437 8,876,437 8,876,437
Earnings per ordinary share (Rs.) 303.87 239.03 287.74 237.02
Movement of number of shares during the year 2011/12
Number of shares held as at beginning of the year 8,702,389
Issue of Scrip Dividend - May 2011 174,048
Number of shares held as at end of the year 8,876,437
As explained in Note 14 to the Financial Statements, during the year, the Company issued shares as a
scrip dividend which resulted in an increase of 174,048 ordinary shares of the Company. The increased
ordinary shares of 8,876,437 has been considered for the computation of earnings per share. As required
by Sri Lanka Accounting Standard No. 34 - ‘Earnings Per Share’, the EPS for the prior year has already been
adjusted to reflect the said increase in number of ordinary shares.
statement of directors ’ responsib i l i t ies for the f inancia l statements 159 independent auditors ’ report 161 income statement 162

D I E S E L & M OTO R E N G I N E E R I N G P L C
A N N U A L R E P O RT 2 0 1 1 / 1 2187
n ot e S to t h e f I n A n C I A l StAt e m e n tS f I n A n C I A l R e p o RtS
14. Dividends
calculation of Dividend per share
Company
For the year ended 31st March 2012Rs. ’000
2011Rs. ’000
Interim dividend paid - First interim 44,382 43,512
- Second interim 66,573 43,512
Final dividend approved - Cash dividend 244,102 201,025
- Scrip dividend – 242,797
355,057 530,846
Dividend per share (Rs.) 40.00 61.00
Two interim dividends of Rs. 5.00 and Rs. 7.50 per share were paid in December 2011 and March 2012
respectively to the shareholders of the Company. This amounted to a total interim dividend of Rs. 12.50
(2010/11 - Rs. 10 per share) per share for the Financial Year 2011/12.
14.1 approved Final Dividend
The Board of Directors of the Company has approved the payment of a final dividend of Rs. 27.50 per
share for the year ended 31st March 2012 (2010/11 - Rs. 51.00 per share which consisted of a cash
dividend of Rs. 23.10 per share and a scrip dividend of Rs. 27.90 per share). In accordance with the SLAS
12 (revised 2005) on ‘Event After the Balance Sheet Date’, this final dividend, has not been recognised as a
liability in the Financial Statement as at 31st March 2012.
14.2 compliance with section 57 of companies act no. 07 of 2007
The Board of Directors was satisfied that the Company would meet the solvency requirements
immediately after the interim dividends were paid in December 2011 and March 2012, and after payment
of the final dividend. The Board provided the Statements of Solvency to the Auditors and obtained
Certificates of Solvency from them in respect of each dividend payment, as required by the Companies
Act No. 7 of 2007.
balance sheet 163 statement of changes in equity 164 cash f low statement 165 Notes to the f inancia l statements 167

D I E S E L & M OTO R E N G I N E E R I N G P L C
A N N U A L R E P O RT 2 0 1 1 / 1 2188
f I n A n C I A l R e p o RtS n ot e S to t h e f I n A n C I A l StAt e m e n tS
15. property, plant & equipment
Freehold Land
Buildings &Premises
Lease holdBuildings &
Premises
Plant & Machinery
Tools &Implements
MotorVehicles
Leased Motor
Vehicles
Computer Hardware &
Software
Electrical Fixtures, Fittings, &
Office Equipment
Total
Rs. ’000 Rs. ’000 Rs. ’000 Rs. ’000 Rs. ’000 Rs. ’000 Rs. ’000 Rs. ’000 Rs. ’0002012
Rs. ’000 2011
Rs. ’000
a. Group
Cost or ValuationBalance at the beginning of the year 2,015,808 617,259 22,423 298,320 143,982 271,366 5,750 144,370 184,479 3,703,757 2,740,467 Revaluation 879,140 – – – – – – – – 879,140 – Additions 403,162 136,698 – 14,658 18,818 135,626 – 33,905 47,755 790,622 1,044,628 * Transfers – – – – – 5,750 (5,750) – – – – Disposals – (82,760) – – – (48,765) – – – (131,525) (81,338)
Balance at the end of the year 3,298,110 671,197 22,423 312,978 162,800 363,977 – 178,275 232,234 5,241,994 3,703,757
DepreciationBalance at the beginning of the year – 95,516 9,170 92,411 111,824 138,762 4,955 94,062 97,018 643,718 602,720 Charge for the year – 15,145 3,628 20,105 14,197 52,022 795 16,482 12,790 135,164 93,100 * Transfers – – – – – 5,750 (5,750) – – – – On disposals – (4,272) – – – (34,149) – – – (38,421) (52,102)
Balance at the end of the year – 106,389 12,798 112,516 126,021 162,385 – 110,544 109,808 740,461 643,718
Carrying amount before capital work-in-progress as at end of the year 3,298,110 564,808 9,625 200,462 36,779 201,592 – 67,731 122,426 4,501,533 3,060,039
Capital work-in-progress at cost – 152,951 – 202 – – – – 3,588 156,741 –
Carrying amount as at 31st March 2012 3,298,110 717,759 9,625 200,664 36,779 201,592 – 67,731 126,014 4,658,274 –
Carrying amount as at 31st March 2011 2,015,808 521,743 13,253 205,909 32,158 132,604 795 50,308 87,461 – 3,060,039
b. Company Cost or ValuationBalance at the beginning of the year 2,015,808 613,971 22,423 270,985 129,595 267,644 5,750 131,583 170,313 3,628,072 2,639,437 Additions 403,162 136,648 – 10,627 18,318 135,665 – 29,948 47,438 781,806 1,034,741 Revaluation 879,140 – – – – – – – – 879,140 – * Transfers – – – – – 5,750 (5,750) – – – – Disposals – (82,760) – – – (48,657) – – – (131,417) (46,106)
Balance at the end of the year 3,298,110 667,859 22,423 281,612 147,913 360,402 – 161,531 217,751 5,157,601 3,628,072
DepreciationBalance at the beginning of the year – 93,583 9,170 83,715 98,998 137,399 4,955 84,055 90,170 602,045 559,814 Charge for the year – 15,055 3,628 18,705 13,353 51,453 795 15,113 11,753 129,855 85,853 * Transfers – – – – – 5,750 (5,750) – – – – On disposals – (4,272) – – – (34,040) – – – (38,312) (43,622)
Balance at the end of the year – 104,366 12,798 102,420 112,351 160,562 – 99,168 101,923 693,588 602,045
Carrying amount before capital work-in-progress as at end of the year 3,298,110 563,493 9,625 179,192 35,562 199,840 – 62,363 115,828 4,464,013 3,026,027
Capital work-in-progress at cost – 152,951 – 202 – – – – 3,588 156,741 –
Carrying amount as at 31st March 2012 3,298,110 716,444 9,625 179,394 35,562 199,840 – 62,363 119,416 4,620,754 –
Carrying amount as at 31st March 2011 2,015,808 520,388 13,253 187,270 30,597 130,245 795 47,528 80,143 – 3,026,027
* During the year, leased motor vehicles were transferred to motor vehicles upon expiration of the lease contracts.
statement of directors ’ responsib i l i t ies for the f inancia l statements 159 independent auditors ’ report 161 income statement 162
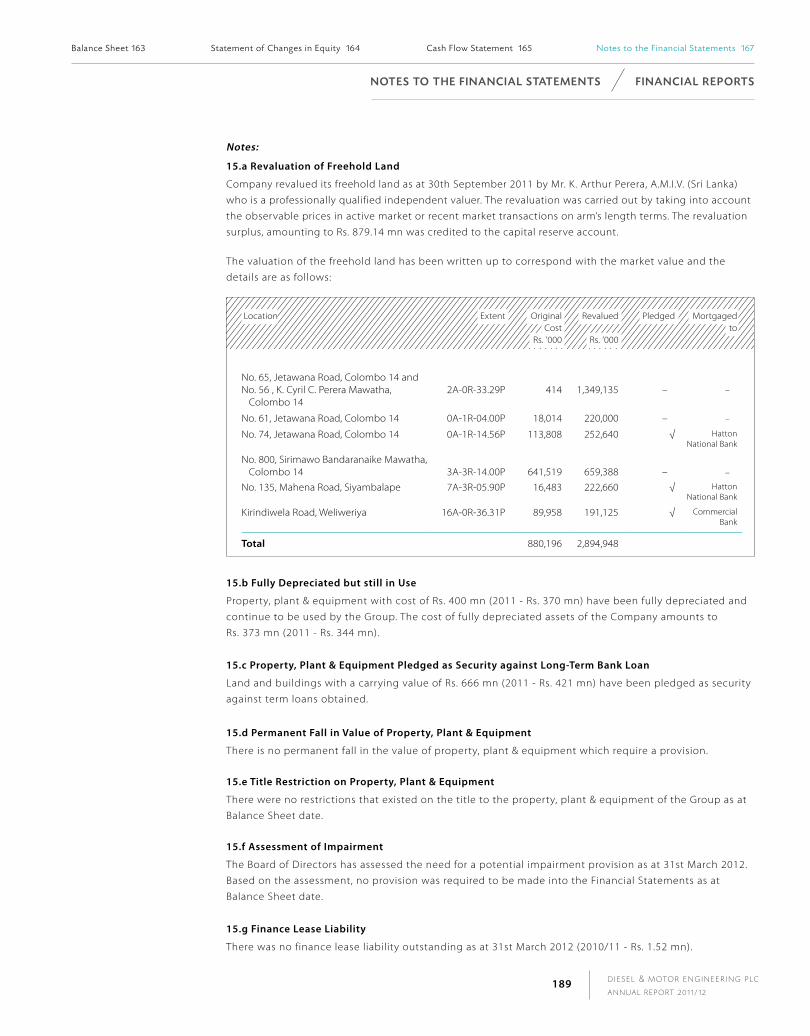
D I E S E L & M OTO R E N G I N E E R I N G P L C
A N N U A L R E P O RT 2 0 1 1 / 1 2189
n ot e S to t h e f I n A n C I A l StAt e m e n tS f I n A n C I A l R e p o RtS
notes:
15.a Revaluation of Freehold land
Company revalued its freehold land as at 30th September 2011 by Mr. K. Arthur Perera, A.M.I.V. (Sri Lanka)
who is a professionally qualified independent valuer. The revaluation was carried out by taking into account
the observable prices in active market or recent market transactions on arm’s length terms. The revaluation
surplus, amounting to Rs. 879.14 mn was credited to the capital reserve account.
The valuation of the freehold land has been written up to correspond with the market value and the
details are as follows:
Location Extent OriginalCost
Rs. ’000
Revalued
Rs. ’000
Pledged Mortgagedto
No. 65, Jetawana Road, Colombo 14 and No. 56 , K. Cyril C. Perera Mawatha, Colombo 14
2A-0R-33.29P 414 1,349,135 – –
No. 61, Jetawana Road, Colombo 14 0A-1R-04.00P 18,014 220,000 – –
No. 74, Jetawana Road, Colombo 14 0A-1R-14.56P 113,808 252,640 √ HattonNational Bank
No. 800, Sirimawo Bandaranaike Mawatha, Colombo 14 3A-3R-14.00P 641,519 659,388 – –
No. 135, Mahena Road, Siyambalape 7A-3R-05.90P 16,483 222,660 √ Hatton National Bank
Kirindiwela Road, Weliweriya 16A-0R-36.31P 89,958 191,125 √ Commercial Bank
Total 880,196 2,894,948
15.b Fully Depreciated but still in Use
Property, plant & equipment with cost of Rs. 400 mn (2011 - Rs. 370 mn) have been fully depreciated and
continue to be used by the Group. The cost of fully depreciated assets of the Company amounts to
Rs. 373 mn (2011 - Rs. 344 mn).
15.c property, plant & equipment pledged as security against long-Term Bank loan
Land and buildings with a carrying value of Rs. 666 mn (2011 - Rs. 421 mn) have been pledged as security
against term loans obtained.
15.d permanent Fall in Value of property, plant & equipment
There is no permanent fall in the value of property, plant & equipment which require a provision.
15.e Title Restriction on property, plant & equipment
There were no restrictions that existed on the title to the property, plant & equipment of the Group as at
Balance Sheet date.
15.f assessment of impairment
The Board of Directors has assessed the need for a potential impairment provision as at 31st March 2012.
Based on the assessment, no provision was required to be made into the Financial Statements as at
Balance Sheet date.
15.g Finance lease liability
There was no finance lease liability outstanding as at 31st March 2012 (2010/11 - Rs. 1.52 mn).
balance sheet 163 statement of changes in equity 164 cash f low statement 165 Notes to the f inancia l statements 167

D I E S E L & M OTO R E N G I N E E R I N G P L C
A N N U A L R E P O RT 2 0 1 1 / 1 2190
f I n A n C I A l R e p o RtS n ot e S to t h e f I n A n C I A l StAt e m e n tS
16. leasehold property
Group Company
As at 31st March 2012Rs. ’000
2011Rs. ’000
2012Rs. ’000
2011Rs. ’000
Cost
Balance at the beginning of the year (Note 16.1) 39,938 2,400 39,938 2,400
Additions during the year – 37,538 – 37,538
Balance at the end of the year 39,938 39,938 39,938 39,938
Accumulated Amortisation
Balance at the beginning of the year 2,182 1,040 2,182 1,040
Amortisation for the year 2,205 1,142 2,205 1,142
Balance at the end of the year 4,387 2,182 4,387 2,182
Carrying amount at the end of the year 35,551 37,756 35,551 37,756
16.1 Details of leasehold property
Location Lease AmountRs. ’000
Duration
i. No. 562/126, D.S. Senanayake Mawatha, Anuradhapura
2,400 Commenced from April 1997 to August 2021
ii. No. 562/100, Jayanthi Mawatha, Anuradhapura 37,538 Commenced from October 2010 to May 2028
39,938
17. intangible assets
Group Company
As at 31st March 2012Rs. ’000
2011Rs. ’000
2012Rs. ’000
2011Rs. ’000
Cost
Balance at the beginning of the year 2,808 2,808 2,808 2,808
* Additions during the year 3,536 – 3,536 –
Balance at the end of the year 6,344 2,808 6,344 2,808
Accumulated Amortisation
Balance at the beginning of the year 2,106 1,463 2,106 1,463 Amortisation for the year 1,159 643 1,159 643
Balance at the end of the year 3,265 2,106 3,265 2,106
Carrying amount at the end of the year 3,079 702 3,079 702
*Additions consist of Rs. 3.5 mn invested on upgrading human resource information system software.
statement of directors ’ responsib i l i t ies for the f inancia l statements 159 independent auditors ’ report 161 income statement 162

D I E S E L & M OTO R E N G I N E E R I N G P L C
A N N U A L R E P O RT 2 0 1 1 / 1 2191
n ot e S to t h e f I n A n C I A l StAt e m e n tS f I n A n C I A l R e p o RtS
17.1 assessment of impairment
Computer software purchase cost has been classified as an intangible asset. Based on the assessment of
potential impairment that has been internally carried out by the Board of Directors as at 31st March 2012,
no provision was required to be made in the Financial Statements as at the year end.
18. investment in subsidiaries
Company
As at 31st March Percentage ofHolding
2012Rs. ’000
2011Rs. ’000
Unquoted investment-ordinary shares
Dimo (Pvt) Ltd. - 25,000 ordinary shares 100% 250 250
Dimo Industries (Pvt) Ltd. - 2,305,000 ordinary shares 100% 23,050 23,050
Dimo Travels (Pvt) Ltd. - 500 ordinary shares 100% 50 50
23,350 23,350
Impairment provision (Note 18.1) (12,205) (15,000)
11,145 8,350
18.1 impairment provision
Company
As at 31st March 2012Rs. ’000
2011Rs. ’000
Balance as at beginning of the year 15,000 –
Impairment provision/(reversal) (2,795) 15,000
Balance as at end of the year 12,205 15,000
Impairment assessment had been carried out as at 31st March 2012 and it was concluded that all the
investments included under unquoted investments exceed net realisable value over its carrying value
except for Dimo Industries (Pvt) Ltd. In the opinion of the Board of Directors, impairment loss of
Rs. 12.2 mn (2010/11 - Rs. 15 mn) had been recorded in the Financial Statements in relation to investment
in Dimo Industries (Pvt) Ltd. Accordingly the remaining Rs. 2.79 mn was reversed to Income Statement.
The Board of Directors decided to transfer the operation of Dimo Industries (Pvt) Ltd. to Diesel & Motor
Engineering PLC with effect from 31st December 2010.
balance sheet 163 statement of changes in equity 164 cash f low statement 165 Notes to the f inancia l statements 167
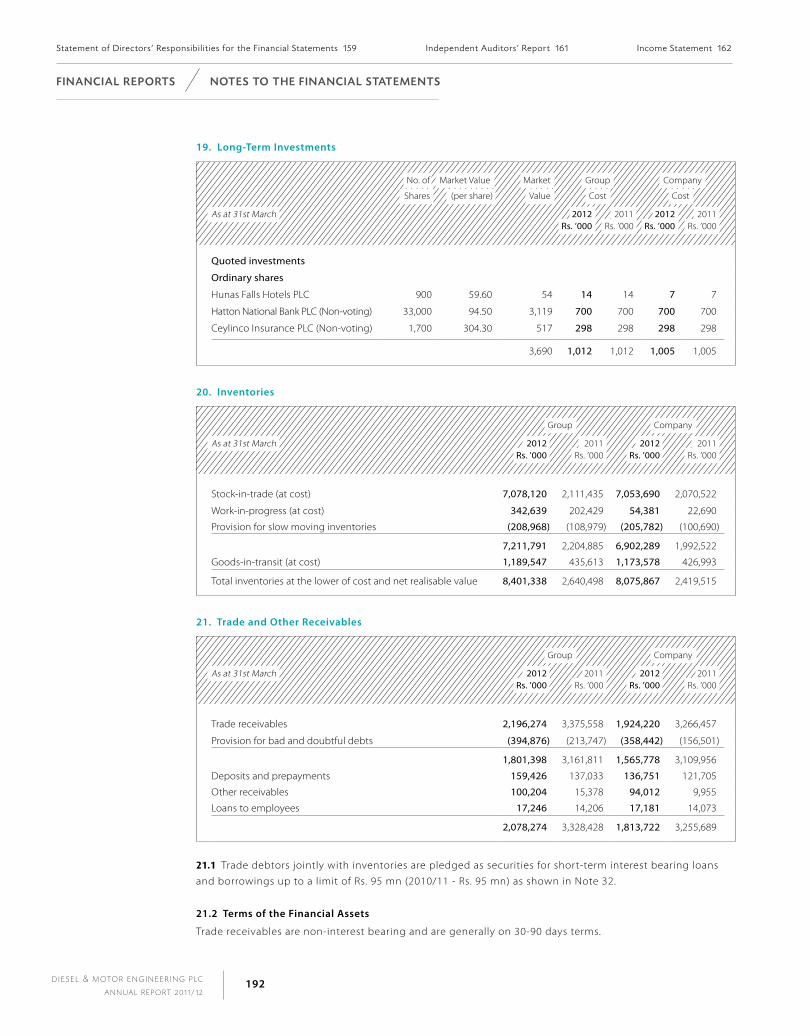
D I E S E L & M OTO R E N G I N E E R I N G P L C
A N N U A L R E P O RT 2 0 1 1 / 1 2192
f I n A n C I A l R e p o RtS n ot e S to t h e f I n A n C I A l StAt e m e n tS
19. long-Term investments
No. of Market Value Market Group Company
Shares (per share) Value Cost Cost
As at 31st March 2012Rs. ’000
2011Rs. ’000
2012Rs. ’000
2011Rs. ’000
Quoted investments
Ordinary shares
Hunas Falls Hotels PLC 900 59.60 54 14 14 7 7
Hatton National Bank PLC (Non-voting) 33,000 94.50 3,119 700 700 700 700
Ceylinco Insurance PLC (Non-voting) 1,700 304.30 517 298 298 298 298
3,690 1,012 1,012 1,005 1,005
20. inventories
Group Company
As at 31st March 2012Rs. ’000
2011Rs. ’000
2012Rs. ’000
2011Rs. ’000
Stock-in-trade (at cost) 7,078,120 2,111,435 7,053,690 2,070,522
Work-in-progress (at cost) 342,639 202,429 54,381 22,690
Provision for slow moving inventories (208,968) (108,979) (205,782) (100,690)
7,211,791 2,204,885 6,902,289 1,992,522
Goods-in-transit (at cost) 1,189,547 435,613 1,173,578 426,993
Total inventories at the lower of cost and net realisable value 8,401,338 2,640,498 8,075,867 2,419,515
21. Trade and other Receivables
Group Company
As at 31st March 2012Rs. ’000
2011Rs. ’000
2012Rs. ’000
2011Rs. ’000
Trade receivables 2,196,274 3,375,558 1,924,220 3,266,457
Provision for bad and doubtful debts (394,876) (213,747) (358,442) (156,501)
1,801,398 3,161,811 1,565,778 3,109,956
Deposits and prepayments 159,426 137,033 136,751 121,705
Other receivables 100,204 15,378 94,012 9,955
Loans to employees 17,246 14,206 17,181 14,073
2,078,274 3,328,428 1,813,722 3,255,689
21.1 Trade debtors jointly with inventories are pledged as securities for short-term interest bearing loans
and borrowings up to a limit of Rs. 95 mn (2010/11 - Rs. 95 mn) as shown in Note 32.
21.2 Terms of the Financial assets
Trade receivables are non-interest bearing and are generally on 30-90 days terms.
statement of directors ’ responsib i l i t ies for the f inancia l statements 159 independent auditors ’ report 161 income statement 162

D I E S E L & M OTO R E N G I N E E R I N G P L C
A N N U A L R E P O RT 2 0 1 1 / 1 2193
n ot e S to t h e f I n A n C I A l StAt e m e n tS f I n A n C I A l R e p o RtS
22. cash and cash equivalents
Group Company
As at 31st March 2012Rs. ’000
2011Rs. ’000
2012Rs. ’000
2011Rs. ’000
Bank balances 297,973 310,781 160,480 241,706
Investment in Treasury Bills – 1,549,133 – 1,549,133
Cash in hand 19,117 11,132 18,516 10,531
317,090 1,871,046 178,996 1,801,370
Investments in treasury bills are made for varying periods of between one week and three months,
depending on the immediate cash requirements of the Company, and earn interest at the respective
treasury bill rates.
23. stated capital
Group/Company
As at 31st March 2012 2011No. of shares Rs. ’000 No. of Shares Rs. ’000
Ordinary shares
Issued and fully-paid ordinary shares
Balance at the beginning of the year 8,702,389 182,500 8,702,389 182,500
Scrip dividend during the year 174,048 242,797 – –
Balance at the end of the year 8,876,437 425,297 8,702,389 182,500
The increase in Stated Capital represents the scrip dividends paid in May 2011.
24. capital Reserve
Group Company
As at 31st March 2012Rs. ’000
2011Rs. ’000
2012Rs. ’000
2011Rs. ’000
Balance at the beginning of the year 1,135,612 1,135,612 1,135,612 1,135,612
Revaluation surplus 879,140 – 879,140 –
Balance at the end of the year 2,014,752 1,135,612 2,014,752 1,135,612
24.1 Revaluation surplus
Cost and revalued amounts relating to revaluation of freehold land are depicted in Note 15 (a) to the
Financial Statements.
balance sheet 163 statement of changes in equity 164 cash f low statement 165 Notes to the f inancia l statements 167

D I E S E L & M OTO R E N G I N E E R I N G P L C
A N N U A L R E P O RT 2 0 1 1 / 1 2194
f I n A n C I A l R e p o RtS n ot e S to t h e f I n A n C I A l StAt e m e n tS
25. Revenue Reserves
Group Company
As at 31st March 2012Rs. ’000
2011Rs. ’000
2012Rs. ’000
2011Rs. ’000
Balance at the beginning of the year 2,882,735 882,816 2,634,751 652,679
Dividend to shareholders
2010/11 Final - Cash dividend (201,025) (34,809) (201,025) (34,809)
- Scrip dividend (242,797) – (242,797) –
2011/12 - First interim (44,382) (43,512) (44,382) (43,512)
2011/12 - Second interim (66,573) (43,512) (66,573) (43,512)
Profit for the year 2,697,325 2,121,752 2,554,086 2,103,905
Balance at the end of the year 5,025,283 2,882,735 4,634,060 2,634,751
The revenue reserves represent reserves available for distribution.
26. employee Benefits
Group Company
As at 31st March 2012Rs. ’000
2011Rs. ’000
2012Rs. ’000
2011Rs. ’000
Present value of unfunded obligation 224,434 182,327 216,824 173,713
Balance at the beginning of the year 182,327 142,138 173,713 132,607
Current service cost 15,375 13,058 14,257 11,674
Interest cost 19,144 15,626 18,240 14,586
Actuarial losses/(gain) 21,568 28,983 24,159 29,691
Total charge for the year 56,087 57,667 56,656 55,951
Paid during the year (13,980) (17,478) (13,545) (14,845)
Balance at the end of the year 224,434 182,327 216,824 173,713
An actuarial valuation for gratuity liability was carried out as at 31st March 2012 by Mr. M. Poopalanathan,
AIA of Messrs Actuarial and Management Consultants (Pvt) Ltd., a firm of professional actuaries.
The valuation method used by the actuaries to value the fund is the ‘Projected Unit Credit Method’, the
method recommended by the Sri Lanka Accounting Standard No. 16 (Revised 2006) - ‘Employee Benefits’.
The following assumptions and data were used in valuing the defined benefit obligation by the
actuarial valuer:
Rate of Discount - 10.5%Salary Escalation Rate - 10.0%
statement of directors ’ responsib i l i t ies for the f inancia l statements 159 independent auditors ’ report 161 income statement 162

D I E S E L & M OTO R E N G I N E E R I N G P L C
A N N U A L R E P O RT 2 0 1 1 / 1 2195
n ot e S to t h e f I n A n C I A l StAt e m e n tS f I n A n C I A l R e p o RtS
Assumptions regarding future mortality are based on a 67/70 mortality table, issued by the Institute of Actuaries, London.
Normal retirement age of an executive employee is assumed to be 60 years while non-executive employee is assumed to
retire at the age of 55 years.
The current service cost, interest cost and actuarial losses for the year under review are included under
Administration Expenses.
However, according to the Payment of Gratuity Act No. 12 of 1983, the liability for gratuity to an employee arises only on
completion of five years of continuous service. The liability as required by the Payment of Gratuity Act for the Group and
the Company as at 31st March 2012 amounted to Rs. 220 mn and Rs. 214 mn respectively.
27. Deferred Tax liabilities
Group Company
As at 31st March 2012Rs. ’000
2011Rs. ’000
2012Rs. ’000
2011Rs. ’000
Summary of Net Deferred Tax Liabilities
Balance at the beginning of the year 58,157 28,137 57,155 36,078
Origination/(reversal) of temporary differences (29,800) 30,020 (29,903) 21,077
Balance at the end of the year (Note 27.1) 28,357 58,157 27,252 57,155
27.1 Reconciliation of net Deferred Tax liabilities
Group Company
As at 31st March 2012Rs. ’000
2011Rs. ’000
2012Rs. ’000
2011Rs. ’000
Temporary difference of property, plant and equipment 325,708 390,030 314,154 377,839
Temporary difference of defined benefit obligations (224,433) (182,327) (216,824) (173,713)
Net temporary differences 101,275 207,703 97,330 204,126
Net deferred tax liability at the end of the year 28,357 58,157 27,252 57,155
27.2 Movement in Temporary Differences during the Year
Group Company
Balance as at
01.04.2011Rs. ’000
Recognised in Income Statement
Rs. ’000
Balance as at
31.03.2012Rs. ’000
Balance as at
01.04.2011Rs. ’000
Recognised in Income Statement
Rs. ’000
Balance as at
31.03.2012Rs. ’000
Property, plant & equipment 109,208 (18,010) 91,198 105,795 (17,832) 87,963
Retirement benefit obligation (51,051) (11,790) (62,841) (48,640) (12,071) (60,711)
58,157 (29,800) 28,357 57,155 (29,903) 27,252
balance sheet 163 statement of changes in equity 164 cash f low statement 165 Notes to the f inancia l statements 167
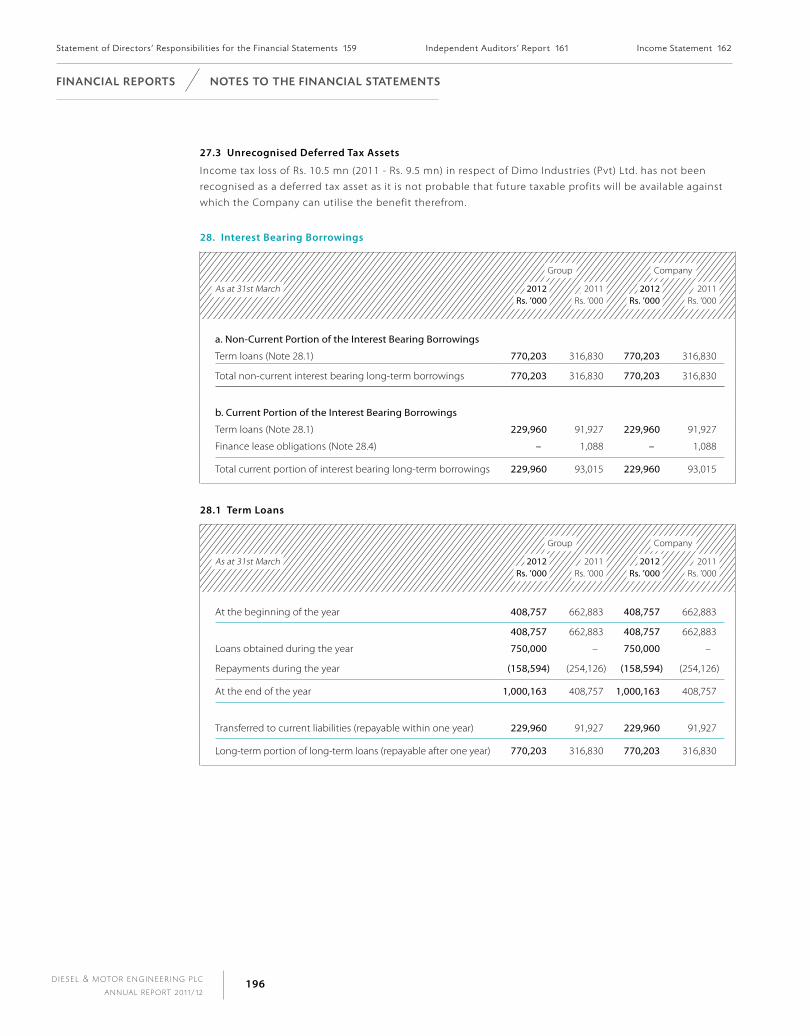
D I E S E L & M OTO R E N G I N E E R I N G P L C
A N N U A L R E P O RT 2 0 1 1 / 1 2196
f I n A n C I A l R e p o RtS n ot e S to t h e f I n A n C I A l StAt e m e n tS
27.3 Unrecognised Deferred Tax assets
Income tax loss of Rs. 10.5 mn (2011 - Rs. 9.5 mn) in respect of Dimo Industries (Pvt) Ltd. has not been
recognised as a deferred tax asset as it is not probable that future taxable profits will be available against
which the Company can utilise the benefit therefrom.
28. interest Bearing Borrowings
Group Company
As at 31st March 2012Rs. ’000
2011Rs. ’000
2012Rs. ’000
2011Rs. ’000
a. Non-Current Portion of the Interest Bearing Borrowings
Term loans (Note 28.1) 770,203 316,830 770,203 316,830
Total non-current interest bearing long-term borrowings 770,203 316,830 770,203 316,830
b. Current Portion of the Interest Bearing Borrowings
Term loans (Note 28.1) 229,960 91,927 229,960 91,927
Finance lease obligations (Note 28.4) – 1,088 – 1,088
Total current portion of interest bearing long-term borrowings 229,960 93,015 229,960 93,015
28.1 Term loans
Group Company
As at 31st March 2012Rs. ’000
2011Rs. ’000
2012Rs. ’000
2011Rs. ’000
At the beginning of the year 408,757 662,883 408,757 662,883
408,757 662,883 408,757 662,883
Loans obtained during the year 750,000 – 750,000 –
Repayments during the year (158,594) (254,126) (158,594) (254,126)
At the end of the year 1,000,163 408,757 1,000,163 408,757
Transferred to current liabilities (repayable within one year) 229,960 91,927 229,960 91,927
Long-term portion of long-term loans (repayable after one year) 770,203 316,830 770,203 316,830
statement of directors ’ responsib i l i t ies for the f inancia l statements 159 independent auditors ’ report 161 income statement 162

D I E S E L & M OTO R E N G I N E E R I N G P L C
A N N U A L R E P O RT 2 0 1 1 / 1 2197
n ot e S to t h e f I n A n C I A l StAt e m e n tS f I n A n C I A l R e p o RtS
28.2 principal amounts of long-Term Borrowings
Company
Lender2012
Rs. ’000 2011
Rs. ’000
Balance Outstanding as at 31st March 2012 Pledged Repayments Tenure
Commercial Bank of Ceylon PLC
Loan - 1 400,000 400,000 236,830 √ Repayable in 120 Instalments commencing from
February 2008
Total 400,000 400,000 236,830
Hatton National Bank PLC
Loan - 1 120,000 120,000 – Fully-settled during the year.
Loan - 2 200,000 200,000 80,000 √ Repayable in 60 Instalments commencing from
March 2009
Total 320,000 320,000 80,000
DFCC Bank
Loan - 1 250,000 – 208,333
Repayable in 60 Instalments commencing from
June 2011
Total 250,000 – 208,333
Bank of Ceylon
Loan - 1 500,000 – 475,000
Repayable in 60 Instalments commencing from
January 2012
Total 500,000 – 475,000
Total 1,470,000 720,000 1,000,163
Details of land which were pledged against above bank loan facilities are disclosed in Note 15 (a).
balance sheet 163 statement of changes in equity 164 cash f low statement 165 Notes to the f inancia l statements 167

D I E S E L & M OTO R E N G I N E E R I N G P L C
A N N U A L R E P O RT 2 0 1 1 / 1 2198
f I n A n C I A l R e p o RtS n ot e S to t h e f I n A n C I A l StAt e m e n tS
28.3 analysis of long-Term interest-Bearing Borrowings by the year of Repayment
CommercialBank of
Ceylon PLC
Hatton National
Bank PLC
DFCCBank
Bank of Ceylon
Total 2012
Rs. ’000
Total 2011
Rs. ’000
Movement of Loans
Balance at the beginning of the year 276,790 131,967 – – 408,757 662,883
Loans obtained during the year – – 250,000 500,000 750,000 –
Repayments during the year (39,960) (51,967) (41,667) (25,000) (158,594) (254,126)
Balance at the end of the year 236,830 80,000 208,333 475,000 1,000,163 408,757
Analysis of Long-Term Borrowings by Year of Repayment
Long-term loan repayable within 1 year from year end 39,960 40,000 50,000 100,000 229,960 91,927
Long-term loan repayable between 2 and 5 years from year end 159,840 40,000 158,333 375,000 733,173 239,840
Long-term loan repayable later than 5 years from year end 37,030 – – – 37,030 76,990
236,830 80,000 208,333 475,000 1,000,163 408,757
28.4 Finance lease obligations
Group Company
As at 31st March 2012Rs. ’000
2011Rs. ’000
2012Rs. ’000
2011Rs. ’000
Finance lease liability at the beginning of the year 1,524 3,223 1,524 3,223
Payment during the year (1,524) (1,699) (1,524) (1,699)
Gross lease obligation at the end of the year – 1,524 – 1,524
Interest in suspense – (436) – (436)
Net liability at the end of the year – 1,088 – 1,088
statement of directors ’ responsib i l i t ies for the f inancia l statements 159 independent auditors ’ report 161 income statement 162
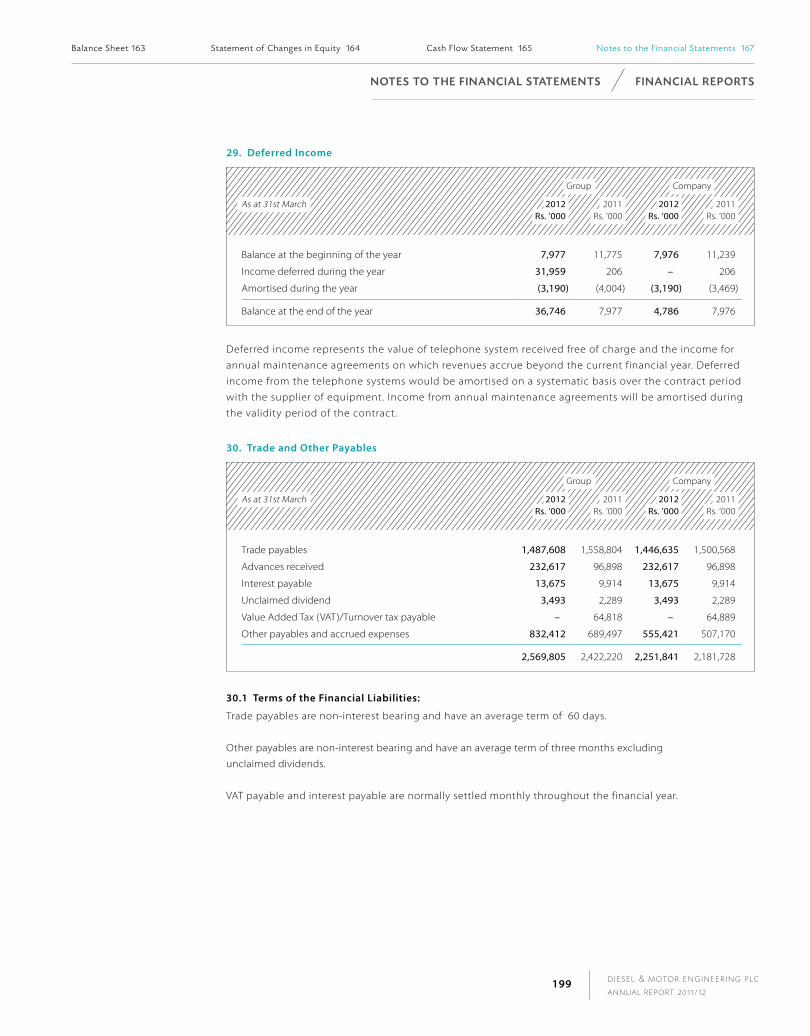
D I E S E L & M OTO R E N G I N E E R I N G P L C
A N N U A L R E P O RT 2 0 1 1 / 1 2199
n ot e S to t h e f I n A n C I A l StAt e m e n tS f I n A n C I A l R e p o RtS
29. Deferred income
Group Company
As at 31st March 2012Rs. ’000
2011Rs. ’000
2012Rs. ’000
2011Rs. ’000
Balance at the beginning of the year 7,977 11,775 7,976 11,239
Income deferred during the year 31,959 206 – 206
Amortised during the year (3,190) (4,004) (3,190) (3,469)
Balance at the end of the year 36,746 7,977 4,786 7,976
Deferred income represents the value of telephone system received free of charge and the income for
annual maintenance agreements on which revenues accrue beyond the current financial year. Deferred
income from the telephone systems would be amortised on a systematic basis over the contract period
with the supplier of equipment. Income from annual maintenance agreements will be amortised during
the validity period of the contract.
30. Trade and other payables
Group Company
As at 31st March 2012Rs. ’000
2011Rs. ’000
2012Rs. ’000
2011Rs. ’000
Trade payables 1,487,608 1,558,804 1,446,635 1,500,568
Advances received 232,617 96,898 232,617 96,898
Interest payable 13,675 9,914 13,675 9,914
Unclaimed dividend 3,493 2,289 3,493 2,289
Value Added Tax (VAT)/Turnover tax payable – 64,818 – 64,889
Other payables and accrued expenses 832,412 689,497 555,421 507,170
2,569,805 2,422,220 2,251,841 2,181,728
30.1 Terms of the Financial liabilities:
Trade payables are non-interest bearing and have an average term of 60 days.
Other payables are non-interest bearing and have an average term of three months excluding
unclaimed dividends.
VAT payable and interest payable are normally settled monthly throughout the financial year.
balance sheet 163 statement of changes in equity 164 cash f low statement 165 Notes to the f inancia l statements 167
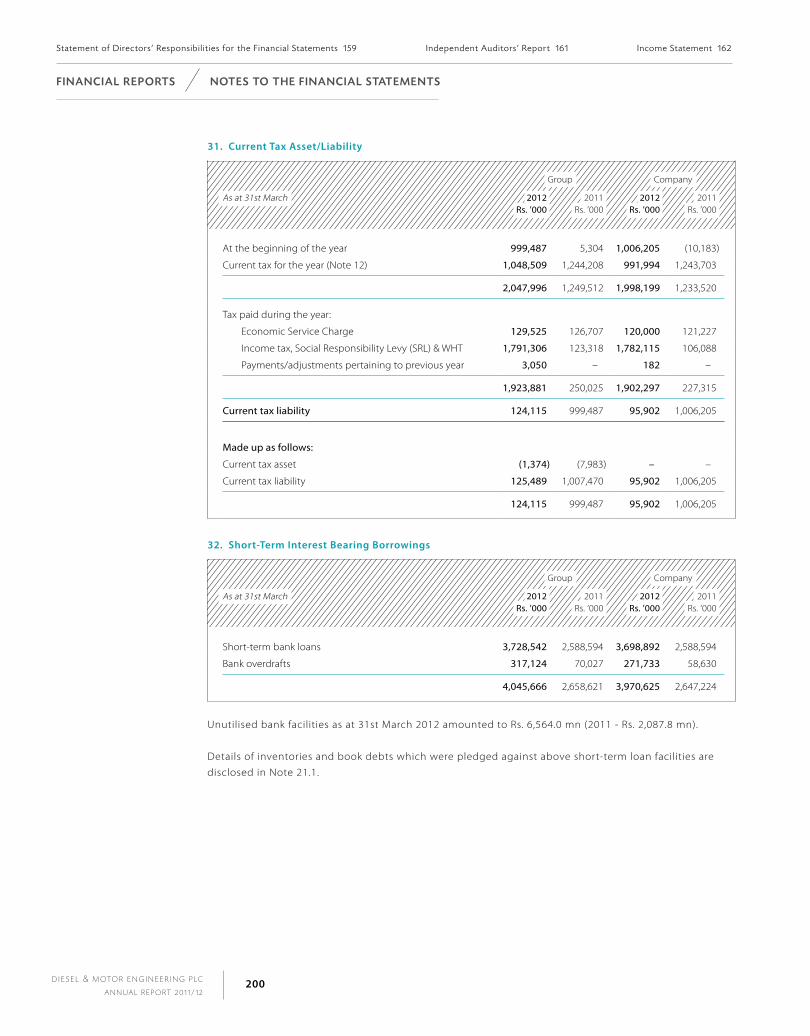
D I E S E L & M OTO R E N G I N E E R I N G P L C
A N N U A L R E P O RT 2 0 1 1 / 1 2200
f I n A n C I A l R e p o RtS n ot e S to t h e f I n A n C I A l StAt e m e n tS
31. current Tax asset/liability
Group Company
As at 31st March 2012Rs. ’000
2011Rs. ’000
2012Rs. ’000
2011Rs. ’000
At the beginning of the year 999,487 5,304 1,006,205 (10,183)
Current tax for the year (Note 12) 1,048,509 1,244,208 991,994 1,243,703
2,047,996 1,249,512 1,998,199 1,233,520
Tax paid during the year:
Economic Service Charge 129,525 126,707 120,000 121,227
Income tax, Social Responsibility Levy (SRL) & WHT 1,791,306 123,318 1,782,115 106,088
Payments/adjustments pertaining to previous year 3,050 – 182 –
1,923,881 250,025 1,902,297 227,315
Current tax liability 124,115 999,487 95,902 1,006,205
Made up as follows:
Current tax asset (1,374) (7,983) – –
Current tax liability 125,489 1,007,470 95,902 1,006,205
124,115 999,487 95,902 1,006,205
32. short-Term interest Bearing Borrowings
Group Company
As at 31st March 2012Rs. ’000
2011Rs. ’000
2012Rs. ’000
2011Rs. ’000
Short-term bank loans 3,728,542 2,588,594 3,698,892 2,588,594
Bank overdrafts 317,124 70,027 271,733 58,630
4,045,666 2,658,621 3,970,625 2,647,224
Unutilised bank facilities as at 31st March 2012 amounted to Rs. 6,564.0 mn (2011 - Rs. 2,087.8 mn).
Details of inventories and book debts which were pledged against above short-term loan facilities are
disclosed in Note 21.1.
statement of directors ’ responsib i l i t ies for the f inancia l statements 159 independent auditors ’ report 161 income statement 162
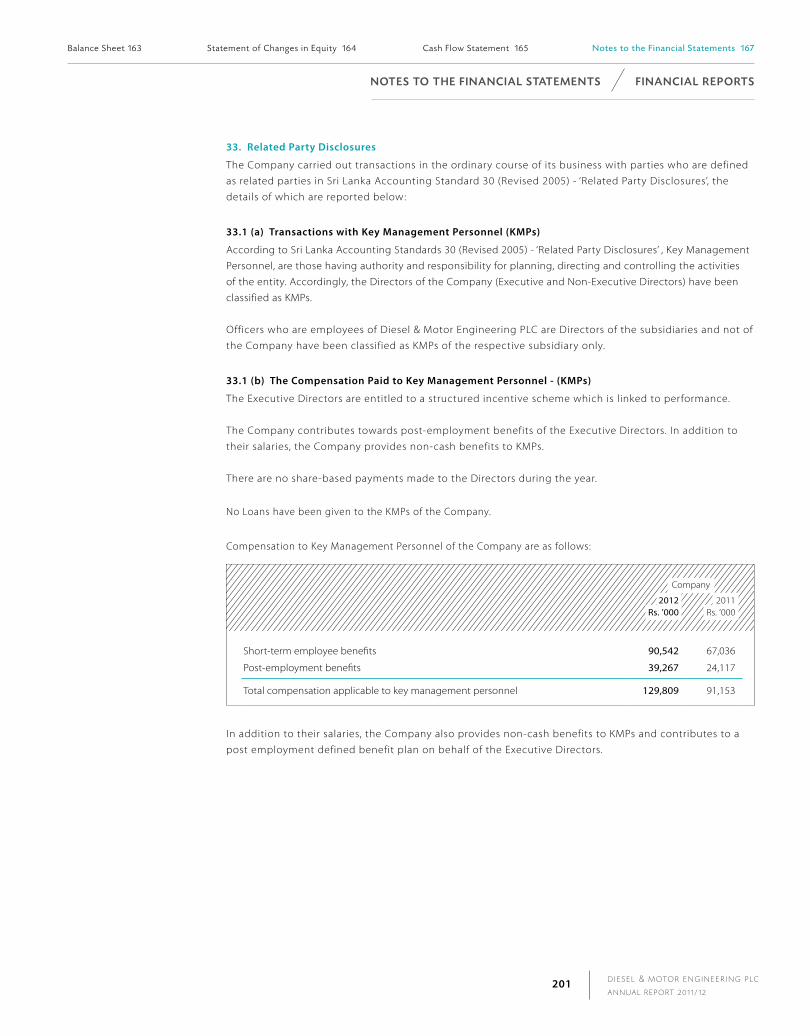
n ot e S to t h e f I n A n C I A l StAt e m e n tS f I n A n C I A l R e p o RtS
D I E S E L & M OTO R E N G I N E E R I N G P L C
A N N U A L R E P O RT 2 0 1 1 / 1 2201
33. Related party Disclosures
The Company carried out transactions in the ordinary course of its business with parties who are defined
as related parties in Sri Lanka Accounting Standard 30 (Revised 2005) - ‘Related Party Disclosures’, the
details of which are reported below:
33.1 (a) Transactions with Key Management personnel (KMps)
According to Sri Lanka Accounting Standards 30 (Revised 2005) - ‘Related Party Disclosures’ , Key Management
Personnel, are those having authority and responsibility for planning, directing and controlling the activities
of the entity. Accordingly, the Directors of the Company (Executive and Non-Executive Directors) have been
classified as KMPs.
Officers who are employees of Diesel & Motor Engineering PLC are Directors of the subsidiaries and not of
the Company have been classified as KMPs of the respective subsidiary only.
33.1 (b) The compensation paid to Key Management personnel - (KMps)
The Executive Directors are entitled to a structured incentive scheme which is linked to performance.
The Company contributes towards post-employment benefits of the Executive Directors. In addition to
their salaries, the Company provides non-cash benefits to KMPs.
There are no share-based payments made to the Directors during the year.
No Loans have been given to the KMPs of the Company.
Compensation to Key Management Personnel of the Company are as follows:
Company
2012 Rs. ’000
2011 Rs. ’000
Short-term employee benefits 90,542 67,036
Post-employment benefits 39,267 24,117
Total compensation applicable to key management personnel 129,809 91,153
In addition to their salaries, the Company also provides non-cash benefits to KMPs and contributes to a
post employment defined benefit plan on behalf of the Executive Directors.
balance sheet 163 statement of changes in equity 164 cash f low statement 165 Notes to the F inancia l Statements 167

D I E S E L & M OTO R E N G I N E E R I N G P L C
A N N U A L R E P O RT 2 0 1 1 / 1 2202
f I n A n C I A l R e p o RtS n ot e S to t h e f I n A n C I A l StAt e m e n tS
33.1 (c) Transactions with close Family Members
Immediate family members are defined as spouse or dependant. Dependant is defined as any one
who depends on the respective Director for more than 50% of his/her financial needs.
There were no transactions with the close family members during the year.
33.2 Transactions with subsidiaries
Name of the Company Dimo(Pvt) Ltd.
DimoIndustries
(Pvt) Ltd.
DimoTravels
(Pvt) Ltd.
Shareholding 100%Rs. ’000
100%Rs. ’000
100%Rs. ’000
TotalRs. ’000
Balance due to subsidiaries at the beginning of the year (104,840) (8,538) (327) (113,705)
Sale of goods and services 57,173 – – 57,173Purchase of goods and services (51,012) – – (51,012)Expense incurred on behalf of subsidiaries 49,468 – – 49,468 Fund transfers - net (39,641) (900) – (40,541)
Balance due to subsidiaries at the end of the year (88,852) (9,438) (327) (98,617)
Diesel & Motor Engineering PLC and Dimo (Pvt) Ltd. are enjoying joint banking facilities. The Company
has issued guarantees and letters of credit amounting to Rs. 377 mn on behalf of Dimo (Pvt) Ltd. as at
the Balance Sheet date.
33.3 Transactions with companies significantly influenced by Key Management personnel (KMp)
Mr A.M. Pandithage who is a Director of the Company is the Chairman of Hayleys PLC. The transactions
with Hayleys Group companies during the year ended 31st March 2012 are as follows:
The Group purchased goods and services from the Hayleys Group to the value of Rs. 13.6 mn during
the year. Hayleys Group purchased goods and services from Dimo Group companies during the year
to the value of Rs. 14.5 mn.
The balances due to and due from Hayleys Group of companies as at 31st March 2012 are as follows.
Rs. ’000
Balance due to Hayleys Group of Companies –
Balances due from Hayleys Group of Companies 208
Terms and Conditions of Transactions with the companies which have significant influence by KMPs
Outstanding balances at the year-end relating to the Companies which have significant influence
by KMPs, are unsecured, interest free and all related party dues are on demand. There have been no
guarantees provided or received for any related party receivables or payables. For the year ended
31st March 2012, the Group has not recorded any impairment of receivables relating to amounts
owed by related parties (2010/11 - Rs. Nil).
statement of directors ’ responsib i l i t ies for the f inancia l statements 159 independent auditors ’ report 161 income statement 162
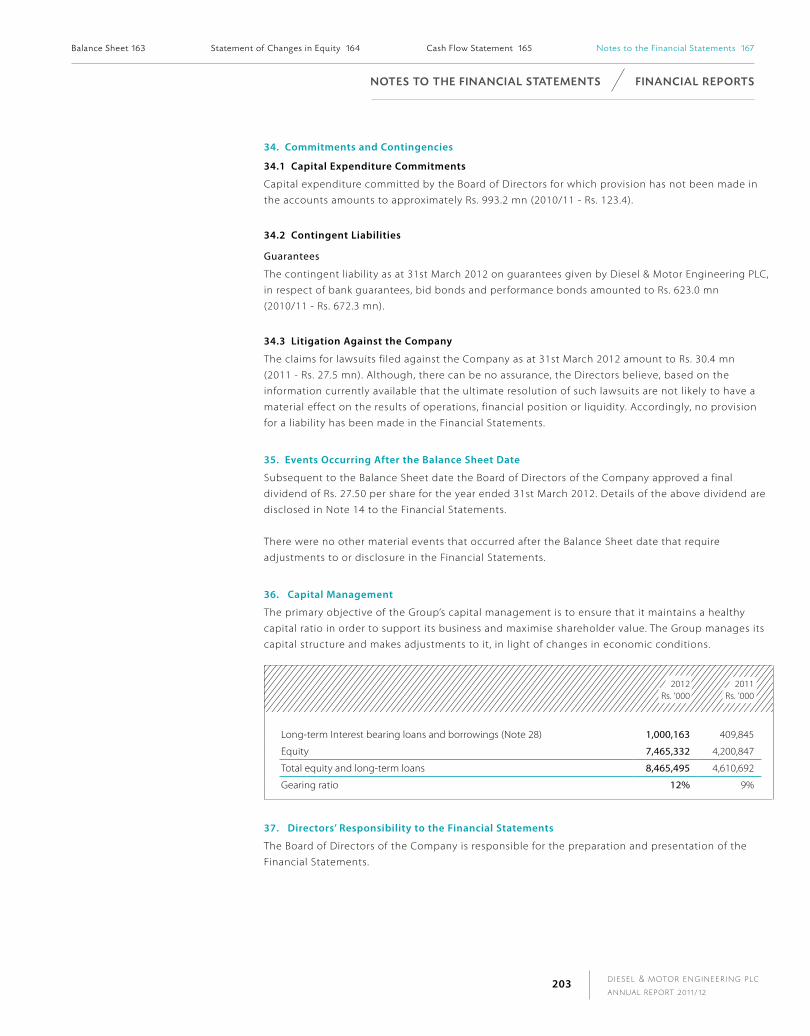
D I E S E L & M OTO R E N G I N E E R I N G P L C
A N N U A L R E P O RT 2 0 1 1 / 1 2203
n ot e S to t h e f I n A n C I A l StAt e m e n tS f I n A n C I A l R e p o RtS
34. commitments and contingencies
34.1 capital expenditure commitments
Capital expenditure committed by the Board of Directors for which provision has not been made in
the accounts amounts to approximately Rs. 993.2 mn (2010/11 - Rs. 123.4).
34.2 contingent liabilities
Guarantees
The contingent liability as at 31st March 2012 on guarantees given by Diesel & Motor Engineering PLC,
in respect of bank guarantees, bid bonds and performance bonds amounted to Rs. 623.0 mn
(2010/11 - Rs. 672.3 mn).
34.3 litigation against the company
The claims for lawsuits filed against the Company as at 31st March 2012 amount to Rs. 30.4 mn
(2011 - Rs. 27.5 mn). Although, there can be no assurance, the Directors believe, based on the
information currently available that the ultimate resolution of such lawsuits are not likely to have a
material effect on the results of operations, financial position or liquidity. Accordingly, no provision
for a liability has been made in the Financial Statements.
35. events occurring after the Balance sheet Date
Subsequent to the Balance Sheet date the Board of Directors of the Company approved a final
dividend of Rs. 27.50 per share for the year ended 31st March 2012. Details of the above dividend are
disclosed in Note 14 to the Financial Statements.
There were no other material events that occurred after the Balance Sheet date that require
adjustments to or disclosure in the Financial Statements.
36. capital Management
The primary objective of the Group’s capital management is to ensure that it maintains a healthy
capital ratio in order to support its business and maximise shareholder value. The Group manages its
capital structure and makes adjustments to it, in light of changes in economic conditions.
2012Rs. ’000
2011Rs. ’000
Long-term Interest bearing loans and borrowings (Note 28) 1,000,163 409,845
Equity 7,465,332 4,200,847
Total equity and long-term loans 8,465,495 4,610,692
Gearing ratio 12% 9%
37. Directors’ Responsibility to the Financial statements
The Board of Directors of the Company is responsible for the preparation and presentation of the
Financial Statements.
balance sheet 163 statement of changes in equity 164 cash f low statement 165 Notes to the f inancia l statements 167

D I E S E L & M OTO R E N G I N E E R I N G P L C
A N N U A L R E P O RT 2 0 1 1 / 1 2204
f I n A n C I A l R e p o RtS n ot e S to t h e f I n A n C I A l StAt e m e n tS
Topics Page
Annex to Enterprise Governance 206
Board of Directors - Profiles 235
Ten Year Summary 236
Share Information 237
Our Heritage 243
Group Structure 246
Awards 247
Country Report 248
Glossary 253
Independent Assurance Statement on
the Non-Financial Reporting 255
GRI and Global Compact Index 258
GRI Application Level Check 259
Alphabetical Index 260
Notice of Meeting 261
Form of Proxy Enclosed
APPendices

D I E S E L & M OTO R E N G I N E E R I N G P L C
A N N U A L R E P O RT 2 0 1 1 / 1 2206
Table of compliance with the code of Best Practices on corporate Governance jointly issued by the securities and exchange
commission of sri Lanka and The institute of chartered Accountants of sri Lanka (The code)
S E C T I O N 1 : T h e co m PA n y
A. directors
A.1 The Board
Main Principle:
Every public company should be headed by an effective Board, which should direct, lead and control the Company.
Code Reference Requirement of the Code Compliance with the Code
A.1.1 The Board should meet regularly, at least once in
every quarter
The Board members meet regularly in accordance with a pre-agreed plan,
which includes at least a quarterly meeting, and additionally, as and when
there are pressing corporate or commercial matters to be considered or
decided upon. The Board met 9 times during the financial year. The dates
of the Board meetings during the year are given on table 232 Average
attendance at Board meetings was 97%.
A.1.2 Board should be responsible for matters
including: Ensuring the formulation and
implementation of a sound business strategy
The Board provides stewardship, vision and strategic direction to the
Group and fosters a culture of integrity, transparency and accountability
across the Group. A stakeholder centric approach is adopted in strategy
formulation. A review of business, marketing and financial and other
strategies and their implementation takes place during the Board
meetings. The Board also meets the Group Management Committee at
least once a year and discusses and provides direction on matters relating
to strategy formulation.
Ensuring that the CEO and the Management
Team possess the skills, experience, and
knowledge to implement strategy
The Directors are from diverse backgrounds and bring to bear a wide
range of experience and competencies that facilitates the effective
discharging of Board's responsibilities. The Board ensures that the
Chairman/MD, CEO, Executive Directors and the Management Team
posses the skills to implement the overall strategy.
The Board approves all appointments to the Group Management
Committee (GMC), which consists of the senior management. The Board
takes into consideration the skills and experience of the members prior to
their appointments in order to ensure the members suitability to hold the
position in the GMC as well as his/her regular position in the managerial
capacity of the Company.
A brief résumé of Directors, including the Directors who offer themselves
for re-election is available on pages 234, 235 and 261.
A P P e n d i c e s A n n e x to e n t e r p r i s e G ov e r n A n c e
notes to the F inancia l statements 167 Annex to enterpr ise Governance 206 Board of Directors - prof i les 235 ten Year summary 236

D I E S E L & M OTO R E N G I N E E R I N G P L C
A N N U A L R E P O RT 2 0 1 1 / 1 2207
Code Reference Requirement of the Code Compliance with the Code
Ensuring the adoption of an effective CEO and
senior management succession strategy
Succession planning is given due recognition in the corporate culture.
Effective succession planning is a criterion in the performance appraisals
of the senior management. The Board with the assistance of the
Nomination Committee reviews succession plans available for the senior
management.
Ensuring effective systems to secure integrity
of information, internal controls and risk
management
The Board monitors and evaluates risks and performance, approves
all important investment decisions and oversees installation of sound
internal financial controls.
Measures taken towards an effective internal control system is given
under D.2.1.
Risk management framework is given in the Risk Management Report
appearing from pages 128 to 140.
Ensuring compliance with laws, regulations and
ethical standards
The Board follows a policy of strict compliance with laws and regulatory
requirements.
‘Never compromise on DIMO Ethics’ is part of the Company’s statement of
values. A document containing the Company Values and Ethics is given to
all employees. Whilst the Code of Ethics demands strict compliance, the
Internal Auditors are expected to report to the Audit Committee on any
non-compliance with laws and/or Ethics.
Ensuring all stakeholder interests are considered
in corporate decisions
In addition to fulfilling its obligations for increased stakeholder value, the
Board has responsibility to DIMO’s customers, employees, suppliers and
to the communities where it operates - all of whom are essential to a
successful business.
Interactions with stakeholders are dealt with in more detail in the
Management Report from pages 18 to 113.
Ensuring that the Company’s values and
standards are set with emphasis on adopting
appropriate accounting policies and fostering
compliance with financial regulations
The Code of Business Ethics requires compliance with laws, regulations
and corporate policies at all times. This ensures that prescribed
accounting policies, accounting standards and other regulations are
adhered to.
Fulfilling such other Board functions as are vital,
given the scale, nature and complexity of the
business concerned
The size and the scale of the organisation demands expertise in diverse
areas of business at the level of Board of Directors. The Directors bring
on board a wide range of skills, knowledge and experience. Expertise in
Finance, Engineering, Law and Marketing is available in the present Board.
A n n e x to e n t e r P r i s e G ov e r n A n c e A P P e n d i c e s
share information 237 our Her itage 243 Group structure 246 Awards 247 country report 248 Glossary 253
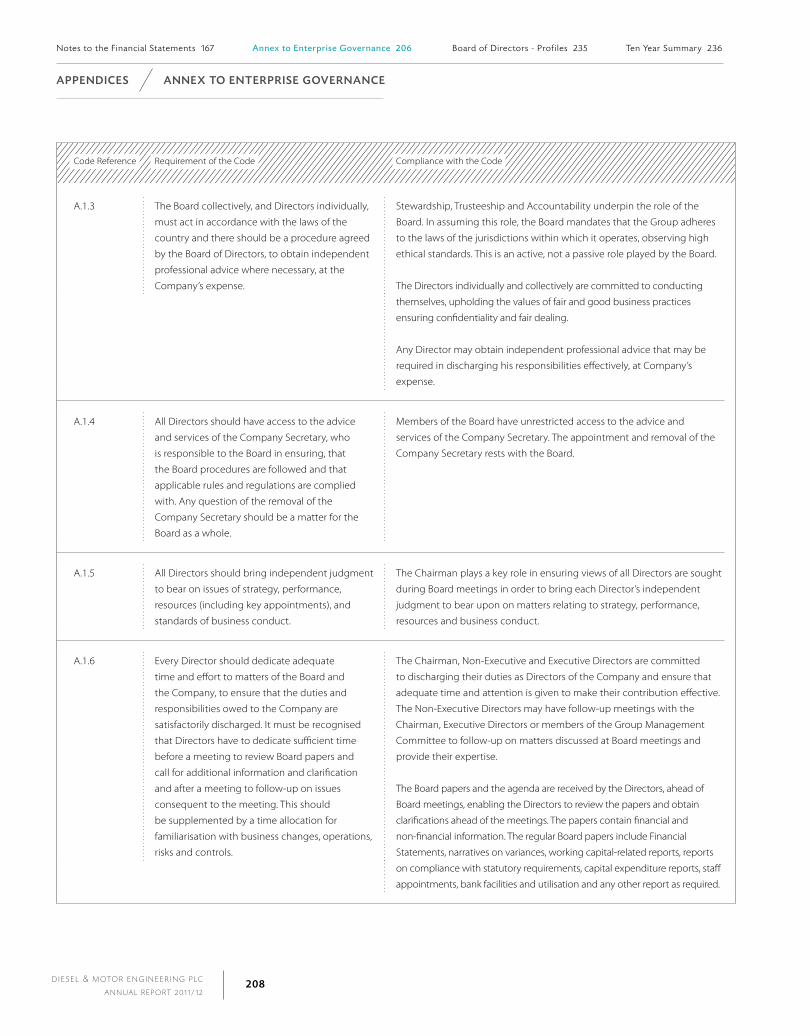
D I E S E L & M OTO R E N G I N E E R I N G P L C
A N N U A L R E P O RT 2 0 1 1 / 1 2208
Code Reference Requirement of the Code Compliance with the Code
A.1.3 The Board collectively, and Directors individually,
must act in accordance with the laws of the
country and there should be a procedure agreed
by the Board of Directors, to obtain independent
professional advice where necessary, at the
Company’s expense.
Stewardship, Trusteeship and Accountability underpin the role of the
Board. In assuming this role, the Board mandates that the Group adheres
to the laws of the jurisdictions within which it operates, observing high
ethical standards. This is an active, not a passive role played by the Board.
The Directors individually and collectively are committed to conducting
themselves, upholding the values of fair and good business practices
ensuring confidentiality and fair dealing.
Any Director may obtain independent professional advice that may be
required in discharging his responsibilities effectively, at Company’s
expense.
A.1.4 All Directors should have access to the advice
and services of the Company Secretary, who
is responsible to the Board in ensuring, that
the Board procedures are followed and that
applicable rules and regulations are complied
with. Any question of the removal of the
Company Secretary should be a matter for the
Board as a whole.
Members of the Board have unrestricted access to the advice and
services of the Company Secretary. The appointment and removal of the
Company Secretary rests with the Board.
A.1.5 All Directors should bring independent judgment
to bear on issues of strategy, performance,
resources (including key appointments), and
standards of business conduct.
The Chairman plays a key role in ensuring views of all Directors are sought
during Board meetings in order to bring each Director’s independent
judgment to bear upon on matters relating to strategy, performance,
resources and business conduct.
A.1.6 Every Director should dedicate adequate
time and effort to matters of the Board and
the Company, to ensure that the duties and
responsibilities owed to the Company are
satisfactorily discharged. It must be recognised
that Directors have to dedicate sufficient time
before a meeting to review Board papers and
call for additional information and clarification
and after a meeting to follow-up on issues
consequent to the meeting. This should
be supplemented by a time allocation for
familiarisation with business changes, operations,
risks and controls.
The Chairman, Non-Executive and Executive Directors are committed
to discharging their duties as Directors of the Company and ensure that
adequate time and attention is given to make their contribution effective.
The Non-Executive Directors may have follow-up meetings with the
Chairman, Executive Directors or members of the Group Management
Committee to follow-up on matters discussed at Board meetings and
provide their expertise.
The Board papers and the agenda are received by the Directors, ahead of
Board meetings, enabling the Directors to review the papers and obtain
clarifications ahead of the meetings. The papers contain financial and
non-financial information. The regular Board papers include Financial
Statements, narratives on variances, working capital-related reports, reports
on compliance with statutory requirements, capital expenditure reports, staff
appointments, bank facilities and utilisation and any other report as required.
A P P e n d i c e s A n n e x to e n t e r P r i s e G ov e r n A n c e
notes to the F inancia l statements 167 Annex to Enterprise Governance 206 Board of Directors - prof i les 235 ten Year summary 236
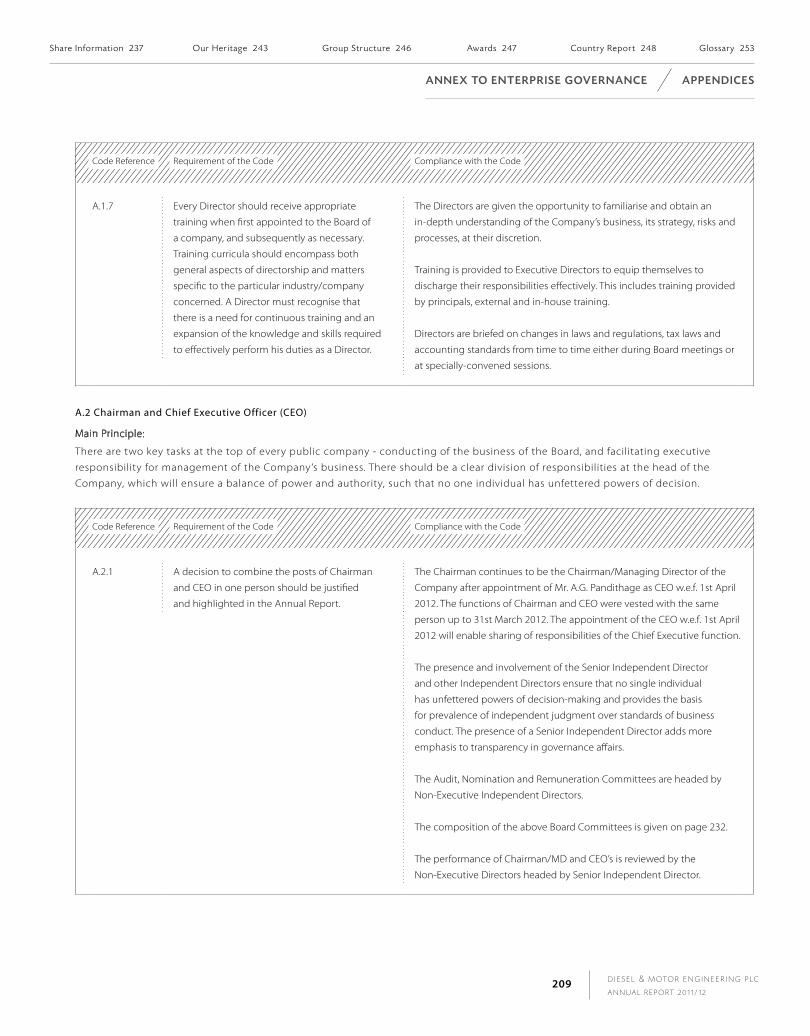
D I E S E L & M OTO R E N G I N E E R I N G P L C
A N N U A L R E P O RT 2 0 1 1 / 1 2209
Code Reference Requirement of the Code Compliance with the Code
A.1.7 Every Director should receive appropriate
training when first appointed to the Board of
a company, and subsequently as necessary.
Training curricula should encompass both
general aspects of directorship and matters
specific to the particular industry/company
concerned. A Director must recognise that
there is a need for continuous training and an
expansion of the knowledge and skills required
to effectively perform his duties as a Director.
The Directors are given the opportunity to familiarise and obtain an
in-depth understanding of the Company’s business, its strategy, risks and
processes, at their discretion.
Training is provided to Executive Directors to equip themselves to
discharge their responsibilities effectively. This includes training provided
by principals, external and in-house training.
Directors are briefed on changes in laws and regulations, tax laws and
accounting standards from time to time either during Board meetings or
at specially-convened sessions.
A.2 Chairman and Chief Executive Officer (CEO)
Main Principle:
There are two key tasks at the top of every public company - conducting of the business of the Board, and facilitating executive
responsibility for management of the Company’s business. There should be a clear division of responsibilities at the head of the
Company, which will ensure a balance of power and authority, such that no one individual has unfettered powers of decision.
Code Reference Requirement of the Code Compliance with the Code
A.2.1 A decision to combine the posts of Chairman
and CEO in one person should be justified
and highlighted in the Annual Report.
The Chairman continues to be the Chairman/Managing Director of the
Company after appointment of Mr. A.G. Pandithage as CEO w.e.f. 1st April
2012. The functions of Chairman and CEO were vested with the same
person up to 31st March 2012. The appointment of the CEO w.e.f. 1st April
2012 will enable sharing of responsibilities of the Chief Executive function.
The presence and involvement of the Senior Independent Director
and other Independent Directors ensure that no single individual
has unfettered powers of decision-making and provides the basis
for prevalence of independent judgment over standards of business
conduct. The presence of a Senior Independent Director adds more
emphasis to transparency in governance affairs.
The Audit, Nomination and Remuneration Committees are headed by
Non-Executive Independent Directors.
The composition of the above Board Committees is given on page 232.
The performance of Chairman/MD and CEO’s is reviewed by the
Non-Executive Directors headed by Senior Independent Director.
A n n e x to e n t e r P r i s e G ov e r n A n c e A P P e n d i c e s
share information 237 our Her itage 243 Group structure 246 Awards 247 country report 248 Glossary 253

D I E S E L & M OTO R E N G I N E E R I N G P L C
A N N U A L R E P O RT 2 0 1 1 / 1 2210
A.3. Chairman’s Role
Main Principle:
The Chairman’s role in preserving Good Corporate Governance is crucial. As the person responsible for running the Board, the Chairman
should preserve order and facilitate the effective discharge of Board functions.
Code Reference Requirement of the Code Compliance with the Code
A.3.1 The Chairman should conduct Board proceedings in a proper manner and ensure, inter alia, that:
the effective participation of both Executive and Non-Executive Directors is secured;
All Directors are encouraged to make an effective contribution, within their respective capabilities, for the benefit of the Company;
A balance of power between Executive and Non-Executive Directors is maintained;
The views of Directors on issues under consideration are ascertained; and
The Board is in complete control of the Company’s affairs and alert to its obligations to all shareholders and other stakeholders.
Board meetings are conducted in an atmosphere that encourages, healthy debate by all members of the Board. The Chairman ensures that there is effective participation from all Directors, that their individual contribution and concerns are objectively assessed prior to making key decisions.
The Chairman ensures that every Non-Executive Director and Executive Director is provided with an opportunity to present his view on matters discussed and that both Executive and Non-Executive Directors have opportunities for effective participation. He also ensures that the Board is in complete control of the Company’s affairs and that decisions made by the Board are implemented.
Board members are free to suggest the inclusion of items on the agenda of Board meetings and carry out their duties in the interest of the Company without any undue influence from other parties.
The Board members are encouraged to take advantage of a variety of expertise available in the Board, in the areas such as finance, marketing, law and engineering in making decisions for the benefit of the Company.
The Chairman and the Senior Independent Director satisfy themselves that the information available to the Board is sufficient to make an informed assessment of the Company’s affairs as well as to discharge their duties to all stakeholders.
The table on page 232 contains the attendance details of Directors at Board Meetings.
A.4 Financial Acumen
Main Principle:
The Board should ensure the availability within it of those with sufficient financial acumen and knowledge to offer guidance on matters
of finance.
Code Reference Requirement of the Code Compliance with the Code
A.4 Availability of sufficient financial acumen and knowledge.
The Board enjoys services of three qualified Accountants who provide the requisite financial acumen and knowledge on matters of finance. In addition, the Audit Committee has the services of another qualified Accountant who serves as an Independent Consultant.
A P P e n d i c e s A n n e x to e n t e r P r i s e G ov e r n A n c e
notes to the F inancia l statements 167 Annex to enterpr ise Governance 206 Board of Directors - prof i les 235 ten Year summary 236
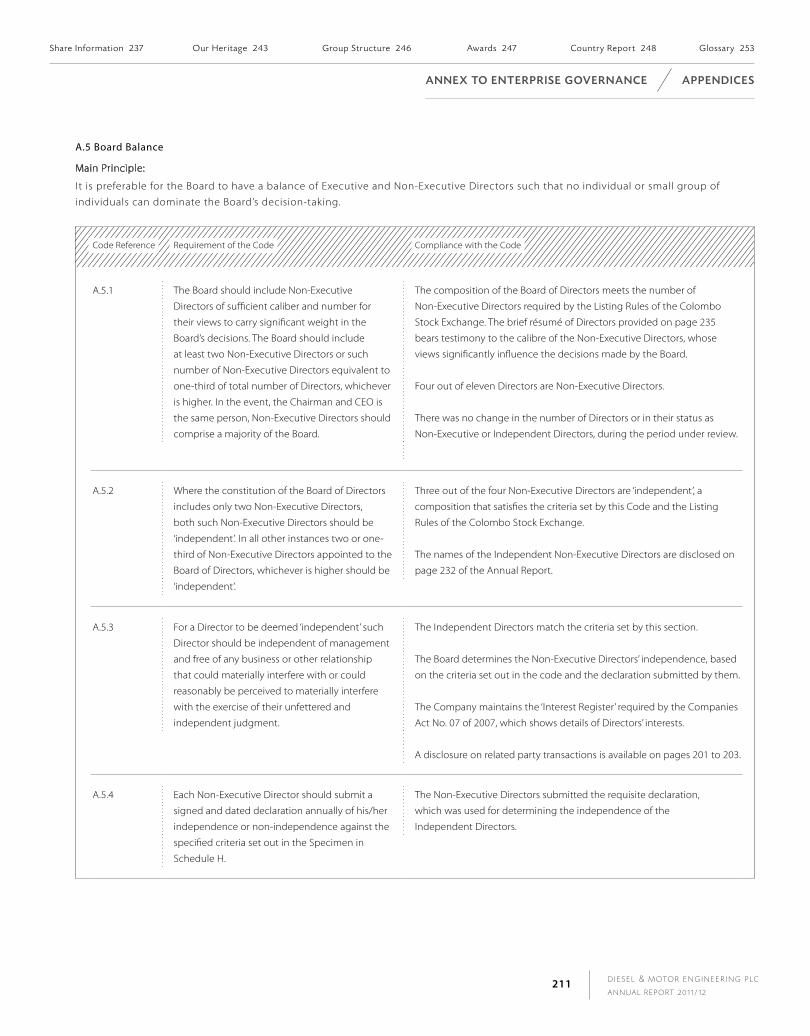
D I E S E L & M OTO R E N G I N E E R I N G P L C
A N N U A L R E P O RT 2 0 1 1 / 1 2211
A.5 Board Balance
Main Principle:
It is preferable for the Board to have a balance of Executive and Non-Executive Directors such that no individual or small group of
individuals can dominate the Board’s decision-taking.
Code Reference Requirement of the Code Compliance with the Code
A.5.1 The Board should include Non-Executive
Directors of sufficient caliber and number for
their views to carry significant weight in the
Board’s decisions. The Board should include
at least two Non-Executive Directors or such
number of Non-Executive Directors equivalent to
one-third of total number of Directors, whichever
is higher. In the event, the Chairman and CEO is
the same person, Non-Executive Directors should
comprise a majority of the Board.
The composition of the Board of Directors meets the number of
Non-Executive Directors required by the Listing Rules of the Colombo
Stock Exchange. The brief résumé of Directors provided on page 235
bears testimony to the calibre of the Non-Executive Directors, whose
views significantly influence the decisions made by the Board.
Four out of eleven Directors are Non-Executive Directors.
There was no change in the number of Directors or in their status as
Non-Executive or Independent Directors, during the period under review.
A.5.2 Where the constitution of the Board of Directors
includes only two Non-Executive Directors,
both such Non-Executive Directors should be
‘independent’. In all other instances two or one-
third of Non-Executive Directors appointed to the
Board of Directors, whichever is higher should be
‘independent’.
Three out of the four Non-Executive Directors are ‘independent’, a
composition that satisfies the criteria set by this Code and the Listing
Rules of the Colombo Stock Exchange.
The names of the Independent Non-Executive Directors are disclosed on
page 232 of the Annual Report.
A.5.3 For a Director to be deemed ‘independent’ such
Director should be independent of management
and free of any business or other relationship
that could materially interfere with or could
reasonably be perceived to materially interfere
with the exercise of their unfettered and
independent judgment.
The Independent Directors match the criteria set by this section.
The Board determines the Non-Executive Directors’ independence, based
on the criteria set out in the code and the declaration submitted by them.
The Company maintains the ‘Interest Register’ required by the Companies
Act No. 07 of 2007, which shows details of Directors’ interests.
A disclosure on related party transactions is available on pages 201 to 203.
A.5.4 Each Non-Executive Director should submit a
signed and dated declaration annually of his/her
independence or non-independence against the
specified criteria set out in the Specimen in
Schedule H.
The Non-Executive Directors submitted the requisite declaration,
which was used for determining the independence of the
Independent Directors.
A n n e x to e n t e r P r i s e G ov e r n A n c e A P P e n d i c e s
share information 237 our Her itage 243 Group structure 246 Awards 247 country report 248 Glossary 253

D I E S E L & M OTO R E N G I N E E R I N G P L C
A N N U A L R E P O RT 2 0 1 1 / 1 2212
Code Reference Requirement of the Code Compliance with the Code
A.5.5 The Board should make a determination annually
as to the independence or non-independence
of each Non-Executive Director based on such a
declaration made of decided criteria and other
information available to the Board, and should
set out in the Annual Report the names of
Directors determined to be ‘independent’. The
Board should specify the criteria not met and the
basis for its determination in the Annual Report,
if it determines that a Director is independent
notwithstanding the existence of relationships or
circumstances which indicate the contrary.
The Board has made an annual determination as to the independence
or non-independence of each Non-Executive Director based on a
declaration made by the Non-Executive Directors and as per criteria
set out by the Colombo Stock Exchange Listing Rules. Based on the
determination
1. Mr. R. Seevaratnam,
2. Dr. H. Cabral, and
3. Prof. U.P. Liyanage
are considered to be Independent Non-Executive Directors.
A.5.6 In the event, the Chairman and CEO is the same
person, the Board should appoint one of the
Independent Non-Executive Directors to be the
‘Senior Independent Director’ (SID) and disclose
this appointment in the Annual Report.
Mr. R. Seevaratnam, an Independent Non-Executive Director, functions
as the Senior Independent Director. The Senior Independent Director
presides at Board Meetings in the absence of the Chairman.
A.5.7 The Senior Independent Director should make
himself available for confidential discussions with
other Directors who may have concerns which
they believe have not been properly considered
by the Board as a whole and which pertain to
significant issues that are detrimental to the
Company.
The Senior Independent Director is available for confidential discussions,
should there be any concerns regarding governance or issues that may
adversely affect the Company, inadequately addressed by the Board.
A.5.8 The Chairman should hold meetings with the
Non-Executive Directors only, without the
Executive Directors being present, as necessary
and at least once each year.
Chairman meets with Non-Executive Directors, without the Executive
Directors and discusses issues pertaining to functioning of the Company.
In addition, the Chairman consults the Independent Directors to obtain
their views on matters of importance, as and when a need arises.
A.5.9 Where Directors have concerns about the
matters of the Company which cannot be
unanimously resolved, they should ensure their
concerns are recorded in the Board Minutes.
The Board Minutes are prepared by the Company Secretary. In the
event of a matter not being unanimously adopted at a Board Meeting,
the concerns expressed at such situations are recorded in the meeting
minutes.
Minutes of the Board meeting are circulated to all Directors and adopted
at the subsequent Board meeting.
A P P e n d i c e s A n n e x to e n t e r P r i s e G ov e r n A n c e
notes to the F inancia l statements 167 Annex to enterpr ise Governance 206 Board of Directors - prof i les 235 ten Year summary 236

D I E S E L & M OTO R E N G I N E E R I N G P L C
A N N U A L R E P O RT 2 0 1 1 / 1 2213
A.6 Supply of Information
Main Principle:
The Board should be provided with timely information in a form and of a quality appropriate to enable it discharge its duties.
Code Reference Requirement of the Code Compliance with the Code
A.6.1 Management has an obligation to provide the
Board with appropriate and timely information,
but information volunteered by management
may not be enough in all circumstances and
Directors should make further inquiries where
necessary. The Chairman should ensure all
Directors are properly briefed on issues arising at
Board meetings.
A sophisticated management information system is in place and it
provides relevant and current information. All Board Members including
Non-Executive Directors receive information on the operations and
performance of the Company on a monthly basis. This routine helps
eliminate information asymmetry between executive Directors and Non-
Executive Directors.
The Chairman ensures that the background is set for discussions at Board
meetings by introducing the subject of discussion, if the Board members
were not previously aware of the matter at hand.
A.6.2 The minutes, agenda and papers required for
a Board meeting should ordinarily be provided
to Directors at least seven (7) days before the
meeting, to facilitate its effective conduct.
The Directors are provided with comprehensive data on financial and
non-financial information prior to Board meetings in addition to the agenda
of the meeting and the minutes of the previous meeting. Additional
information may be requested by any member of the Board as and when
required. Directors may also seek any information from the management
team on matters discussed at Board meetings that require follow-up.
A n n e x to e n t e r P r i s e G ov e r n A n c e A P P e n d i c e s
share information 237 our Her itage 243 Group structure 246 Awards 247 country report 248 Glossary 253
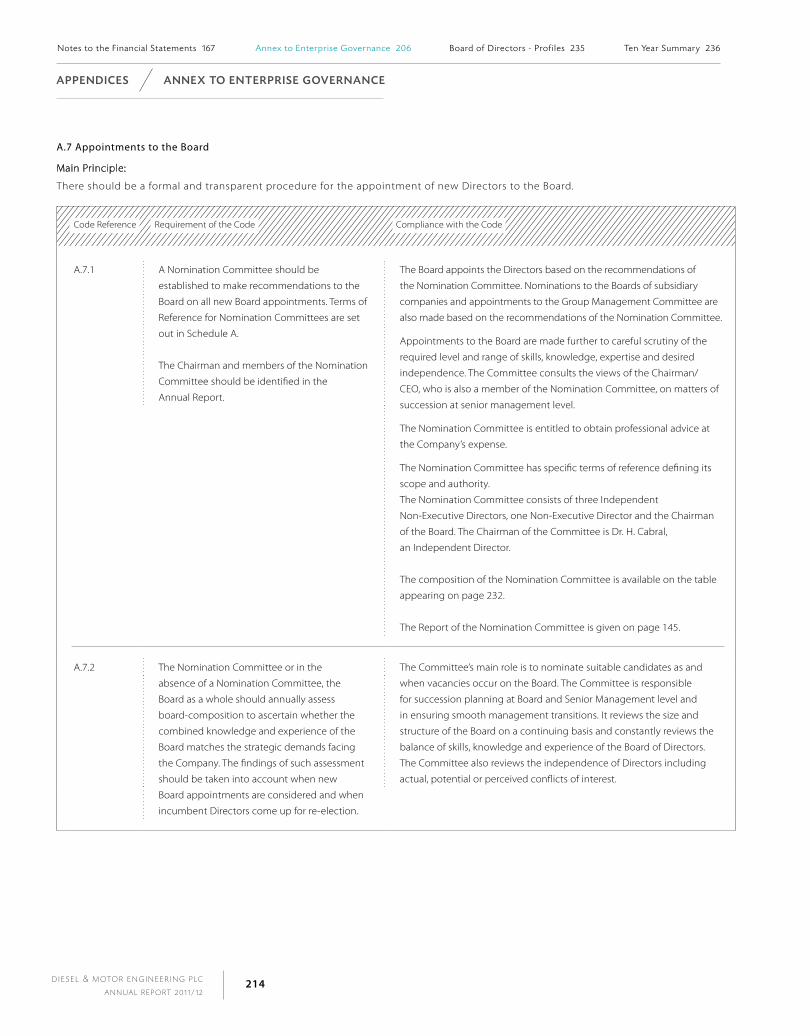
D I E S E L & M OTO R E N G I N E E R I N G P L C
A N N U A L R E P O RT 2 0 1 1 / 1 2214
A.7 Appointments to the Board
Main Principle:
There should be a formal and transparent procedure for the appointment of new Directors to the Board.
Code Reference Requirement of the Code Compliance with the Code
A.7.1 A Nomination Committee should be
established to make recommendations to the
Board on all new Board appointments. Terms of
Reference for Nomination Committees are set
out in Schedule A.
The Chairman and members of the Nomination
Committee should be identified in the
Annual Report.
The Board appoints the Directors based on the recommendations of
the Nomination Committee. Nominations to the Boards of subsidiary
companies and appointments to the Group Management Committee are
also made based on the recommendations of the Nomination Committee.
Appointments to the Board are made further to careful scrutiny of the
required level and range of skills, knowledge, expertise and desired
independence. The Committee consults the views of the Chairman/
CEO, who is also a member of the Nomination Committee, on matters of
succession at senior management level.
The Nomination Committee is entitled to obtain professional advice at
the Company’s expense.
The Nomination Committee has specific terms of reference defining its
scope and authority.
The Nomination Committee consists of three Independent
Non-Executive Directors, one Non-Executive Director and the Chairman
of the Board. The Chairman of the Committee is Dr. H. Cabral,
an Independent Director.
The composition of the Nomination Committee is available on the table
appearing on page 232.
The Report of the Nomination Committee is given on page 145.
A.7.2 The Nomination Committee or in the
absence of a Nomination Committee, the
Board as a whole should annually assess
board-composition to ascertain whether the
combined knowledge and experience of the
Board matches the strategic demands facing
the Company. The findings of such assessment
should be taken into account when new
Board appointments are considered and when
incumbent Directors come up for re-election.
The Committee’s main role is to nominate suitable candidates as and
when vacancies occur on the Board. The Committee is responsible
for succession planning at Board and Senior Management level and
in ensuring smooth management transitions. It reviews the size and
structure of the Board on a continuing basis and constantly reviews the
balance of skills, knowledge and experience of the Board of Directors.
The Committee also reviews the independence of Directors including
actual, potential or perceived conflicts of interest.
notes to the F inancia l statements 167 Annex to enterpr ise Governance 206 Board of Directors - prof i les 235 ten Year summary 236
A P P e n d i c e s A n n e x to e n t e r P r i s e G ov e r n A n c e
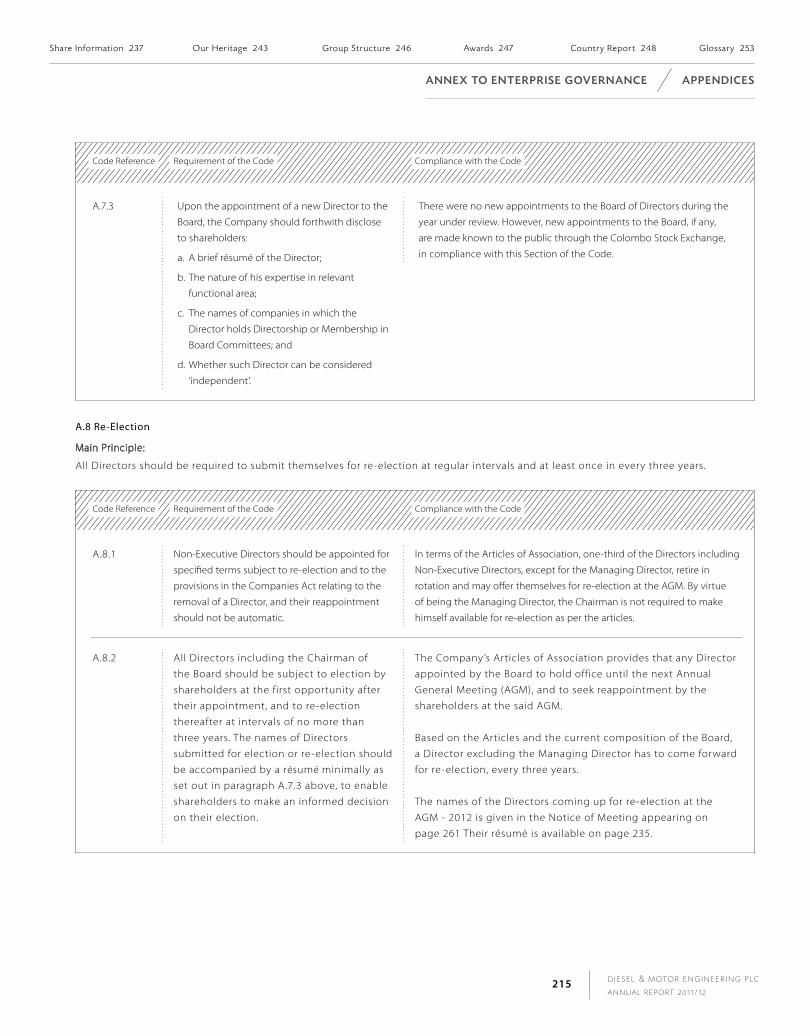
D I E S E L & M OTO R E N G I N E E R I N G P L C
A N N U A L R E P O RT 2 0 1 1 / 1 2215
Code Reference Requirement of the Code Compliance with the Code
A.7.3 Upon the appointment of a new Director to the
Board, the Company should forthwith disclose
to shareholders:
a. A brief résumé of the Director;
b. The nature of his expertise in relevant
functional area;
c. The names of companies in which the
Director holds Directorship or Membership in
Board Committees; and
d. Whether such Director can be considered
‘independent’.
There were no new appointments to the Board of Directors during the
year under review. However, new appointments to the Board, if any,
are made known to the public through the Colombo Stock Exchange,
in compliance with this Section of the Code.
A.8 Re-Election
Main Principle:
All Directors should be required to submit themselves for re-election at regular intervals and at least once in every three years.
Code Reference Requirement of the Code Compliance with the Code
A.8.1 Non-Executive Directors should be appointed for
specified terms subject to re-election and to the
provisions in the Companies Act relating to the
removal of a Director, and their reappointment
should not be automatic.
In terms of the Articles of Association, one-third of the Directors including
Non-Executive Directors, except for the Managing Director, retire in
rotation and may offer themselves for re-election at the AGM. By virtue
of being the Managing Director, the Chairman is not required to make
himself available for re-election as per the articles.
A.8.2 All Directors including the Chairman of
the Board should be subject to election by
shareholders at the first opportunity after
their appointment, and to re-election
thereafter at intervals of no more than
three years. The names of Directors
submitted for election or re-election should
be accompanied by a résumé minimally as
set out in paragraph A.7.3 above, to enable
shareholders to make an informed decision
on their election.
The Company’s Articles of Association provides that any Director
appointed by the Board to hold office until the next Annual
General Meeting (AGM), and to seek reappointment by the
shareholders at the said AGM.
Based on the Articles and the current composition of the Board,
a Director excluding the Managing Director has to come forward
for re-election, every three years.
The names of the Directors coming up for re-election at the
AGM - 2012 is given in the Notice of Meeting appearing on
page 261 Their résumé is available on page 235.
share information 237 our Her itage 243 Group structure 246 Awards 247 country report 248 Glossary 253
A n n e x to e n t e r P r i s e G ov e r n A n c e A P P e n d i c e s
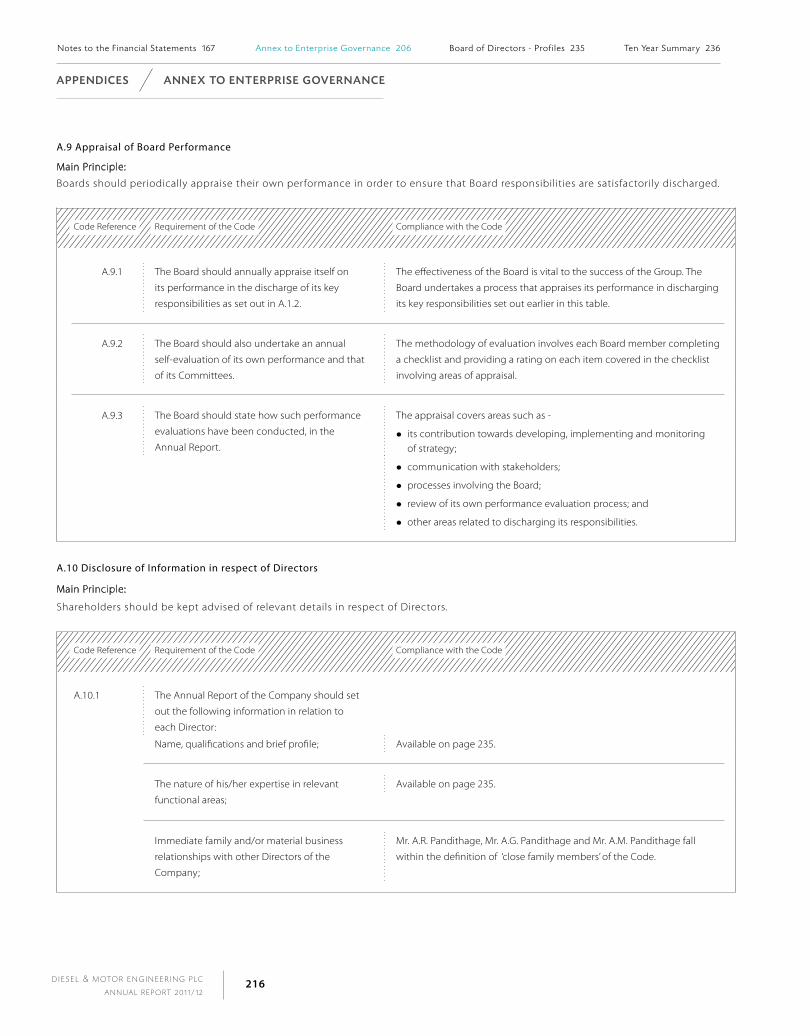
D I E S E L & M OTO R E N G I N E E R I N G P L C
A N N U A L R E P O RT 2 0 1 1 / 1 2216
A.9 Appraisal of Board Performance
Main Principle:
Boards should periodically appraise their own performance in order to ensure that Board responsibilities are satisfactorily discharged.
Code Reference Requirement of the Code Compliance with the Code
A.9.1 The Board should annually appraise itself on
its performance in the discharge of its key
responsibilities as set out in A.1.2.
The effectiveness of the Board is vital to the success of the Group. The
Board undertakes a process that appraises its performance in discharging
its key responsibilities set out earlier in this table.
A.9.2 The Board should also undertake an annual
self-evaluation of its own performance and that
of its Committees.
The methodology of evaluation involves each Board member completing
a checklist and providing a rating on each item covered in the checklist
involving areas of appraisal.
A.9.3 The Board should state how such performance
evaluations have been conducted, in the
Annual Report.
The appraisal covers areas such as -
its contribution towards developing, implementing and monitoring of strategy;
communication with stakeholders;
processes involving the Board;
review of its own performance evaluation process; and
other areas related to discharging its responsibilities.
A.10 Disclosure of Information in respect of Directors
Main Principle:
Shareholders should be kept advised of relevant details in respect of Directors.
Code Reference Requirement of the Code Compliance with the Code
A.10.1 The Annual Report of the Company should set
out the following information in relation to
each Director:
Name, qualifications and brief profile; Available on page 235.
The nature of his/her expertise in relevant
functional areas;
Available on page 235.
Immediate family and/or material business
relationships with other Directors of the
Company;
Mr. A.R. Pandithage, Mr. A.G. Pandithage and Mr. A.M. Pandithage fall
within the definition of ‘close family members’ of the Code.
notes to the F inancia l statements 167 Annex to enterpr ise Governance 206 Board of Directors - prof i les 235 ten Year summary 236
A P P e n d i c e s A n n e x to e n t e r P r i s e G ov e r n A n c e

D I E S E L & M OTO R E N G I N E E R I N G P L C
A N N U A L R E P O RT 2 0 1 1 / 1 2217
Code Reference Requirement of the Code Compliance with the Code
Names of listed companies in Sri Lanka in which
the Director concerned serves as a Director;
Available on pages 157, 158 & 235.
Names of other companies in which the Director
concerned serves as a Director, provided that
where he/she holds directorships in companies
within a Group of which the Company is a part,
their names need not be disclosed; it is sufficient
to state that he/she holds other directorships in
such companies;
Available on pages 157, 158 & 235.
Number/percentage of Board meetings of the
Company attended during the year;
Available on page 232.
Names of Board Committees in which the
Director serves as Chairman or a member; and
Available on page 232.
Number/percentage of Committee meetings
attended during the year.
Available on page 232.
A.11 Appraisal of Chief Executive Officer
Main Principle:
The Board should be required, at least annually, to assess the performance of the CEO.
Code Reference Requirement of the Code Compliance with the Code
A.11.1 At the commencement of every fiscal year,
the Board in consultation with the CEO, should
set, in line with the short, medium and long-term
objectives of the Company, reasonable financial
and non-financial targets that should be met by
the CEO during the year.
At the commencement of every financial year, the Board in consultation
with the Chairman/CEO and Executive Directors agree on the financial
and non-financial targets, based on which the performance of Chairman/
Managing Director, CEO and Executive Directors are evaluated.
share information 237 our Her itage 243 Group structure 246 Awards 247 country report 248 Glossary 253
A n n e x to e n t e r P r i s e G ov e r n A n c e A P P e n d i c e s
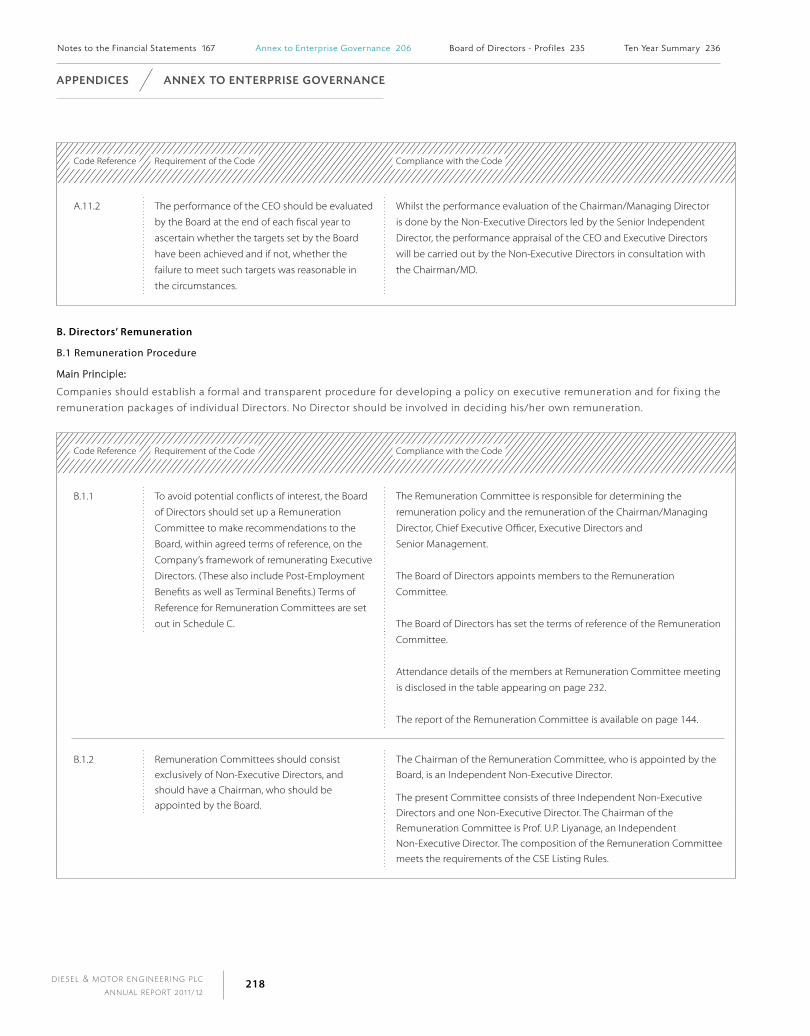
D I E S E L & M OTO R E N G I N E E R I N G P L C
A N N U A L R E P O RT 2 0 1 1 / 1 2218
Code Reference Requirement of the Code Compliance with the Code
A.11.2 The performance of the CEO should be evaluated
by the Board at the end of each fiscal year to
ascertain whether the targets set by the Board
have been achieved and if not, whether the
failure to meet such targets was reasonable in
the circumstances.
Whilst the performance evaluation of the Chairman/Managing Director
is done by the Non-Executive Directors led by the Senior Independent
Director, the performance appraisal of the CEO and Executive Directors
will be carried out by the Non-Executive Directors in consultation with
the Chairman/MD.
B. directors’ Remuneration
B.1 Remuneration Procedure
Main Principle:
Companies should establish a formal and transparent procedure for developing a policy on executive remuneration and for fixing the
remuneration packages of individual Directors. No Director should be involved in deciding his/her own remuneration.
Code Reference Requirement of the Code Compliance with the Code
B.1.1 To avoid potential conflicts of interest, the Board
of Directors should set up a Remuneration
Committee to make recommendations to the
Board, within agreed terms of reference, on the
Company’s framework of remunerating Executive
Directors. (These also include Post-Employment
Benefits as well as Terminal Benefits.) Terms of
Reference for Remuneration Committees are set
out in Schedule C.
The Remuneration Committee is responsible for determining the
remuneration policy and the remuneration of the Chairman/Managing
Director, Chief Executive Officer, Executive Directors and
Senior Management.
The Board of Directors appoints members to the Remuneration
Committee.
The Board of Directors has set the terms of reference of the Remuneration
Committee.
Attendance details of the members at Remuneration Committee meeting
is disclosed in the table appearing on page 232.
The report of the Remuneration Committee is available on page 144.
B.1.2 Remuneration Committees should consist exclusively of Non-Executive Directors, and should have a Chairman, who should be appointed by the Board.
The Chairman of the Remuneration Committee, who is appointed by the Board, is an Independent Non-Executive Director.
The present Committee consists of three Independent Non-Executive Directors and one Non-Executive Director. The Chairman of the Remuneration Committee is Prof. U.P. Liyanage, an Independent Non-Executive Director. The composition of the Remuneration Committee meets the requirements of the CSE Listing Rules.
notes to the F inancia l statements 167 Annex to enterpr ise Governance 206 Board of Directors - prof i les 235 ten Year summary 236
A P P e n d i c e s A n n e x to e n t e r P r i s e G ov e r n A n c e

D I E S E L & M OTO R E N G I N E E R I N G P L C
A N N U A L R E P O RT 2 0 1 1 / 1 2219
Code Reference Requirement of the Code Compliance with the Code
B.1.3 The Chairman and members of the Remuneration Committee should be listed in the Annual Report each year.
Names of the Chairman and members of the Remuneration Committee are available on page 232.
B.1.4 The Board as a whole, or where required by the Articles of Association the shareholders, should determine the remuneration of Non-Executive Directors, including members of the Remuneration Committee, within the limits set in the Articles of Association. Where permitted by the Articles, the Board may delegate this responsibility to a Subcommittee of the Board, which might include the CEO.
The Board of Directors determines the Remuneration of Non-Executive Directors. The Non-Executive Directors do not participate in any discussion that involves fixing their remuneration.
B.1.5 The Remuneration Committee should consult the Chairman and/or CEO about its proposals relating to the remuneration of other Executive Directors and have access to professional advice from within and outside the Company, in discharging their responsibilities.
The remuneration of the Executive Directors is recommended by the Remuneration Committee in consultation with the Chairman/MD. No Director is involved in deciding his own remuneration.
The Committee is entitled to obtain professional advice at the Company’s expense in discharging their responsibilities.
B.2 The level and make-up of Remuneration
Main Principle:
Levels of remuneration of both Executive and Non-Executive Directors should be sufficient to attract and retain the Directors needed to
run the Company successfully. A proportion of Executive Directors’ remuneration should be structured to link rewards to corporate and
individual performance.
Code Reference Requirement of the Code Compliance with the Code
B.2.1 The Remuneration Committee should provide the packages needed to attract, retain and motivate Executive Directors of the quality required but should avoid paying more than is necessary for this purpose.
The Company’s remuneration policy aims to attract and retain high calibre executives by ensuring that their rewards are competitive and linked to both individual and business performance. Whilst recognising the market demands and the contribution of the Executives to the overall performance, the Company believes that the remuneration policy should at the same time be in congruence with shareholder interests.
share information 237 our Her itage 243 Group structure 246 Awards 247 country report 248 Glossary 253
A n n e x to e n t e r P r i s e G ov e r n A n c e A P P e n d i c e s

D I E S E L & M OTO R E N G I N E E R I N G P L C
A N N U A L R E P O RT 2 0 1 1 / 1 2220
Code Reference Requirement of the Code Compliance with the Code
B.2.2 The Remuneration Committee should judge
where to position levels of remuneration of
the Company, relative to other companies. It
should be aware what comparable companies
are paying and should take account of relative
performance, but should use such comparisons
with caution, mindful of the risk that they can
result in an increase of remuneration levels with
no corresponding improvement in performance.
The Remuneration Committee in deciding the remuneration of the
Directors takes into consideration the level of remuneration paid by
the other comparable companies. By linking the remuneration levels to
business and individual performance, the Committee ensures that any
increase in the variable part of the remuneration corresponds to better
performance.
When required, the Remuneration Committee uses remuneration surveys
to ascertain market levels of remuneration.
B.2.3 The Remuneration Committee should be
sensitive to remuneration and employment
conditions elsewhere in the Company or Group
of which it is a part, especially when determining
annual salary increases.
Same criteria and measures adopted in B.2.2 are used for determination of
remuneration of the senior management team, across the Group.
B.2.4 The performance-related elements of
remuneration of Executive Directors should be
designed and tailored to align their interests with
those of the Company and main stakeholders
and to give these Directors appropriate
incentives to perform at the highest levels.
Remuneration of Executive Directors consists of a fixed element as well as
a variable element.
The variable part (incentive scheme) is based on the performance of the
individual as well as the Company.
B.2.5 Executive share options should not be offered at
a discount (i.e., less than market price prevailing
at the time the exercise price is determined),
save as permitted by the Listing Rules of the
Stock Exchange.
There was no share option scheme in operation during the year
under review.
B.2.6 In designing schemes of performance-related
remuneration, Remuneration Committees should
follow the provisions set out in Schedule D.
The guideline provided by Schedule D has been followed in determining
Directors’ remuneration. There is no share option scheme available to the
Directors.
B.2.7 Remuneration Committees should consider what
compensation commitments (including pension
contributions) their Directors’ contracts of service,
if any, entail in the event of early termination.
Remuneration Committees should in particular,
consider the advantages of providing explicitly
for such compensation commitments to apply
other than in the case of removal for misconduct,
in initial contracts.
The compensation commitments of the Executive Directors are guided by
their contracts of employment. This requirement is not applicable to
Non-Executive Directors.
notes to the F inancia l statements 167 Annex to enterpr ise Governance 206 Board of Directors - prof i les 235 ten Year summary 236
A P P e n d i c e s A n n e x to e n t e r P r i s e G ov e r n A n c e

D I E S E L & M OTO R E N G I N E E R I N G P L C
A N N U A L R E P O RT 2 0 1 1 / 1 2221
Code Reference Requirement of the Code Compliance with the Code
B.2.8 Where the initial contract does not explicitly
provide for compensation commitments,
Remuneration Committees should, within
legal constraints, tailor their approach in early
termination cases to the relevant circumstances.
The broad aim should be, to avoid rewarding
poor performance while dealing fairly with cases
where departure is not due to poor performance.
The Board is committed to acting fairly and in accordance with laws of
the country, in the event of a termination. There was no termination of
services of any Director during the year under review.
B.2.9 Levels of remuneration for Non-Executive
Directors should reflect the time commitment
and responsibilities of their role, taking into
consideration market practices. Remuneration
for Non-Executive Directors should not normally
include share options. If exceptionally options are
granted, shareholder approval should be sought
in advance and any shares acquired by exercise
of the options should be held until at least one
year after the Non-Executive Director leaves the
Board. Holding share options could be relevant to
the determination of a Non-Executive Director’s
independence. (as set out in provision A.5.5)
Non-Executive Directors provide expert advice to the Board in their
capacity as Directors. Time commitments and responsibilities of their role
are taken into consideration when remuneration levels of Non-Executive
Directors are determined. The Company does not have a share options
scheme in operation.
B.3 Disclosure of Remuneration
Main Principle:
The Company’s Annual Report should contain a Statement of Remuneration Policy and details of remuneration of the Board as a whole.
Code Reference Requirement of the Code Compliance with the Code
B.3.1 The Annual Report should set out the names of
Directors (or persons in the Parent Company’s
Committee in the case of a Group company)
comprising the Remuneration Committee,
contain a statement of remuneration policy and
set out the aggregate remuneration paid to
Executive and Non-Executive Directors.
The Remuneration Policy is available in the Report of the Remuneration
Committee appearing on page 144.
Total Directors’ emoluments are disclosed in Note 11 on page 184.
share information 237 our Her itage 243 Group structure 246 Awards 247 country report 248 Glossary 253
A n n e x to e n t e r P r i s e G ov e r n A n c e A P P e n d i c e s

D I E S E L & M OTO R E N G I N E E R I N G P L C
A N N U A L R E P O RT 2 0 1 1 / 1 2222
c. Relations with shareholders
C.1 Constructive use of Annual General Meeting (AGM) and Conduct of General Meetings
Main Principle:
Boards should use the AGM to communicate with shareholders and should encourage their participation.
Code Reference Requirement of the Code Compliance with the Code
C.1.1 Companies should count all proxy votes and
should indicate the level of proxies lodged on
each resolution, and the balance for and against
the resolution, after it has been dealt with on a
show of hands, except where a poll is called.
A Form of Proxy accompanies the Annual Report, when they are
dispatched to the shareholders. The Chairman makes an announcement
of the proxies received, at the commencement of a General Meeting.
C.1.2 Companies should propose a separate resolution
at the AGM on each substantially separate issue
and should in particular propose a resolution at
the AGM relating to the adoption of the report
and accounts.
The Company proposes a separate resolution at the AGM on each
substantial separate issue, including for the adoption of the Financial
Statements. The Agenda for the AGM is given on page 261.
C.1.3 The Chairman of the Board should arrange for
the Chairmen of the Audit, Remuneration and
Nomination Committees to be available to
answer questions at the AGM if so requested by
the Chairman.
The Annual General Meeting provides a forum for shareholders to raise
any queries. The Chairmen of the Audit, Remuneration and Nomination
Committees are usually present at the Annual General Meeting. All
Directors were present at the last AGM of the Company.
C.1.4 Companies should arrange for the Notice of
the AGM and related papers to be sent to
shareholders as determined by statute, before
the meeting.
The Notice of Meeting and related documents is dispatched to the
shareholders 15 working days prior to the AGM, as per Section 135 of the
Companies Act No. 07 of 2007.
C.1.5 Companies should circulate with every Notice of
General Meeting, a summary of the procedures
governing voting at General Meetings.
The Notice of Meeting outlines the procedure relating to voting at the
Annual General Meeting. Every shareholder is entitled to one vote per
share at a poll.
notes to the F inancia l statements 167 Annex to enterpr ise Governance 206 Board of Directors - prof i les 235 ten Year summary 236
A P P e n d i c e s A n n e x to e n t e r P r i s e G ov e r n A n c e

D I E S E L & M OTO R E N G I N E E R I N G P L C
A N N U A L R E P O RT 2 0 1 1 / 1 2223
C.2 Major Transactions
Main Principle:
Further to compliance with the requirements under the Companies Act, Directors should disclose to shareholders all proposed corporate transactions, which, if entered into, would materially alter/vary the Company’s net assets base or in the case of a company with subsidiaries, the consolidated group net asset base.
Code Reference Requirement of the Code Compliance with the Code
C.2.1 Prior to a company engaging in or committing to a ‘Major Transaction’, involving the acquisition, sale or disposition of greater than half of the net value of the Company’s assets or that of a subsidiary which has a material bearing on the consolidated net assets of the Company, or a transaction which has or is likely to have the effect of the Company acquiring obligations and liabilities, Directors should disclose to shareholders all material facts of such transaction. It also includes transactions or series of related transactions which have the purpose of effect of substantially altering the nature of the business carried on by the Company.
There was no transaction during the year that fell within the definition of a major transaction defined by Section 185 of the Companies Act No. 07 of 2007.
There were also no transactions during the year under review that would suggest a substantial alteration in the nature of the business carried out by the Company.
d. Accountability and Audit
D.1 Financial Reporting
Main Principle:
The Board should present a balanced and understandable assessment of the Company’s financial position, performance and prospects.
Code Reference Requirement of the Code Compliance with the Code
D.1.1 The Board’s responsibility to present a balanced and understandable assessment extends to interim and other price-sensitive public reports and reports to regulators, as well as to information required to be presented by statutory requirements.
In the preparing of annual and quarterly Financial Statements, Company complies with the requirements of the-
Companies Act No. 07 of 2007,
Sri Lanka Accounting Standards, and
Listing Rules of the Colombo Stock Exchange.
The annual and interim Financial Statements are published within the time periods prescribed by the Listing Rules of the Colombo Stock Exchange.
Given below is a table containing the dates on which the annual and interim Financial Statements were uploaded to the CSE website/dispatched to the shareholders, during the year under review.
Interim Report Date of uploading/dispatch Status
Annual Report for the year ended 31st March 2011
5th June 2010 Compliant
1st Quarter 9th August 2011 Compliant
2nd Quarter 27th October 2011 Compliant
3rd Quarter 13th February 2012 Compliant
4th Quarter 30th May 2012 Compliant
share information 237 our Her itage 243 Group structure 246 Awards 247 country report 248 Glossary 253
A n n e x to e n t e r P r i s e G ov e r n A n c e A P P e n d i c e s

D I E S E L & M OTO R E N G I N E E R I N G P L C
A N N U A L R E P O RT 2 0 1 1 / 1 2224
Code Reference Requirement of the Code Compliance with the Code
D.1.2 The Directors’ Report, which forms part of the
Annual Report, should contain declarations by
the Directors to the effect that:
The Company has not engaged in any activity
which contravenes laws and regulations;
The Directors have declared all material
interests in contracts involving the Company
and refrained from voting on matters in which
they were materially interested;
The Company has made all endeavours
to ensure the equitable treatment of
shareholders;
The business is a going concern, with
supporting assumptions or qualifications as
necessary; and
They have conducted a review of the internal
controls, covering financial, operational and
compliance controls and risk management,
and have obtained reasonable assurance of
their effectiveness and successful adherence
therewith, and, if it is unable to make any of
these declarations, to explain why it is unable to
do so.
The declarations by Directors required by this section have been made in
the Annual Report of the Directors appearing from pages 149 to 158.
D.1.3 The Annual Report should contain a statement
setting out the responsibilities of the Board for
the preparation and presentation of Financial
Statements, together with a statement by the
Auditors about their reporting responsibilities.
The Statement of Directors’ Responsibilities for Financial Statements is
available from pages 159 to 160.
The Auditors’ responsibilities regarding the Annual Financial Statements
are outlined in the Report of the Auditors appearing on page 161.
notes to the F inancia l statements 167 Annex to enterpr ise Governance 206 Board of Directors - prof i les 235 ten Year summary 236
A P P e n d i c e s A n n e x to e n t e r P r i s e G ov e r n A n c e

D I E S E L & M OTO R E N G I N E E R I N G P L C
A N N U A L R E P O RT 2 0 1 1 / 1 2225
Code Reference Requirement of the Code Compliance with the Code
D.1.4 The Annual Report should contain a
‘Management Discussion and Analysis’,
discussing, among other issues:
Industry structure and developments;
Opportunities and threats;
Risks and concerns;
Internal control systems and their adequacy;
Social and environmental protection activities
carried out by the Company;
Financial performance;
Material developments in human resource/
industrial relations; and
Prospects for the future.
The Board endeavours to present a balanced and an objective assessment
of the Company’s position, performance and prospects.
Information required by this section is included in the Annual Report
as follows:
Information Discussion Report in the Annual Report Page Nos.
Industrial structure and
developments
Operating Environment 18 to 22
Opportunities and threats Chairman’s Letter,
Risk Management Report
10 to 15
128 to 140
Risks and concerns Risk Management Report 128 to 140
Internal control systems
and their adequacy
Enterprises Governance 118 to 127
Social and environmental
protection activities carried
out by the Company
Management Report -
Community/Environment
90 to 111
Financial performance Financial Value Creation 24 to 39
Material developments in
Human Resources
Management Report -
Working at Dimo
62 to 79
Prospects for the future Chairman’s Letter, Financial
Review, Management Report
10 to 113
D.1.5 The Directors should report that the business is a
going concern, with supporting assumptions or
qualifications as necessary. The matters to which
the Board should give due consideration when
adopting the going concern assumptions are set
out in Schedule E to this Code.
Information on the Board’s determination of the entity as a going concern
is included in the Annual Report of the Board of Directors appearing from
pages 149 to 158.
D.1.6 In the event, the net assets of the Company
fall below 50% of the value of the Company’s
shareholders’ funds, the Directors shall forthwith
summon an Extraordinary General Meeting of the
Company to notify shareholders of the position
and of remedial action being taken.
This situation did not arise during the financial year under review.
share information 237 our Her itage 243 Group structure 246 Awards 247 country report 248 Glossary 253
A n n e x to e n t e r P r i s e G ov e r n A n c e A P P e n d i c e s
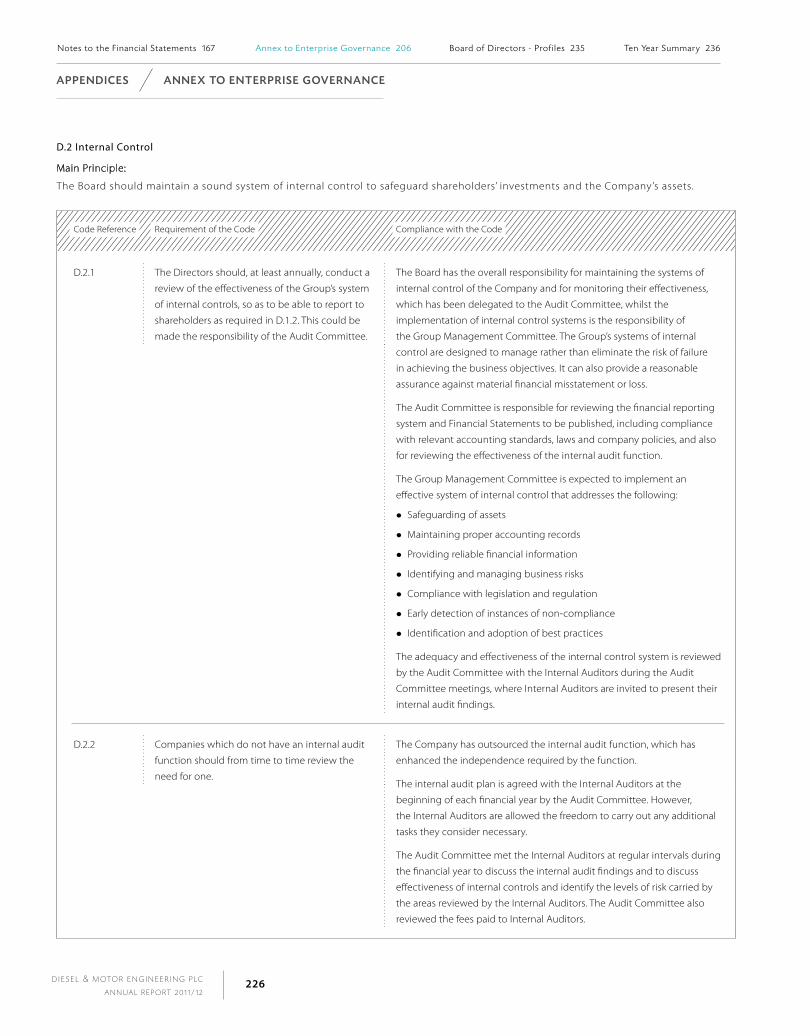
D I E S E L & M OTO R E N G I N E E R I N G P L C
A N N U A L R E P O RT 2 0 1 1 / 1 2226
D.2 Internal Control
Main Principle:
The Board should maintain a sound system of internal control to safeguard shareholders’ investments and the Company’s assets.
Code Reference Requirement of the Code Compliance with the Code
D.2.1 The Directors should, at least annually, conduct a
review of the effectiveness of the Group’s system
of internal controls, so as to be able to report to
shareholders as required in D.1.2. This could be
made the responsibility of the Audit Committee.
The Board has the overall responsibility for maintaining the systems of
internal control of the Company and for monitoring their effectiveness,
which has been delegated to the Audit Committee, whilst the
implementation of internal control systems is the responsibility of
the Group Management Committee. The Group’s systems of internal
control are designed to manage rather than eliminate the risk of failure
in achieving the business objectives. It can also provide a reasonable
assurance against material financial misstatement or loss.
The Audit Committee is responsible for reviewing the financial reporting
system and Financial Statements to be published, including compliance
with relevant accounting standards, laws and company policies, and also
for reviewing the effectiveness of the internal audit function.
The Group Management Committee is expected to implement an
effective system of internal control that addresses the following:
Safeguarding of assets
Maintaining proper accounting records
Providing reliable financial information
Identifying and managing business risks
Compliance with legislation and regulation
Early detection of instances of non-compliance
Identification and adoption of best practices
The adequacy and effectiveness of the internal control system is reviewed
by the Audit Committee with the Internal Auditors during the Audit
Committee meetings, where Internal Auditors are invited to present their
internal audit findings.
D.2.2 Companies which do not have an internal audit
function should from time to time review the
need for one.
The Company has outsourced the internal audit function, which has
enhanced the independence required by the function.
The internal audit plan is agreed with the Internal Auditors at the
beginning of each financial year by the Audit Committee. However,
the Internal Auditors are allowed the freedom to carry out any additional
tasks they consider necessary.
The Audit Committee met the Internal Auditors at regular intervals during
the financial year to discuss the internal audit findings and to discuss
effectiveness of internal controls and identify the levels of risk carried by
the areas reviewed by the Internal Auditors. The Audit Committee also
reviewed the fees paid to Internal Auditors.
notes to the F inancia l statements 167 Annex to enterpr ise Governance 206 Board of Directors - prof i les 235 ten Year summary 236
A P P e n d i c e s A n n e x to e n t e r P r i s e G ov e r n A n c e
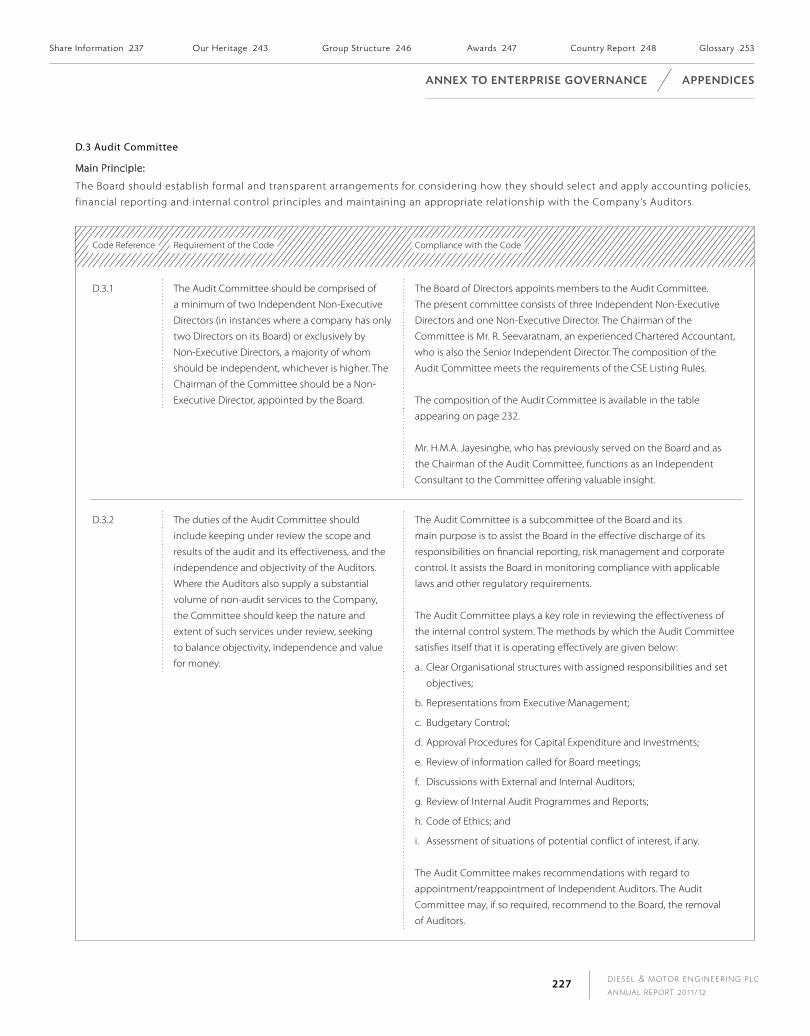
D I E S E L & M OTO R E N G I N E E R I N G P L C
A N N U A L R E P O RT 2 0 1 1 / 1 2227
D.3 Audit Committee
Main Principle:
The Board should establish formal and transparent arrangements for considering how they should select and apply accounting policies,
financial reporting and internal control principles and maintaining an appropriate relationship with the Company’s Auditors.
Code Reference Requirement of the Code Compliance with the Code
D.3.1 The Audit Committee should be comprised of
a minimum of two Independent Non-Executive
Directors (in instances where a company has only
two Directors on its Board) or exclusively by
Non-Executive Directors, a majority of whom
should be independent, whichever is higher. The
Chairman of the Committee should be a Non-
Executive Director, appointed by the Board.
The Board of Directors appoints members to the Audit Committee.
The present committee consists of three Independent Non-Executive
Directors and one Non-Executive Director. The Chairman of the
Committee is Mr. R. Seevaratnam, an experienced Chartered Accountant,
who is also the Senior Independent Director. The composition of the
Audit Committee meets the requirements of the CSE Listing Rules.
The composition of the Audit Committee is available in the table
appearing on page 232.
Mr. H.M.A. Jayesinghe, who has previously served on the Board and as
the Chairman of the Audit Committee, functions as an Independent
Consultant to the Committee offering valuable insight.
D.3.2 The duties of the Audit Committee should
include keeping under review the scope and
results of the audit and its effectiveness, and the
independence and objectivity of the Auditors.
Where the Auditors also supply a substantial
volume of non-audit services to the Company,
the Committee should keep the nature and
extent of such services under review, seeking
to balance objectivity, independence and value
for money.
The Audit Committee is a subcommittee of the Board and its
main purpose is to assist the Board in the effective discharge of its
responsibilities on financial reporting, risk management and corporate
control. It assists the Board in monitoring compliance with applicable
laws and other regulatory requirements.
The Audit Committee plays a key role in reviewing the effectiveness of
the internal control system. The methods by which the Audit Committee
satisfies itself that it is operating effectively are given below:
a.Clear Organisational structures with assigned responsibilities and set
objectives;
b. Representations from Executive Management;
c. Budgetary Control;
d. Approval Procedures for Capital Expenditure and Investments;
e. Review of information called for Board meetings;
f. Discussions with External and Internal Auditors;
g. Review of Internal Audit Programmes and Reports;
h. Code of Ethics; and
i. Assessment of situations of potential conflict of interest, if any.
The Audit Committee makes recommendations with regard to
appointment/reappointment of Independent Auditors. The Audit
Committee may, if so required, recommend to the Board, the removal
of Auditors.
share information 237 our Her itage 243 Group structure 246 Awards 247 country report 248 Glossary 253
A n n e x to e n t e r P r i s e G ov e r n A n c e A P P e n d i c e s
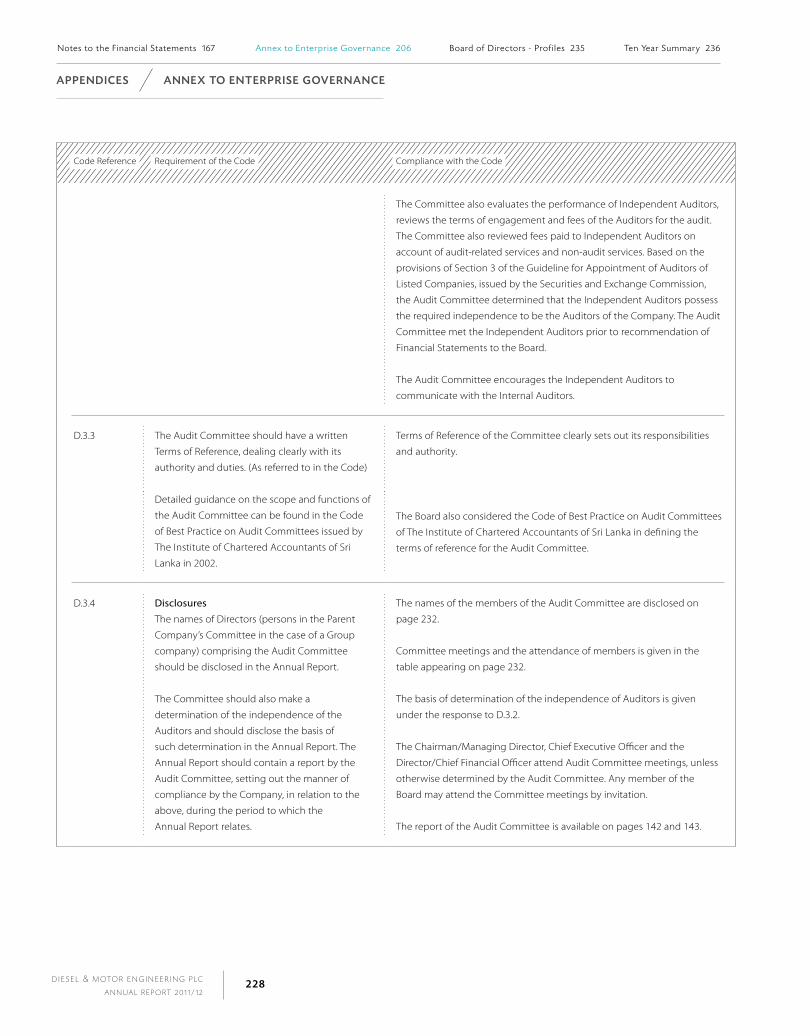
D I E S E L & M OTO R E N G I N E E R I N G P L C
A N N U A L R E P O RT 2 0 1 1 / 1 2228
Code Reference Requirement of the Code Compliance with the Code
The Committee also evaluates the performance of Independent Auditors,
reviews the terms of engagement and fees of the Auditors for the audit.
The Committee also reviewed fees paid to Independent Auditors on
account of audit-related services and non-audit services. Based on the
provisions of Section 3 of the Guideline for Appointment of Auditors of
Listed Companies, issued by the Securities and Exchange Commission,
the Audit Committee determined that the Independent Auditors possess
the required independence to be the Auditors of the Company. The Audit
Committee met the Independent Auditors prior to recommendation of
Financial Statements to the Board.
The Audit Committee encourages the Independent Auditors to
communicate with the Internal Auditors.
D.3.3 The Audit Committee should have a written
Terms of Reference, dealing clearly with its
authority and duties. (As referred to in the Code)
Detailed guidance on the scope and functions of
the Audit Committee can be found in the Code
of Best Practice on Audit Committees issued by
The Institute of Chartered Accountants of Sri
Lanka in 2002.
Terms of Reference of the Committee clearly sets out its responsibilities
and authority.
The Board also considered the Code of Best Practice on Audit Committees
of The Institute of Chartered Accountants of Sri Lanka in defining the
terms of reference for the Audit Committee.
D.3.4 Disclosures
The names of Directors (persons in the Parent
Company’s Committee in the case of a Group
company) comprising the Audit Committee
should be disclosed in the Annual Report.
The Committee should also make a
determination of the independence of the
Auditors and should disclose the basis of
such determination in the Annual Report. The
Annual Report should contain a report by the
Audit Committee, setting out the manner of
compliance by the Company, in relation to the
above, during the period to which the
Annual Report relates.
The names of the members of the Audit Committee are disclosed on
page 232.
Committee meetings and the attendance of members is given in the
table appearing on page 232.
The basis of determination of the independence of Auditors is given
under the response to D.3.2.
The Chairman/Managing Director, Chief Executive Officer and the
Director/Chief Financial Officer attend Audit Committee meetings, unless
otherwise determined by the Audit Committee. Any member of the
Board may attend the Committee meetings by invitation.
The report of the Audit Committee is available on pages 142 and 143.
notes to the F inancia l statements 167 Annex to enterpr ise Governance 206 Board of Directors - prof i les 235 ten Year summary 236
A P P e n d i c e s A n n e x to e n t e r P r i s e G ov e r n A n c e

D I E S E L & M OTO R E N G I N E E R I N G P L C
A N N U A L R E P O RT 2 0 1 1 / 1 2229
D.4 Code of Business Conduct and Ethics
Main Principle:
Companies must adopt a Code of Business Conduct and Ethics for Directors and members of the Senior Management team and must
promptly disclose any waivers of the Code for Directors or others.
Code Reference Requirement of the Code Compliance with the Code
D.4.1 All companies must disclose whether they
have a Code of Business Conduct and Ethics
for Directors and members of the Senior
Management team and if they have such a
Code, make an affirmative declaration in the
Annual Report that all Directors and members
of the senior management team have complied
with such Code, and if unable to make that
declaration, state why they are unable to do
so. Each company may determine its own
policies in the formulation of such a Code, but
all companies should address the following
important topics in their respective Codes:
Conflict of interest;
Corporate opportunities;
Confidentiality;
Fair dealing;
Protection and proper use of company assets;
Compliance with laws, rules and regulations
(including insider trading laws); and
Encouraging the reporting of any illegal or
unethical behaviour.
These aspects are expanded on, in Schedule G.
The Company has a Code of Ethics applicable to Directors and
employees of the Company. The areas covered in the Code
of Ethics include proprietary information, conflict of interest,
benefits from third parties, accurate books of account, usage
of company property for personal use, illegal acquisition
of competitor information, insider trading, protection of
environment and natural resources and gender equity.
Compliance with laws and regulations is a strict requirement for
Directors and all employees.
There were no reported cases of non-compliance to Code of
Business Ethics by any Director or a Member of the
Senior Management Team.
D.4.2 The Chairman must affirm in the Company’s
Annual Report that he is not aware of any
violation of any of the provisions of the Code of
Business Conduct and Ethics.
Refer the Chairman's letter on pages 10 to 15.
share information 237 our Her itage 243 Group structure 246 Awards 247 country report 248 Glossary 253
A n n e x to e n t e r P r i s e G ov e r n A n c e A P P e n d i c e s
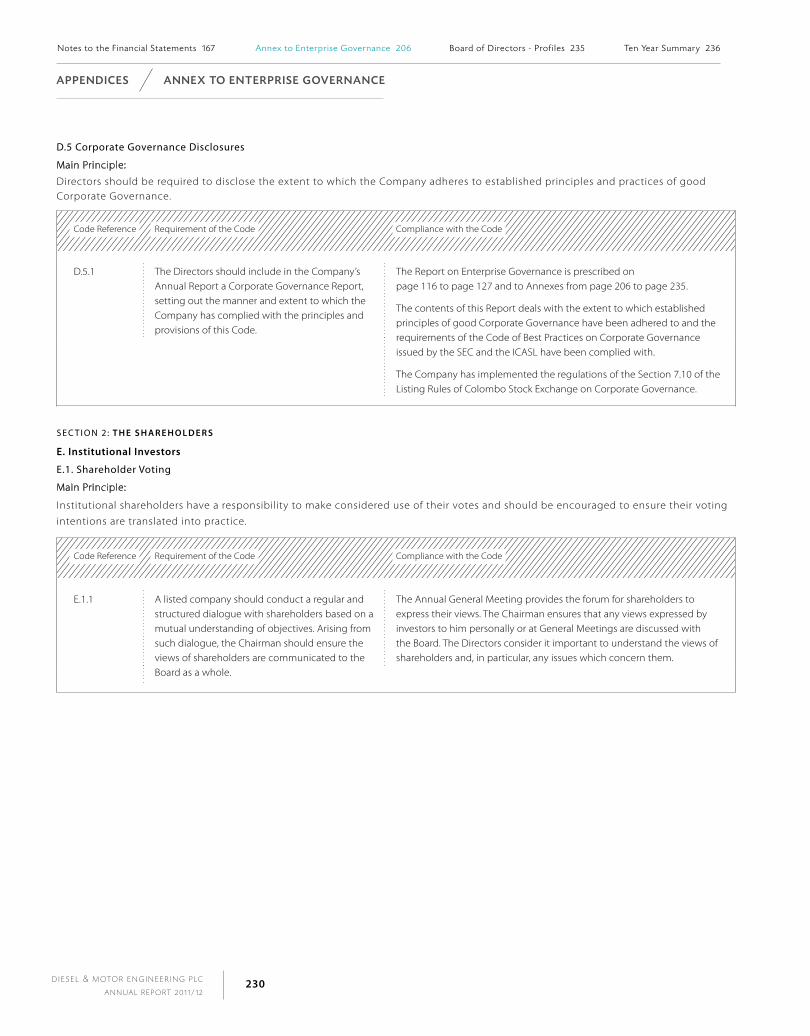
D I E S E L & M OTO R E N G I N E E R I N G P L C
A N N U A L R E P O RT 2 0 1 1 / 1 2230
D.5 Corporate Governance Disclosures
Main Principle:
Directors should be required to disclose the extent to which the Company adheres to established principles and practices of good Corporate Governance.
Code Reference Requirement of the Code Compliance with the Code
D.5.1 The Directors should include in the Company’s Annual Report a Corporate Governance Report, setting out the manner and extent to which the Company has complied with the principles and provisions of this Code.
The Report on Enterprise Governance is prescribed on page 116 to page 127 and to Annexes from page 206 to page 235.
The contents of this Report deals with the extent to which established principles of good Corporate Governance have been adhered to and the requirements of the Code of Best Practices on Corporate Governance issued by the SEC and the ICASL have been complied with.
The Company has implemented the regulations of the Section 7.10 of the Listing Rules of Colombo Stock Exchange on Corporate Governance.
S E C T I O N 2 : T h e s h A R e h o L d e R s
e. institutional investors
E.1. Shareholder Voting
Main Principle:
Institutional shareholders have a responsibility to make considered use of their votes and should be encouraged to ensure their voting
intentions are translated into practice.
Code Reference Requirement of the Code Compliance with the Code
E.1.1 A listed company should conduct a regular and structured dialogue with shareholders based on a mutual understanding of objectives. Arising from such dialogue, the Chairman should ensure the views of shareholders are communicated to the Board as a whole.
The Annual General Meeting provides the forum for shareholders to express their views. The Chairman ensures that any views expressed by investors to him personally or at General Meetings are discussed with the Board. The Directors consider it important to understand the views of shareholders and, in particular, any issues which concern them.
notes to the F inancia l statements 167 Annex to enterpr ise Governance 206 Board of Directors - prof i les 235 ten Year summary 236
A P P e n d i c e s A n n e x to e n t e r P r i s e G ov e r n A n c e
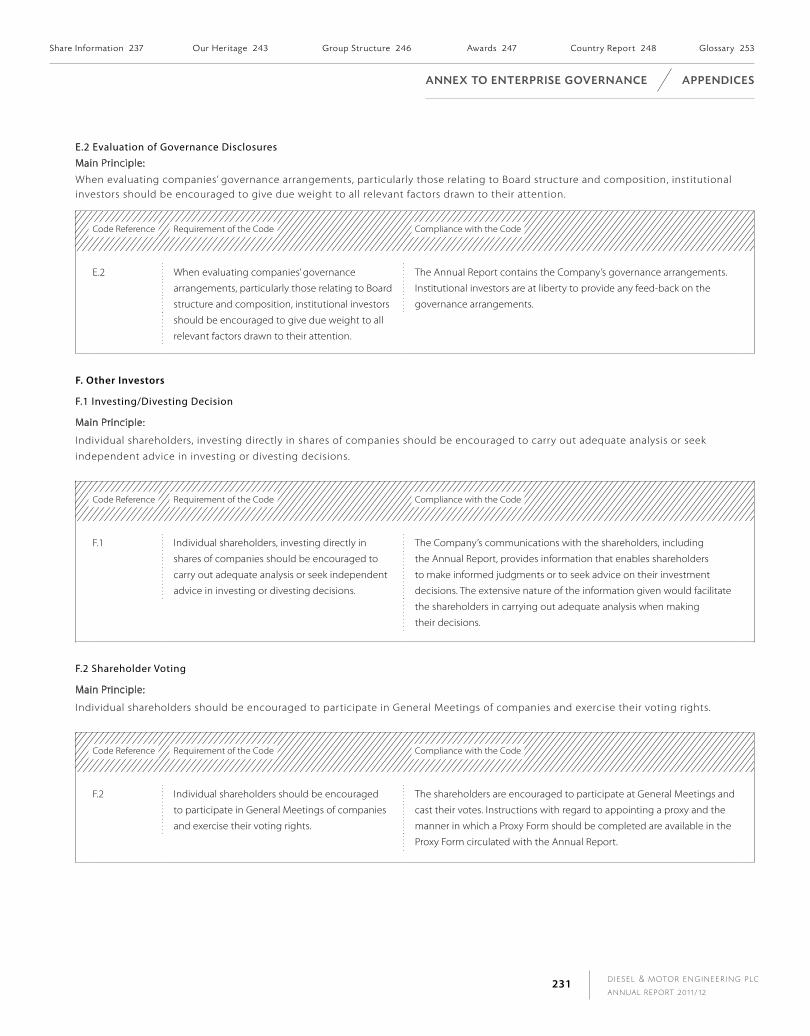
D I E S E L & M OTO R E N G I N E E R I N G P L C
A N N U A L R E P O RT 2 0 1 1 / 1 2231
E.2 Evaluation of Governance DisclosuresMain Principle:
When evaluating companies’ governance arrangements, particularly those relating to Board structure and composition, institutional investors should be encouraged to give due weight to all relevant factors drawn to their attention.
Code Reference Requirement of the Code Compliance with the Code
E.2 When evaluating companies’ governance
arrangements, particularly those relating to Board
structure and composition, institutional investors
should be encouraged to give due weight to all
relevant factors drawn to their attention.
The Annual Report contains the Company’s governance arrangements.
Institutional investors are at liberty to provide any feed-back on the
governance arrangements.
F. other investors
F.1 Investing/Divesting Decision
Main Principle:
Individual shareholders, investing directly in shares of companies should be encouraged to carry out adequate analysis or seek
independent advice in investing or divesting decisions.
Code Reference Requirement of the Code Compliance with the Code
F.1 Individual shareholders, investing directly in
shares of companies should be encouraged to
carry out adequate analysis or seek independent
advice in investing or divesting decisions.
The Company’s communications with the shareholders, including
the Annual Report, provides information that enables shareholders
to make informed judgments or to seek advice on their investment
decisions. The extensive nature of the information given would facilitate
the shareholders in carrying out adequate analysis when making
their decisions.
F.2 Shareholder Voting
Main Principle:
Individual shareholders should be encouraged to participate in General Meetings of companies and exercise their voting rights.
Code Reference Requirement of the Code Compliance with the Code
F.2 Individual shareholders should be encouraged
to participate in General Meetings of companies
and exercise their voting rights.
The shareholders are encouraged to participate at General Meetings and
cast their votes. Instructions with regard to appointing a proxy and the
manner in which a Proxy Form should be completed are available in the
Proxy Form circulated with the Annual Report.
share information 237 our Her itage 243 Group structure 246 Awards 247 country report 248 Glossary 253
A n n e x to e n t e r P r i s e G ov e r n A n c e A P P e n d i c e s

D I E S E L & M OTO R E N G I N E E R I N G P L C
A N N U A L R E P O RT 2 0 1 1 / 1 2232
ExecutiveDirectors
Independent Directors
Composition of the Board and Board Committees and Attendance at Meetings for 2011/12
Committee Members
Board Member Date of Appointment to the Board
Board Audit Committee
Nomination Committee
Remuneration Committee
First Re-election Position Attendance Position Attendance Position Attendance Position Attendance
A.R. Pandithage June 1977 – Chairman/MD/CEO 9/9 No – Member 1/1 No –
R. Seevaratnam January 2007 June 2010 Senior Independent Director 8/9 chairman 7/7 Member 1/1 Member 3/3
Dr. H. Cabral October 2006 June 2011 Independent Director 9/9 Member 7/7 chairman 1/1 Member 3/3
Prof. U. Liyanage October 2006 June 2009 Independent Director 9/9 Member 7/7 Member 1/1 chairman 3/3
A.N. Algama November 1984 June 2010 Executive Director 9/9 No – No – No –
A.M. Pandithage September 1982 June 2010 Non-Executive Director 9/9 Member 7/7 Member 1/1 Member 3/3
A.G. Pandithage December 1995 June 2011 Director/Appointed CEO w.e.f. 1st April 2012
8/9 No – No – No –
B.C.S.A.P. Gooneratne April 2006 June 2011 Executive Director 9/9 No – No – No –
R.C. Weerawardane June 2002 June 2011 Executive Director 9/9 No – No – No –
S.C. Algama November 1984 June 2009 Executive Director 9/9 No – No – No –
T.G.H. Peries August 1977 June 2010 Executive Director 8/9 No – No – No –
Dates of the Meetings
No. Board Meeting Audit Committee Nomination Committee Remuneration Committee
1. 4th April 2011 3rd May 2011 12th May 2011 12th May 2011
2. 12th May 2011 12th May 2011 20th May 2011
3. 20th May 2011 30th June 2011 17th June 2011
4. 30th June 2011 9th August 2011
5. 9th August 2011 15th August 2011
6. 27th October 2011 27th October 2011
7. 16th November 2011 26th January 2012
8. 13th February 2012
9. 21st March 2012
notes to the F inancia l statements 167 Annex to enterpr ise Governance 206 Board of Directors - prof i les 235 ten Year summary 236
A P P e n d i c e s A n n e x to e n t e r P r i s e G ov e r n A n c e
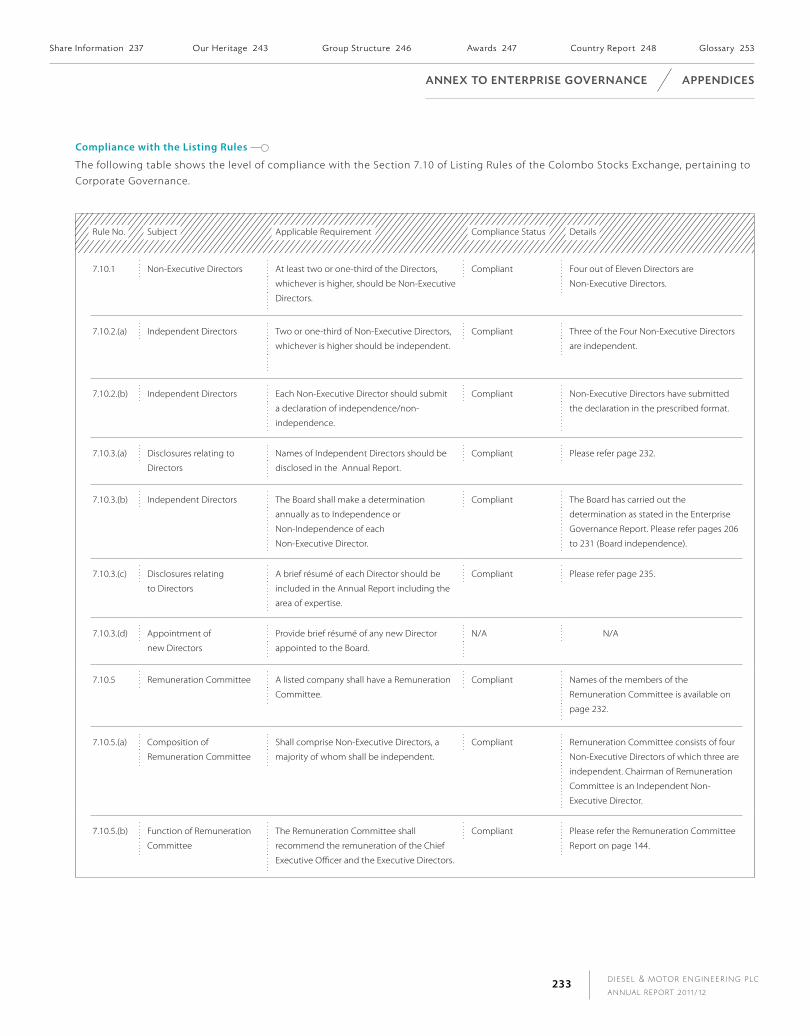
D I E S E L & M OTO R E N G I N E E R I N G P L C
A N N U A L R E P O RT 2 0 1 1 / 1 2233
compliance with the Listing Rules
The following table shows the level of compliance with the Section 7.10 of Listing Rules of the Colombo Stocks Exchange, pertaining to
Corporate Governance.
Rule No. Subject Applicable Requirement Compliance Status Details
7.10.1 Non-Executive Directors At least two or one-third of the Directors,
whichever is higher, should be Non-Executive
Directors.
Compliant Four out of Eleven Directors are
Non-Executive Directors.
7.10.2.(a) Independent Directors Two or one-third of Non-Executive Directors,
whichever is higher should be independent.
Compliant Three of the Four Non-Executive Directors
are independent.
7.10.2.(b) Independent Directors Each Non-Executive Director should submit
a declaration of independence/non-
independence.
Compliant Non-Executive Directors have submitted
the declaration in the prescribed format.
7.10.3.(a) Disclosures relating to
Directors
Names of Independent Directors should be
disclosed in the Annual Report.
Compliant Please refer page 232.
7.10.3.(b) Independent Directors The Board shall make a determination
annually as to Independence or
Non-Independence of each
Non-Executive Director.
Compliant The Board has carried out the
determination as stated in the Enterprise
Governance Report. Please refer pages 206
to 231 (Board independence).
7.10.3.(c) Disclosures relating
to Directors
A brief résumé of each Director should be
included in the Annual Report including the
area of expertise.
Compliant Please refer page 235.
7.10.3.(d) Appointment of
new Directors
Provide brief résumé of any new Director
appointed to the Board.
N/A N/A
7.10.5 Remuneration Committee A listed company shall have a Remuneration
Committee.
Compliant Names of the members of the
Remuneration Committee is available on
page 232.
7.10.5.(a) Composition of
Remuneration Committee
Shall comprise Non-Executive Directors, a
majority of whom shall be independent.
Compliant Remuneration Committee consists of four
Non-Executive Directors of which three are
independent. Chairman of Remuneration
Committee is an Independent Non-
Executive Director.
7.10.5.(b) Function of Remuneration
Committee
The Remuneration Committee shall
recommend the remuneration of the Chief
Executive Officer and the Executive Directors.
Compliant Please refer the Remuneration Committee
Report on page 144.
share information 237 our Her itage 243 Group structure 246 Awards 247 country report 248 Glossary 253
A n n e x to e n t e r P r i s e G ov e r n A n c e A P P e n d i c e s
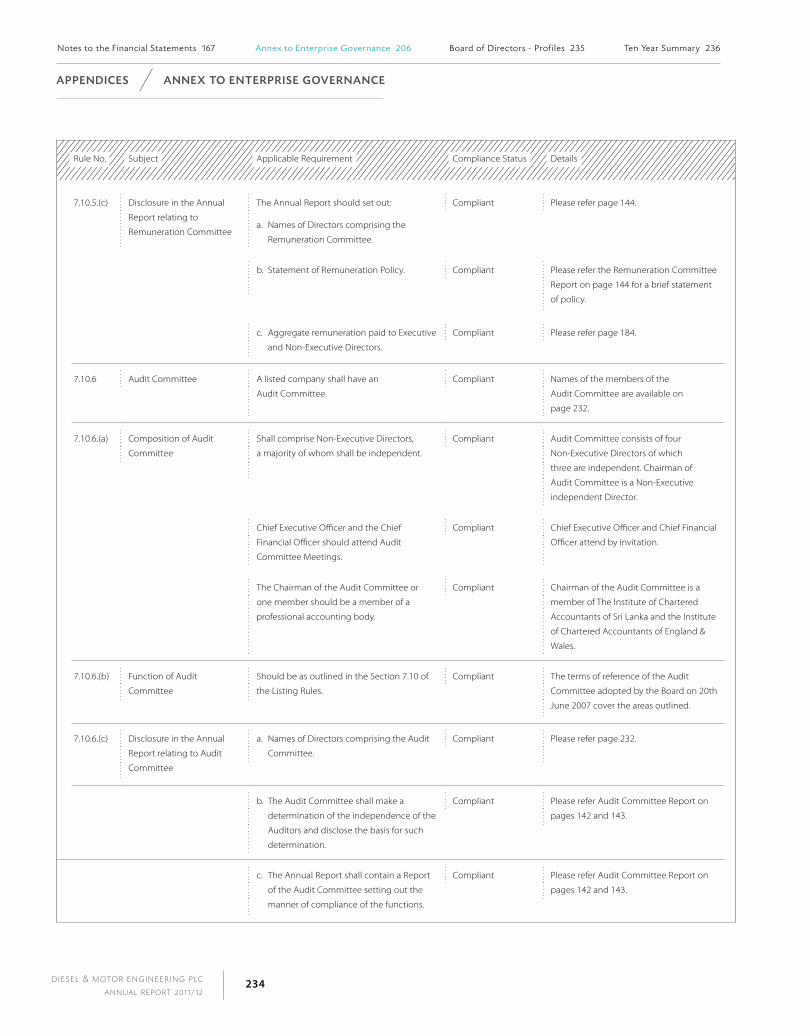
D I E S E L & M OTO R E N G I N E E R I N G P L C
A N N U A L R E P O RT 2 0 1 1 / 1 2234
Rule No. Subject Applicable Requirement Compliance Status Details
7.10.5.(c) Disclosure in the Annual
Report relating to
Remuneration Committee
The Annual Report should set out:
a. Names of Directors comprising the
Remuneration Committee.
Compliant Please refer page 144.
b. Statement of Remuneration Policy. Compliant Please refer the Remuneration Committee
Report on page 144 for a brief statement
of policy.
c. Aggregate remuneration paid to Executive
and Non-Executive Directors.
Compliant Please refer page 184.
7.10.6 Audit Committee A listed company shall have an
Audit Committee.
Compliant Names of the members of the
Audit Committee are available on
page 232.
7.10.6.(a) Composition of Audit
Committee
Shall comprise Non-Executive Directors,
a majority of whom shall be independent.
Compliant Audit Committee consists of four
Non-Executive Directors of which
three are independent. Chairman of
Audit Committee is a Non-Executive
independent Director.
Chief Executive Officer and the Chief
Financial Officer should attend Audit
Committee Meetings.
Compliant Chief Executive Officer and Chief Financial
Officer attend by invitation.
The Chairman of the Audit Committee or
one member should be a member of a
professional accounting body.
Compliant Chairman of the Audit Committee is a
member of The Institute of Chartered
Accountants of Sri Lanka and the Institute
of Chartered Accountants of England &
Wales.
7.10.6.(b) Function of Audit
Committee
Should be as outlined in the Section 7.10 of
the Listing Rules.
Compliant The terms of reference of the Audit
Committee adopted by the Board on 20th
June 2007 cover the areas outlined.
7.10.6.(c) Disclosure in the Annual
Report relating to Audit
Committee
a. Names of Directors comprising the Audit
Committee.
Compliant Please refer page 232.
b. The Audit Committee shall make a
determination of the independence of the
Auditors and disclose the basis for such
determination.
Compliant Please refer Audit Committee Report on
pages 142 and 143.
c. The Annual Report shall contain a Report
of the Audit Committee setting out the
manner of compliance of the functions.
Compliant Please refer Audit Committee Report on
pages 142 and 143.
notes to the F inancia l statements 167 Annex to enterpr ise Governance 206 Board of Directors - prof i les 235 ten Year summary 236
A P P e n d i c e s A n n e x to e n t e r P r i s e G ov e r n A n c e

D I E S E L & M OTO R E N G I N E E R I N G P L C
A N N U A L R E P O RT 2 0 1 1 / 1 2235
A.R. PAndiThAGe
Chairman/Managing Director
Joined the Company in June
1973. Appointed to the Board in
June 1977. Appointed as joint
Managing Director in November
1984 and as Managing Director
in 1986. Appointed as the
Chief Executive Officer in 1994.
Appointed as the Chairman,
Managing Director and CEO in
July 2004. Holder of Dip. Ing.
from Germany. Member of the
Institute of Engineers, Germany
( VDI). Director, Dial Textiles Ltd.
Chairman, Audit Committee of
Dial Textiles Ltd.
A.G. PAndiThAGe
Chief Executive Officer
Joined the Company in
September 1986. Appointed to
the Board in December 1995.
Fellow of the Chartered Institute
of Management Accountants, UK.
Appointed as the Deputy Chief
Executive Officer with effect from
April 2006 and appointed as CEO
w.e.f. 1st April 2012.
A.n. ALGAmA
Joined the Company in June
1973. Appointed to the Board in
November 1984. Past Chairman
of The Ceylon Motor Traders’
Association and Sri Lanka Tyre
Importers’ Association. Executive
Committee Member of the
Ceylon Chamber of Commerce -
Import Section.
s.c. ALGAmA
Appointed to the Board in
November 1984. Appointed
as an Executive Director in
1994. Fellow of the Institute of
Incorporated Engineers (SL).
Council Member and Chairman-
Transport & Automobiles
Industries Committee of the
National Chamber of Commerce,
Sri Lanka.
dR. h. cABRAL**
Appointed to the Board in
October 2006. President’s
counsel, PhD in Corporate Law
(University of Canberra) Australia,
Commissioner-Law Commission
of Sri Lanka, Member (NCED -
National Council for Economic
Development) Legal Cluster,
Member-Board of Studies-
Council of Legal Education
SL, Lecturer and Examiner-
University of Wales, University
of Colombo and Sri Lanka Law
College, Vice-President - BRIPASL
(Business Recovery & Insolvency
Practitioners’ Association of
SL). Member - Academic Board
of Studies - The Institute of
Chartered Accountants of
Sri Lanka. Director Hayleys PLC,
Union Bank PLC, Tokyo Cement
PLC, Lanka Orix Finance PLC,
Tokyo Super Lanka (Pvt) Ltd.,
Fugi Lanka (Pvt) Ltd., Tokyo Power
Lanka (Pvt) Ltd., Richard Pieris
Distributors Ltd., Commercial
Leasing & Finance Ltd., Hambana
Petrochemicals Ltd.
B.c.s.A.P. GooneRATne
Joined the Company in
January 2001. Appointed to
the Board in April 2006.
Fellow Member of The Institute
of Chartered Accountants of
Sri Lanka and holder of Master
of Business Administration
Degree from University of
Sri Jayewardenapura.
Non-Executive Director of Hunas
Falls PLC.
PRoF. U. P. LiyAnAGe**
Appointed to the Board in
October 2006. Fellow of
the Chartered Institute of
Marketing. MBA and PhD from
the Postgraduate Institute of
Management (PIM), University of
Sri Jayewardenapura.
Director and Chairman of the
Board of Management of PIM.
Non-Executive Director of
Chemenex PLC, Ceylon Cold
Stores PLC, Arpico Plastics PLC,
Talawakelle Tea Estate PLC,
Kuruwita Textile Mills PLC &
Commercial Bank of Ceylon PLC,
Richard Pieris & Co. PLC.
A.m. PAndiThAGe*
Appointed to the Board in
September 1982. Chairman
and Chief Executive Officer
of Hayleys PLC. Fellow of the
Chartered Institute of Logistics &
Transport. Director of Sri Lanka
Port Management & Consultancy
Services Ltd. Member of the
Presidential Committee on
Maritime Matters. Committee
Member of the Ceylon Chamber
of Commerce. Council Member
of the Employers’ Federation
of Ceylon. Director of 123
companies under the Hayleys
Group including the following
listed companies, Dipped
Products PLC, Haycarb PLC,
Hayleys exports PLC, Hayleys
PLC, Hayleys-Mgt Knitting Mills
PLC, Hotel Services (Ceylon)
PLC, Hunas Falls Hotels PLC,
Kelani Valley Plantations PLC,
Talawakelle Tea Estates PLC.
He is also a Director of 11
Companies under the Delmege
Forsyth Group.
T.G.h. PeRies
Joined the Company in 1962
and appointed to the Board in
August 1977.
R. seevARATnAm**
Appointed to the Board in
January 2007. Fellow member
of The Institute of Chartered
Accountants of Sri Lanka and
England & Wales and holder of
General Science Degree from
the University of London. Former
senior partner of KPMG Ford,
Rhodes, Thornton & Company.
Director of Haycarb PLC, Dipped
Products PLC, Acme Printing &
Packaging PLC, Acme Packaging
Solutions (Pvt) Ltd., Tea Factories
Small Holders PLC, Tokyo Cement
PLC, Hayleys MGT Knitting Mills
PLC, Hayleys Advantis Ltd.,
Shaw Wallace & Hedges PLC,
Shaw Wallace Marketing PLC,
Kelani Valley Plantations PLC,
Lanka Aluminium Industries
PLC, Metecno Lanka (Pvt) Ltd.,
Classic Teas (Pvt) Ltd., Green
Farms (Pvt) Ltd., Nestlé Lanka
PLC and Colombo Fort Land
Investments PLC/Colombo Fort
Land & Building Co. PLC, Omega
Line Ltd.
R.c. WeeRAWARdAne
Joined the Company in February
1990. Appointed to the Board
in June 2002. Certificate holder
of the Chartered Institute of
Marketing, UK.
Non-Executive Director *Independent Non-Executive Director **
B oA r d o F D i r ec to r s - p ro F i l e s A P P e n d i c e s
The Board of directors’ photographs: in the spirit of integration, these photographs have been randomly interspersed along with those of the Group Management Committee from pages 16 to 145 in this Annual Report.
share information 237 our Her itage 243 Group structure 246 Awards 247 country report 248 Glossary 253

D I E S E L & M OTO R E N G I N E E R I N G P L C
A N N U A L R E P O RT 2 0 1 1 / 1 2236
Year ended 31st March 2011/12 2010/11 2009/10 2008/09 2007/08 2006/07 2005/06 2004/05 2003/04 2002/03
Rs. ’000 Rs. ’000 Rs. ’000 Rs. ’000 Rs. ’000 Rs. ’000 Rs. ’000 Rs. ’000 Rs. ’000 Rs. ’000
Operating Results
Group turnover 39,898,589 29,357,271 10,530,587 9,187,966 12,687,289 12,989,916 10,512,326 7,565,327 4,796,905 3,404,734
Profit before taxation 3,716,034 3,395,980 420,095 175,082 344,444 512,895 382,235 253,633 148,396 58,912
Taxation (1,018,709) (1,274,228) (141,842) (72,054) (139,351) (211,118) (117,062) (76,431) (48,131) (20,119)
Profit after taxation 2,697,325 2,121,752 278,253 103,028 205,093 301,777 265,173 177,202 100,265 38,793
Capital Employed
Stated capital 425,297 182,500 182,500 182,500 182,500 – – – – –
Share capital – – – – – 121,000 90,000 90,000 90,000 48,000
Share premium – – – – – 61,500 37,500 37,500 37,500 19,500
Capital reserves 2,014,752 1,135,612 1,135,612 1,135,612 311,522 311,522 311,522 311,522 182,301 182,301
Revenue reserves 5,025,283 2,882,735 882,816 686,733 1,163,129 1,012,486 777,009 566,836 432,634 363,869
Shareholders’ Funds 7,465,332 4,200,847 2,200,928 2,004,845 1,657,151 1,506,508 1,216,031 1,005,858 742,435 613,670
Total borrowings (including both long-term and short-term borrowing) 5,045,829 3,068,466 1,966,600 2,709,671 2,802,374 2,864,688 2,796,158 1,608,915 958,049 866,946
Capital Employed 12,511,161 7,269,313 4,167,528 4,714,516 4,459,525 4,371,196 4,012,189 2,614,773 1,700,484 1,480,616
Net Assets Employed
Non-current assets 4,697,916 3,099,509 2,149,405 2,234,911 1,463,068 1,005,370 775,323 734,720 559,752 528,826
Current assets 10,796,702 7,839,972 3,389,023 3,028,263 4,368,090 4,193,262 3,794,288 2,460,687 1,692,349 1,197,756
Total liabilities (excluding borrowings) (2,983,457) (3,670,168) (1,370,901) (548,658) (1,371,633) (827,436) (557,422) (580,634) (551,617) (245,966)
Net Assets Employed 12,511,161 7,269,313 4,167,527 4,714,516 4,459,525 4,371,196 4,012,189 2,614,773 1,700,484 1,480,616
Cash Flows
Net cash generated from/ (used in) operating activities (2,430,074) 1,793,848 846,833 625,652 520,706 383,134 (990,433) (587,299) (39,915) (153,014)
Net cash from/(used in) investing activities (788,829) (937,710) (24,275) 1,918 (519,212) (287,636) (91,474) (97,584) (75,584) (57,827)
Net cash from/(used in) financing activities 277,902 (377,658) (295,885) (416,861) 179,289 (49,458) 305,800 92,125 26,434 (17,488)
Net increase/(decrease) in cash & cash equivalents (2,941,001) 478,480 526,673 210,709 180,783 46,040 (776,107) (592,758) (89,065) (228,329)
Key Indicators
Earnings per share (Rs.) 303.87 239.03 27.97 9.36 16.95 25.76 22.96 15.34 8.68 3.36
Net assets per share (Rs.) 841.03 473.26 252.92 230.39 136.95 124.50 121.60 100.59 82.49 102.28
Market value per share (Rs.) 982.20 1,484.70 394.25 60.25 88.75 120.00 138.50 103.00 53.00 50.00
Dividend per share (Rs.) 40.00 61.00 7.00 3.00 4.00 6.00 6.00 5.00 3.50 3.00
Dividends approved (Rs. ’000) 244,102 443,822 34,810 26,107 48,400 72,600 60,000 50,000 31,500 18,000
Annual sales growth (%) 35.91 178.78 14.61 (27.58) (2.33) 23.57 38.95 57.71 40.89 84.67
Equity to total assets ratio (%) 48.18 38.40 39.78 38.09 28.42 28.98 26.61 31.48 32.97 35.54
Dividend cover (No. of times) 7.60 4.00 3.11 2.34 4.02 3.88 3.99 3.18 3.29 1.28
Price earnings ratio (No. of times) 3.23 6.21 14.89 6.44 5.24 4.66 6.03 6.71 6.11 14.89
Current ratio (No. of times) 1.55 1.27 1.20 1.31 1.26 1.30 1.33 1.24 1.20 1.16
Turnover to capital employed (No. of times) 3.19 4.04 2.53 1.95 2.84 2.97 2.62 2.89 2.82 2.30
Interest Cover (No. of times) 15.64 17.35 2.20 1.31 1.67 2.11 2.43 2.73 2.54 1.53
Average No. of employees 1,179 942 867 869 866 820 714 627 613 595
A P P e n d i c e s t e n Y e A r s u m m A rY
notes to the F inancia l statements 167 Annex to enterpr ise Governance 206 Board of Directors - prof i les 235 ten Year summary 236
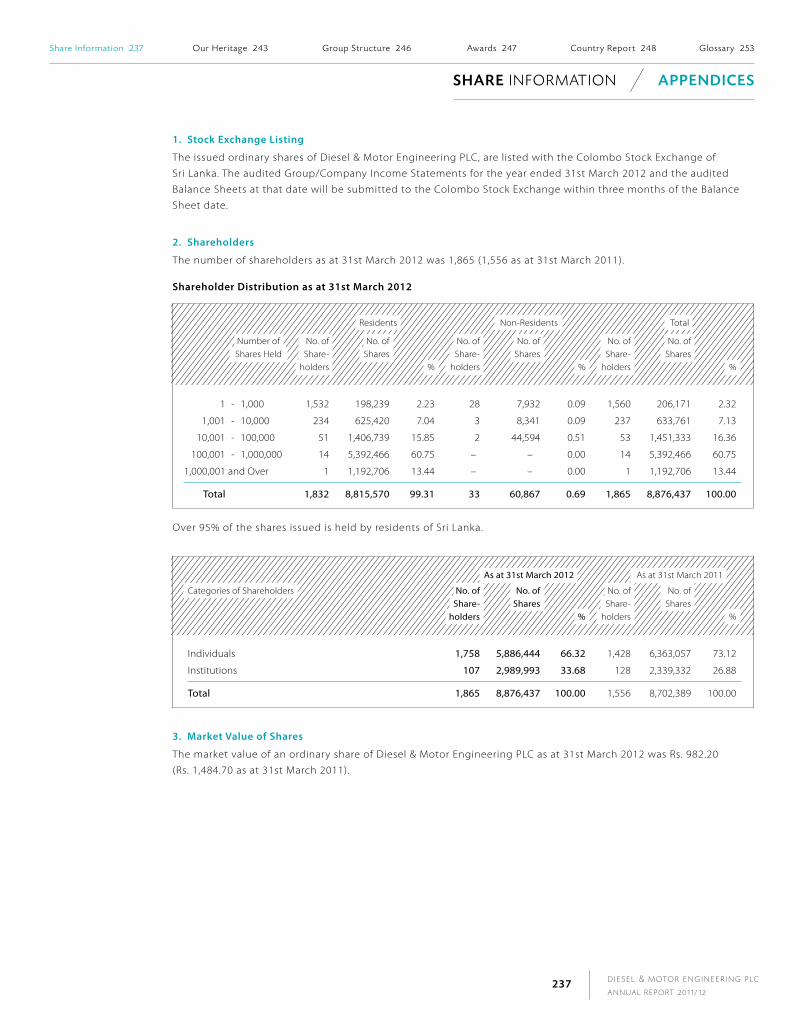
D I E S E L & M OTO R E N G I N E E R I N G P L C
A N N U A L R E P O RT 2 0 1 1 / 1 2237
1. stock exchange Listing
The issued ordinary shares of Diesel & Motor Engineering PLC, are listed with the Colombo Stock Exchange of
Sri Lanka. The audited Group/Company Income Statements for the year ended 31st March 2012 and the audited
Balance Sheets at that date will be submitted to the Colombo Stock Exchange within three months of the Balance
Sheet date.
2. shareholders
The number of shareholders as at 31st March 2012 was 1,865 (1,556 as at 31st March 2011).
shareholder distribution as at 31st march 2012
Residents Non-Residents Total
Number of No. of No. of No. of No. of No. of No. of Shares Held Share- Shares Share- Shares Share- Shares
holders % holders % holders %
1 - 1,000 1,532 198,239 2.23 28 7,932 0.09 1,560 206,171 2.32
1,001 - 10,000 234 625,420 7.04 3 8,341 0.09 237 633,761 7.13
10,001 - 100,000 51 1,406,739 15.85 2 44,594 0.51 53 1,451,333 16.36
100,001 - 1,000,000 14 5,392,466 60.75 – – 0.00 14 5,392,466 60.75
1,000,001 and Over 1 1,192,706 13.44 – – 0.00 1 1,192,706 13.44
Total 1,832 8,815,570 99.31 33 60,867 0.69 1,865 8,876,437 100.00
Over 95% of the shares issued is held by residents of Sri Lanka.
As at 31st March 2012 As at 31st March 2011
Categories of Shareholders No. of No. of No. of No. ofShare- Shares Share- Shares
holders % holders %
Individuals 1,758 5,886,444 66.32 1,428 6,363,057 73.12
Institutions 107 2,989,993 33.68 128 2,339,332 26.88
Total 1,865 8,876,437 100.00 1,556 8,702,389 100.00
3. market value of shares
The market value of an ordinary share of Diesel & Motor Engineering PLC as at 31st March 2012 was Rs. 982.20
(Rs. 1,484.70 as at 31st March 2011).
s h A r e i n F o r m At i o n A P P e n d i c e s
share information 237 our Her itage 243 Group structure 246 Awards 247 country report 248 Glossary 253

D I E S E L & M OTO R E N G I N E E R I N G P L C
A N N U A L R E P O RT 2 0 1 1 / 1 2238
4. dividend Payments
2012 2012Rs. '000 Rs. '000
First Interim dividend - Rs. 5.00 per share – 43,512
Second Interim dividend - Rs. 5.00 per share – 43,512
Final dividend declared and paid – 443,822
First Interim dividend - Rs. 5.00 per share 44,382 –
Second Interim dividend - Rs. 7.50 per share 66,573 –
Final dividend - Rs. 27.50 per share 244,102 –
5. share Trading information from 1st April 2011 to 31st march 2012
2011/12 2010/11 2009/10 2008/09
Highest (Rs.) 1,780.00 (18th April 2011) 1,900.00 (15th Feb. 2011) 505.00 (26th Feb. 2010) 160.00 (30th June 2008)
Lowest (Rs.) 920.00 (23rd March 2012) 400.00 (7th May 2010) 60.00 (6th April 2009) 57.50 (7th Jan. 2009)
(8th Jan. 2009)
Closing (Rs.) 982.20 (30th March 2012) 1,484.70 (31st March 2011) 424.75 (30th March 2010) 60.25 (26th March 2009)
No. of transactions 4,483 5,610 3,677 2,185
No. of shares traded 2,338,038 3,578,100 2,794,300 4,567,811*
Value of shares traded (Rs.) 3,367,918,063 3,479,167,355 582,666,450 677,869,260*
No. of days traded 228 228 201 163
No. of market days 240 238 240 239
Liquidity (%) 26.34 41.12 32.11 52.49
CSE All Share Price Index 5,420.20 7,226.12 3,724.59 1,638.06
Milanka Price Index 4,891.6 6,874.74 4,270.73 1,736.20
Motor Sector Index 20,420.0 26,787.33 8,838.38 3,250.90
* This includes the share repurchase of 3,397,611 shares.
6. Public shareholding
As at 31st March 2012 2011 2010 2009
Number of Shares 3,931,310 4,239,990 3,769,203 3,949,028
% 44.29 48.72 43.31 45.38
notes to the F inancia l statements 167 Annex to enterpr ise Governance 206 Board of Directors - prof i les 235 ten Year summary 236
A P P e n d i c e s s h A r e i n f o r m At i o n

D I E S E L & M OTO R E N G I N E E R I N G P L C
A N N U A L R E P O RT 2 0 1 1 / 1 2239
7. history of share issues
Year Issue No. of Shares Price (Rs.)
2011/12 Scrip (one share per every fifty shares held) 174,048 1,395.00
2006/07 Rights (one share per every ten shares held) 1,100,000 55.00
2006/07 Scrip (one share per every ten shares held) 1,000,000 Nil
2004/05 Scrip (one share per every nine shares held) 1,000,000 Nil
2003/04 Rights (one share per every two shares held) 3,000,000 20.00
2000/01 Scrip (one share per every four shares held) 1,200,000 Nil
1995/96 Scrip (one share per every three shares held) 1,200,000 Nil
1994/95 Scrip (one share per every five shares held) 600,000 Nil
1992/93 Rights (one share per every five shares held) 500,000 75.00
1991/92 Rights (one share per every three shares held) 500,000 30.00
1991/92 Scrip (one share per every four shares held) 500,000 Nil
1989/90 Rights (one share per every two shares held) 500,000 10.00
1987/88 Scrip (one share per every share held) 500,000 Nil
1980/81 Scrip (one share per every share held) 250,000 Nil
8. changes in shareholdings of directors and Their spouses during 2011/12
Name Shareholdingas at 31.03.12
%
As at 31.03.2012
Shares
Net Movement
of Shares
As at 31.03.2011
Shares
A.R. Pandithage 21.63 1,919,735 37,640 1,882,095
A.N. Algama 2.41 213,739 (44,633) 258,372
S.C. Algama 6.47 574,779 175,645 399,134
A.G. Pandithage 6.43 570,862 11,192 559,670
A.M. Pandithage 2.52 224,172 4,394 219,778
T.G.H. Peries 2.81 249,134 4,884 244,250
42.27 3,752,421 189,122 3,563,299
share information 237 our Her itage 243 Group structure 246 Awards 247 country report 248 Glossary 253
s h A r e i n f o r m At i o n A P P e n d i c e s

D I E S E L & M OTO R E N G I N E E R I N G P L C
A N N U A L R E P O RT 2 0 1 1 / 1 2240
9. Top Twenty shareholders
As at 31st March 2012 As at 31st March 2011*
Name of Shareholder Shares % Shares %
Employees’ Provident Fund 1,192,706 13.44 899,100 10.33
Mr. A.R. Pandithage 991,233 11.17 971,798 11.17
Mrs. J.C. Pandithage 928,502 10.46 910,297 10.46
A & G Investments (Pvt) Ltd. 608,939 6.86 – –
Mr. S.C. Algama 567,786 6.40 392,278 4.51
Mr. A.G. Pandithage 525,814 5.92 515,505 5.92
Sri Lanka Insurance Corporation Ltd. - Life Fund 315,466 3.55 – –
Almar Trading Co. (Pvt) Ltd. 306,476 3.45 294,964 3.39
Mr. A.N. Algama 213,739 2.41 258,372 2.97
Mr. T.G.H. Peries 193,069 2.18 189,284 2.18
Mr. A.M. Pandithage 182,319 2.05 178,745 2.05
Dr. D. Jayantha 157,700 1.78 154,600 1.78
Miss. T.R.N.C. Peries 148,009 1.67 72,011 0.83
Mr. L.P. Algama 134,569 1.52 131,921 1.52
Estate of the Late Mr. N.U. Algama 118,845 1.34 116,515 1.34
Mr. M. Radhakrishnan 69,788 0.79 68,420 0.79
Almar International (Pvt) Ltd. 62,861 0.71 294,964 3.39
Employees’ Trust Fund Board 58,494 0.66 119,700 1.38
Mrs. M.S. Peries 56,065 0.63 54,966 0.01
United Motors Lanka PLC 50,300 0.57 – –
6,882,680 77.56 5,623,440 64.02
* Comparative shareholdings as at 31st March 2011 of the twenty largest shareholders as at 31st March 2012.
10. The stated capital represents 8,876,437 ordinary shares.
notes to the F inancia l statements 167 Annex to enterpr ise Governance 206 Board of Directors - prof i les 235 ten Year summary 236
A P P e n d i c e s s h A r e i n f o r m At i o n
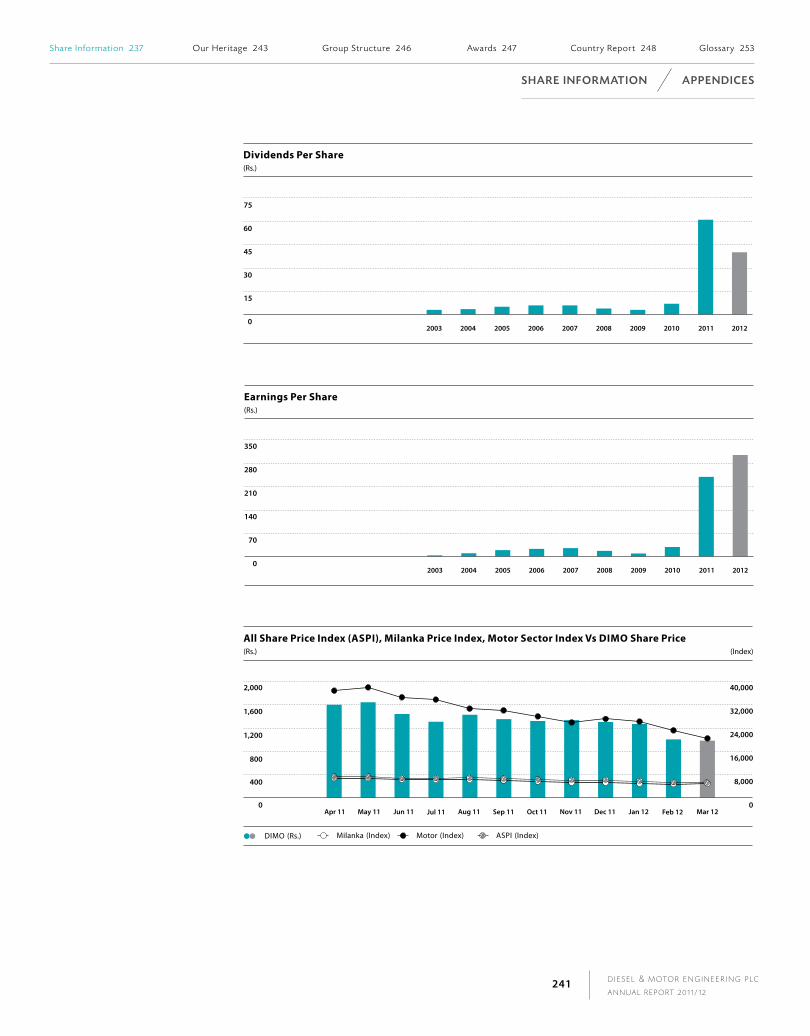
D I E S E L & M OTO R E N G I N E E R I N G P L C
A N N U A L R E P O RT 2 0 1 1 / 1 2241
Dividends Per Share
(Rs.)
2003 2004 2005 2006 2007 2008 2009 2010 2011 20120
15
30
45
60
75
Earnings Per Share
(Rs.)
2003 2004 2005 2006 2007 2008 2009 2010 2011 20120
70
140
210
280
350
0
8,000
16,000
24,000
32,000
40,000
All Share Price Index (ASPI), Milanka Price Index, Motor Sector Index Vs DIMO Share Price
(Rs.) (Index)
DIMO (Rs.) Milanka (Index)
0
400
800
1,200
1,600
2,000
Apr 11 May 11 Jun 11 Jul 11 Aug 11 Sep 11 Oct 11 Nov 11 Dec 11 Jan 12 Feb 12 Mar 12
Motor (Index) ASPI (Index)
share information 237 our Her itage 243 Group structure 246 Awards 247 country report 248 Glossary 253
s h A r e i n f o r m At i o n A P P e n d i c e s

D I E S E L & M OTO R E N G I N E E R I N G P L C
A N N U A L R E P O RT 2 0 1 1 / 1 2242
Number of Shares Traded
(No. �000)
2003 2004 2005 2006 2007 2008 2009 2010 2011 20120
950
1,900
2,850
3,800
4,750
notes to the F inancia l statements 167 Annex to enterpr ise Governance 206 Board of Directors - prof i les 235 ten Year summary 236
A P P e n d i c e s s h A r e i n f o r m At i o n

D I E S E L & M OTO R E N G I N E E R I N G P L C
A N N U A L R E P O RT 2 0 1 1 / 1 2243
Diesel & Motor Engineering PLC is best known as the ‘Benz Company’ in Sri Lanka. This nomenclature
describes well the spirit of its undertaking a commitment to excellence. Dimo which was established
over seven decades ago, has through its commitment to continuous improvement and customer
service strengthened this commitment and fulfilled its promise as a Company that is reputed for its
trustworthiness.
In 1932, Mr. F.K.Heller, a well-known German businessman set up his own business in Sri Lanka with
the distributorship of several world renowned German brands such as Mercedes Benz, Bosch, Siemens
etc., under the name of Heller & Company. Being a German national, in 1939 when World War broke
out, the business of Mr. Heller was acquired by the Government.
The same year, four youths Messrs Stephen Peries, Pandithage Don Alexander, Cyril Algama and
Harold Algama employed at Heller & Company, got together and commenced a workshop at a rented
premises off Prince of Wales Avenue with few mechanics. This was the beginning of Dimo.
The founding fathers of Dimo were humble, ethical and down to earth people with humane values.
The initial business was making gaskets and turning out parts thus catering to the high demand
prevalent for reconditioning, as new part replacement was costly due to the war. As volumes
expanded, the business diversified to sale of electrical parts, fittings for motor vehicles and engine
parts etc.
The four youths began humbly, but had great ambition to excel. Their vision was to achieve the status
of a world-class in the products and services offered. This vision remains undiluted even today,
as the management of the Company has remained in the main in the hands of the founding families.
The progeny have held true to the vision of the Company’s first owners, of a commitment to
excellence and ethical business practices.
In 1945 Dimo was incorporated as a Private Limited Liability Company. With the end of the 2nd World
War, Mr. Heller was released and subsequently became a prominent industrialist in Germany.
o u r h e r i tAG e A P P e n d i c e s
share information 237 our Her itage 243 Group structure 246 Awards 247 country report 248 Glossary 253
D I E S E L & M OTO R E N G I N E E R I N G P L C
A N N U A L R E P O RT 2 0 1 1 / 1 2244
By 1949, Mr. Heller became an active partner of Dimo via Lohmann & Company Breman Germany.
In order to expand the activities, the business was relocated to Jethawana Road, from where it still
operates. In 1952, a showroom, stores and workshop was opened for business.
The first notable achievement for Dimo came in 1959, when over 200 Mercedes Benz buses were
supplied to the then nationalised bus Company.
The key attribute of Dimo is that as a Company with a long history of over 70 years it has through its
expansions always held true to the spirit of its founders and has spurned compromise. It takes pride
in its historical situation as probably the oldest sole distributor for Mercedes Benz passenger and
commercial vehicles in the Asian region.
In 1960, the Company extended its rear boundaries up to Bloemendhal Road, facilitating the
expansion of its workshop.
In 1964, Dimo was converted into a public Quoted Company by obtaining a listing at the Colombo
Brokers’ Association, as it was then known.
In 1966, the Company commenced manufacturing of radiators, radiator cores, silencer barrels and
light engineering products for motor vehicles.
Dimo Industries (Pvt) Ltd., and Dimo (Pvt) Ltd., were incorporated as wholly owned-subsidiaries in the
early 70s. Dimo Industries (Pvt) Ltd., was established to manufacture automobile parts, while Dimo
(Pvt) Ltd., was for the sale and service of Power Systems, Power Engineering and Medical Equipment.
In 1986, the Hayleys Group acquired a stake in the equity capital making Dimo one of its associate
Companies, this association was discontinued in 2008.
The divisional organisational structure was introduced in 1987 to support and nurture the
development of the Company and to institutionalise the management process.
As part of its evolving strategy of enhancing local expertise, in 1990 Dimo set up its first automobile
training school offering a two-year comprehensive service and maintenance course designed by
Mercedes-Benz Germany. It is the only such enterprise of its kind in the corporate sector. The school
has expanded, also offering automotive training courses for the UK-based City & Guilds programme.
In 1996, the Company relocated its after sales and service activities of commercial vehicles,
construction machinery and power systems at Siyambalape, Biyagama which is about ten kilo metres
away from Colombo city limits. The workshop complex is equipped with state-of-the-art machinery
and equipment.
In 2008, the Company commenced its logistical operations from Weliwariya which is in the
Gampaha District.
In 2010, Dimo opened its second automobile training school in Jaffna. Youth of the North who
were deprived of quality technical training facilities for over 30 years, have now been offered an
opportunity of high quality technical education.
notes to the F inancia l statements 167 Annex to enterpr ise Governance 206 Board of Directors - prof i les 235 ten Year summary 236
A P P e n d i c e s o u r h e r i tAG e

D I E S E L & M OTO R E N G I N E E R I N G P L C
A N N U A L R E P O RT 2 0 1 1 / 1 2245
Dimo is involved in a number of related fields, but maintains its core expertise representing many
prestigious principal automobile and heavy-vehicle manufacturers and their allied services. Its
portfolio consists of ‘best in class’ brands such as Daimler, TATA, Bosch, MTU, Komatsu, Siemens,
Michelin, Osram and Mahindra & Mahindra to name but a few. Its portfolio reaffirms the prestige and
historicity of Dimo as a Company committed to providing truly top-end products and services.
In 2011, the state-of-the-art Bosch Service Centre was commissioned. This workshop can
accommodate 20 vehicles of all makes. With a majority of working bays being fitted with vehicle lifts
and exhaust emission systems, the Bosch Service Centre is equipped with state-of-the-art diagnostic
equipment and test equipment which is tailor-made for advanced and new generation, electronically
controlled vehicles.
Dimo commenced the construction of the new Mercedes-Benz Sales and aftercare centre at Srimavo
Bandarenaike, Mawatha Colombo 14. This will be in line with the Principals standards ensuring
enhance customer service and will deliver the Mercedes-Benz experience. This centre will
centralise sales, service and spare parts under one roof.
The Head Office is conveniently and spaciously remains located in an area of approximately 10,000 sq.
metres in a central commercial sector in Colombo. The complex houses the Company’s administrative
and sales offices, passenger car and automotive workshops with its showrooms. The Company
continues to serve its expanding customer base by expanding its branch network in addition the to
the Company’s owned display points.
Since its modest beginning, the Company has grown in size as well as in scope, and presently has a
workforce of over 1,300. With over seven decades of experience in the automobile and engineering
industry, the Company over the years has made a significant contribution towards the development
of the transportation sector in Sri Lanka.
share information 237 our Her itage 243 Group structure 246 Awards 247 country report 248 Glossary 253
o u r h e r i tAG e A P P e n d i c e s

D I E S E L & M OTO R E N G I N E E R I N G P L C
A N N U A L R E P O RT 2 0 1 1 / 1 2246
INDUSTRIAL SOLUTIONS
Inc. 1975Reg. No. - PV1256
Dimo Travels (Pvt) Ltd.DIMO TRAVELS (PVT) LTD.
INC. 1980Reg. No. - PV2317
DIMO (PVT) LTD.
Inc. 1979Reg. No. - PV1260
Dimo Industries (Pvt) LtdDIMO INDUSTRIES (PVT) LTD.
100%
*
*
*
DIESEL & MOTOR ENGINEERING PLC
AUTOMOBILE
MARKETING & PROJECTS
Lighting & Power Tools
Construction Agricultural & Material Handling Machinery
Electro Mechanical & Bio Medical Engineering
Vehicle Parts & Services
Repair of Passenger & Commercial VehiclesSale of Vehicle Spare PartsAccessoriesComponents and Tyres & Retreaded Tyres
Vehicles Sales of brand new Passenger VehiclesFour Wheel Drive VehiclesCommercial VehiclesSpecial Purpose Vehicles and Pre-owned Passenger Vehicles
Sales of Power Tools & AccessoriesLampsLighting Fittings and Accessories
Sales & Service of Earth Moving MachineryRoad Construction MachineryForklifts, Material Handling MachineryRacking SystemsAgri MachineryPumps, Dock Levellers and Car Parking Systems
Sale, Installation, Commissioning and Maintenance of Medical EquipmentGenerating setsDiesel Engines for Marine PropulsionRail TractionBuilding Management SystemsIndustrial Refrigeration SystemsPower Engineering Equipment Systems
100%
100%
A.R. Pandithage (Chairman/MD)A.G. Pandithage (CEO)A.N. Algama S.C. AlgamaDr. H. CabralB.C.S.A.P. GooneratneProf. U.P. LiyanageA.M. PandithageT.G.H. PeriesR. SeevaratnamR.C. Weerawardane
A.R. Pandithage (Chairman)S.C. AlgamaM.V. BandaraE.D.C. Kodituwakku
A.R. Pandithage (Chairman) S.C. Algama (MD) R.H. Fernando B.C.S.A.P. Gooneratne A.G. Pandithage W. Pushpawela C. Ranawana R.C. Weerawardane
A.R. Pandithage (Chairman)S.C. AlgamaA.C.G. DiasB.C.S.A.P. GooneratneA.G. Pandithage R.C. Weerawardane
11
11
4
* Inc. 1945Reg. PQ 146
6
8
Name of the Company / Reg No. / Year of Incorporation / % Holding Products & Services No. of
Directors Directors Segment Division
TRAVELLINGProvision of Transportation Facilities
Operations of the Company were transferred to Diesel & Motor EngineeringPLC w.e.f. 31st December 2010
A P P e n d i c e s G ro u P st r u c t u r e
notes to the F inancia l statements 167 Annex to enterpr ise Governance 206 Board of Directors - prof i les 235 ten Year summary 236
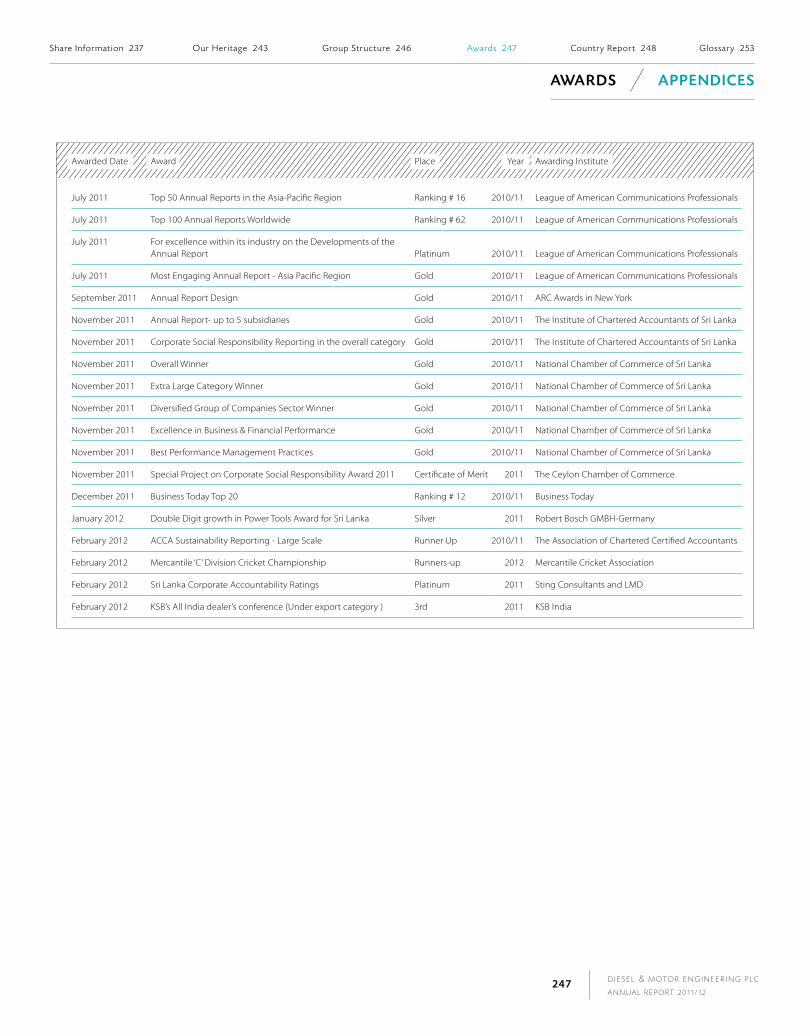
D I E S E L & M OTO R E N G I N E E R I N G P L C
A N N U A L R E P O RT 2 0 1 1 / 1 2247
Awarded Date Award Place Year Awarding Institute
July 2011 Top 50 Annual Reports in the Asia-Pacific Region Ranking # 16 2010/11 League of American Communications Professionals
July 2011 Top 100 Annual Reports Worldwide Ranking # 62 2010/11 League of American Communications Professionals
July 2011 For excellence within its industry on the Developments of the Annual Report Platinum 2010/11 League of American Communications Professionals
July 2011 Most Engaging Annual Report - Asia Pacific Region Gold 2010/11 League of American Communications Professionals
September 2011 Annual Report Design Gold 2010/11 ARC Awards in New York
November 2011 Annual Report- up to 5 subsidiaries Gold 2010/11 The Institute of Chartered Accountants of Sri Lanka
November 2011 Corporate Social Responsibility Reporting in the overall category Gold 2010/11 The Institute of Chartered Accountants of Sri Lanka
November 2011 Overall Winner Gold 2010/11 National Chamber of Commerce of Sri Lanka
November 2011 Extra Large Category Winner Gold 2010/11 National Chamber of Commerce of Sri Lanka
November 2011 Diversified Group of Companies Sector Winner Gold 2010/11 National Chamber of Commerce of Sri Lanka
November 2011 Excellence in Business & Financial Performance Gold 2010/11 National Chamber of Commerce of Sri Lanka
November 2011 Best Performance Management Practices Gold 2010/11 National Chamber of Commerce of Sri Lanka
November 2011 Special Project on Corporate Social Responsibility Award 2011 Certificate of Merit 2011 The Ceylon Chamber of Commerce
December 2011 Business Today Top 20 Ranking # 12 2010/11 Business Today
January 2012 Double Digit growth in Power Tools Award for Sri Lanka Silver 2011 Robert Bosch GMBH-Germany
February 2012 ACCA Sustainability Reporting - Large Scale Runner Up 2010/11 The Association of Chartered Certified Accountants
February 2012 Mercantile ‘C’ Division Cricket Championship Runners-up 2012 Mercantile Cricket Association
February 2012 Sri Lanka Corporate Accountability Ratings Platinum 2011 Sting Consultants and LMD
February 2012 KSB’s All India dealer’s conference (Under export category ) 3rd 2011 KSB India
share information 237 our Her itage 243 Group structure 246 Awards 247 country report 248 Glossary 253
AwA r d s A P P e n d i c e s

D I E S E L & M OTO R E N G I N E E R I N G P L C
A N N U A L R E P O RT 2 0 1 1 / 1 2248
This section of the report is addressed especially to our international audience, with a view to
providing them with an insight into Sri Lanka.
We will provide an overview of Sri Lanka’s physical features, demography and key economic
indicators. We feature global economic trends during the year under review too, enabling us to
bring the Sri Lankan economy into perspective.
Democratic Socialist Republic of Sri Lanka, known as Ceylon before 22nd May 1972,
is positioned approximately 31 km off the Southern coast of India. Sri Lanka forms a strategic
naval link between West Asia and South East Asia, as a result of it being located in the path of
major sea routes.
Sri Lanka has been classified among top six destinations for international travelers in 2012 by
National Geographic Traveler magazine, focusing on the island’s hill country, heritage sites and
pristine beaches. A nation with a tropical weather, where the original soul of Buddhism still
flourishes, its natural beauty is extant, abundant and undamaged.
Compared to South Asian region, Sri Lanka has had strong economic growth rates in recent years.
Tea, rubber, coconut and apparel exports contribute substantially to the Country ’s economy.
Agricultural products show a marked increase in the export market. In addition to these economic
sectors, overseas employment brings in sizeable foreign exchange earnings.
Physical Features
Total area 65,610 Sq. km.
Land area 62,705 Sq. km.
Capital Sri Jayawardenapura
Commercial Capital Colombo
demographics
2011 2010 2009 2008 2007
Mid-year population (Persons in mn) 20.87 20.65 20.5 20.2 20.0
Labour force (Persons in mn) 8.2 8.11 8.1 7.5 7.4
Labour force participation rate (%) 48.2 48.1 48.7 50.2 49.8
Unemployment rate (% of labour force) 4.2 4.9 5.8 5.2 6.0
Source - Central Bank of Sri Lanka Annual Report 2011
Unemployment rate dropped to its lowest 4.2%
The unemployment receded to its lowest level reaching 4.2% in 2011 from 4.9% in 2010. This
commendable improvement was achieved by broad based economic growth, complemented by
unprecedented infrastructure development projects during 2011/2012. Changes were observed
in contribution to overall composite chart of employment among major industry groups in 2011.
Accordingly, Agriculture and Industry sectors’ contribution to total employment increased in 2011,
whilst that of the Service sector declined.
A P P e n d i c e s co u n t rY r e p o rt
Colombo
Kalutara
Gampaha
Kegalle
Kurunegala
Kandy
DambullaPuttalam
Anuradhapura
Polonnaruwa
Batticaloa
Ampara
Badulla
Moneragala
Hambantota
Matara
Ratnapura
Nuwara Eliya
Trincomalee
Mannar
Galle
notes to the F inancia l statements 167 Annex to enterpr ise Governance 206 Board of Directors - prof i les 235 ten Year summary 236
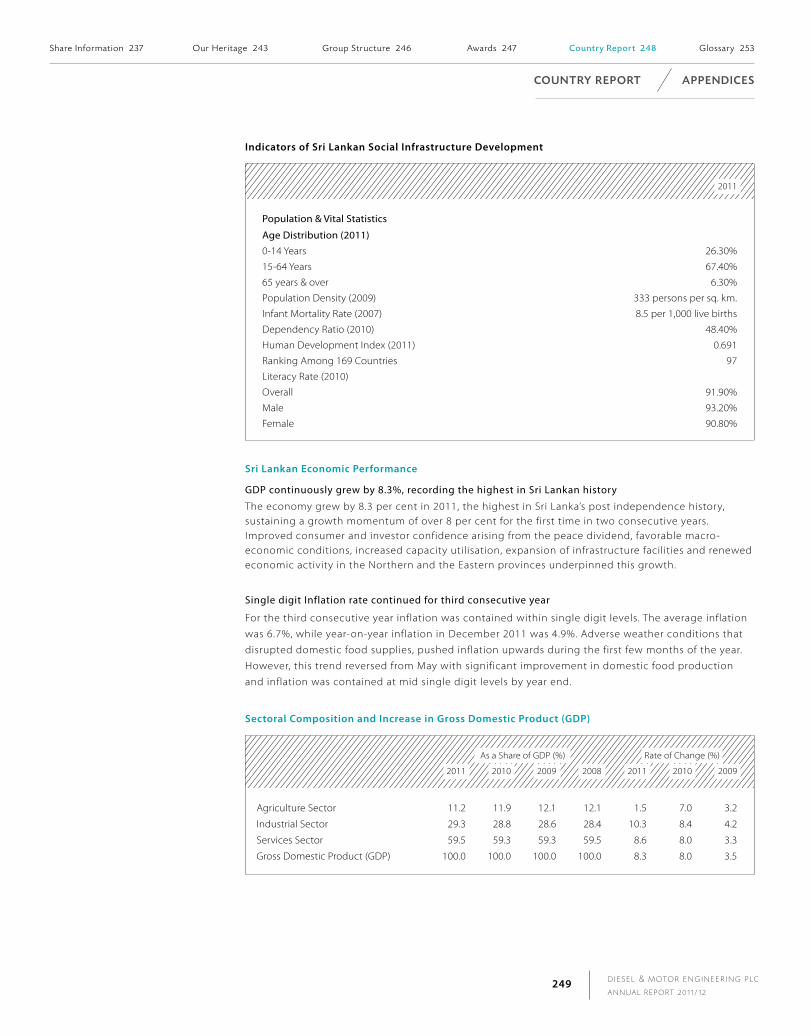
D I E S E L & M OTO R E N G I N E E R I N G P L C
A N N U A L R E P O RT 2 0 1 1 / 1 2249
indicators of sri Lankan social infrastructure development
2011
Population & Vital Statistics
Age Distribution (2011)
0-14 Years 26.30%
15-64 Years 67.40%
65 years & over 6.30%
Population Density (2009) 333 persons per sq. km.
Infant Mortality Rate (2007) 8.5 per 1,000 live births
Dependency Ratio (2010) 48.40%
Human Development Index (2011) 0.691
Ranking Among 169 Countries 97
Literacy Rate (2010)
Overall 91.90%
Male 93.20%
Female 90.80%
sri Lankan economic Performance
GDP continuously grew by 8.3%, recording the highest in Sri Lankan history
The economy grew by 8.3 per cent in 2011, the highest in Sri Lanka’s post independence history, sustaining a growth momentum of over 8 per cent for the first time in two consecutive years. Improved consumer and investor confidence arising from the peace dividend, favorable macro-economic conditions, increased capacity utilisation, expansion of infrastructure facilities and renewed economic activity in the Northern and the Eastern provinces underpinned this growth.
Single digit Inflation rate continued for third consecutive year
For the third consecutive year inflation was contained within single digit levels. The average inflation
was 6.7%, while year-on-year inflation in December 2011 was 4.9%. Adverse weather conditions that
disrupted domestic food supplies, pushed inflation upwards during the first few months of the year.
However, this trend reversed from May with significant improvement in domestic food production
and inflation was contained at mid single digit levels by year end.
sectoral composition and increase in Gross domestic Product (GdP)
As a Share of GDP (%) Rate of Change (%)
2011 2010 2009 2008 2011 2010 2009
Agriculture Sector 11.2 11.9 12.1 12.1 1.5 7.0 3.2
Industrial Sector 29.3 28.8 28.6 28.4 10.3 8.4 4.2
Services Sector 59.5 59.3 59.3 59.5 8.6 8.0 3.3
Gross Domestic Product (GDP) 100.0 100.0 100.0 100.0 8.3 8.0 3.5
co u n t rY r e P o rt A P P e n d i c e s
share information 237 our Her itage 243 Group structure 246 Awards 247 Country Report 248 Glossary 253
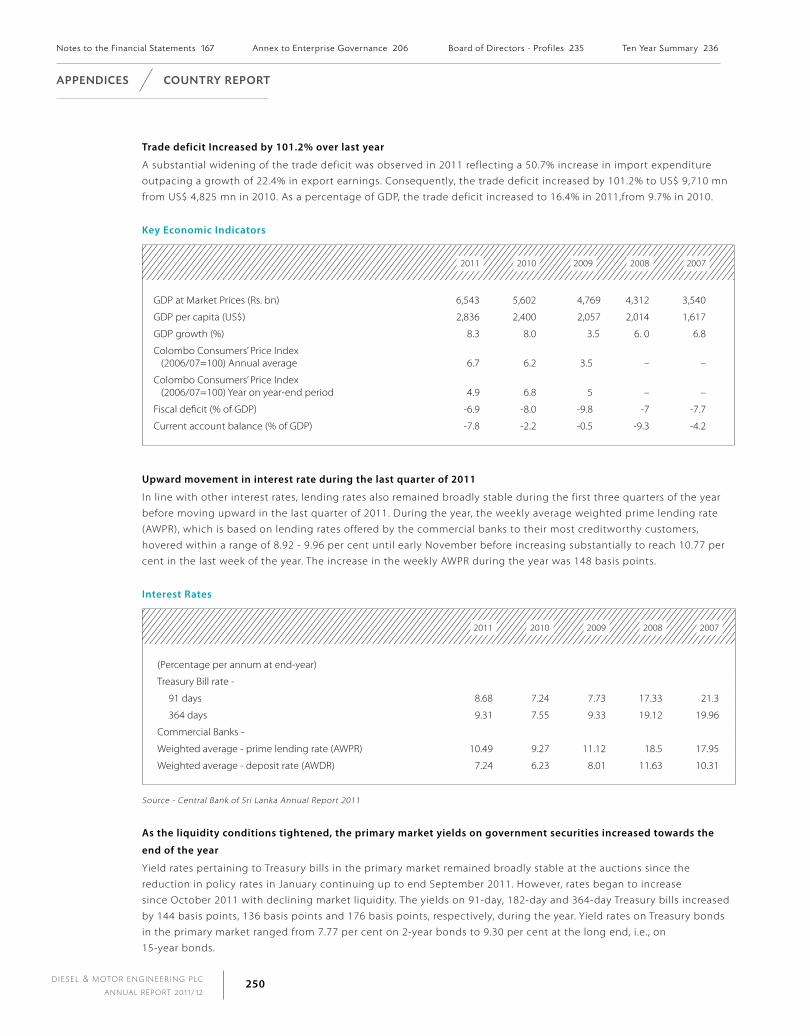
D I E S E L & M OTO R E N G I N E E R I N G P L C
A N N U A L R E P O RT 2 0 1 1 / 1 2250
Trade deficit increased by 101.2% over last year
A substantial widening of the trade deficit was observed in 2011 reflecting a 50.7% increase in import expenditure
outpacing a growth of 22.4% in export earnings. Consequently, the trade deficit increased by 101.2% to US$ 9,710 mn
from US$ 4,825 mn in 2010. As a percentage of GDP, the trade deficit increased to 16.4% in 2011,from 9.7% in 2010.
Key economic indicators
2011 2010 2009 2008 2007
GDP at Market Prices (Rs. bn) 6,543 5,602 4,769 4,312 3,540
GDP per capita (US$) 2,836 2,400 2,057 2,014 1,617
GDP growth (%) 8.3 8.0 3.5 6. 0 6.8
Colombo Consumers’ Price Index (2006/07=100) Annual average 6.7 6.2 3.5 – –
Colombo Consumers’ Price Index (2006/07=100) Year on year-end period 4.9 6.8 5 – –
Fiscal deficit (% of GDP) -6.9 -8.0 -9.8 -7 -7.7
Current account balance (% of GDP) -7.8 -2.2 -0.5 -9.3 -4.2
Upward movement in interest rate during the last quarter of 2011
In line with other interest rates, lending rates also remained broadly stable during the first three quarters of the year
before moving upward in the last quarter of 2011. During the year, the weekly average weighted prime lending rate
(AWPR), which is based on lending rates offered by the commercial banks to their most creditworthy customers,
hovered within a range of 8.92 - 9.96 per cent until early November before increasing substantially to reach 10.77 per
cent in the last week of the year. The increase in the weekly AWPR during the year was 148 basis points.
interest Rates
2011 2010 2009 2008 2007
(Percentage per annum at end-year)
Treasury Bill rate -
91 days 8.68 7.24 7.73 17.33 21.3
364 days 9.31 7.55 9.33 19.12 19.96
Commercial Banks -
Weighted average - prime lending rate (AWPR) 10.49 9.27 11.12 18.5 17.95
Weighted average - deposit rate (AWDR) 7.24 6.23 8.01 11.63 10.31
Source - Central Bank of Sri Lanka Annual Report 2011
As the liquidity conditions tightened, the primary market yields on government securities increased towards the
end of the year
Yield rates pertaining to Treasury bills in the primary market remained broadly stable at the auctions since the
reduction in policy rates in January continuing up to end September 2011. However, rates began to increase
since October 2011 with declining market liquidity. The yields on 91-day, 182-day and 364-day Treasury bills increased
by 144 basis points, 136 basis points and 176 basis points, respectively, during the year. Yield rates on Treasury bonds
in the primary market ranged from 7.77 per cent on 2-year bonds to 9.30 per cent at the long end, i.e., on
15-year bonds.
A P P e n d i c e s co u n t rY r e P o rt
notes to the F inancia l statements 167 Annex to enterpr ise Governance 206 Board of Directors - prof i les 235 ten Year summary 236
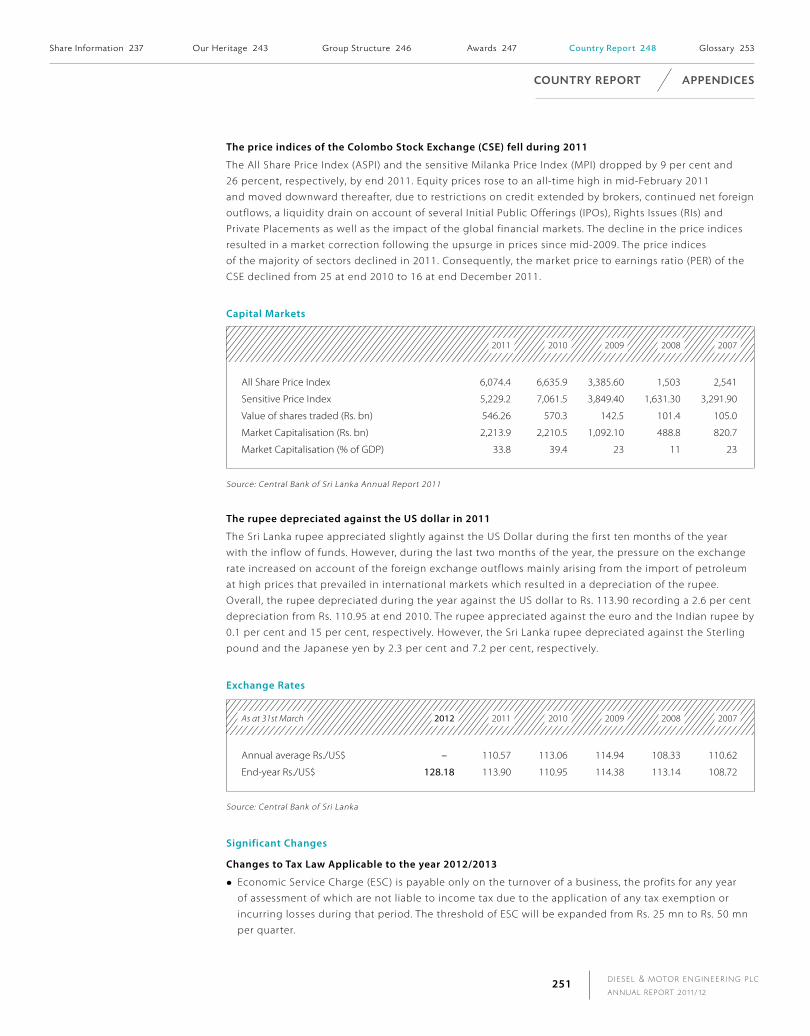
D I E S E L & M OTO R E N G I N E E R I N G P L C
A N N U A L R E P O RT 2 0 1 1 / 1 2251
The price indices of the colombo stock exchange (cse) fell during 2011
The All Share Price Index (ASPI) and the sensitive Milanka Price Index (MPI) dropped by 9 per cent and
26 percent, respectively, by end 2011. Equity prices rose to an all-time high in mid-February 2011
and moved downward thereafter, due to restrictions on credit extended by brokers, continued net foreign
outflows, a liquidity drain on account of several Initial Public Offerings (IPOs), Rights Issues (RIs) and
Private Placements as well as the impact of the global financial markets. The decline in the price indices
resulted in a market correction following the upsurge in prices since mid-2009. The price indices
of the majority of sectors declined in 2011. Consequently, the market price to earnings ratio (PER) of the
CSE declined from 25 at end 2010 to 16 at end December 2011.
capital markets
2011 2010 2009 2008 2007
All Share Price Index 6,074.4 6,635.9 3,385.60 1,503 2,541
Sensitive Price Index 5,229.2 7,061.5 3,849.40 1,631.30 3,291.90
Value of shares traded (Rs. bn) 546.26 570.3 142.5 101.4 105.0
Market Capitalisation (Rs. bn) 2,213.9 2,210.5 1,092.10 488.8 820.7
Market Capitalisation (% of GDP) 33.8 39.4 23 11 23
Source: Central Bank of Sri Lanka Annual Report 2011
The rupee depreciated against the Us dollar in 2011
The Sri Lanka rupee appreciated slightly against the US Dollar during the first ten months of the year
with the inflow of funds. However, during the last two months of the year, the pressure on the exchange
rate increased on account of the foreign exchange outflows mainly arising from the import of petroleum
at high prices that prevailed in international markets which resulted in a depreciation of the rupee.
Overall, the rupee depreciated during the year against the US dollar to Rs. 113.90 recording a 2.6 per cent
depreciation from Rs. 110.95 at end 2010. The rupee appreciated against the euro and the Indian rupee by
0.1 per cent and 15 per cent, respectively. However, the Sri Lanka rupee depreciated against the Sterling
pound and the Japanese yen by 2.3 per cent and 7.2 per cent, respectively.
exchange Rates
As at 31st March 2012 2011 2010 2009 2008 2007
Annual average Rs./US$ – 110.57 113.06 114.94 108.33 110.62
End-year Rs./US$ 128.18 113.90 110.95 114.38 113.14 108.72
Source: Central Bank of Sri Lanka
significant changes
changes to Tax Law Applicable to the year 2012/2013
Economic Service Charge (ESC) is payable only on the turnover of a business, the profits for any year
of assessment of which are not liable to income tax due to the application of any tax exemption or
incurring losses during that period. The threshold of ESC will be expanded from Rs. 25 mn to Rs. 50 mn
per quarter.
co u n t rY r e P o rt A P P e n d i c e s
share information 237 our Her itage 243 Group structure 246 Awards 247 Country Report 248 Glossary 253

D I E S E L & M OTO R E N G I N E E R I N G P L C
A N N U A L R E P O RT 2 0 1 1 / 1 2252
Forecasts For 2012
The central Bank of sri Lanka has the following forecasts in terms of outlook for 2012
The Sri Lankan economy is projected to grow at a slower rate of 7.2 per cent in 2012 compared to the
impressive growth rate of 8.3 per cent recorded in 2011. The original growth projection for 2012 was
revised downward from 8.0 percent to 7.2 per cent, considering the likely impact of the developments
in the domestic and global environment and the policy measures that were taken in early 2012 to
curtail aggregate demand and strengthen the external sector. The increase in policy interest rates,
the limiting of domestic credit expansion and the raising of domestic fuel prices are likely to slow
down the country ’s economic activity. The recent depreciation of the exchange rate is expected to
curtail imports, but the expected increase in export competitiveness is likely to contain the impact of
reducing external demand originating from the turbulent conditions in trading partner economies.
Further, the high international energy prices, particularly of petroleum, the sluggish recovery of the
global economy and weakening investor sentiments on a global scale too have been factored into the
downward revision of the growth forecast for 2012.
Trade in services is expected to generate increasing surpluses supported by the booming tourism
industry and transportation including port and airport related activities. Workers’ remittances, which
are estimated to grow substantially in 2012, are expected to moderate its growth in the medium term,
in line with expanding domestic economic activities. With the tight domestic labour market conditions,
migration for foreign employment is expected to decline gradually resulting in a deceleration of
workers’ remittances in 2013 and beyond, in contrast to the substantially high growth rates recorded
since 2009.
A P P e n d i c e s co u n t rY r e P o rt
notes to the F inancia l statements 167 Annex to enterpr ise Governance 206 Board of Directors - prof i les 235 ten Year summary 236

D I E S E L & M OTO R E N G I N E E R I N G P L C
A N N U A L R E P O RT 2 0 1 1 / 1 2253
Accounting PoliciesSpecific principles, bases, conventions, rules and practices adopted by an enterprise in preparing and presenting Financial Statements.
Accrual BasisThe principle that revenues and costs are matched with one another, irrespective of the period of receipt or payment.
Air emissionsReleasing of pollutants into the atmosphere from stationary sources (such as factory chimneys) and vehicles.
AmortisationThe systematic allocation of the depreciable amount of an intangible asset over its useful life.
Asset TurnoverThe amount of sales generated for every Rupee worth of assets. It is calculated by dividing sales by assets.
BiodiversityThe degree of variation of life forms within a given species, ecosystem, biome, or an entire planet.
BorrowingsAll interest-bearing liabilities.
capital employedTotal assets less interest free liabilities, deferred income and provisions.
capital ReservesReserves identified for specific purposes. These reserves cannot be distributed to shareholders in the form of dividends. It consists of Revaluation Reserve arising from the revaluation of properties owned by the Company.
carbon dioxide (co2)A heavy, atmospheric gas that does not support combustion.
carbon FootprintA measure of the impact human activities have on the environment in terms of the amount of green house gases produced, measured in units of carbon dioxide.
carbon offsetA way of counteracting the carbon emitted when the use of fossil fuel causes greenhouse gas emissions. Offsets commonly involve investing in projects such as renewable energy, tree planting and energy efficient projects.
cash equivalentsLiquid investments with original maturity periods of three months or less.
colombo consumers’ Price index - (ccPi)Measure of the average price of consumer goods and services purchased by households, determined by measuring a standard group of goods and services meant to represent the typical basket of goods of a working class urban consumer. The percentage change in the CCPI is a measure of inflation.
contingent LiabilitiesA condition or situation at the Balance Sheet date of which the financial effect will be determined only on the occurrence, or non-occurrence of one or more uncertain future events.
corporate GovernanceThe process by which cooperates are governed. It is concerned how power is exercised over management, the direction of the entity, supervision of executive action and accountabilities to share holders and others.
current RatioCurrent assets divided by current liabilities.
debt/equity RatioRatio between long-term interest bearing borrowings and shareholders’ equity.
deferred TaxationThe net effect on items which have been included in the Income Statements, which would only qualify for inclusion on a tax return at a future date.
dividend coverProfit attributable to ordinary shareholders divided by dividend. This measures the number of times dividend is covered by distributable profit.
dividend Pay out RatioThe percentage of earnings paid to shareholders in dividends.
dividend Per share (dPs)The dividend per share is the total dividends to ordinary shareholders during a specific period divided by the number of ordinary shares outstanding.
dividend yieldThe yield a company pays out to its shareholders in the form of dividends.
eBiTEarnings before interest and tax.
eBiTdAEarnings before interest, taxes, depreciation and amortisation.
economic value Added (evA)A measure of productivity which takes into consideration cost of total invested equity.
effective Rate of TaxProvision for tax excluding deferred tax, divided by net profit before tax.
energy/Water conservationPractices and strategies that are designed to minimise the amount of energy and water used.
earnings Per share (ePs)Profit attributable to equity holders of the Company divided by weighted average number of ordinary shares in issue.
ePs GrowthPercentage of increase in the EPS over the previous year.
equal PayA concept that states that individuals doing the same work should receive the same remuneration regardless of their sex, race, sexuality, nationality or anything else. Example of practical application: inquire at facility about outstanding union grievances.
equityShareholders’ funds.
exchange Gain/LossThe increase/decrease in value of foreign currency denominated assets and liabilities when converted to or realised/settled in local currency during the year.
Fair valueThe amount for which an asset could be exchanged or liability settled between knowledgeable willing parties in an arms length transactions.
Financial Leverage A measure of how an entity used its debt capital to finance its assets, calculated as total assets divided by total shareholders’ equity.
GuaranteesThree party agreement involving promise by one party, the Guarantor to fulfil the obligation of a person owing a debt if that person failed to perform.
GearingLong-term interest bearing borrowings to equity.
General ReserveReserves available for distributions and investment.
Greenhouse GasA gas which contributes to the greenhouse effect by absorbing solar radiation. These gases include, but are not limited to, carbon dioxide, ozone, methane, and chlorofluorocarbons.
Gross domestic Product - GdPThe value of all goods and services produced domestically in an economy during a specified period, usually a year. Nominal GDP, adjusted for inflation, gives GDP in real terms.
Gross dividendThe portion of profit including tax withheld, distributed to shareholders.
Gross Profit RatioThe percentage of gross profit to net turnover.
human RightsThe basic rights and freedoms to which all humans are entitled regardless of race, nationality, or membership of any particular social group.
impairmentThis occurs when recoverable amount of an asset is less than its carrying amount.
interest coverThis indicates the ability of an entity to cover long-term and short-term interest expenses with EBIT. This is calculated as EBIT divided by interest expenses on long-term and short-term borrowings.
Key Performance indicators (KPi)Quantifiable measurements, agreed to before hand that reflect the critical success factors of a company.
market value Per shareThe price at which an ordinary share can be traded in the stock market.
market capitalisationThe number of ordinary shares issued, multiplied by the market price of each share at a given date.
materialityThe principle that Financial Statements should separately disclose items which are significant enough to affect evaluation or decision of users.
G lo s sA rY A P P e n d i c e s
share information 237 our Her itage 243 Group structure 246 Awards 247 country report 248 Glossary 253

D I E S E L & M OTO R E N G I N E E R I N G P L C
A N N U A L R E P O RT 2 0 1 1 / 1 2254
net Assets Per shareShareholders’ funds divided by the weighted average number of ordinary shares in issue.
net Profit marginNet profit as a percentage of net turnover.
noise emissionMachine-created environmental noise that disrupts the activity or balance of human or animal life.
Price earning RatioMarket price of a share divided by earnings per share as reported at that date.
RecyclingThe collection of waste materials and reprocessing them into new materials or products.
Related PartiesParties who could control or significantly influence the financial and operating policies of the business.
Return on Average capital employed (Roce)Reflects the returns that an entity received from its capital. Profit before tax plus net interest cost divided by average capital employed.
Return on equity (Roe)Net Profit as a percentage of shareholders’ equity.
Revenue ReservesReserves available for distribution to shareholders and investments.
Rights issueThe raising of new capital by granting existing shareholders the right to subscribe to new shares in proportion to their current holdings. These shares are normally issued at a discount on their market price.
segmentA Business Unit that is a distinguishable component of the Group and engaged in similar operations.
stated capitalConsists of issued and paid capital.
substance over FormWhether the accounting treatment in the Financial Statements of transactions reflect the financial reality and substance, rather than the legal form of the transaction and event which underlies them.
strategyA course of action, including the specification of resources required, to achieve a specified objective.
sustainabilityMeeting the needs of the present without compromising the ability of future generations to meet their own needs.
stakeholderStakeholder is the term referring to persons or group whose interests are interlined with those of a company in a variety of ways.
Total shareholder ReturnRepresents the change in share value of a listed company over a period of time (typically 1 year), plus dividends, expressed as a percentage of the opening share value.
Turnover Per employeeConsolidated turnover of the Company for the year divided by the number of employees at the year end.
United nations Global compactA strategic policy initiative for business that are committed to aligning their operations and strategies with ten universally accepted principles in the areas of human right, labour, environment and anti-corruption.
Unrealised GainA profit that results from holding on to an asset rather than cashing it in and using the funds.
value AddedValue added is the wealth created by the operations of the Group. The value is distributed among the employees, shareholders, as financing cost, to the Government by way of taxes and the balance retained within the business.
Weighted Average cost of capitalCalculation of the cost of capital according to the capital (debt/equity) structure.
Working capitalCapital required to finance the day-to-day operations computed as the excess of current assets over current liabilities.
A P P e n d i c e s G lo s sA rY
Awards 247 country report 248 Glossary 253 Independent Assurance Statement on the Non-Financia l Report ing 255

D I E S E L & M OTO R E N G I N E E R I N G P L C
A N N U A L R E P O RT 2 0 1 1 / 1 2255
introduction
Det Norske Veritas AS (DNV ) has been commissioned by the management of Diesel & Motor Engineering PLC (or the company) to carry out an assurance engagement on the non financial data (economic, environmental and social indicators) in its Integrated Report 2011 -12 (the report) in its printed format against the Global Reporting Initiative (GRI) 2006 Sustainability Reporting Guidelines Version 3.1 (G3.1) and AccountAbility ’s AA1000 Assurance Standard 2008 [AA1000AS (2008)].
DNV is a global provider of sustainability services, with qualified environmental and social assurance specialists working in over 100 countries. DNV was not involved in the preparation of any statements or data included in the Report except for this Assurance Statement. DNV maintains complete impartiality toward any people interviewed. DNV expressly disclaims any liability or coresponsibility for any decision a person or entity would make based on this Assurance Statement.
The intended users of this assurance statement are the readers of company’s Integrated Report 2011 - 12. The management of Diesel & Motor Engineering PLC is responsible for all information provided in the Report as well as the processes for collecting, analyzing and reporting the information. DNV’s responsibility regarding this verification is to the Diesel & Motor Engineering PLC only and in accordance with the agreed scope of work. The assurance engagement is based on the assumption that the data and information provided to us is complete and true.
The reporting boundary is as set out in the report and during the assurance process; we did not come across limitations to the scope of the assurance engagement. The verification was carried out in April 2012.
scope, boundary and limitations of Assurance
The scope of work agreed upon with the Diesel & Motor Engineering PLC includes verification of the following:
The content of the 2011 - 12 Sustainability report i.e. Review of the policies, initiatives, practices and performance described in the Integrated Report;
Evaluation of the AccountAbility principles and specified information, described below, for a Type 2, moderate level of assurance, in accordance with the requirements of AA1000AS (2008) detailed below:
Information related to company’s sustainability issues, responses, performance data, case studies and underlying systems for the management of such information and data;
Information relating to company’s materiality assessment and stakeholder engagement processes;
Confirm that the Report meets the requirements of the GRI G3.1 for an Application Level A+, as declared by Diesel & Motor Engineering PLC.
The reporting boundary is as set out in the Report, i.e. it covers all business units under Diesel & Motor Engineering PLC; no limitations on the scope of the assurance engagement were encountered during the verification process.
verification methodology
This assurance engagement was planned and carried out in accordance with the AA1000AS (2008) and
the DNV Protocol for Verification of Sustainability Reporting1. The report has been evaluated against the
following criteria:
Adherence to the principles of Inclusivity, Materiality and Responsiveness as set out in the AA1000AS
(2008);the Reliability of specified sustainability performance information, as required for a Type 2 and
moderate level assurance engagement,
1 www.dnv.com/cr
i n d e P e n d e n t A s s u r A n c e stAt e m e n t o n t H e n o n - F i n A n c i A l r e p o rt i n G
A P P e n d i c e s
Gri And Global compact index 258 Gri Appl icat ion level check 259 Alphabet ica l index 260 notice of meet ing 261
D I E S E L & M OTO R E N G I N E E R I N G P L C
A N N U A L R E P O RT 2 0 1 1 / 1 2256
Adherence to the additional principles of Completeness and Neutrality as set out in DNV’s Protocol, and
The principles and requirements of the GRI G3.1 for an application level A+.
As part of the verification we have challenged the sustainability-related statements and claims made in
the report and assessed the robustness of the underlying data management system, information flow and
controls. For example, we have:
Examined and reviewed documents, data and other information made available to us by Diesel & Motor
Engineering PLC.
Visited the Head-Office and site operations at Siyambalape and Colombo (Jetawana Road);
Conducted interviews with key representatives (including data owners and decision-makers from
different divisions and functions) of the company;
Performed sample-based reviews of the mechanisms for implementing the company’s own
sustainability-related policies, as described in the report, and for determining material issues to be
included in the report;
Performed sample-based audits of the processes for generating, gathering and managing the
quantitative and qualitative data included in the report;
Reviewed the process of acquiring information and economic data from the financial data presented in
the certified financial statements.
opportunities for improvement
The following is an excerpt from the observations and opportunities reported back to the management of
Diesel & Motor Engineering PLC. However, these do not affect our conclusions on the report, and they are
indeed generally consistent with the management objectives already in place:
The present objectives and targets are focused on environment and needs to cover the broader
sustainability topics and need to establish long-term and mid-term objective and goals (3-5 years) for
key material aspects;
Implementing a systematic quality assurance procedure for data management will help improve the
reporting process
conclusions
In our opinion, the report is an appropriate representation of the company’s sustainability-related
policies, management systems and performance. We also confirm that the Report meets the content
requirements of the GRI Application Level A+.
We have evaluated the report’s adherence to the following principles on a scale of ‘Good’, ‘Acceptable’ and ‘needs improvement’:
AA1000As (2008) principles
inclusivity: Acceptable. The company engaged with selected stakeholders during the year, through
the channels as listed in the report. The Company has engaged an external organization to conduct the
stakeholder engagement and documented the process;
materiality: Acceptable. The company identifies issues from the stakeholder ’s feedback and expectations;
these are mapped to GRI indicators and prioritized by the sustainability Committee. The relative
materiality of issues which have changed in the reporting period with respect to last year needs to be
explained to further enhance the clarity ;
A P P e n d i c e s i n d e P e n d e n t A s s u r A n c e stAt e m e n t o n t h e n o n - f i n A n c i A l r e P o rt i n G
Awards 247 country report 248 Glossary 253 Independent Assurance Statement on the Non-Financia l Report ing 255

D I E S E L & M OTO R E N G I N E E R I N G P L C
A N N U A L R E P O RT 2 0 1 1 / 1 2257
Responsiveness: Good. We consider that the Company has adequately responded to possible key
stakeholder concerns through its policies and management systems, and this is fairly reflected in the
report within the defined scope and boundary.
Additional Parameters as per dnv’s Protocol
completeness: Acceptable. The report boundary covers the company and its subsidiaries with the
coverage of their operations in Sri Lanka. The company has made disclosures on the performance of
indicators pertaining to key material issues identified and is also committed to improve the disclosures
in future.
neutrality: Acceptable. The company has reported sustainability issues, in a balanced manner, in terms of
content and tone. Challenges and limitations may be stated with commitments to future improvements.
In our opinion, and based on the scope of this assurance engagement, the Diesel & Motor Engineering
PLC Integrated Report 2011 - 2012, provides a fair representation of the Company’s sustainability policies,
objectives, management approach and performance during the reporting year.
In accordance with the AA1000AS (2008) requirements for a Type 2, moderate level assurance
engagement, we conclude that the specified sustainability data and information presented in the Report
is generally reliable. The Report contains data that is measured and estimated and some of the errors in
data compilation, which were attributable to transcription and aggregation, were corrected.
DNV confirms that the Report meets the requirements for GRI application level A+. The core GRI
indicators are responded to either fully or partially, or their omission is explained, with due regard to
the Materiality principle.
For Det Norske Veritas AS
Karthik Ramaswamy Antonio AstoneLead Verifier Global Manager, CR Services
Senior Assessor - Sustainability & Business Excellence Services Det Norske Veritas AS,
Det Norske Veritas AS, India Centro Direzionale Colleoni Palazzo
Sirio 2, Italy.
Chennai, 17th May, 2012.
i n d e P e n d e n t A s s u r A n c e stAt e m e n t o n t h e n o n - f i n A n c i A l r e P o rt i n G A P P e n d i c e s
Gri And Global compact index 258 Gri Appl icat ion level check 259 Alphabet ica l index 260 notice of meet ing 261
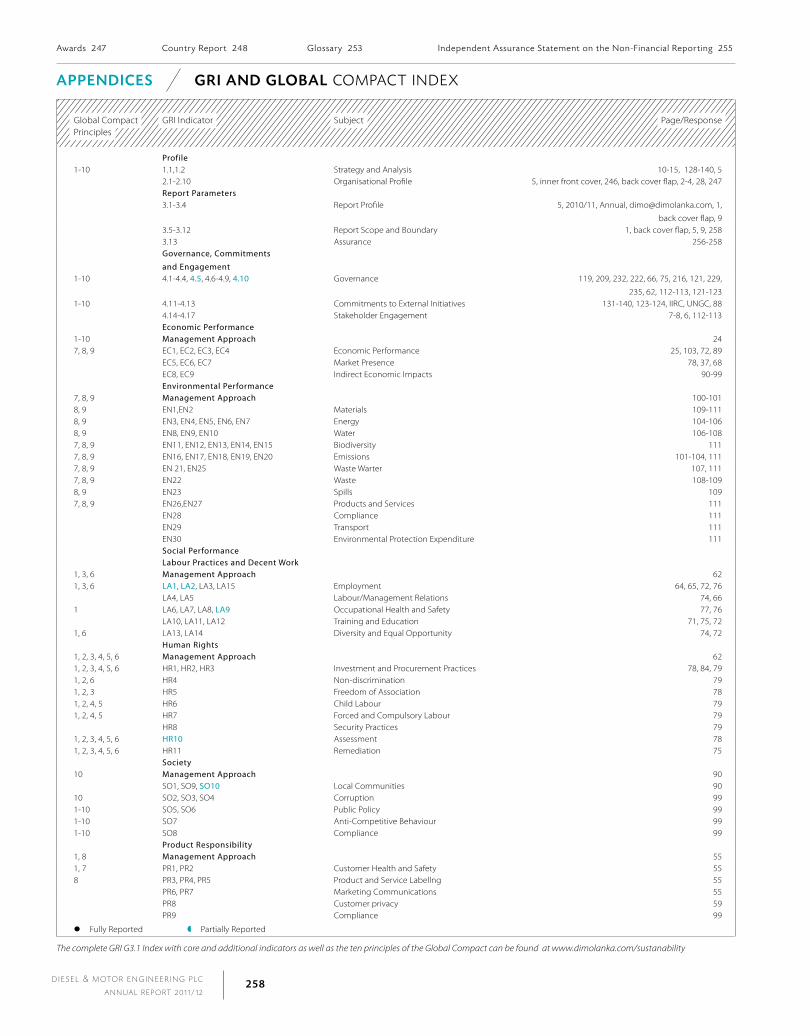
D I E S E L & M OTO R E N G I N E E R I N G P L C
A N N U A L R E P O RT 2 0 1 1 / 1 2258
Global CompactPrinciples
GRI Indicator Subject Page/Response
Profile1-10 1.1,1.2 Strategy and Analysis 10-15, 128-140, 5
2.1-2.10 Organisational Profile 5, inner front cover, 246, back cover flap, 2-4, 28, 247Report Parameters3.1-3.4 Report Profile 5, 2010/11, Annual, [email protected], 1,
back cover flap, 93.5-3.12 Report Scope and Boundary 1, back cover flap, 5, 9, 2583.13 Assurance 256-258Governance, Commitments
and Engagement1-10 4.1-4.4, 4.5, 4.6-4.9, 4.10 Governance 119, 209, 232, 222, 66, 75, 216, 121, 229,
235, 62, 112-113, 121-1231-10 4.11-4.13 Commitments to External Initiatives 131-140, 123-124, IIRC, UNGC, 88
4.14-4.17 Stakeholder Engagement 7-8, 6, 112-113Economic Performance
1-10 Management Approach 247, 8, 9 EC1, EC2, EC3, EC4 Economic Performance 25, 103, 72, 89
EC5, EC6, EC7 Market Presence 78, 37, 68EC8, EC9 Indirect Economic Impacts 90-99Environmental Performance
7, 8, 9 Management Approach 100-1018, 9 EN1,EN2 Materials 109-1118, 9 EN3, EN4, EN5, EN6, EN7 Energy 104-1068, 9 EN8, EN9, EN10 Water 106-1087, 8, 9 EN11, EN12, EN13, EN14, EN15 Biodiversity 1117, 8, 9 EN16, EN17, EN18, EN19, EN20 Emissions 101-104, 1117, 8, 9 EN 21, EN25 Waste Warter 107, 1117, 8, 9 EN22 Waste 108-1098, 9 EN23 Spills 1097, 8, 9 EN26,EN27 Products and Services 111
EN28 Compliance 111EN29 Transport 111EN30 Environmental Protection Expenditure 111Social Performance Labour Practices and Decent Work
1, 3, 6 Management Approach 621, 3, 6 LA1, LA2, LA3, LA15 Employment 64, 65, 72, 76
LA4, LA5 Labour/Management Relations 74, 661 LA6, LA7, LA8, LA9 Occupational Health and Safety 77, 76
LA10, LA11, LA12 Training and Education 71, 75, 721, 6 LA13, LA14 Diversity and Equal Opportunity 74, 72
Human Rights1, 2, 3, 4, 5, 6 Management Approach 621, 2, 3, 4, 5, 6 HR1, HR2, HR3 Investment and Procurement Practices 78, 84, 791, 2, 6 HR4 Non-discrimination 791, 2, 3 HR5 Freedom of Association 781, 2, 4, 5 HR6 Child Labour 791, 2, 4, 5 HR7 Forced and Compulsory Labour 79
HR8 Security Practices 791, 2, 3, 4, 5, 6 HR10 Assessment 781, 2, 3, 4, 5, 6 HR11 Remediation 75
Society10 Management Approach 90
SO1, SO9, SO10 Local Communities 9010 SO2, SO3, SO4 Corruption 991-10 SO5, SO6 Public Policy 991-10 SO7 Anti-Competitive Behaviour 991-10 SO8 Compliance 99
Product Responsibility1, 8 Management Approach 551, 7 PR1, PR2 Customer Health and Safety 558 PR3, PR4, PR5 Product and Service Labellng 55
PR6, PR7 Marketing Communications 55PR8 Customer privacy 59PR9 Compliance 99
Fully Reported Partially Reported
The complete GRI G3.1 Index with core and additional indicators as well as the ten principles of the Global Compact can be found at www.dimolanka.com/sustanability
A P P e n d i c e s G r i A n d G lo BA l co m pAc t i n D e x
Awards 247 country report 248 Glossary 253 independent Assurance statement on the non-Financia l report ing 255

D I E S E L & M OTO R E N G I N E E R I N G P L C
A N N U A L R E P O RT 2 0 1 1 / 1 2259
G r i A P P l i c At i o n l e v e l c H ec k A P P e n d i c e s
Gri And Global compact index 258 GRI Appl icat ion Level Check 259 Alphabet ica l index 260 notice of meet ing 261
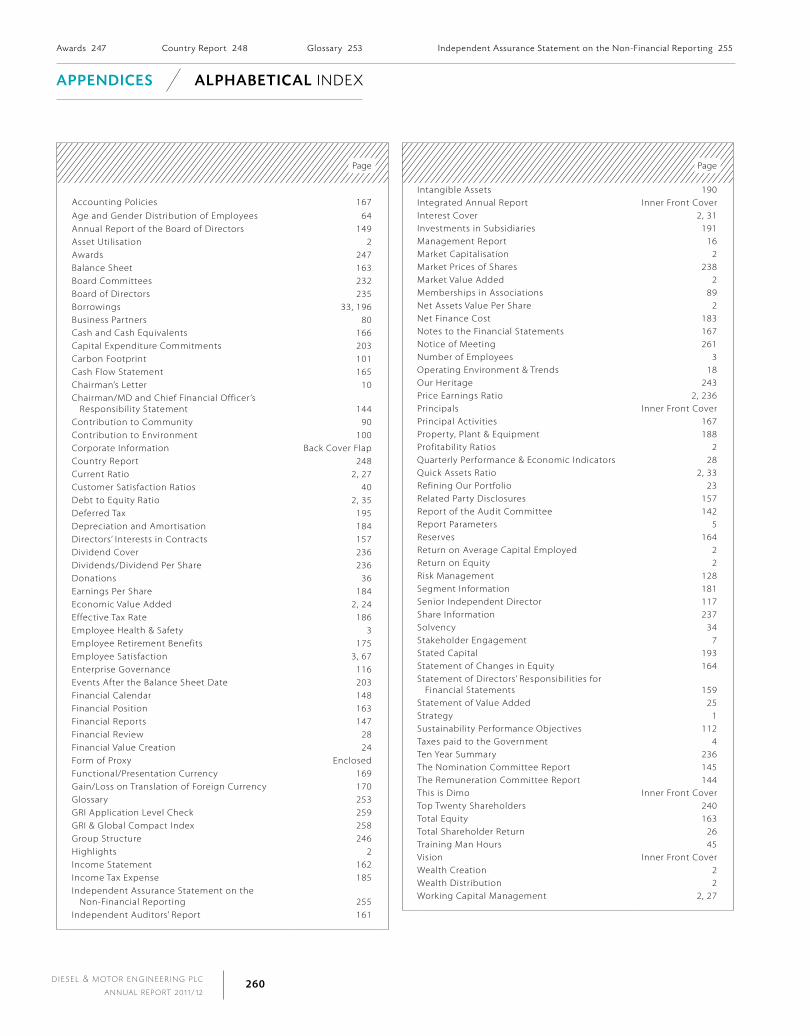
D I E S E L & M OTO R E N G I N E E R I N G P L C
A N N U A L R E P O RT 2 0 1 1 / 1 2260
Page
Accounting Policies 167Age and Gender Distribution of Employees 64Annual Report of the Board of Directors 149Asset Utilisation 2Awards 247Balance Sheet 163Board Committees 232Board of Directors 235Borrowings 33, 196Business Partners 80Cash and Cash Equivalents 166Capital Expenditure Commitments 203Carbon Footprint 101Cash Flow Statement 165Chairman’s Letter 10Chairman/MD and Chief Financial Officer ’s Responsibility Statement 144Contribution to Community 90Contribution to Environment 100Corporate Information Back Cover FlapCountry Report 248Current Ratio 2, 27Customer Satisfaction Ratios 40Debt to Equity Ratio 2, 35Deferred Tax 195Depreciation and Amortisation 184Directors’ Interests in Contracts 157Dividend Cover 236Dividends/Dividend Per Share 236Donations 36Earnings Per Share 184Economic Value Added 2, 24Effective Tax Rate 186Employee Health & Safety 3Employee Retirement Benefits 175Employee Satisfaction 3, 67Enterprise Governance 116Events After the Balance Sheet Date 203Financial Calendar 148Financial Position 163Financial Reports 147Financial Review 28Financial Value Creation 24Form of Proxy EnclosedFunctional/Presentation Currency 169Gain/Loss on Translation of Foreign Currency 170Glossary 253GRI Application Level Check 259GRI & Global Compact Index 258Group Structure 246Highlights 2Income Statement 162Income Tax Expense 185Independent Assurance Statement on the Non-Financial Reporting 255Independent Auditors’ Report 161
Page
Intangible Assets 190Integrated Annual Report Inner Front CoverInterest Cover 2, 31Investments in Subsidiaries 191Management Report 16Market Capitalisation 2Market Prices of Shares 238Market Value Added 2Memberships in Associations 89Net Assets Value Per Share 2Net Finance Cost 183Notes to the Financial Statements 167Notice of Meeting 261Number of Employees 3Operating Environment & Trends 18Our Heritage 243Price Earnings Ratio 2, 236Principals Inner Front CoverPrincipal Activities 167Property, Plant & Equipment 188Profitability Ratios 2Quarterly Performance & Economic Indicators 28Quick Assets Ratio 2, 33Refining Our Portfolio 23Related Party Disclosures 157Report of the Audit Committee 142Report Parameters 5Reserves 164Return on Average Capital Employed 2Return on Equity 2Risk Management 128Segment Information 181Senior Independent Director 117Share Information 237Solvency 34Stakeholder Engagement 7Stated Capital 193Statement of Changes in Equity 164Statement of Directors’ Responsibilities for Financial Statements 159Statement of Value Added 25Strategy 1Sustainability Performance Objectives 112Taxes paid to the Government 4Ten Year Summary 236The Nomination Committee Report 145The Remuneration Committee Report 144This is Dimo Inner Front CoverTop Twenty Shareholders 240Total Equity 163Total Shareholder Return 26Training Man Hours 45Vision Inner Front CoverWealth Creation 2Wealth Distribution 2Working Capital Management 2, 27
A P P e n d i c e s A l P h A B et i c A l i n D e x
Awards 247 country report 248 Glossary 253 independent Assurance statement on the non-Financia l report ing 255

D I E S E L & M OTO R E N G I N E E R I N G P L C
A N N U A L R E P O RT 2 0 1 1 / 1 2261
NOTICE IS HEREBY GIVEN that the Sixty-Seventh Annual General Meeting of Diesel & Motor
Engineering PLC will be held at the Registered Office of the Company, No. 65, Jetawana Road,
Colombo 14, on Friday, 29th June 2012 at 10.00 a.m. and the business to be brought before the
meeting will be:
Agenda
1. To consider and adopt the Report of the Directors and the Statement of Accounts for the year
ended 31st March 2012, with the Report of the Auditors thereon.
2. To re-elect Mr. A.N. Algama, who retires by rotation in terms of Article 66 of the Articles of
Association as a Director of the Company.*
3. To re-elect Mr. S.C. Algama, who retires by rotation in terms of Article 66 of the Articles of
Association as a Director of the Company.*
4. To re-elect Prof. U.P. Liyanage, who retires by rotation in terms of Article 66 of the Articles of
Association as a Director of the Company.*
5. To re-elect Mr. A.M. Pandithage, who retires by rotation in terms of Article 66 of the Articles of
Association as a Director of the Company.*
6. To reappoint Messrs KPMG as Auditors to the Company for the ensuing year and to authorise the
Board of Directors to determine their remuneration.
7. To authorise the Directors to determine contributions to charities.
* The profiles of the Directors proposed for re-election are given on page 235 of the Annual Report.
NOTE
A member is entitled to appoint a proxy to attend and vote instead of himself/herself and a proxy need not be a member of the Company. A Form of Proxy is enclosed for this purpose. The instrument appointing a proxy must
be deposited at the Registered Office, No. 65, Jetawana Road, Colombo 14, not less than forty-eight hours before the
time fixed for the Meeting.
By Order of the Board,
Diesel & Motor Engineering PLCCompany Registration No. PQ-146
B.C.S.A.P. GooneratneSecretary
Colombo
30th May 2012
n ot i c e o F m e e t i n G A P P e n d i c e s
Gri And Global compact index 258 Gri Appl icat ion level check 259 Alphabet ica l index 260 notice of meet ing 261


D I E S E L & M OTO R E N G I N E E R I N G P L C
A N N U A L R E P O RT 2 0 1 1 / 1 2263
I/We, ...................................................................................................................................................................................................................................................
of .........................................................................................................................................................................................................................................................
being a member/members of DIESEL & MOTOR ENGINEERING PLC hereby appoint:
1. ................................................................................................................................................................................................................................................... of
........................................................................................................................................................................................................................................................
Holder of NIC No. ................................................................................................................................... or failing him/them.
2. ASOKA RANJITH PANDITHAGE (Chairman of the Company) of Colombo or, failing him, one of the Directors of the Company as
my/our proxy to vote as indicated hereunder for me/us and on my/our behalf at the Sixty-Seventh Annual General Meeting
of the Company to be held on Friday, 29th June 2012 and at every poll which may be taken in consequence of the aforesaid
meeting and at any adjournment thereof.
For Against1. To consider and adopt the Report of the Directors and the Statement of Accounts for the
year ended 31st March 2012, with the Report of the Auditors thereon.
2. To re-elect Mr. A.N. Algama, who retires by rotation at the Annual General Meeting, a Director.
3. To re-elect Mr. S.C. Algama, who retires by rotation at the Annual General Meeting, a Director.
4. To re-elect Prof. U.P. Liyanage who retires by rotation at the Annual General Meeting, a Director.
5. To re-elect Mr. A.M. Pandithage who retires by rotation at the Annual General Meeting, a Director.
6. To reappoint Messrs KPMG as Auditors and authorise the Directors to determine their
remuneration.
7. To authorise the Directors to determine contributions to charities.
The proxy may vote as he/she thinks fit on any other resolution brought before the meeting.
Dated this ....................................................... day of ................................................... 2012.
Witness:
...................................................
...................................................
..........................................................
Signature of Shareholder
1. A proxy need not be a member of the Company.
2. Instructions to fill the Form of Proxy (please see overleaf ).
f o r m o f p rox Y
D I E S E L & M OTO R E N G I N E E R I N G P L C
A N N U A L R E P O RT 2 0 1 1 / 1 2264
instructions as to completion
1. To be valid this Form of Proxy must be deposited at the Registered Office, No. 65, Jetawana Road,
Colombo 14, not less than 48 hours before the time appointed for the holding of the meeting.
2. In perfecting the Form of Proxy please ensure that all details are legible.
3. If you wish to appoint a person as your proxy, please insert the relevant details overleaf and initial
against this entry.
4. Please indicate with a ‘X’ in the spaces provided how your proxy is to vote on each resolution. If
no indication is given the proxy in his/her discretion will vote as he/she thinks fit. Please delete if
you do not wish your proxy to vote as he/she thinks fit on any other resolution brought before the
meeting.
5. In the case of a company/corporation, the proxy must be under its common seal which should be
affixed and attested in the manner prescribed by its Articles of Association.
6. In the case of a proxy signed by an Attorney, the Power of Attorney must be deposited at the
registered office for registration.
f o r m o f P rox Y

Business Segment Principals Represented Performance Highlights of the Year Outlook for 2012/13
Vehicles
Passenger cars, SUV and a range of commercial vehicles from small 750kg trucks to large 40 Ton+ trucks to tippers and buses.
Number of vehicles sold and turnover increased by 65% and 32% respectively. TATA passenger vehicle sales increased by 16 times mainly on account of the launch of the TATA Nano. TATA commercial vehicles increased market share from 43 to 50% of the brand new commercial vehicles segment. Heavy/medium commercial vehicles sales increased by 115% while light and small commercial vehicles sales increased by 37%. Mercedes-Benz, Chrysler and Jeep performed below expectations.
Recent upward revision of tariffs and duties together with the upward movement in exchange rates could challenge sales, particularly of our high end products. We nevertheless continue to invest on strengthening infrastructure and reach. Particular emphasis is on increasing our customer contact points. Overall, we remain cautiously optimistic.
Vehicle Parts & Service
Parts for the after-care markets of passenger vehicles, commercial vehicles and construction machinery including a range of Original Equipment Manufacturers‘ (OEM) parts. Engine management systems, vehicle accessories, tyres and services.
Sales of TATA as well as OEM parts increased by 34% and 17% respectively, while sales of Mercedes-Benz, Chrysler and Jeep parts dropped by 14% and sales of Bosch parts dropped by 7%. Tyre sales performed below expectation owing to poor supplies. Growth momentum in vehicle service continued during the year with Vehicle Service Hours Sold rising sharply from 118,430 to 208,768 along with Vehicle Throughput rising from 22,392 to 45,281.
The investments currently underway to upgrade and expand our service and repair facilities, the rapid increase in the vehicle population in recent years, and the expansion of our Dimo outlets plus dealer network augurs well for growth in this division. The new brand of tyres, ‘KHUMO’, the tyre retail service and repair centres to be launched during the year and the increase in the tyre dealer network should improve tyre sales.
Lighting & Power Tools
A wide range of lamps, lighting fittings, lighting equipment and systems, tailor-made lighting design service and energy audits, industrial and domestic Power Tools.
Sales were adversely affected due to non-availability of CFL lamp supplies. Bosch power tools recorded a 38% increase in sales, retaining market leadership with a 36% share of the branded market. Growth in the construction sector, focus on the end user, enhancing our island-wide authorised dealer network and a 90% availability of spare parts contributed to this growth. Lighting business unit systems were certified to provide LEED consultancy.
Opening up of markets in the North and East, growth in hotels and construction sectors as well as our own expansion of the distribution network should turn a worthwhile result.
Construction, Agricultural & Material Handling Machinery
Construction and mining equipment, compaction and road building machinery, concrete machinery, fluid management systems, tractors, agri implements, forklifts, storage and racking systems, building cleaning and maintenance systems, aerial work platforms, parking systems and harvesters.
Market leadership status in heavy machinery and equipment that Komatsu rose to last year was retained in the year under review. However, downscaling of Komatsu forklift operation by the principal led to a loss of market share in the forklift market. Fluid management systems recorded a 35% increase in turnover owing to several projects that were hitherto on hold coming on stream. The Agri Business witnessed a turnover growth of 4%.
Launch of innovative new products together with the expansion of our regional service network and growth in hotels and construction sectors should enable us to augment our market leading position to drive growth in this sector.
Electromechanical & Biomedical Engineering
Power solutions, building automation systems, fire detection, protection and suppression systems, CCTV and access control systems, public address systems, power systems for marine propulsion and rail traction, industrial refrigeration, and medical equipment.
LEADER MARINE
Highlight of the year was winning the first ever Supervisory Control and Data Acquisition/Distribution Management System (SCADA/DMS) project of the Ceylon Electricity Board. The Country’s largest fire detection project was also awarded to Dimo. Several high profile projects were successfully completed during the year. Medical solutions division recorded a 70% increase in turnover. Power systems division secured an order of 23 locomotive engines although overall performance of this division was below expectations.
With key sectors such as hotels, construction and health-care poised for growth, this division is expected to continue it growth momentum.
T H I S I S D I M O
Diesel & Motor Engineering PLC, better known as Dimo is a public quoted company listed on the Colombo Bourse. Founded in 1939, Dimo
operates across the five business segments shown below through representing several best-in-class Principals. Headquartered in the commercial
capital of Colombo in Sri Lanka, Dimo has an extensive network of sales and after-sales facilities spread throughout the Island and a team of over
1,360 employees. 2011/12 has been a year of exceptional all round performance. These highlights as well as the outlook for the ensuing year are
summarised below:
Our vision is to be the leader in all the businesses we are engaged in, by building a world-class team and partnering with the best in the world, to
deliver, lasting and outstanding value to all our stakeholders.
COnTExT
Strategy 01A 360 Degree View of Highlights of the Year 02
Report Parameters...The Big Picture 05
Chairman’s Letter 10
MAnAGEMEnT REPORT
The Operating Environment...and Trends 18Refining Our Portfolio...and Reinventing Our Future 23Financial Value Creation 24Delivering Value to Customers...and their Value to Us 40Working at Dimo...Enjoyable and Rewarding 62Our Business Partners...A Symbiotic Relationship 80Regulatory Authorities...Playing by the Rules 88Our Community...Live and Let Live 90The Environment...Now and for Generations Yet Unborn 100Sustainability Performance Objectives in 2011/12 112
STEwARdSHiP
Enterprise Governance 116Risk Management 128Chairman/Managing Director and Chief Financial Officer’s Responsibility Statement 141Report of the Audit Committee 142The Remuneration Committee Report 144Report of the Nomination Committee 145
FinAnCiAL REPORTS
Annual Report of the Board of Directors 149Annex to the Annual Report of the Board of Directors 157Statement of Directors’ Responsibilities for the Financial Statements 159Independent Auditors’ Report 161Income Statement 162Balance Sheet 163Statement of Changes in Equity 164Cash Flow Statement 165Notes to wthe Financial Statements 167
APPEndiCES
Annex to Enterprise Governance 206Board of Directors - Profiles 235Ten Year Summary 236Share Information 237Our Heritage 243Group Structure 246Awards 247Country Report 248Glossary 253Independent Assurance Statement on the Non-Financial Reporting 255GRI and Global Compact Index 258GRI Application Level Check 259Alphabetical Index 260Notice of Meeting 261Form of Proxy Enclosed

Name of the CompanyDiesel & Motor Engineering PLC
Registered O�ceP.O. Box 339,
No. 65, Jetawana Road,
Colombo 14, Sri Lanka.
Telephone: +94-11-2449797,
+94-11-2338883
www.dimolanka.com
E-mail: [email protected]
Facsimile: +94-11-2449080
Legal FormA public limited company
incorporated in 1945 under the Laws
of the Democratic Socialist
Republic of Sri Lanka. The Company
was re-registered under the
Companies Act No. 07 of 2007
on 9th May 2008.
Company Registration Number
PQ 146
Founded
1939
Accounting Year End31st March
Tax Payer Identi�cation Number (TIN)104002498
Stock Exchange ListingThe ordinary shares of the Company
are listed with the Colombo Stock
Exchange of Sri Lanka.
AuditorsKPMG
Chartered Accountants,
No. 32 A, Sir Mohamed Macan
Markar Mawatha, Colombo 3,
Sri Lanka.
Internal AuditorsSJMS Associates
Chartered Accountants
No. 2, Castle Street, Colombo 4,
Sri Lanka.
LawyersF.J. & G. De Saram & Company
Attorneys-at-Law
No. 216, De Saram Place,
Colombo 10, Sri Lanka.
BankersBank of Ceylon
Commercial Bank of Ceylon PLC
Citibank
DFCC Vardhana Bank
Hatton National Bank PLC
Hongkong & Shanghai Banking Corporation Ltd.
Nations Trust Bank PLC
NDB Bank PLC
People’s Bank
Sampath Bank PLC
Company SecretaryB.C.S.A.P. Gooneratne, F.C.A.,
M.B.A. (Sri J.)
Company RegistrarsCorporate Services Ltd.
No. 216, De Saram Place,
Colombo 10, Sri Lanka
Corporate information
Our Second Integrated Annual Report
Our first , last year, turned out to be the first for Asia as well . Heartened by the overwhelming
response from al l our stakeholders, we made yet another attempt. We have once again
structured this Annual Report based on our eight strategic imperatives; Highlights of the Year,
Management Report, Enterprise Governance Report and Risk Management Report
i l lustrate and discuss our position and response in holding true to them. As much
as this is a Report about Dimo’s duties of responsible trusteeship, faithful stewardship and
uncompromising accountabil ity, it is also a Report of Dimo’s drivers of value; or as we cal l it ,
a Report of Dimo’s f inancial capital and intel lectual capital .
as integrated as Dimo ...
(Detailed contents are given on inner back cover �ap)