name: taylor franklin€¦ · web viewthe ‘profitability ratios’ do not feature a major...
TRANSCRIPT

Assignment Stage 2 (ASS#3) Ratio Analysis and Capital Budgeting
Name: Taylor Franklin - https://taylorfranklinblog.wordpress.com/
Due Date: 11:00am Monday 6th June, 2016
Company: RCR Tomlinson
1 | P a g e
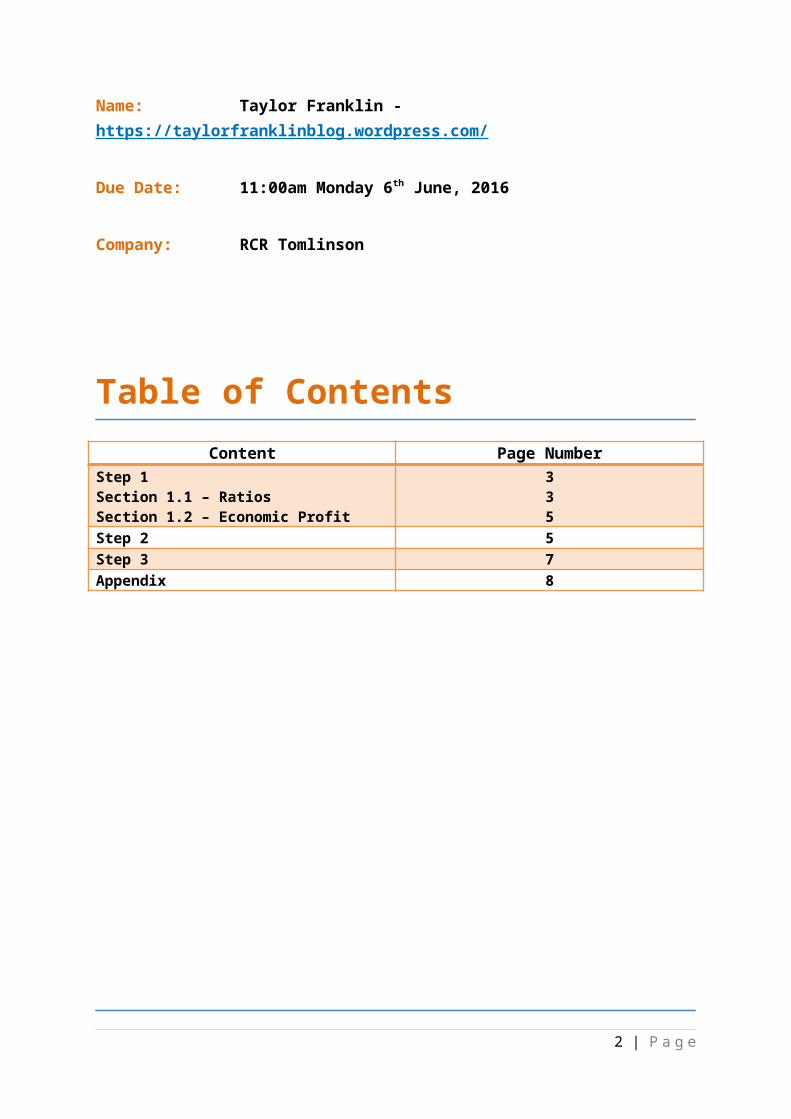
Table of Contents
Content Page NumberStep 1Section 1.1 – RatiosSection 1.2 – Economic Profit
335
Step 2 5Step 3 7Appendix 8
2 | P a g e

Step 1
Section 1.1 - RatiosMy firm’s ratios are included in a separate excel file.
What does my firm’s ratios tell me (or not tell me) about how well my firm is performing?The ‘Profitability Ratios’ do not feature a major difference between the ‘Net Profit Margin’ and the ‘return on assets,’ however both are a profit. The return on assets, which is larger, is used as an indicator of how profitable a firm is in relation to its total assets and it also gives an idea on how efficient management is at using its assets to generate earnings, which is evidently very efficient. On the other hand, the net profit margin shows how much of each dollar earned by the company is translated into profits, which is all of them since they are a positive number.
The ‘Efficiency (or Asset Managements) Ratios’ which consist of ‘Days of Inventory’ and ‘Total Asset Turnover Ratio’ differ greatly from each other since the days of inventory is a negative (loss) number and the total asset turnover ratio is exceedingly high. The days of inventory is a financial measure of a company's performance that gives investors an idea of how long it takes a firm to turn its inventory into sales, which my firm has not been doing well at but have been getting closer to a positive number as the years go on. On the other hand, the total asset turnover can be used as an indicator of the efficiency a firm is deploying its assets in generating revenue, which evidently my firm has been doing exquisitely, however the percentage has consistently been lowering from 2012 to 2015.
The ‘liquidity Ratios’ which features the ‘current ratio’ is very high but is very inconsistent between 2015 and 2012. The current ratio measures a firm’s ability to pay short-term and long-term obligations, which as you can see my firm also does very well.
The ‘Financial Structure Ratios’ features the ‘Debt/Equity Ratio’ and the ‘Equity Ratio’ which are both a high positive number. The debt/equity ratio is consistently higher than the equity ratio, however the percentages for both ratios between 2012 and 2015 are inconsistent across the years. The debt/equity ratio is used to measure a company's financial leverage, which my firm is clearly doing well. The equity ratio is self-explanatory and my company is creating a generous amount of equity for the shareholders.
3 | P a g e

Next is the ‘Market Ratios’ which consists of ‘Earnings per Share,’ ‘Dividends per Share’ and ‘Price Earnings Ratio.’ All three ratios apart from the dividends per share are a relatively high positive percentage. However all three ratios feature a similarity that they all have increased from 2012 to 2015. Earnings per share ultimately serves as an indicator of a company's profitability, which since my firms ratio is a positive means they are making a profit and the price earnings ratio measures my companies current share price relative to its per-share earnings, which my firm is also accomplishing a profit in. On the other hand dividends per share is the sum of declared dividends for every ordinary share issued, which means that my firm has paid out more dividends over a year than the number of outstanding ordinary shares which as you can see, equals a loss and unfortunately this percentage has decreasing since 2012.
Lastly is the ‘Ratios Based on Reformulated Financial Statements’ which consists of 5 ratios:
‘Return on Equity:’ This ratio is a low positive percentage, however it is still a profit. Also, the percentages are inconsistent with no patterns between 2012 and 2015. This measures a firms profitability by revealing how much profit a company generates with the money shareholders have invested, which my firm has done well by having a profit not a loss.
‘Return on Net Operating Assets:’ This ratio is also a low positive percentage and has had a large increase in 2015, however the percentages across the time period show no pattern. This is an indicator of how effectively a firm is using its assets to generate earnings before tax, which my firm has been doing very well.
‘Net Borrowing Cost:’ is the average interest rate the firm is paying on its financing. My firms ratios shows that the percentage has consistently been increasing from 2012 to 2015 which has a very large increase.
‘Profit Margin:’ After subtracting all of a firms expenses, this ratio is what is left which is a profit. This measures how much out of every dollar of sales a company actually keeps in earnings which shows that my firm is very effective at maintaining a profit between 2012 and 2015.
‘Asset Turnover:’ This ratio is a huge percentage across all four years, however 2015 is the largest as it is for all other ratios because the firm is improving its way of increasing profits and minimizing losses. This is an indicator of the efficiency with which a company is deploying its assets in generating revenue, which my firm is doing extremely well in doing.
4 | P a g e

Section 1.2 – Economic ProfitMy firm’s economic profits are included in a separate excel file. Also, 10% has been used as my firm’s ‘cost of capital’ when calculating the economic profit.
Notes:The Key Drivers of my firm’s past economic profit are:
- Return on Net Operating Assets (RNOA)- Cost of Capital - Net Operating Assets (NOA)
The key accounting drivers of RNOA are:- Profit Margin (PM)- Asset Turnover (ATO)
What is driving or causing my firm’s economic profit over the past four years to be at the levels it is?According to Investor Words economic profit is the amount left after subtracting all costs of a firm from the total incomes. The economic profit measures both the financial status of the firm, and the effectiveness of the firm's decision-making strategies. As you can see below, from 2012 to 2015 there are incredibly large profits which means that my firm has been very wise throughout the financial years. This is because of the very high profit percentage of the return on net operating assets (RNOA), cost of capital and net operating assets (NOA) which are all key drivers of economic profit. Also, backing up the RNOA is the very high profit percentages of the profit margin (pm) and asset turnover (ATO). The economic profit for 2015 is 3x the size of the economic profit for 2012 because the firm is becoming wiser with how they spend money, save money and minimize losses.
What insights have I gained by breaking into bits my firms financial statements?I have gained a very interesting insight into my firm which has helped me come to the conclusion that financially my firm is doing very well and they will continue to become wiser as the years go on.
What insights have I not gained?The insights that I have not gained through the ratios is the individual aspects that create a loss in my firm for the dividends per share and the days of inventory which are the only two negatives featured in all the ratios. I would like to know what are the contributors to this loss.
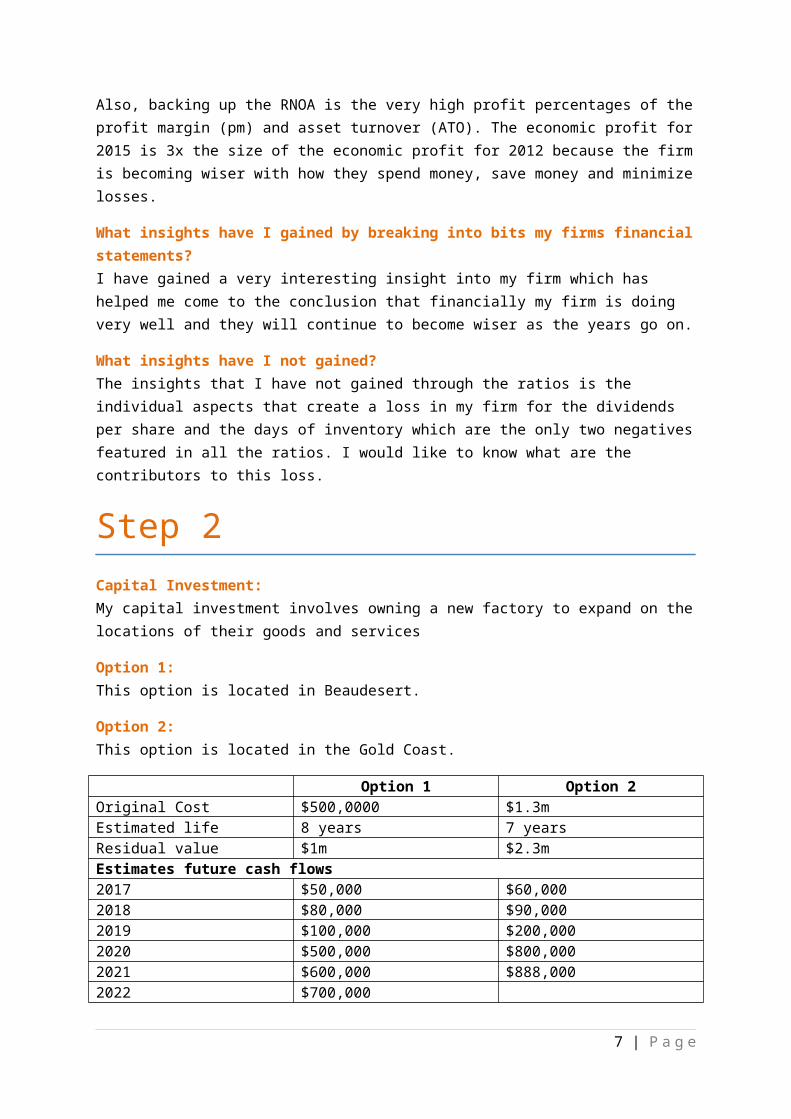
Step 2Capital Investment:My capital investment involves owning a new factory to expand on the locations of their goods and services
5 | P a g e

Option 1:This option is located in Beaudesert.
Option 2:This option is located in the Gold Coast.
Option 1 Option 2Original Cost $500,0000 $1.3mEstimated life 8 years 7 yearsResidual value $1m $2.3mEstimates future cash flows2017 $50,000 $60,0002018 $80,000 $90,0002019 $100,000 $200,0002020 $500,000 $800,0002021 $600,000 $888,0002022 $700,000
Thought process in coming to my recommendation:After using the IRR (Internal Rate of Return) and NPV (Net Present Value) for option 1 and option 2 the possible profits became clear which evidently showed that in 5 years option 1 would make more money than option 2 would make in 6 years which makes option 2 the more appealing recommendation. This option would also bring new employment opportunities as the Gold Coast is the fastest growing city in Australia especially with the Commonwealth Games coming up. Also because of the densely populated location of the Gold Coast, it has the potential to attract more business since more people would see the factory and it is within a good driving distance to everything since it is just off the highway. The only negative about this option is that because of how densely populated the Gold Coast is, it would be limiting to how much the factory could expand. Ultimately, the higher the investments internal rate of return is, the more desirable it is to undertake.
Strengths and weaknesses of my analysis:The strengths of my analysis is that the IRR and NVP show the potential yearly profits and ultimate selling profit which is the most important factor in deciding on a investment. The weaknesses of my analysis is that it doesn’t reveal the potential costs of each option which also plays a major role in deciding on an investment.
6 | P a g e
Step 3Feedback to:
Feedback from: Taylor Franklin (https://taylorfranklinblog.wordpress.com/)
Step My CommentsStep 1:Calculation of ratiosRatios – Commentary (Blog)Calculate economic profitCommentary – drivers of economic profit (blog)Step 2:Develop capital investment decision for your firmCalculation of payback period, NPV and IRRRecommendation and discussionStep 3:Individual feedback with other studentsOverall ASS#3
Feedback to:
Feedback from: Taylor Franklin (https://taylorfranklinblog.wordpress.com/)
Step My CommentsStep 1:
7 | P a g e

Calculation of ratiosRatios – Commentary (Blog)Calculate economic profitCommentary – drivers of economic profit (blog)Step 2:Develop capital investment decision for your firmCalculation of payback period, NPV and IRRRecommendation and discussionStep 3:Individual feedback with other studentsOverall ASS#3
Appendix
BibliographyInvestopedia, 2016, Investopedia, viewed 2nd June 2016 <https://index.investopedia.com>Investor Words, 2016, Economic Profit, viewed 2nd June 2016 <http://www.investorwords.com/16392/economic_profit.html>
Definitions'Return On Assets - ROA' Return on assets (ROA) is an indicator of how
profitable a company is relative to its total assets. ROA gives an idea as to how efficient management is at using its assets to generate earnings. Calculated by dividing a company's annual earnings by its total assets, ROA is displayed as a percentage. Sometimes this is referred to as "return on investment".
'Net Profit Margin' Net margin is the ratio of net profits to revenues for a company or business segment - typically expressed as a percentage – that shows how much of each dollar earned by the company is translated into profits.
'Days Sales Of Inventory - DSI' The days sales of inventory value, or DSI, is a financial measure of a company's performance that gives investors an idea of how long it takes a company to turn its inventory (including goods that are a work in progress, if applicable) into sales. Generally, a lower (shorter) DSI is preferred, but it is important to note that the average DSI varies from one industry to another.
'Asset Turnover Ratio' Asset turnover ratio is the ratio of the value of a company’s sales or revenues generated
8 | P a g e

relative to the value of its assets. The Asset Turnover ratio can often be used as an indicator of the efficiency with which a company is deploying its assets in generating revenue.
'Current Ratio' The current ratio is a liquidity ratio that measures a company's ability to pay short-term and long-term obligations. To gauge this ability, the current ratio considers the current total assets of a company (both liquid and illiquid) relative to that company’s current total liabilities.
'Debt/Equity Ratio' Debt/Equity Ratio is a debt ratio used to measure a company's financial leverage, calculated by dividing a company’s total liabilities by its stockholders' equity. The D/E ratio indicates how much debt a company is using to finance its assets relative to the amount of value represented in shareholders’ equity.
'Earnings Per Share - EPS' Earnings per share (EPS) is the portion of a company's profit allocated to each outstanding share of common stock. Earnings per share serves as an indicator of a company's profitability.
'Price-Earnings Ratio - P/E Ratio' The price-earnings ratio (P/E Ratio) is the ratio for valuing a company that measures its current share price relative to its per-share earnings.
'Dividend Per Share - DPS' Dividend per share (DPS) is the sum of declared dividends for every ordinary share issued. Dividend per share (DPS) is the total dividends paid out over an entire year (including interim dividends but not including special dividends) divided by the number of outstanding ordinary shares issued.
'Return On Equity - ROE' Return on equity (ROE) is the amount of net income returned as a percentage of shareholders equity. Return on equity measures a corporation's profitability by revealing how much profit a company generates with the money shareholders have invested.
'Return On Total Assets - ROTA' Return on total assets (ROTA) is a ratio that measures a company's earnings before interest and taxes (EBIT) against its total net assets. The ratio is considered an indicator of how effectively a company is using its assets to generate earnings before contractual obligations must be paid.
‘Net Borrowing Cost – NBC’ is the average interest rate the firm is paying on its financing
'Profit Margin' Profit margin is part of a category of
9 | P a g e

profitability ratios calculated as net income divided by revenue, or net profits divided by sales. Net income or net profit may be determined by subtracting all of a company’s expenses, including operating costs, material costs (including raw materials) and tax costs, from its total revenue. Profit margins are expressed as a percentage and, in effect, measure how much out of every dollar of sales a company actually keeps in earnings. A 20% profit margin, then, means the company has a net income of $0.20 for each dollar of total revenue earned.
'Asset Turnover Ratio' Asset turnover ratio is the ratio of the value of a company’s sales or revenues generated relative to the value of its assets. The Asset Turnover ratio can often be used as an indicator of the efficiency with which a company is deploying its assets in generating revenue.
‘Economic Profit’ The amount remaining after subtracting from the total income of a company the total monetary cost of all business activities, as well as the opportunity cost of profits that could have been made by investing resources in alternative business activities. The economic profit measures both the financial status of the firm, and the effectiveness of the firm's decision-making strategies.
10 | P a g e