names date. agenda (do we need this?) decide on this after we finish the presentation
TRANSCRIPT

NamesDate
Agenda (Do we need this?)Decide on this after we finish the
presentation
Introduction / HookHousing market crash headlinesRecent news about banks having inadequate
housing modelsVikas’ executive summary introPossibly chart showing rapid decline in US
housing pricesPossibly a timeline of significant events in time
=> Motivation / Idea: Need better housing models!
SolutionThe need for better/good housing modelsTim’s video about what people think=> lack of information => inefficient =>
opportunities for refinement and profit
Project objectives/purpose/usesMortgage-Backed Securities (MBS) valuationHousing market sizeMBS market size => Pie chart??UsesDevelop efficient and robust forecasting
models to understand the housing price process
Predict the evolution of housing prices over medium to long term horizon,
Devise profitable trading strategies
Data Sources and Breakdown(?)Model state-level housing pricesOFHEO HPI
1975-2008 quarterlySingle family units…Other useful/interesting descriptors
Simple returns
MethodologyBuild housing price modelBuild inputs for our forecast
Modeling Approach 2-phase approach in modeling the housing price returns data Time frequency: Monthly
Drift Model Explain the relationship between housing price and
macroeconomic variables Supply and demand equilibrium model
Volatility Model Model the residuals from the drift model to account for extra
sources of volatility (refines the drift model?) Time series techniques
=> Combine the 2-stage models to forecast state-level housing prices for xx-months
Drift Model (format 1)Demand Variables (How to present variables and
metric used – maybe table format??)Unemployment ratePopulation sizeMedian incomeCost of credit / interest rateAvailability of credit => Mortgage originations
Supply VariablesHousing stock => Building permits issuanceForeclosures
Drift Model (Bullet format)Demand Variables
Unemployment ratePopulation sizeMedian incomeCost of credit / interest rateAvailability of credit => Mortgage originations
Supply VariablesHousing stock => Building permits issuanceForeclosures
Volatility ModelGoals/purpose: to explain away period of
high & low volatility (volatility clustering). To account for serial autocorrelations
Univariate time series analysisAutoRegressive-Moving Average
ARMA/GARCH
Overview of Economic VariablesChartsSpecial circumstances?
=> Alternative: Do this after we present our states cause it’s like “Now, let’s look at the inputs to our model?”
=> See slides after the states
Building forecasts (or should we put this after show individual states’ analysis)
Forecast each predictor variable of the drift model
Curve fitting
Or we put the general slide here and go into detail after the individual states’ analysis (i.e. assumptions, charts, etc)
Distribution of statesHeat map (hotpads map or then animation
online)[Trouble/High…] StatesMedium statesStates that are opposite the national trend
=> put these 3 categories of states in a table format?
Geographic segmentation??
FloridaHistorical (non-simple returns) graphBackground information / Current climateOur forecastChallenges / Difficulties to overcome
(curvature hump)Reasons for unusual behavior/trends
CaliforniaHistorical (non-simple returns) graphBackground information / Current climateOur forecastChallenges / Difficulties to overcome
(curvature hump)Reasons for unusual behavior/trends
New YorkHistorical (non-simple returns) graphBackground information / Current climateOur forecastChallenges / Difficulties to overcome
(curvature hump)Reasons for unusual behavior/trends
Middle stateHistorical (non-simple returns) graphBackground information / Current climateOur forecastChallenges / Difficulties to overcome
(curvature hump)Reasons for unusual behavior/trends
Low stateHistorical (non-simple returns) graphBackground information / Current climateOur forecastChallenges / Difficulties to overcome
(curvature hump)Reasons for unusual behavior/trends
Opposite stateHistorical (non-simple returns) graphBackground information / Current climateOur forecastChallenges / Difficulties to overcome
(curvature hump)Reasons for unusual behavior/trends
Inputs to our model – Macroeconomic VariablesOverview
Possibly explain supply and demand economics???
ChartsSpecial events/circumstances
=> This placement is an alternative to discussing this before the states
ForecastingBuilding on forecast relies on assumptions
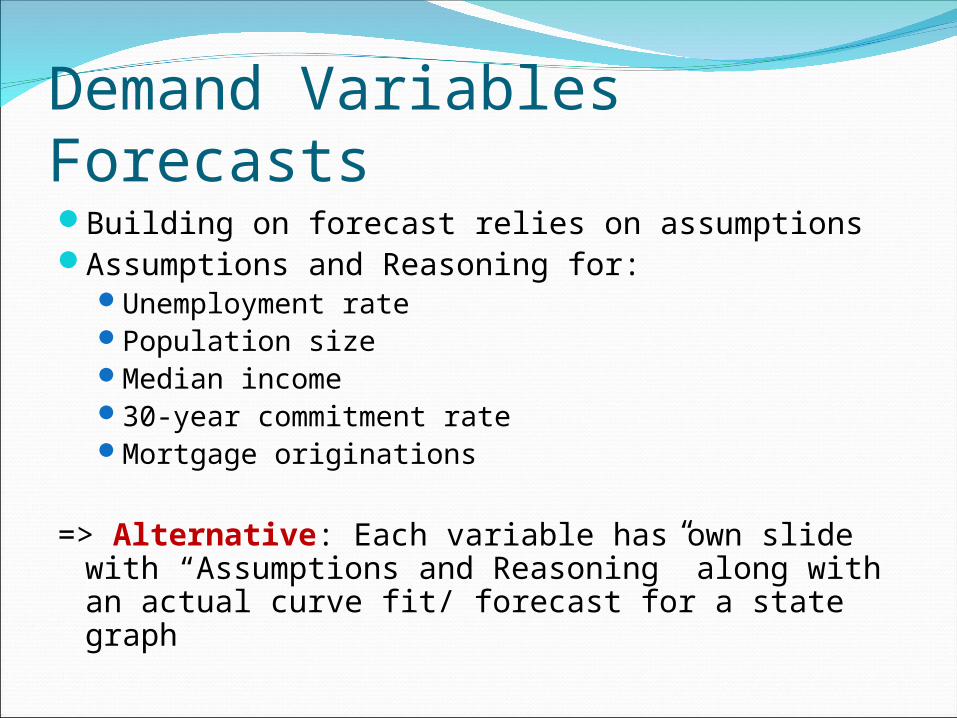
Demand Variables ForecastsBuilding on forecast relies on assumptionsAssumptions and Reasoning for:
Unemployment ratePopulation sizeMedian income30-year commitment rateMortgage originations
=> Alternative: Each variable has own slide with “Assumptions and Reasoning” along with an actual curve fit/ forecast for a state graph
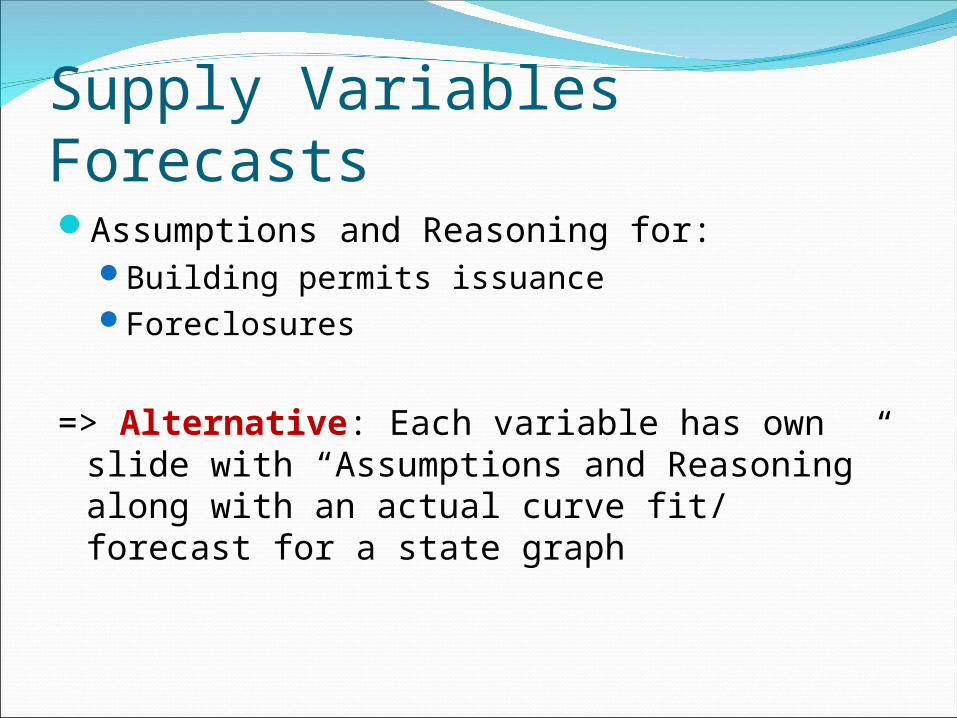
Supply Variables ForecastsAssumptions and Reasoning for:
Building permits issuanceForeclosures
=> Alternative: Each variable has own slide with “Assumptions and Reasoning” along with an actual curve fit/ forecast for a state graph
Volatility ForecastsShould we talk about this?What to talk about?-----
Important Take-awaysConclusionsResults

(Special) Thanks / AcknowledgementsSponsor
Dr. Paul ThurstonAgamas Capital Management (?)Tower Research Capital (?)
AdvisorsDr. David MattesonDr. David Ruppert
Faculty & Staff (???)Dr. Kathryn CaggianoSelene Cammer (=> look up last name)Victoria ____Judy Francis ???

QuestionsShould we put this before or after the special
thanks slide??
AppendixMaybe include here data treatment
Interpolation to monthly Influential points treatment
Any formulas, etc