namibia food & nutrition security...
TRANSCRIPT
Ainfall am
tivtes
FNSM Sentinel Site Maps
TABLE OF CONTENTS:
Page 2: Household Demographics
Page 2: Food Availability
Page 4: Food Access
Page 8: Food Utilization
Page 8: Nutrition Security Indicators
Page 9: Food Security Outlook
Page 9: Recommendations
Bulletin No: 4 OCTOBER 2015
NOVEMBER 2014
Namibia Food & Nutrition
Security Monitoring
Food Market - Omusati (Photo/WFP)
Office of the Prime Minister
Highlights
The 2015/16 seasonal rainfall forecast has been issued against the backdrop of a
strong El Niño phenomenon, which is usually associated with dry conditions in the
SADC region.
Market purchases continue to dominate sources of food across all six pilot regions,
while food prices escalate beyond affordable levels – a cause for concern.
Dietary diversification remains elusive for the majority of poor rural households, resulting in poor food consumption patterns.
Food insecurity conditions worsen as the number of food insecure people increases in most of the assessed regions.
Livestock/maize meal terms of trade remain unfavourable across the regions. This is compromising food access for livestock-based livelihoods.
The MUAC analysis indicates a very low prevalence of malnutrition – 2.6% of screened children were found to be severely acute malnourished (SAM) or moderately acute malnourished (MAM).
Food Security Trends & Vulnerability
Despite the promotion of exclusive breastfeeding from birth to six months, many mothers are still introducing solid foods too early, before the child reaches the age of 6 months.
2
1. 2014/15 SEASONAL RAINFALL PERFORMANCE
The 2015/16 seasonal rainfall forecast was issued against the
backdrop of a strong El Niño phenomenon comparable in
magnitude to the one experienced in the 1997/98 season.
According to the Namibia Meteorological Services, there is a high
chance of the country receiving normal to below-normal rains
during the October 2015 to March 2016 period (Figure 1). This
rainfall prediction is consistent with rainfall levels during El Niño
years which are usually associated with drier than normal
conditions in Southern Africa and the Sahel.
Data Source: Namibia Meteorological Services
2. HOUSEHOLD DEMOGRAPHICS
Fifty-five percent of the sampled households were male headed
with the highest proportion of 60% being registered in the
Omaheke region, followed by Kunene (53%), //Karas (45%),
Zambezi (42%), Omusati (41%) and Ohangwena (36%).
Ohangwena registered the highest proportion of female-headed
households at 64%. No child-headed households were registered
in this survey. Most family members sampled were found to be in
good health. However, the statistics reporting the presence of
chronically ill within households went up from 4% in March to 6%
in October. This needs further investigation to determine the
cause of the increase. The majority of all children of school going
age were found to be enrolled in schools – a situation attributable
to the ongoing school feeding programme which is perceived to
have attracted many children back into the schools.
3. FOOD AVAILABILITY
Availability of maize and mahangu (main cereals) is confirmed to be good by 61% of the interviewed communities, albeit at higher prices than those observed in March 2015. Factors influencing high pricing are high demand on market purchases, unfavourable FOREX exchange rates, increased transport/freight charges, high international commodity prices, etc. With a forecast of poor rainfall this season, these prices are expected to rise further making access even more difficult for low income households - a situation that requires close monitoring.
FINDINGS
(Source: Ministry of Agriculture, Water and Forestry)
Monthly Maize Meal price trends for selected regional markets (Source: NSA)
Most commodity prices were confirmed to have risen above those observed in March 2015 in all six pilot regions. Meanwhile, Ohangwena continues to report erratic supplies of mahangu on local markets – a sign of looming shortages which could negatively impact food access. In September 2015, market purchases dominated the source of cereals at 56% followed by own production (33%) and food assistance (11%). Omaheke continues to register 100% market purchases. For the first time, Zambezi has recorded 100% market purchases due to poor harvests – a situation that needs close monitoring as a significant number of households might already be encountering food access difficulties. 4. 2015/16 AGRICULTURAL PRODUCTION PROSPECTS Although the severity of the impacts of this year’s El Niño is still unknown, agricultural production prospects are quite gloomy with an anticipated El Niño similar in magnitude to that of 1997/98 which left a trail of disaster across the SADC region. Markets are already responding to the forecast models, with some commodity prices, including food, reportedly already increasing. This indicates that an economic impact resulting from meteorological events is to be expected.
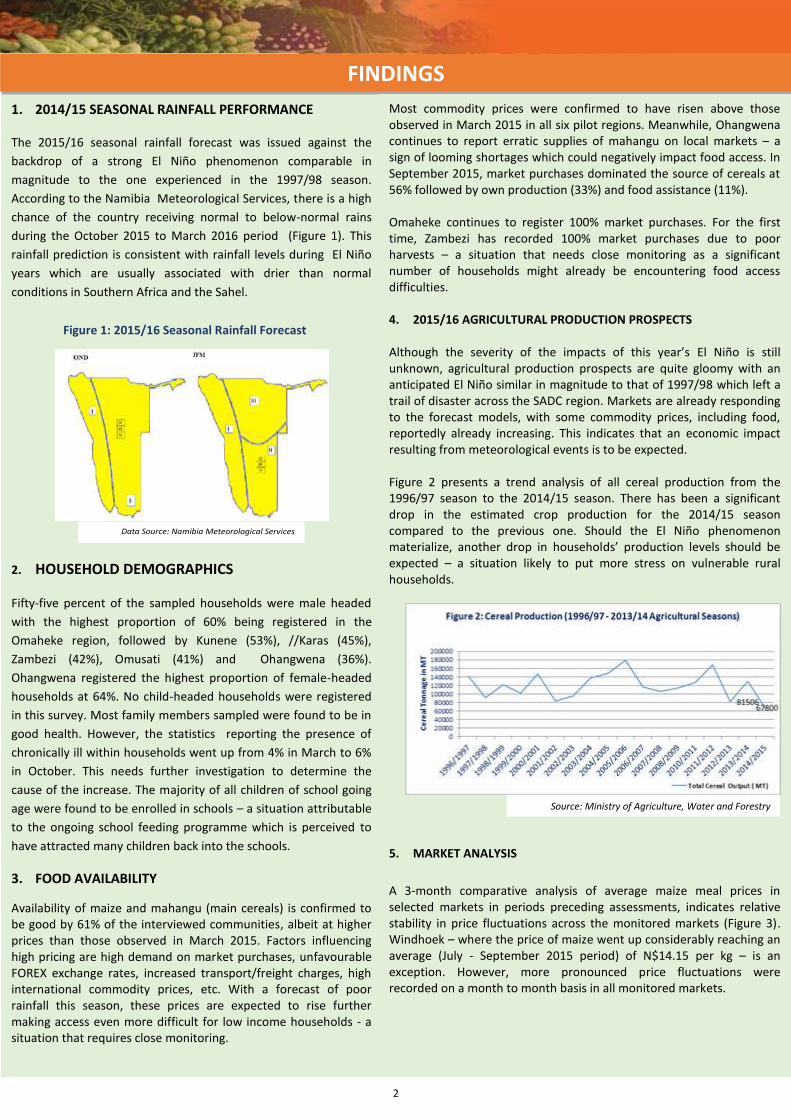
Figure 2 presents a trend analysis of all cereal production from the 1996/97 season to the 2014/15 season. There has been a significant drop in the estimated crop production for the 2014/15 season compared to the previous one. Should the El Niño phenomenon materialize, another drop in households’ production levels should be expected – a situation likely to put more stress on vulnerable rural households.
5. MARKET ANALYSIS
A 3-month comparative analysis of average maize meal prices in selected markets in periods preceding assessments, indicates relative stability in price fluctuations across the monitored markets (Figure 3). Windhoek – where the price of maize went up considerably reaching an average (July - September 2015 period) of N$14.15 per kg – is an exception. However, more pronounced price fluctuations were recorded on a month to month basis in all monitored markets.
Figure 1: 2015/16 Seasonal Rainfall Forecast
Source: Ministry of Agriculture, Water and Forestry

3
However, a three-month comparative analysis (August to October) for 2013, 2014 and 2015 depicts an upward trend in maize meal prices (Figure 4). Although sampled communities attribute the price increases to increasing demand, this could also be market response to international price fluctuations on the SAFEX and US markets. (Data source: NSA websitehttp://www.tradingeconomics.com/namibia/inflation-cpi).
Figures 5-8 show monthly price variations with most prices
following seasonal trends. Windhoek, Mariental, Swakopmund and
Katima Mulilo, where maize meal prices have been on the rise this
year, are exceptions.
Table 1 shows updated commodity price data (March 2015 and October 2015) across sentinel sites in Omaheke, one of the livestock-based regions where most households are dependent on market purchases. Significant food price drops were observed in Aminius and Kalahari. Elsewhere commodity prices increased significantly.
Table 1: Comparison of commodity prices across market (consti tuencies)in Omaheke region
Epukiro Gobabis Kalahari Aminius Otjinene
Mar15 Oct15 % change Mar15 Oct15 % change Mar15 Oct15 % change Mar15 Oct15 % change Mar15 Oct15 % change
Maize
meal/Kg 12 14 17% 6 7 17% 7 7 0% 20 14 -30% 7 8 14%
Sugar/Kg 15 14 -7% 10 19 90% 15 12 -20% 25 25 0% 13 14 8%
Cooking
Oi l (750)
ml 20 20 0% 16 17 6% 25 18 -28% 25 30 20% 18 20 11%
Rice/Kg 17 18 6% 20 16 30 25 -17% 20 27 35%
Fish/Kg 43 25 -42% 20 25 25% 19 15 -21% 19 40 111%
4
6. FOOD ACCESS
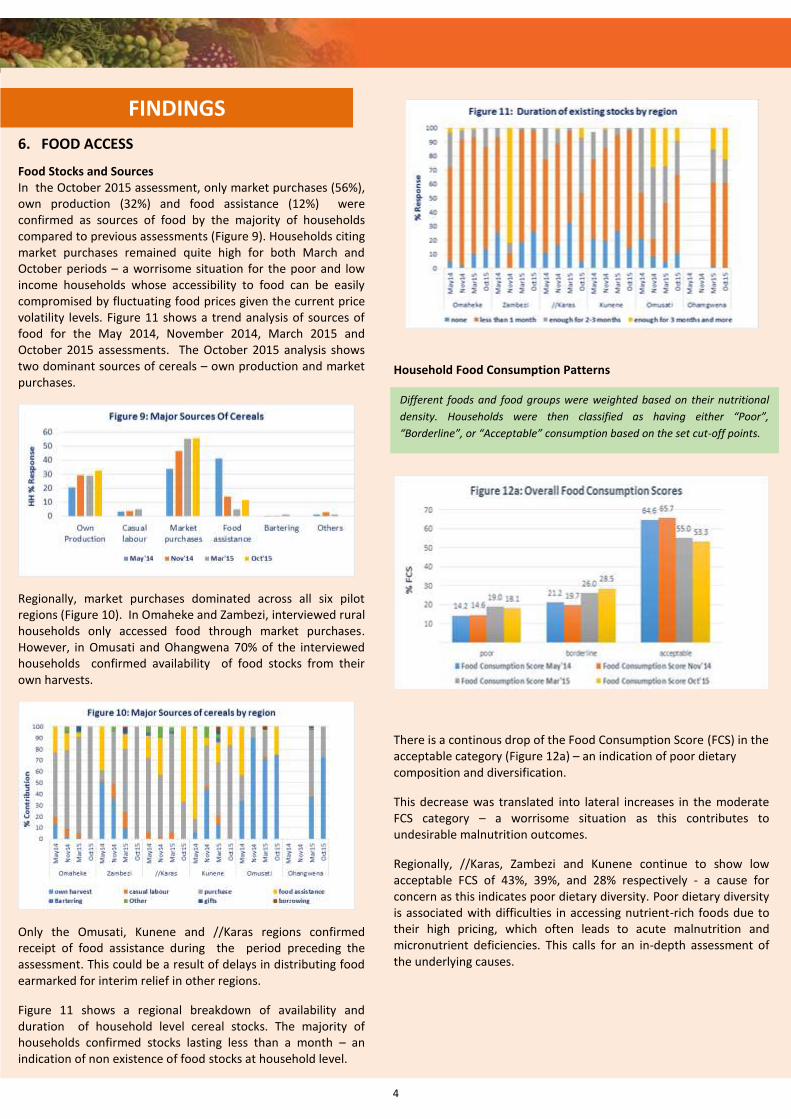
Food Stocks and Sources In the October 2015 assessment, only market purchases (56%), own production (32%) and food assistance (12%) were confirmed as sources of food by the majority of households compared to previous assessments (Figure 9). Households citing market purchases remained quite high for both March and October periods – a worrisome situation for the poor and low income households whose accessibility to food can be easily compromised by fluctuating food prices given the current price volatility levels. Figure 11 shows a trend analysis of sources of food for the May 2014, November 2014, March 2015 and October 2015 assessments. The October 2015 analysis shows two dominant sources of cereals – own production and market purchases.
Regionally, market purchases dominated across all six pilot regions (Figure 10). In Omaheke and Zambezi, interviewed rural households only accessed food through market purchases. However, in Omusati and Ohangwena 70% of the interviewed households confirmed availability of food stocks from their own harvests.
Only the Omusati, Kunene and //Karas regions confirmed receipt of food assistance during the period preceding the assessment. This could be a result of delays in distributing food earmarked for interim relief in other regions.
Figure 11 shows a regional breakdown of availability and duration of household level cereal stocks. The majority of households confirmed stocks lasting less than a month – an indication of non existence of food stocks at household level.
Household Food Consumption Patterns
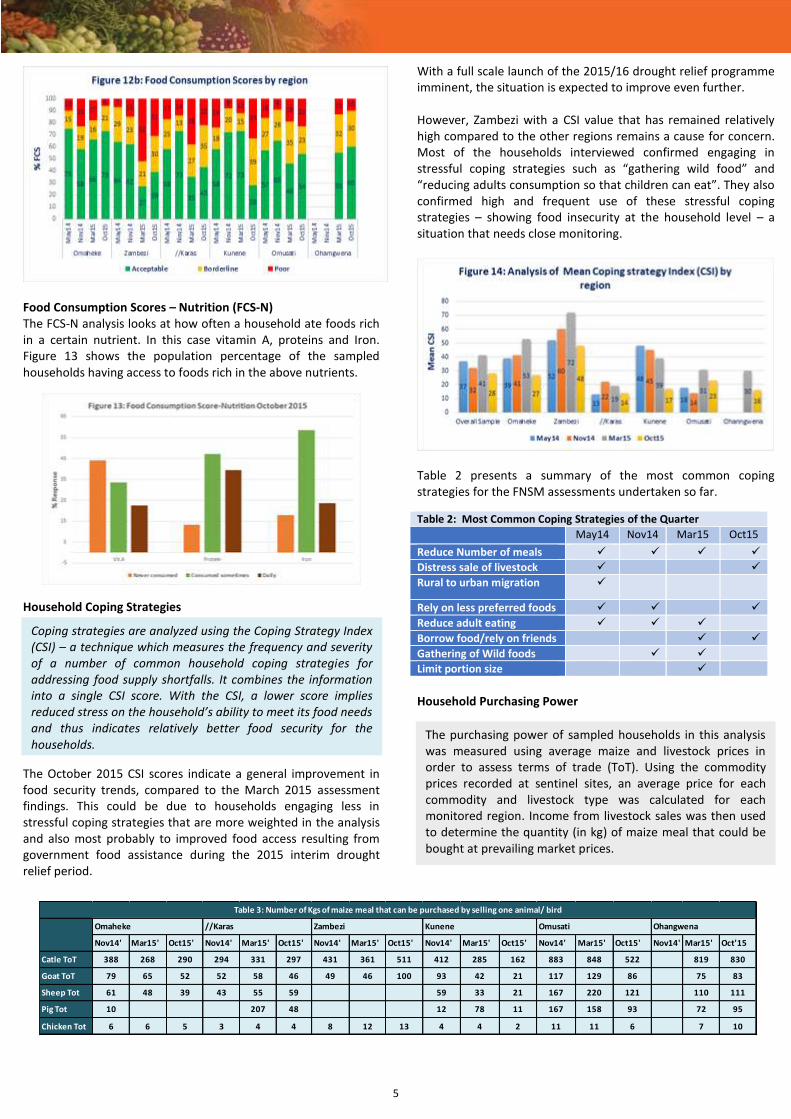
There is a continous drop of the Food Consumption Score (FCS) in the acceptable category (Figure 12a) – an indication of poor dietary composition and diversification.
This decrease was translated into lateral increases in the moderate FCS category – a worrisome situation as this contributes to undesirable malnutrition outcomes.
Regionally, //Karas, Zambezi and Kunene continue to show low acceptable FCS of 43%, 39%, and 28% respectively - a cause for concern as this indicates poor dietary diversity. Poor dietary diversity is associated with difficulties in accessing nutrient-rich foods due to their high pricing, which often leads to acute malnutrition and micronutrient deficiencies. This calls for an in-depth assessment of the underlying causes.
FINDINGS
Different foods and food groups were weighted based on their nutritional
density. Households were then classified as having either “Poor”,
“Borderline”, or “Acceptable” consumption based on the set cut-off points.
5
Food Consumption Scores – Nutrition (FCS-N) The FCS-N analysis looks at how often a household ate foods rich in a certain nutrient. In this case vitamin A, proteins and Iron. Figure 13 shows the population percentage of the sampled households having access to foods rich in the above nutrients.
Household Coping Strategies
The October 2015 CSI scores indicate a general improvement in food security trends, compared to the March 2015 assessment findings. This could be due to households engaging less in stressful coping strategies that are more weighted in the analysis and also most probably to improved food access resulting from government food assistance during the 2015 interim drought relief period.
With a full scale launch of the 2015/16 drought relief programme imminent, the situation is expected to improve even further. However, Zambezi with a CSI value that has remained relatively high compared to the other regions remains a cause for concern. Most of the households interviewed confirmed engaging in stressful coping strategies such as “gathering wild food” and “reducing adults consumption so that children can eat”. They also confirmed high and frequent use of these stressful coping strategies – showing food insecurity at the household level – a situation that needs close monitoring.
Table 2 presents a summary of the most common coping strategies for the FNSM assessments undertaken so far.
Table 2: Most Common Coping Strategies of the Quarter
May14 Nov14 Mar15 Oct15
Reduce Number of meals X X
Distress sale of livestock X X
Rural to urban migration X
Rely on less preferred foods X X X
Reduce adult eating X X X
Borrow food/rely on friends X X
Gathering of Wild foods X X
Limit portion size X
Household Purchasing Power
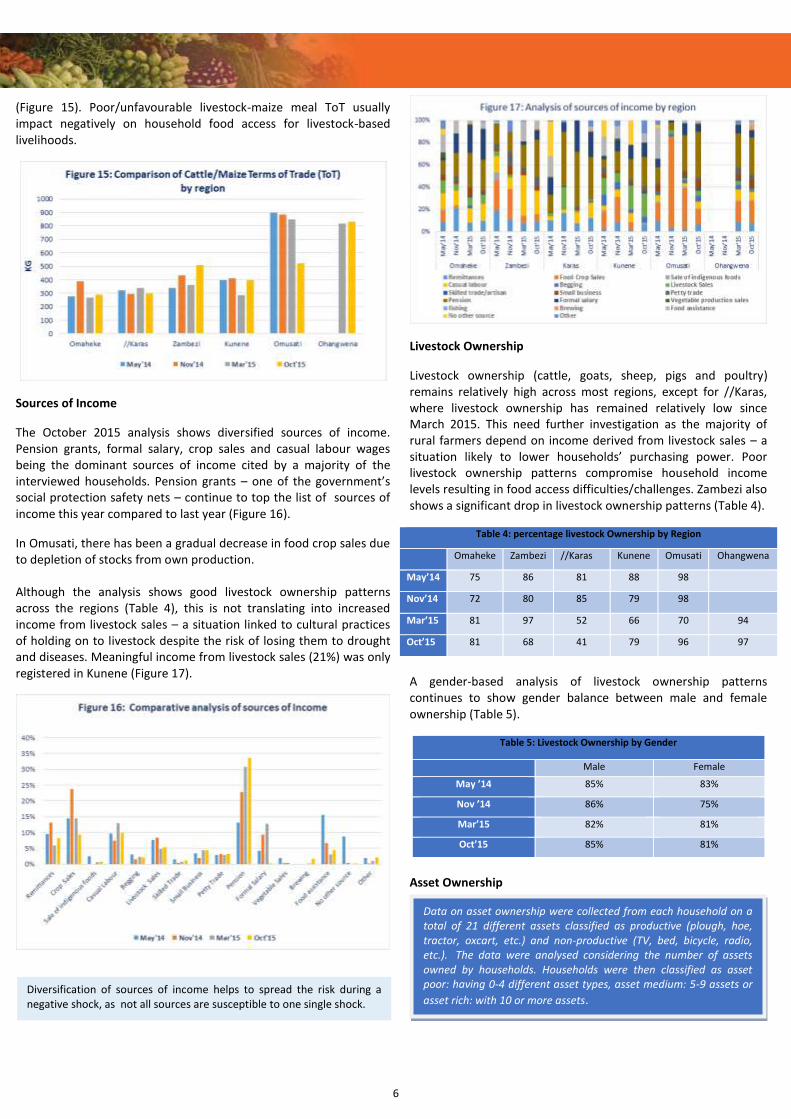
Table 3 shows variations in cattle-maize meal terms of trade (ToT) by region. Cattle-maize meal ToT were most favourable in Ohangwena at 830kgs per animal. //Karas and Omaheke recorded the least cattle-maize meal ToT at around 300 kgs per animal
The purchasing power of sampled households in this analysis was measured using average maize and livestock prices in order to assess terms of trade (ToT). Using the commodity prices recorded at sentinel sites, an average price for each commodity and livestock type was calculated for each monitored region. Income from livestock sales was then used to determine the quantity (in kg) of maize meal that could be bought at prevailing market prices.
Coping strategies are analyzed using the Coping Strategy Index (CSI) – a technique which measures the frequency and severity of a number of common household coping strategies for addressing food supply shortfalls. It combines the information into a single CSI score. With the CSI, a lower score implies reduced stress on the household’s ability to meet its food needs and thus indicates relatively better food security for the households.
Omaheke //Karas Zambezi Kunene Omusati Ohangwena
Nov14' Mar15' Oct15' Nov14' Mar15' Oct15' Nov14' Mar15' Oct15' Nov14' Mar15' Oct15' Nov14' Mar15' Oct15' Nov14' Mar15' Oct'15
Catle ToT 388 268 290 294 331 297 431 361 511 412 285 162 883 848 522 819 830
Goat ToT 79 65 52 52 58 46 49 46 100 93 42 21 117 129 86 75 83
Sheep Tot 61 48 39 43 55 59 59 33 21 167 220 121 110 111
Pig Tot 10 207 48 12 78 11 167 158 93 72 95
Chicken Tot 6 6 5 3 4 4 8 12 13 4 4 2 11 11 6 7 10
Table 3: Number of Kgs of maize meal that can be purchased by selling one animal/ bird
6
(Figure 15). Poor/unfavourable livestock-maize meal ToT usually impact negatively on household food access for livestock-based livelihoods.
Sources of Income
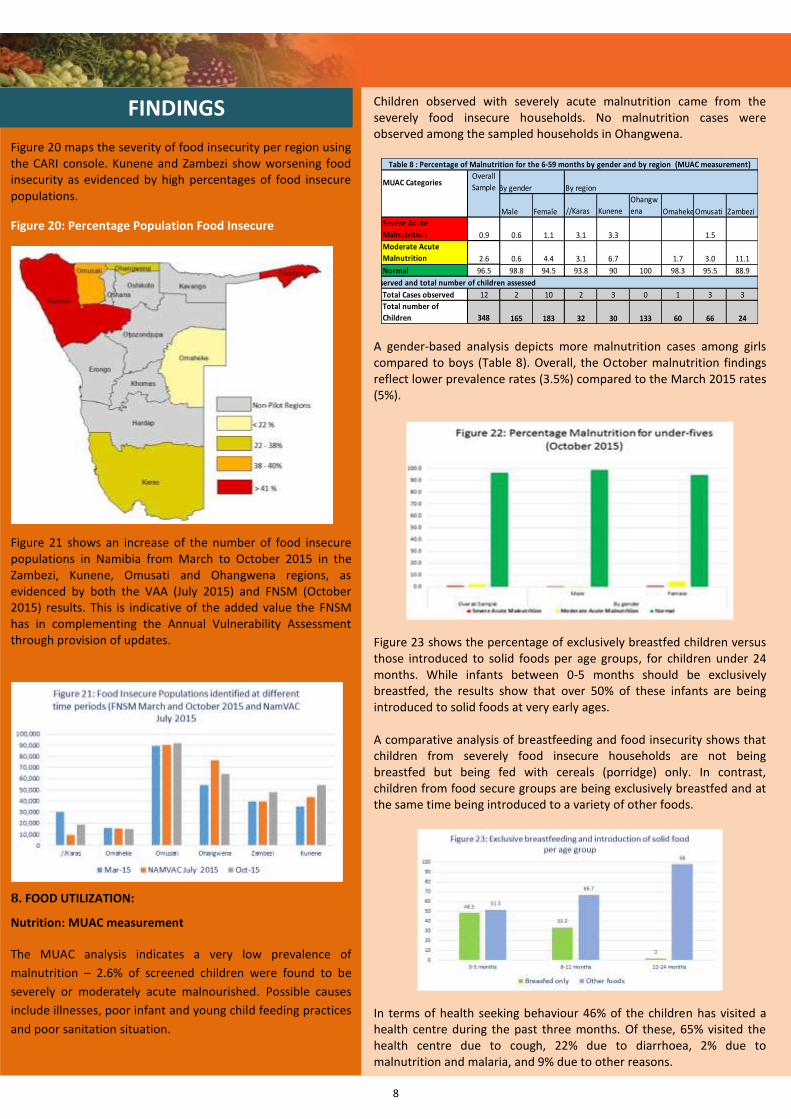
The October 2015 analysis shows diversified sources of income. Pension grants, formal salary, crop sales and casual labour wages being the dominant sources of income cited by a majority of the interviewed households. Pension grants – one of the government’s social protection safety nets – continue to top the list of sources of income this year compared to last year (Figure 16).
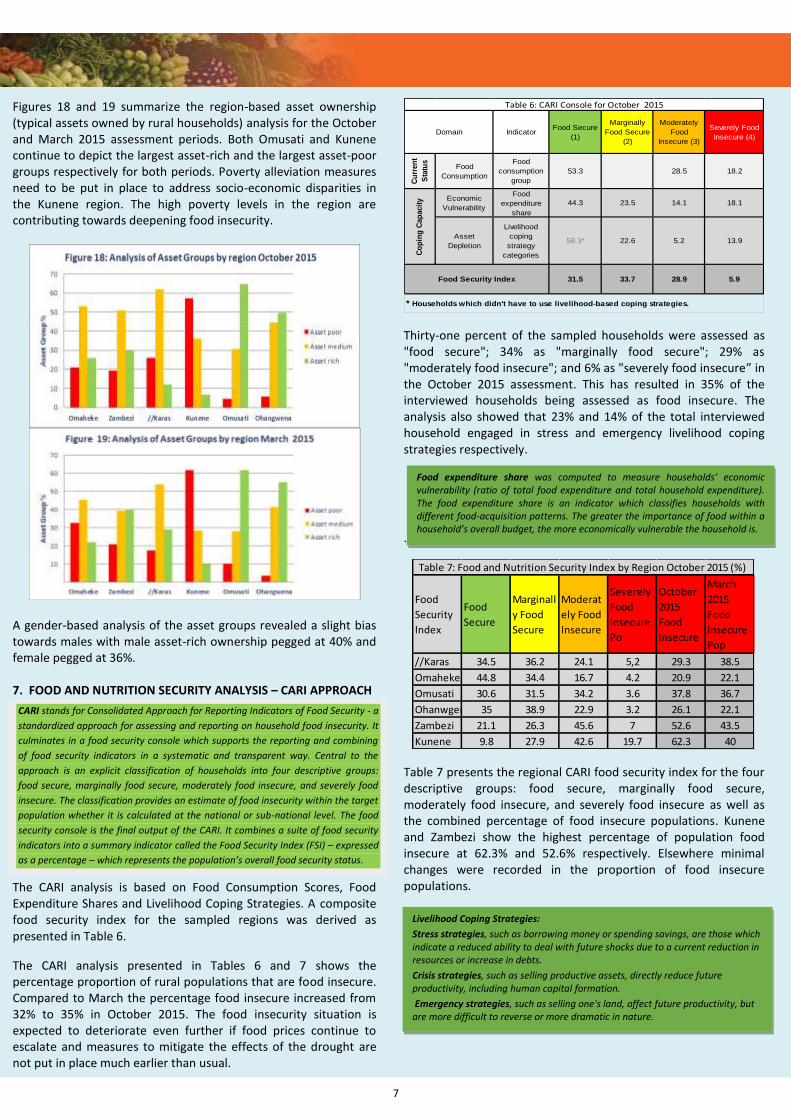
In Omusati, there has been a gradual decrease in food crop sales due to depletion of stocks from own production. Although the analysis shows good livestock ownership patterns across the regions (Table 4), this is not translating into increased income from livestock sales – a situation linked to cultural practices of holding on to livestock despite the risk of losing them to drought and diseases. Meaningful income from livestock sales (21%) was only registered in Kunene (Figure 17).
Livestock Ownership
Livestock ownership (cattle, goats, sheep, pigs and poultry) remains relatively high across most regions, except for //Karas, where livestock ownership has remained relatively low since March 2015. This need further investigation as the majority of rural farmers depend on income derived from livestock sales – a situation likely to lower households’ purchasing power. Poor livestock ownership patterns compromise household income levels resulting in food access difficulties/challenges. Zambezi also shows a significant drop in livestock ownership patterns (Table 4).
Table 4: percentage livestock Ownership by Region
Omaheke Zambezi //Karas Kunene Omusati Ohangwena
May’14 75 86 81 88 98
Nov’14 72 80 85 79 98
Mar’15 81 97 52 66 70 94
Oct’15 81 68 41 79 96 97
A gender-based analysis of livestock ownership patterns continues to show gender balance between male and female ownership (Table 5).
Table 5: Livestock Ownership by Gender
Male Female
May ’14 85% 83%
Nov ’14 86% 75%
Mar’15 82% 81%
Oct’15 85% 81%
Asset Ownership
Diversification of sources of income helps to spread the risk during a negative shock, as not all sources are susceptible to one single shock.
Data on asset ownership were collected from each household on a total of 21 different assets classified as productive (plough, hoe, tractor, oxcart, etc.) and non-productive (TV, bed, bicycle, radio, etc.). The data were analysed considering the number of assets owned by households. Households were then classified as asset poor: having 0-4 different asset types, asset medium: 5-9 assets or
asset rich: with 10 or more assets.
7
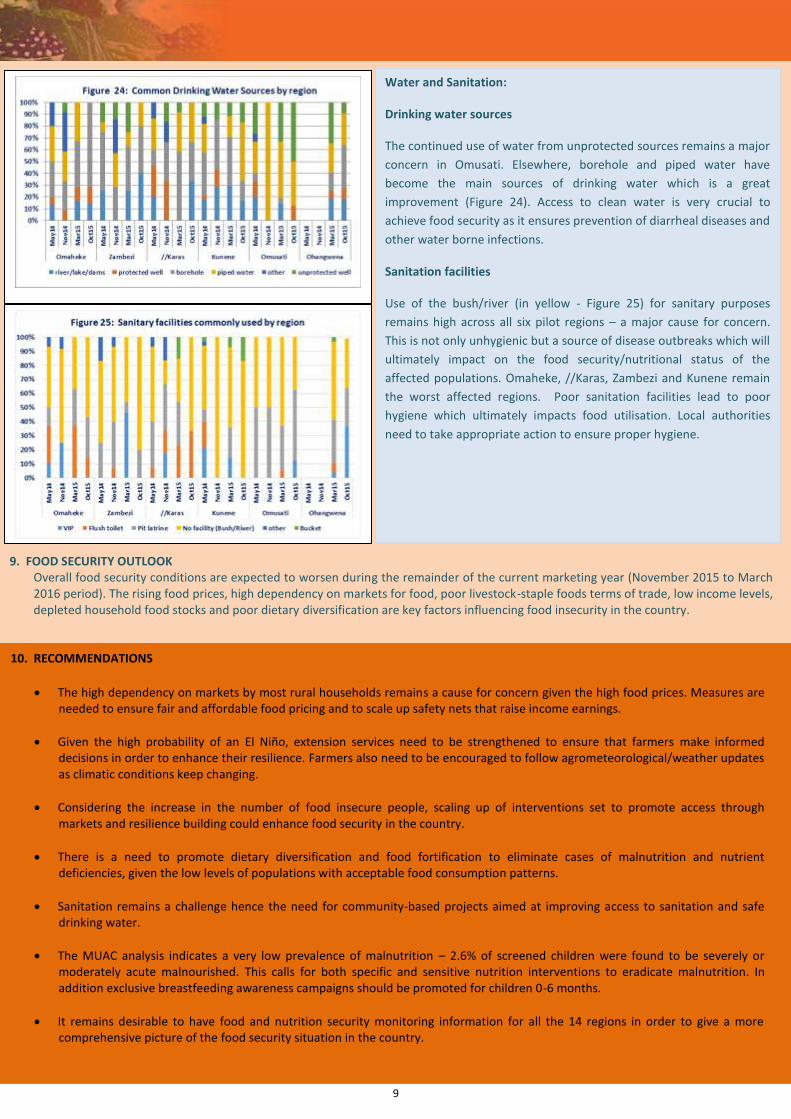
Food Security Index 31.5 33.7 28.9 5.9
* Households which didn't have to use livelihood-based coping strategies.
Table 6: CARI Console for October 2015
Co
pin
g C
ap
acit
y Economic
Vulnerability
Food
expenditure
share
44.3 23.5 14.1 18.1
Asset
Depletion
Livelihood
coping
strategy
categories
58.3* 22.6 5.2 13.9
Domain IndicatorFood Secure
(1)
Marginally
Food Secure
(2)
Moderately
Food
Insecure (3)
Severely Food
Insecure (4)
Cu
rren
t
Sta
tus
Food
Consumption
Food
consumption
group
53.3 28.5 18.2
Thirty-one percent of the sampled households were assessed as "food secure"; 34% as "marginally food secure"; 29% as "moderately food insecure"; and 6% as "severely food insecure” in the October 2015 assessment. This has resulted in 35% of the interviewed households being assessed as food insecure. The analysis also showed that 23% and 14% of the total interviewed household engaged in stress and emergency livelihood coping strategies respectively.
.
Food
Security
Index
Food
Secure
Marginall
y Food
Secure
Moderat
ely Food
Insecure
Severely
Food
Insecure
Po
October
2015
Food
Insecure
March
2015
Food
Insecure
Pop
//Karas 34.5 36.2 24.1 5,2 29.3 38.5
Omaheke 44.8 34.4 16.7 4.2 20.9 22.1
Omusati 30.6 31.5 34.2 3.6 37.8 36.7
Ohanwgena 35 38.9 22.9 3.2 26.1 22.1
Zambezi 21.1 26.3 45.6 7 52.6 43.5
Kunene 9.8 27.9 42.6 19.7 62.3 40
Table 7: Food and Nutrition Security Index by Region October 2015 (%)
Table 7 presents the regional CARI food security index for the four descriptive groups: food secure, marginally food secure, moderately food insecure, and severely food insecure as well as the combined percentage of food insecure populations. Kunene and Zambezi show the highest percentage of population food insecure at 62.3% and 52.6% respectively. Elsewhere minimal changes were recorded in the proportion of food insecure populations.
Figures 18 and 19 summarize the region-based asset ownership (typical assets owned by rural households) analysis for the October and March 2015 assessment periods. Both Omusati and Kunene continue to depict the largest asset-rich and the largest asset-poor groups respectively for both periods. Poverty alleviation measures need to be put in place to address socio-economic disparities in the Kunene region. The high poverty levels in the region are contributing towards deepening food insecurity.
A gender-based analysis of the asset groups revealed a slight bias towards males with male asset-rich ownership pegged at 40% and female pegged at 36%. 7. FOOD AND NUTRITION SECURITY ANALYSIS – CARI APPROACH
The CARI analysis is based on Food Consumption Scores, Food Expenditure Shares and Livelihood Coping Strategies. A composite food security index for the sampled regions was derived as presented in Table 6.
The CARI analysis presented in Tables 6 and 7 shows the percentage proportion of rural populations that are food insecure. Compared to March the percentage food insecure increased from 32% to 35% in October 2015. The food insecurity situation is expected to deteriorate even further if food prices continue to escalate and measures to mitigate the effects of the drought are not put in place much earlier than usual.
CARI stands for Consolidated Approach for Reporting Indicators of Food Security - a
standardized approach for assessing and reporting on household food insecurity. It
culminates in a food security console which supports the reporting and combining
of food security indicators in a systematic and transparent way. Central to the
approach is an explicit classification of households into four descriptive groups:
food secure, marginally food secure, moderately food insecure, and severely food
insecure. The classification provides an estimate of food insecurity within the target
population whether it is calculated at the national or sub-national level. The food
security console is the final output of the CARI. It combines a suite of food security
indicators into a summary indicator called the Food Security Index (FSI) – expressed
as a percentage – which represents the population’s overall food security status.
Livelihood Coping Strategies:
Stress strategies, such as borrowing money or spending savings, are those which indicate a reduced ability to deal with future shocks due to a current reduction in resources or increase in debts.
Crisis strategies, such as selling productive assets, directly reduce future productivity, including human capital formation.
Emergency strategies, such as selling one's land, affect future productivity, but are more difficult to reverse or more dramatic in nature.
Food expenditure share was computed to measure households’ economic vulnerability (ratio of total food expenditure and total household expenditure). The food expenditure share is an indicator which classifies households with different food-acquisition patterns. The greater the importance of food within a household’s overall budget, the more economically vulnerable the household is.
8
Figure 20 maps the severity of food insecurity per region using the CARI console. Kunene and Zambezi show worsening food insecurity as evidenced by high percentages of food insecure populations.
Figure 20: Percentage Population Food Insecure
Figure 21 shows an increase of the number of food insecure populations in Namibia from March to October 2015 in the Zambezi, Kunene, Omusati and Ohangwena regions, as evidenced by both the VAA (July 2015) and FNSM (October 2015) results. This is indicative of the added value the FNSM has in complementing the Annual Vulnerability Assessment through provision of updates.
8. FOOD UTILIZATION:
Nutrition: MUAC measurement
The MUAC analysis indicates a very low prevalence of
malnutrition – 2.6% of screened children were found to be
severely or moderately acute malnourished. Possible causes
include illnesses, poor infant and young child feeding practices
and poor sanitation situation.
Children observed with severely acute malnutrition came from the severely food insecure households. No malnutrition cases were observed among the sampled households in Ohangwena.
MUAC CategoriesOverall
Sample By gender By region
Male Female //Karas Kunene
Ohangw
ena Omaheke Omusati Zambezi
Severe Acute
Malnutrition 0.9 0.6 1.1 3.1 3.3 1.5
Moderate Acute
Malnutrition 2.6 0.6 4.4 3.1 6.7 1.7 3.0 11.1
Normal 96.5 98.8 94.5 93.8 90 100 98.3 95.5 88.9
Number of cases observed and total number of children assessed
Total Cases observed 12 2 10 2 3 0 1 3 3
Total number of
Children 348 165 183 32 30 133 60 66 24
Table 8 : Percentage of Malnutrition for the 6-59 months by gender and by region (MUAC measurement)
A gender-based analysis depicts more malnutrition cases among girls compared to boys (Table 8). Overall, the October malnutrition findings reflect lower prevalence rates (3.5%) compared to the March 2015 rates (5%).
Figure 23 shows the percentage of exclusively breastfed children versus those introduced to solid foods per age groups, for children under 24 months. While infants between 0-5 months should be exclusively breastfed, the results show that over 50% of these infants are being introduced to solid foods at very early ages. A comparative analysis of breastfeeding and food insecurity shows that children from severely food insecure households are not being breastfed but being fed with cereals (porridge) only. In contrast, children from food secure groups are being exclusively breastfed and at the same time being introduced to a variety of other foods.
In terms of health seeking behaviour 46% of the children has visited a health centre during the past three months. Of these, 65% visited the health centre due to cough, 22% due to diarrhoea, 2% due to malnutrition and malaria, and 9% due to other reasons.
FINDINGS
9
9. FOOD SECURITY OUTLOOK Overall food security conditions are expected to worsen during the remainder of the current marketing year (November 2015 to March 2016 period). The rising food prices, high dependency on markets for food, poor livestock-staple foods terms of trade, low income levels, depleted household food stocks and poor dietary diversification are key factors influencing food insecurity in the country.
10. RECOMMENDATIONS
The high dependency on markets by most rural households remains a cause for concern given the high food prices. Measures are needed to ensure fair and affordable food pricing and to scale up safety nets that raise income earnings.
Given the high probability of an El Niño, extension services need to be strengthened to ensure that farmers make informed decisions in order to enhance their resilience. Farmers also need to be encouraged to follow agrometeorological/weather updates as climatic conditions keep changing.
Considering the increase in the number of food insecure people, scaling up of interventions set to promote access through markets and resilience building could enhance food security in the country.
There is a need to promote dietary diversification and food fortification to eliminate cases of malnutrition and nutrient deficiencies, given the low levels of populations with acceptable food consumption patterns.
Sanitation remains a challenge hence the need for community-based projects aimed at improving access to sanitation and safe drinking water.
The MUAC analysis indicates a very low prevalence of malnutrition – 2.6% of screened children were found to be severely or moderately acute malnourished. This calls for both specific and sensitive nutrition interventions to eradicate malnutrition. In addition exclusive breastfeeding awareness campaigns should be promoted for children 0-6 months.
It remains desirable to have food and nutrition security monitoring information for all the 14 regions in order to give a more comprehensive picture of the food security situation in the country.
Water and Sanitation:
Drinking water sources
The continued use of water from unprotected sources remains a major
concern in Omusati. Elsewhere, borehole and piped water have
become the main sources of drinking water which is a great
improvement (Figure 24). Access to clean water is very crucial to
achieve food security as it ensures prevention of diarrheal diseases and
other water borne infections.
Sanitation facilities
Use of the bush/river (in yellow - Figure 25) for sanitary purposes
remains high across all six pilot regions – a major cause for concern.
This is not only unhygienic but a source of disease outbreaks which will
ultimately impact on the food security/nutritional status of the
affected populations. Omaheke, //Karas, Zambezi and Kunene remain
the worst affected regions. Poor sanitation facilities lead to poor
hygiene which ultimately impacts food utilisation. Local authorities
need to take appropriate action to ensure proper hygiene.
10
Background information on the Namibia Food & Nutrition Monitoring System (NFNMS)
Food and Nutrition Security monitoring is a tool that is used to
detect and track changes in people's food security and nutrition
situations over time and space. It can also be used for early
warning in order to alert the government and its partners when
a situation deteriorates in order to ensure that assistance can be
provided in a timely and appropriate manner. Food and
nutrition security monitoring information, in many instances,
trigger early responses averting disastrous outcomes while at
the same time fulfilling the needs of programmes that aim at
building resilience of the affected communities.
The food & nutrition security monitoring system is being
establishment under the auspices of Namibia Vulnerability
Assessment Committee (NAMVAC) in DDRM in the Office of the
Prime Minister and is in line with its (NamVAC’ s) long term
strategic plan to strengthen its food security monitoring
component (NAMVAC Strategic Plan 2012 – 2017, National
Disaster ACT). This is further supported by the 2013 Cabinet
Decision No # 7th /07.05.13/001 which was established
following the Emergency Food Security Assessment (EFSA)
recommendation in 2013.
This information is currently being collected in 6 regions (Kunene, Omaheke, Omusati, //Karas, Zambezi and Ohangwena) and the monitoring will be expanded to cover other regions with time depending on the availability of resources. Data is collected using the sampling framework designed by the
National Statistics Agency in order to align the findings to those
of other national surveys and NamVAC annual assessments. A
stratified two stage cluster sample design was used based on
the 2011 Census enumeration areas. A total of 100 Primary
Sampling Units (PSUs)/sentinel sites were randomly selected
from 71 rural constituencies
A total of 15 households were interviewed per each site bringing
the total household sample size to 302 households. A total of
20 community interviews were administered across the
monitored regions.
Only data relevant to the food and nutrition security indicators
listed below were collected:
Food Availability (agricultural production, market supplies, food prices, etc.)
Access (market commodity and livestock prices; food and income sources, Food consumption patterns, coping strategies, etc.)
Food Utilization: (malnutrition cases, diseases outbreaks, water and sanitation etc.).
The Namibia Food & Nutrition Security Monitoring System is an
integral part of the Namibia Vulnerability Assessment Committee
(NamVAC), which is housed in the Directorate of Disaster Risk
Management (DDRM), in the Office of the Prime Minister. NamVAC is
a multi-stakeholder platform that coordinates annual food security
and vulnerability assessments- providing a holistic and an integrated
analysis on food availability, food access and food utilization within the
country.
A multi-sectoral task team was composed in 2013 to spear head and
oversee the implementation of the food security monitoring activities.
The task team comprises of the following institutions:
• DDRM in the Office of the Prime Minister
• Ministry of Agriculture, Water and Forestry
• Ministry of Health and Social Services
• Namibia Agronomic Board
• Namibia Statistics Agency
• World Food Programme
Acknowledgments:
The Office of the Prime minister would like to thank the World Food
Programme for the technical support and the following institutions for
their vital contributions leading to this publication:
• Regional Councils
• Constituencies
• Ministry of Urban and Rural Development
• City of Windhoek
• United Nations Children’s Fund (UNICEF)
And last but not least the Food and Nutrition Security Monitoring
enumerators.

11
FOOD AVAILABILITY: Food availability can be described as the extent to which food is within the reach of households (i.e. in local shops and markets), both in terms of sufficient quantity and quality. It is also strongly related to the overall availability of food, which is determined by domestic food production, commercial food imports, food aid, road and market infrastructure, the degree of market integration, and local market institutions. MARKET PRICE INFORMATION: Market price information provides an indication of household affordability given its income levels. Any food price increases can actually limit households’ food access thereby compromising its food security. FOOD ACCESS: Food access is to a large extent determined by food prices and household resources. Important drivers of food access are household resources, food prices, food preferences and socio-political factors such as discrimination and gender inequality. HOUSEHOLD FOOD CONSUMPTION SCORE: Household food consumption was measured using the Food Consumption Score (FCS) technique, which is a composite of dietary diversity and food frequency measures. Dietary diversity refers to the number of different foods or food groups consumed, and food frequency refers to the food consumed over a 7-day period.
HOUSEHOLD COPING STRATEGIES: The coping strategies are proxy indicators for food-access related food security. They can provide insight into how households cope with income and food shortfalls. HOUSEHOLD
PURCHASING POWER:
In food security terms, the household purchasing power is a measure of the quantity and quality of food products that a particular household can afford to buy with the available income. Purchasing power is analyzed by calculating the terms of trade (ToT) using for example wage rates, food retail prices, livestock prices, etc. ToTs are said to be favorable if the income obtained from the sale of one animal (say cattle) enables the household to buy a sizeable quantity of food, in this case maize meal.
MAIN INCOME SOURCES: Income sources constitute a food-access indicator that identifies the reliability and sustainability of household income sources and levels of household earnings. Sources of income are thus directly related to the economic activities of household members. Hence, field data on income sources is collected from the sentinel sites to ensure that the basis for sustaining households is accurately reported.
FOOD UTILIZATION: Food utilization refers to an individual’s ability to absorb and metabolize nutrients. Monitoring the impact of disease, care, quality, sanitation and the quality and composition of diet on nutritional outcomes is essential for a full understanding of food security.
Water and sanitation are also food utilization indicators. If not properly managed, improper water and sanitation practices can impact an individual’s ability to utilize the nutrients appropriately, leading to malnutrition and consequently food insecurity.
Mid Upper Arm Circumference:
MUAC can be measured easily, quickly and allows health workers to quickly determine if a patient is acutely malnourished. Values below the cut-offs of 12, 5 mm and 11, 5 mm are used to define moderate and severe acute malnutrition respectively. It measures the circumference of a patient’s arm at the midpoint between his or her shoulder and elbow.
Breastfeeding Practices
All children from 0-6 months should be exclusively breastfeed. Breastfeeding should also be extended till 24 months, with additional complementary foods.
Classification of Food Consumption Scores
“Poor” food consumption is generally regarded as a sign of extreme household food insecurity. It refers to a diet composed mainly of cereals on a daily basis and vegetables for a maximum of 4 days per week. (FCS: 0.5 to 21.0: Poor)
“Borderline” food consumption is classified as a diet made up of cereals and vegetables on a daily basis plus oils/fats for 5 days and sugar/sugar products for 3 days per week (FCS: 21.0 – 34.5: Medium)
“Acceptable” food consumption is classified as daily intake of cereals, vegetables, oil and sugar, and at least one day consumption of foods rich in protein (FCS: 35 and above: Acceptable)
FOOD SECURITY TERMS AND DEFINITIONS
12
Directorate of Disaster risk Management (DDRM) Office of the Prime Minister
P.O. Box 11479 Windhoek
Namibia
World Food Programme UN House
P.O. Box 11043 Windhoek
Namibia