namibia statistics agency mining
TRANSCRIPT
Namibia Statistics Agency
MININGS E C T O R A L R E P O R T - J U N E 2 0 2 1

Chart 1: Mining Composite Index, Percentage Change
• The Composite Index (Chart 1) for Industrial base metals and Mining
Production consists of (Diamonds carats, Uranium, Gold Bullion and Zinc concentrate and contained).
• The composite index declined by 5.5 percent in June 2021 on a monthly basis, worse-off than a growth rate of 19.4 percent recorded in the preceding month. Annually, the index recorded a negative growth rate of 16.7 percent.
• The decline recorded on monthly basis is mainly reflected in the pro-duction of uranium and zinc concentrate.
Chart 2: Diamond Production Index, Percentage Change
• Diamond Production Index (Chart 2) month on month recorded a mar-
ginal increase of 0.4 percent for June 2021 compared to a growth of 13.8 percent recorded in the previous month. On an annual basis, dia-mond production declined by 17.7 percent in June 2021.
• In the month of June 2021, the volume of diamonds produced stood at 118 638 carats. Whereas in May 2021, the production stood at 118 131 carats, while 144 139 carats were produced in June 2020.
• The marginal increase registered monthly in the production of dia-mond carats was mainly driven by high global demand, hence more production of carats were produced during the period under review.
-60.0
-40.0
-20.0
0.0
20.0
40.0
60.0
80.0
100.0
Jun Jul Aug Sep Oct Nov Dec Jan Feb Mar Apr May Jun
2020 2021
Perc
ent
Composite Index m/m Composite Index y/y
-100.0
-50.0
0.0
50.0
100.0
150.0
200.0
250.0
Jun Jul Aug Sep Oct Nov Dec Jan Feb Mar Apr May Jun
2020 2021
Perc
ent
Diamonds m/m Diamonds y/y
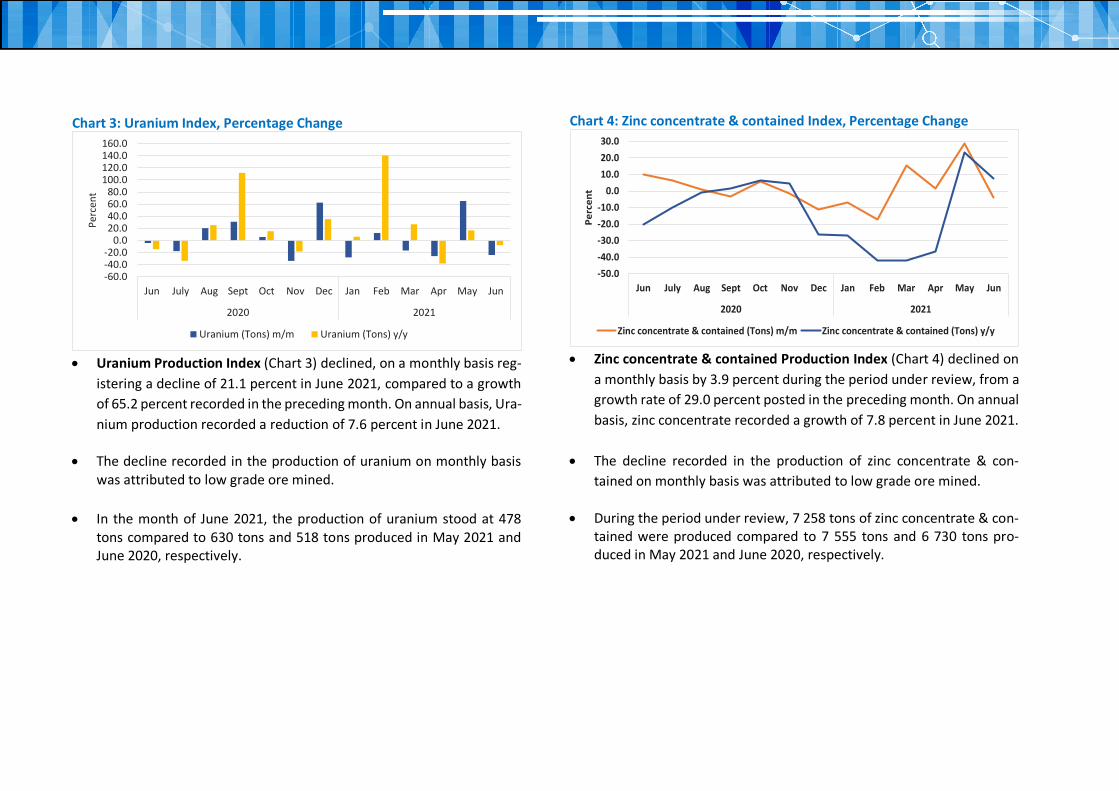
Chart 3: Uranium Index, Percentage Change
• Uranium Production Index (Chart 3) declined, on a monthly basis reg-
istering a decline of 21.1 percent in June 2021, compared to a growth of 65.2 percent recorded in the preceding month. On annual basis, Ura-nium production recorded a reduction of 7.6 percent in June 2021.
• The decline recorded in the production of uranium on monthly basis was attributed to low grade ore mined.
• In the month of June 2021, the production of uranium stood at 478
tons compared to 630 tons and 518 tons produced in May 2021 and June 2020, respectively.
Chart 4: Zinc concentrate & contained Index, Percentage Change
• Zinc concentrate & contained Production Index (Chart 4) declined on
a monthly basis by 3.9 percent during the period under review, from a growth rate of 29.0 percent posted in the preceding month. On annual basis, zinc concentrate recorded a growth of 7.8 percent in June 2021.
• The decline recorded in the production of zinc concentrate & con-tained on monthly basis was attributed to low grade ore mined.
• During the period under review, 7 258 tons of zinc concentrate & con-tained were produced compared to 7 555 tons and 6 730 tons pro-duced in May 2021 and June 2020, respectively.
-60.0-40.0-20.0
0.020.040.060.080.0
100.0120.0140.0160.0
Jun July Aug Sept Oct Nov Dec Jan Feb Mar Apr May Jun
2020 2021
Perc
ent
Uranium (Tons) m/m Uranium (Tons) y/y
-50.0-40.0-30.0-20.0-10.0
0.010.020.030.0
Jun July Aug Sept Oct Nov Dec Jan Feb Mar Apr May Jun
2020 2021
Perc
ent
Zinc concentrate & contained (Tons) m/m Zinc concentrate & contained (Tons) y/y

Chart 5: Gold Bullion Production Index, Percentage Change
• The Gold Bullion Production Index recorded an increased growth rate
of 2.9 percent for June 2021, month on month. This is better-off when compared to a negative growth rate of 10.8 percent recorded in the preceding month.
• In annual terms, gold bullion production declined, registering a nega-tive growth rate of 28.8 percent, slightly downward from a negative growth rate of 38.5 percent recorded in May 2021 (Chart 4).
• The production of gold bullion stood at 361 kg compared to 351 kg and
507 kg for May 2021 and June 2020, respectively.
• The increase recorded on monthly basis in the production of gold bul-lion was attributed to high grade ore mined. This was mainly due to one mine that expanded its operations as a result of further investment done into their infrastructures for the period under review.
-50.0
0.0
50.0
100.0
150.0
200.0
Jun Jul Aug Sep Oct Nov Dec Jan Feb Mar Apr May Jun
2020 2021
PERC
ENT
Gold Bullion m/m Gold Bullion y/y

Table 1: Mining Composite Index of the Selected Minerals
Table 2: Mining Composite Index of the Selected Minerals
Year Month Diamonds Uranium Zinc concentrate & contained
Gold Bullion
Composite Index
Jan 100.9 115.3 62.4 80.3 96.9Feb 103.8 74.3 84.3 88.3 96.6Mar 108.5 72.8 112.8 102.8 103.8Apr 81.1 85.7 112.1 119.6 90.1May 95.2 87.4 111.2 109.7 97.9Jun 116.5 144.7 88.6 95.2 114.6Jul 132.7 87.5 85.6 103.5 120.3Aug 69.9 95.1 136.5 100.0 81.4Sep 114.0 84.8 121.4 109.9 111.1Oct 106.1 88.9 117.9 92.9 102.0Nov 76.6 127.7 85.8 85.2 83.9Dec 94.8 135.6 81.2 112.6 101.3Jan 112.5 124.2 92.0 75.7 0.0Feb 105.8 112.1 73.6 98.7 103.0Mar 83.6 118.1 0.0 100.0 85.8Apr 64.5 106.2 46.7 96.0 73.4May 63.1 121.9 121.2 85.9 76.2Jun 76.2 95.5 61.6 110.9 83.2Jul 79.9 109.1 53.9 94.4 84.0Aug 103.3 96.0 74.4 120.7 103.6Sep 90.6 110.8 120.5 129.6 100.6Oct 102.6 134.8 108.2 143.3 113.0Nov 98.9 115.8 81.0 108.9 101.1Dec 90.3 118.9 136.0 137.1 103.3Jan 112.2 102.8 118.3 123.4 112.7Feb 88.5 94.0 101.9 102.2 91.7Mar 120.1 113.2 104.6 108.4 115.7Apr 80.6 103.9 100.7 126.7 91.8May 83.2 91.8 134.8 113.6 91.5Jun 102.5 150.4 81.5 98.9 105.6Jul 94.1 146.9 62.3 102.6 99.5Aug 105.1 152.7 91.2 126.7 112.9Sep 107.8 122.0 94.3 134.6 112.8Oct 112.4 207.7 98.0 133.3 125.4Nov 106.5 195.7 63.6 144.5 120.5Dec 114.9 201.0 119.9 93.9 120.5
2015
2016
2017
Year Month Diamonds Uranium Zinc concentrate & contained
Gold Bullion
Composite Index
Jan 142.5 240.6 104.7 126.3 148.0Feb 117.4 141.7 88.2 129.4 120.0Mar 113.2 98.8 109.9 83.6 105.5Apr 130.6 248.3 87.3 85.9 133.2May 117.2 199.4 109.8 81.1 119.1Jun 136.1 212.3 110.1 110.5 138.1Jul 117.9 211.1 110.0 110.3 126.0Aug 103.2 267.3 135.1 85.8 119.7Sep 90.5 224.8 105.8 108.7 109.1Oct 127.1 158.7 113.1 110.1 126.2Nov 119.8 193.7 112.9 99.9 123.6Dec 99.0 150.5 107.0 115.7 107.5Jan 123.4 200.0 116.1 91.2 125.3Feb 107.7 163.5 105.4 83.4 109.0Mar 96.9 141.4 126.8 79.4 99.7Apr 77.2 211.7 111.8 94.6 96.7May 68.9 164.7 110.1 92.3 85.4Jun 83.1 190.6 101.6 112.4 100.8Jul 106.2 202.5 95.4 149.1 123.4Aug 88.7 128.8 87.3 145.8 102.5Sep 96.2 99.9 82.2 111.3 97.9Oct 125.0 193.7 83.1 109.1 127.2Nov 84.3 181.4 83.5 131.9 103.0Dec 100.8 178.0 104.7 33.6 97.4Jan 116.8 163.2 98.8 113.0 119.7Feb 106.6 81.0 103.8 72.4 96.9Mar 126.0 127.9 119.1 120.1 124.0Apr 74.6 194.3 110.6 100.8 94.0May 77.0 170.4 73.8 110.3 92.7Jun 97.5 163.2 81.0 97.9 103.6Jul 81.9 134.2 85.9 101.2 90.8Aug 60.1 161.6 86.4 99.5 79.3Sep 24.8 211.4 83.7 91.9 60.3Oct 78.4 223.3 88.3 188.1 113.9Nov 97.0 148.2 87.2 103.5 102.8Dec 54.1 240.7 77.4 94.8 83.2Jan 90.2 173.3 72.2 70.5 94.8Feb 76.2 194.7 60.0 63.5 86.2Mar 64.6 162.3 69.2 66.5 75.8Apr 70.2 120.2 70.5 76.0 76.4May 79.9 198.6 90.9 67.8 91.3Jun 80.2 150.7 87.3 69.8 86.2
2020
2018
2019
2021

Definitions
• Diamond: Is a very hard mineral that is a form of bars of carbon and is used especially in Jewellery.
• Gold Bullion: Is a gold or silver in bulk before coining or valued by weight which basically means gold bullion is gold valued purify and weights.
• Zinc: Is a metallic element with blue- white colour used as a protective covering for iron and to make metal alloys like nickel silver.
• Uranium: Is a Silver heavy radioactive polyvalent metallic element that is found especially in uraninite and exists naturally as a mixture of mostly no fissionable elements.
Methodology notes and data sources
Data Sources: Data sourced from Bank of Namibia for the period starting from January 2019. Prior to January 2019 data was sourced from the Ministry of Mines and Energy.
Base year: The Mining sectoral report is harmonised with the quarterly and annual National Accounts base year 2015.
Index calculations: The index of mining production was weighted using the value added data of 2015. The index is then calculated as a ratio of the volume of a specific component in a specific month to the total volume of that component in 2015.
Conversion: 1 basis point = 0.01 percent