namibia vital stati sti cs report
TRANSCRIPT

Namibia Vital Stati sti cs ReportBirths, Deaths and Marriages registered in 2016 & 2017
Namibia Stati sti cs AgencyP.O. Box 2133, FGI House, PostStreet MallWindhoek, Namibia
Tel: +264 61 431 3200Fax: +264 61 431 3253
Email: [email protected]
Namibia Vital Statistics Report work 2.indd 1Namibia Vital Statistics Report work 2.indd 1 23/02/2021 7:41 AM23/02/2021 7:41 AM

inside front coverblank
unprinted
Namibia Vital Statistics Report work 2.indd 2Namibia Vital Statistics Report work 2.indd 2 23/02/2021 7:41 AM23/02/2021 7:41 AM

iNamibia Vital Stati sti cs Report- Registered Births, Deaths and Marriages for the period 2016 – 2017
FOREWORD BY THE NAMIBIA STATISTICS AGENCY
The producti on and availability of a vital stati sti cs report is a key step towards sti mulati ng and guiding the improvements of the civil registrati on system. The most important reason for developing and publishing a vital stati sti cs report is the needs of the public, government, civil society and the internati onal community for data on births, deaths, and essenti al indictors derived from these. Vital stati sti cs are used to produce the fundamental demographic and epidemiological measures that are needed in nati onal planning across multi ple sectors such as educati on, labour and health.
At the fi rst conference of the African Ministers responsible for Civil Registrati on that was held in Ethiopia in 2010, the importance of civil registrati on, system for issuance of nati onal identi ty documents and producti on of quality vital stati sti cs was acknowledged. At the second conference held in South Africa in 2012, the Ministers made a decision to undertake country led comprehensive assessments of Civil Registrati on and Vital Stati sti cs (CRVS) systems and a commitment to integrate strategic planning recommendati ons resulti ng from the assessments into government mainstream nati onal plans. As a result, Namibia undertook the Comprehensive Assessment on CRVS in 2014 and developed a Five Year Strategic Plan for the improvement of CRVS system.
At the third African Ministers Conference in Cote d’Ivoire in 2014, the Ministers made further commitment to the producti on of vital stati sti cs based on civil registrati on data regardless of the level of completeness to establish the state of the system and its development. The fourth Conference was held in Mauritania in 2017 with the theme, “Accelerati ng a coordinated improvement of civil registrati on and vital stati sti cs for implementati on and monitoring of the development agenda in Africa: Review of progress and the way forward”.
This report provides vital stati sti cs and evaluates the quality as well as completeness of civil registrati on data. It presents stati sti cs on vital events of births, deaths, and marriages, which are captured in the Nati onal Populati on Register System (NPRS) of the Ministry of Home Aff airs and Immigrati on (MHAI). The report also highlights trends and improvements over the years. It is worth noti ng that currently, informati on on divorces is not captured in the NPRS therefore excluded from this report. This is the fi ft h report to be produced since 2015 and the reports have been instrumental in the improvement of the Civil Registrati on and Vital Stati sti cs system.
ALEX SHIMUAFENISTATISTICIAN-GENERAL & CEONAMIBIA STATISTICS AGENCY
Namibia Vital Statistics Report work 2.indd 1Namibia Vital Statistics Report work 2.indd 1 23/02/2021 7:41 AM23/02/2021 7:41 AM

ii Namibia Vital Statistics Report- Registered Births, Deaths and Marriages for the period 2016 – 2017
FOREWORD BY MINISTRY OF HOME AFFAIRS, IMMIGRATION, SAFETY AND SECURITY
The Department of Civil Registration in the Ministry of Home Affairs, Immigration, Safety and Security is the central role player in the administration of the Population Register which contains both Civil Registration and Identity data. The Population Register is electronically managed by the Ministry in the National Population Registration System (NPRS) while the Namibia Statistics Agency (NSA) processes CR data obtained from NPRS to generate annual Vital Statistics Reports. Collaboration between MHAISS and NSA as well as other key stakeholders is indispensable in improving the CRVS system in Namibia.
The Vital Statistics Reports by the NSA have been useful to the Ministry in bridging the gaps in the CRVS system. Bridging these gaps has led to revision and consolidation of civil registration laws, forms and processes as well as improving the civil registration data quality with the emergence of the digital registration of events in the electronic birth and death notification system. The enhancement of monitoring and management of the Civil Registration data comes through recommendations made by in Reports such as this one.
The five (5) year CRVS Strategic Plan (for the period 2015/16 to 2020/21) has been a useful framework outlining the approach to improve CRVS in Namibia in a coordinated manner involving all key stakeholders. It has guided the implementation of key deliverables such as the improvement of data quality. This milestone could not have been achieved without our CRVS stakeholders such as the Namibia Statistics Agency (NSA), Ministry of Health and Social Services and the Namibian Police.
The Ministry is pleased with the NSA’s efforts to produce the CRVS data, which we rely on to continue improving the CRVS System. While we continue to see gradual improvement, we are also aware of the need to bring marriage data on par with birth and death data.
This Report provides valuable insight which the Ministry and other CRVS stakeholders will find useful in planning and decision making.
ETIENNE MARITZEXECUTIVE DIRECTORMINISTRY OF HOME AFFAIRS, IMMIGRATION, SAFETY AND SECURITY
Namibia Vital Statistics Report work 2.indd 2Namibia Vital Statistics Report work 2.indd 2 23/02/2021 7:41 AM23/02/2021 7:41 AM

iiiNamibia Vital Statistics Report- Registered Births, Deaths and Marriages for the period 2016 – 2017
This document may be cited as: Namibia Vital Statistics report, Births, Deaths and Marriages Registered in 2016 and 2017, Windhoek, Namibia. 2020.
Namibia Vital Statistics Report work 2.indd 3Namibia Vital Statistics Report work 2.indd 3 23/02/2021 7:41 AM23/02/2021 7:41 AM

iv Namibia Vital Statistics Report- Registered Births, Deaths and Marriages for the period 2016 – 2017
LIST OF ACRONYMS
The abbreviations and acronyms used in this report are as follows:APAI-CRVS Africa Programme on Accelerated Improvement of Civil Registration and
Vital StatisticsCR Civil Registration
CRVS Civil Registration and Vital Statistics
DP Data Processing
DVS Demographic and Vital Statistics
e-NPRS Electronic National Population Registration System
ID Identity Document
MHAI Ministry of Home Affairs and Immigration
MoHSS Ministry of Health and Social Services
MoJ Ministry of Justice
MOU Memorandum of Understanding
MSS Ministry of Safety and Security
MTP Medium Term Plan
NGO Non-Governmental Organizations
NPHC Namibia Population and Housing Census
NPRS National Population Registration System
NSA Namibia Statistics Agency
OPM Office of the Prime Minister
UN United Nations
UNECA United Nations Economic Commission for Africa
VS Vital Statistics
VSR Vital Statistics Report
WHO World Health Organization
Namibia Vital Statistics Report work 2.indd 4Namibia Vital Statistics Report work 2.indd 4 23/02/2021 7:41 AM23/02/2021 7:41 AM

vNamibia Vital Statistics Report- Registered Births, Deaths and Marriages for the period 2016 – 2017
CONCEPTS AND DEFINITIONS
Capturing means that a registered event is captured on the system (NPRS). An event may be registered but not captured on the NPRS system.
Child Mortality Rate (CMR) is the number of deaths for children under five years of age occurring among the live births in a given geographical area during a given year, per 1,000 live births occurring among the population of the given geographical area during the same year.
Civil Registration (CR) continuous, permanent, compulsory and universal recording of the occurrence and characteristics of vital events pertaining to the population, as provided through decree or regulation in accordance with the legal requirements in each country.
Civil Registration and Vital Statistics (CRVS): Civil registration is the system by with the government records the vital events (births, marriages and deaths) of its citizens. The primary purpose of civil registration is to create a legal document that can be used to establish and protect the right of individuals. A secondary purpose is to create a data source for the compilation of vital statistics.
Crude Birth Rate (CBR): the number of livebirths occurring in a population during a given period of time, usually a calendar year, i.e., the number of live births occurring among the population of a given geographical area during a given year, per 1,000 mid-year total population of that area during the same year.
Crude Death Rate (CDR): the number of deaths occurring in a population during a given period of time, usually a calendar year, i.e., the number of deaths occurring among the population of a given geographical area during a given year, per 1,000 mid-year total population of that area during the same year.
Crude Marriage Rate the number of marriages occurring in a population during a given period of time, usually a calendar year, i.e., the number of marriages occurring among the population of a given geographical area during a given year, per 1,000 mid-year total population of that area during the same year.
Date of occurrence: The exact date when an event occurred, which should be expressed in terms of the day, month and year, as well as the hour and minute, if appropriate (for live births, foetal deaths and deaths).
Date of registration: The day, month and year when an entry of registration of a vital event is made in the civil register.
Death is the permanent disappearance of all evidence of life at any time after live birth has taken place (postnatal cessation of vital functions without capability of resuscitation). This definition excludes foetal deaths.
Event captured refers to capturing/entering information of the event/record on the National Population Register System (NPRS).
Event occurred refers to the actual occurrence of an event (Birth, Death, or Marriage).
Event registered refers to the registration of an event through an issuance of a certificate e.g. birth certificate, death certificate or marriage certificate.
Infant Mortality Rate (IMR): the number of infant deaths occurring during the same period of time, usually a calendar year, i.e., the number of deaths of live-born children under 1 year of age occurring in a given geographical area during a given year, per 1,000 live births occurring among the population of that area during the same year.
Late Registration is the registration of a vital event after the legally specified time period but within the grace period. The grace period is usually considered to be one year following the vital event.
Live Birth is a result of the complete expulsion or extraction from its mother of a product of conception, irrespective of the duration of pregnancy, which after such separation breathes or shows any other evidence of life, such as beating of the heart, pulsation of the umbilical cord or definite movement of voluntary muscles, whether or not the umbilical cord has been cut or the placenta is attached. Each product of such a birth is considered to be live-born.
Marriage is the act, ceremony or process by which the legal relationship of spouses is constituted. Civil union refers to a legal construct, registered with the public authorities according to the laws of the country.
Namibia Vital Statistics Report work 2.indd 5Namibia Vital Statistics Report work 2.indd 5 23/02/2021 7:41 AM23/02/2021 7:41 AM
vi Namibia Vital Statistics Report- Registered Births, Deaths and Marriages for the period 2016 – 2017
Place of occurrence is the geographical location in the country: (a) locality and (b) major division or other geographical place in which the locality is situated, where the live birth, death, delivery of a dead foetus, marriage or divorce occurred.
Place of registration is the geographical location in the country: (a) locality and (b) major division or other geographical place in which the locality is situated, where the live birth, death, delivery of a dead foetus, marriage or divorce is registered in the civil registration system.
Region of occurrence refers to the region where the event occurred and is derived from place of occurrence
Region of registration refers to the region in which the event was registered and is derived from the office of registration.
Registration means that an event has notified to the MHAI office and a certificate has been issued.
Registration within a year means that an event is registered within 12 months (year) from the date of occurrence.
Registration year refers to the year when the event was registered. Year of registration is derived from date of registration
Vital event is the occurrence of a live birth, death, foetal death, marriage, divorce, adoption, legitimation, and recognition of parenthood, annulment of marriage or legal separation.
Vital event record: A legal document entered into the civil register that attests to the occurrence and characteristics of a vital event.
Vital statistical record: A document or record containing those items of information concerning an individual vital event that meet the needs of vital statistics compilation.
Vital Statistics (VS) is the collection of statistics on vital events in the lifetime of a person as well as relevant characteristics of the events themselves and of the person and persons concerned.
Year of occurrence refers to the year when the event occurred. Year of occurrence is derived from date of occurrence
Namibia Vital Statistics Report work 2.indd 6Namibia Vital Statistics Report work 2.indd 6 23/02/2021 7:41 AM23/02/2021 7:41 AM

viiNamibia Vital Statistics Report- Registered Births, Deaths and Marriages for the period 2016 – 2017
ABOUT NAMIBIA Namibia is located in Southern Africa, covers an area of 825,229 square kilometres and has a projected population of about 2.4 million inhabitants in 2017. The country is one of the most sparsely populated countries in the world.
Person’s Demographic
Profile (including parents’
details) – NPRS MHAI
Namibia Vital Statistics Report work 2.indd 7Namibia Vital Statistics Report work 2.indd 7 23/02/2021 7:41 AM23/02/2021 7:41 AM

viii Namibia Vital Statistics Report- Registered Births, Deaths and Marriages for the period 2016 – 2017
TABLE OF CONTENTS
Foreword by the Namibia Statistics Agency ........................................................................................................................ i
Foreword by Ministry of Home Affairs, Immigration, Safety and Security ......................................................................... ii
List of Acronyms ................................................................................................................................................................ iv
Concepts and Definitions ................................................................................................................................................... v
About Namibia ................................................................................................................................................................ vii
List of Tables ...................................................................................................................................................................... x
List of Figures .................................................................................................................................................................... xi
CHAPTER 1: INTRODUCTION .............................................................................................................................................. 11.1 Objectives ............................................................................................................................................................ 11.2 Organisation of the Report ................................................................................................................................... 11.3 Main findings ........................................................................................................................................................ 2
CHAPTER 2: THE CIVIL REGISTRATION SYSTEM .................................................................................................................. 42.1 Background ........................................................................................................................................................... 42.2 Registration process in Namibia ........................................................................................................................... 42.3 Organizational structure ....................................................................................................................................... 52.4 Civil registration data flow ................................................................................................................................... 62.5 Vital Statistics Report Production and Dissemination Process ............................................................................. 72.6 Legal ..................................................................................................................................................................... 82.7 Incentives and disincentives of civil registration .................................................................................................. 8
CHAPTER 3: METHODOLOGY AND DATA SOURCE .............................................................................................................. 93.1 Methodology ....................................................................................................................................................... 93.2 Data source ........................................................................................................................................................... 93.3 Data Quality ........................................................................................................................................................ 9
CHAPTER 4: TIMELINESS AND COMPLETENESS ............................................................................................................... 114.1 Timeliness ........................................................................................................................................................... 114.2 Completeness ..................................................................................................................................................... 19
CHAPTER 5: BIRTHS .......................................................................................................................................................... 215.1 Trends in birth registrations ............................................................................................................................... 215.2 Age and Sex differentials for births ..................................................................................................................... 235.3 Registered births by place of occurrence and registration ................................................................................ 255.4 Characteristics of parents .................................................................................................................................. 29
CHAPTER 6: DEATHS ........................................................................................................................................................ 316.1 Trends in death registrations .............................................................................................................................. 316.2 Age and Sex differentials for deaths ................................................................................................................... 346.3 Registered deaths by place of occurrence and registration ................................................................................ 376.4 Registered deaths by citizenship and marital status ........................................................................................... 396.5 Neonatal, Infant and Child deaths ...................................................................................................................... 40
CHAPTER 7: MARRIAGES .................................................................................................................................................. 487.1 Trends of marriage registrations ........................................................................................................................ 487.2 Age differentials in Marriages ............................................................................................................................. 507.3 Marriage registrations by place of occurrence and nationality .......................................................................... 51
CONCLUSION .................................................................................................................................................................... 528.1 Challenges .......................................................................................................................................................... 528.2 Recommendations .............................................................................................................................................. 53
Namibia Vital Statistics Report work 2.indd 8Namibia Vital Statistics Report work 2.indd 8 23/02/2021 7:41 AM23/02/2021 7:41 AM

ixNamibia Vital Statistics Report- Registered Births, Deaths and Marriages for the period 2016 – 2017
Annexure ......................................................................................................................................................................... 54Figure 1: Flow diagram for Civil Registration data processing .................................................................................. 53Annex I: Tables .......................................................................................................................................................... 55Annex II: Topics and Themes recommended by UN ................................................................................................. 62Annex III: Minimum list of tabulations recommended by UN ................................................................................. 69
References ........................................................................................................................................................................ 74
Namibia Vital Statistics Report work 2.indd 9Namibia Vital Statistics Report work 2.indd 9 23/02/2021 7:41 AM23/02/2021 7:41 AM

x Namibia Vital Statistics Report- Registered Births, Deaths and Marriages for the period 2016 – 2017
LIST OF TABLESTable 4. 1: Birth completeness rates by year, 2011 – 2017 .............................................................................................. 19Table 4. 2: Death completeness rates by year, 2011 – 2017 ............................................................................................. 20
Table 5. 1: Births by year of occurrence, year of registration and sex .............................................................................. 21Table 5. 2: Crude Birth Rates (CBR) by year of birth, 2011 – 2017 ................................................................................... 23Table 5. 3: Registered births by sex, sex ratio and year of occurrence ............................................................................. 25Table 5. 4: Registered births by type of facility and registration year, 2016 & 2017 ........................................................ 26Table 5. 5: Registered births by type of facility and region of registration, 2017 ............................................................ 28Table 5. 6: Parents’ marital status by year of birth registration, 2011 - 2017 ................................................................... 29
Table 6. 1: Deaths by year of occurrence, registration and sex ........................................................................................ 31Table 6. 2: Crude Death Rates (CDR) by death year, 2011 – 2017 .................................................................................... 33Table 6. 3: Registered deaths by month and year of death, 2011 – 2017 ........................................................................ 33Table 6. 4: Registered deaths by death year, sex and sex ratio ......................................................................................... 34Table 6. 5: Registered deaths by region of death and year of registration ...................................................................... 37Table 6. 6: Registered deaths by country of death and year of registration, 2011 - 2017 ................................................ 38Table 6. 7: Registered deaths by region of registration and year of registration .............................................................. 39Table 6. 8: Registered deaths by citizenship and year of registration, 2011 - 2017 .......................................................... 39Table 6. 9: Registered deaths by marital status and year of registration, 2011 - 2017 ..................................................... 40Table 6. 10: Registered neonatal deaths by age and sex ratio, 2017 ................................................................................ 41Table 6. 11: Registered neonatal deaths by region of death, sex and sex ratio, 2017 ...................................................... 42Table 6. 12: Registered infant death by sex and sex ratio, 2011 – 2017 ........................................................................... 44Table 6. 13: Infant Mortality Rates (IMR) by year, 2011 – 2017 ....................................................................................... 44Table 6. 14: Registered child deaths by sex and sex ratio, 2011 – 2017 .......................................................................... 45Table 6. 15: Child Mortality Rates (CMR) by year of death, 2011 – 2017 ......................................................................... 46
Table 7. 1: Registered marriages by year married and crude marriage rates, 2011 - 2017 .............................................. 49Table 7. 2: Registered marriages by nationality of husband and wife, 2017 .................................................................... 51
Namibia Vital Statistics Report work 2.indd 10Namibia Vital Statistics Report work 2.indd 10 23/02/2021 7:41 AM23/02/2021 7:41 AM

xiNamibia Vital Statistics Report- Registered Births, Deaths and Marriages for the period 2016 – 2017
LIST OF FIGURES
Figure 2. 1: Number of registration offices per region ...................................................................................................... 5Figure 2. 2: Structural and functionality of the Namibian NPRS ......................................................................................... 6Figure 2. 3: Organizational chart presenting different levels and cooperation partners .................................................... 6Figure 2. 4: Flow for processing of civil registration data to produce vital statistics report ............................................... 7
Figure 4. 1: Percent registered births by status (within 12 months or late) and year of registration ............................... 11Figure 4. 2: Births registered timely by status (within 12 months or late) and year of capture in NPRS .......................... 12Figure 4. 3: Percent registered deaths by status (within 14 days or late) and year of registration .................................. 12Figure 4. 4: Deaths registered timely by status (within 14 days or late) and year of capture in NPRS ............................. 13Figure 4. 5: Percent registered deaths by status (within 12 months or late) and year of registration ............................. 13Figure 4. 6: Deaths registered timely by year of capture in NPRS and status (within 12 months or late) ........................ 14Figure 4. 7: Percent registered marriages by status (within 12 months or late) and year of capture in NPRS ................. 14Figure 4. 8: Percent timely (within 12 months) registered births by region and year of registration .............................. 15Figure 4. 9: Percentage change in timely (within 12 months) birth registrations by region ............................................. 15Figure 4. 10: Percent timely (within 14 days) registered deaths by registration year, 2016 & 2017 ................................ 16Figure 4. 11: Percent change in timely (within 14 days) registered deaths by registration year, 2016 & 2017 ................ 16Figure 4. 12: Percent deaths registered timely (within 12 months) by registration year, 2016 & 2017 ........................... 17Figure 4. 13: Percent change in timely registered deaths (within 12 months) for registration between 2016 & 2017.... 17Figure 4. 14: Percent marriages captured timely (within 12 months) by registration year, 2016 & 2017 ........................ 18Figure 4. 15: Percent marriages captured timely (within 12 months) in 2017 ................................................................. 18Figure 4. 16: Completeness rates for registered births and deaths by year, 2011 – 2017 ................................................ 20
Figure 5. 1: Registered births by sex and birth year: 1990 – 2017 ................................................................................... 21Figure 5. 2: Number of births occurred - comparing 2017/18 VSR and 2018/19 TOTAL, 1990 – 2017 ............................ 22Figure 5. 3: Registered births by year of occurrence and year of registration, 2011 – 2017 ............................................ 22Figure 5. 4: Registered births by age at registration and registration year ....................................................................... 23Figure 5. 5: Proportion of children under 5 years whose births have been registered, 2016 & 2017 .............................. 24Figure 5. 6: Proportion of children under five whose births have been registered, 2011 – 2017 .................................... 24Figure 5. 7: Percent registered births by region of birth and region of registration, 2016 ............................................... 25Figure 5.8: Percent registered births by region of birth and region of registration, 2017 ................................................ 26Figure 5. 9: Percent of births registered timely (within 12 months) by type of facility, 2016 & 2017 .............................. 27Figure 5. 10: Percent of births registered late by type of facility, 2016 & 2017 ............................................................... 27Figure 5. 11: Percent registered births by type of birth facility and region of registration, 2017..................................... 28Figure 5. 12: Registered births by region of registration and year of registration ............................................................ 29Figure 5. 13: Percent timely registered births by age of mother and registration year .................................................... 29Figure 5. 14: Percent registered births by nationality of mother and father, 2017 .......................................................... 30
Figure 6. 1: Registered deaths by sex and death year: 1990 – 2017 ................................................................................ 31Figure 6. 2: Number of deaths occurred - comparing 2017/18 VSR and 2018/19 TOTAL figures, 1990 – 2017 ............... 32Figure 6. 3: Registered deaths by year of occurrence and year of registration, 2011 – 2017 .......................................... 32Figure 6. 4: Age sex ratio by year of registration, 2016 & 2017 ........................................................................................ 34Figure 6. 5: Percentage distribution of deaths by broad age groups and year of death ................................................... 35Figure 6. 6: Number of registered deaths by sex, age and year of registration, 2016 & 2017 ........................................ 35Figure 6. 7: 2017 deaths according the CR data and projected deaths by age ................................................................. 36
Namibia Vital Statistics Report work 2.indd 11Namibia Vital Statistics Report work 2.indd 11 23/02/2021 7:41 AM23/02/2021 7:41 AM

xii Namibia Vital Statistics Report- Registered Births, Deaths and Marriages for the period 2016 – 2017
Figure 6. 8: Percentage distribution of deaths by age and year of death, 2016 and 2017 ............................................... 36Figure 6. 9: Percent registered deaths by region of death and registration, 2016 ........................................................... 37Figure 6. 10: Percent registered deaths by region of death and registration, 2017 ......................................................... 38Figure 6. 11: Percent registered neonatal, infant and child deaths, 2017 ........................................................................ 40Figure 6. 12: Age -Sex ratio for neonatal deaths, 2017 ..................................................................................................... 42Figure 6. 13: Registered neonatal deaths by region and sex, 2017 .................................................................................. 43Figure 6. 14: Sex ratio for registered neonatal deaths by region, 2017 ............................................................................ 43Figure 6. 15: Registered infant deaths by region and year of death ................................................................................. 45Figure 6. 16: Registered child deaths by age at death and year of registration ............................................................... 46Figure 6. 17: Registered child deaths by region and year ................................................................................................. 47
Figure 7. 1: Registered marriages by year married and type of contract, 1990 - 2017 .................................................... 48Figure 7. 2: Number of marriages occurred - comparing 2017/18 VSR and 2018/19, 1990 - 2017 ................................. 48Figure 7. 3: Crude marriage rates by year, 2011 – 2017 ................................................................................................... 49Figure 7. 4: Registered marriages by marriage month and year ...................................................................................... 50Figure 7. 5: Age at marriage for wife and husband by year married, 2016 & 2017 .......................................................... 50Figure 7. 6: Percent registered marriages by region married and year captured ............................................................. 51
Namibia Vital Statistics Report work 2.indd 12Namibia Vital Statistics Report work 2.indd 12 23/02/2021 7:41 AM23/02/2021 7:41 AM

1Namibia Vital Statistics Report- Registered Births, Deaths and Marriages for the period 2016 – 2017
CHAPTER 1: INTRODUCTION
“Vital statistics are used to derive fundamental demographic and epidemiological measures needed in national planning across sectors such as education, labour and health. The statistics are also critical for a wide range of government activities (e.g. population and other administrative registers) as well as commercial enterprises (e.g. life insurance, marketing of products etc.)”. Vital statistics are defined as the collection of statistics on vital events in the lifetime of a person as well as relevant characteristics of the events themselves and of the person and persons concerned. (United Nations, 2014).
This annual vital statistics report is produced in consultation with the Ministry of Home Affairs and Immigration (MHAI), following the guideline for producing vital statistics developed by Statistics Norway in 2015 for Economic Commission for Africa (ECA). The guideline is a comprehensive document developed in line with the United Nations Principles and Recommendations for Vital Statistics (UN 2014), which provides useful and detailed background information.
Furthermore, the report covers vital events such as births, deaths and marriages registered in 2016 and 2017. The Department of Civil Registration in the MHAI mandated to register vital events and issuing of national certificates, provided the data used by the Namibia Statistics Agency (NSA) in the production of this report.
The Annual Vital Statistics Report therefore presents a great opportunity to learn from past experience in terms of the registration of births, deaths and marriages as well as evaluate the quality of the available data on civil registration and vital events in the country.
1.1 Objectives The objective of this report is to provide an overview of the status of Civil Registration and Vital Statistics (CRVS) in Namibia based on the available data from the National Population Registration System (NPRS) of the Ministry of Home Affairs and Immigration (MHAI).
The specific objectives are:
1. To provide basic statistics on registered births, deaths and marriages from the civil registration system;2. To highlight timeliness, quality and completeness of data from the registered vital events;3. To show progress and regress in the CRVS system;4. Present limitations or challenges; 5. Present recommendations for the improvement of CRVS.
1.2 Organisation of the ReportThe report is organised into the following main chapters:
Chapter 1 presents the introduction, objectives of the report Chapter 2 presents the civil registration system in Namibia, including background, registration processes of vital events, organisational structure, data flows and incentives and disincentives for civil registration; Chapter 3 presents methodology, data quality and main findings;Chapter 4 presents timeliness and completeness; Chapter 5 provides basic statistics for registered births; Chapter 6 provides basic statistics for registered deaths; Chapter 7 provides basic statistics for registered marriages;
Chapter 8 presents conclusion, challenges and recommendations and,Annexure, References presented at the end of the report.
Namibia Vital Statistics Report work 2.indd 1Namibia Vital Statistics Report work 2.indd 1 23/02/2021 7:41 AM23/02/2021 7:41 AM
2 Namibia Vital Statistics Report- Registered Births, Deaths and Marriages for the period 2016 – 2017
1.3 Main findingsThe analysis mostly focused on registration years 2016 and 2017 while for some tables or figures it shows trends from registration year 2011 to 2017.
The total number of registered births increased with 726 from 106,386 in 2016 to 107,112 in 2017, while the number of births that occurred increased with 580 from 41,843 in 2016 to 42,423 in 2017.
The total number of registered deaths were 18,919 in 2016 and 20,226 in 2017, which is an increase of 1,307 death registered, while the number of deaths that occurred were 18,188 in 2016 and 18,441 in 2017 which is an increase of 253 death occurred out of the total deaths registered in 2017, there were 2,086 (10.3%) child deaths, 1,634 (8.1%) infant deaths and 995 (4.9%) neonatal deaths.
The total number of marriages were 5,793 in 2016 and 4,859 in 2017.
A birth registered within 12 months from the date of concurrence is considered to be registered timely. Generally, there was an improvement in the number of timely birth registrations between 2016 and 2017. There was a slight increase (51.8 percent in 2016 to 52.1 percent in 2017) in timely birth registrations.
A death registered within 14 days from the day of occurrence is considered as a timely death registration, according to the Namibia laws. There has been a decline in proportion of deaths registered within 14 days between the two years, 91.5 percent in 2016 to 88.2 percent in 2017. On the other hand, for comparability and alignment with international standards, timely death registration is defined as a death registered within a year (12 months) from the day of occurrence. There was a decrease in death registered timely (within 12 months), 97.6 percent in 2016 to 94.1 percent in 2017.
Major improvement observed in timely (within 12 months) capturing of marriages between the two periods, 7.3 percent in 2016 to 60.5 percent in 2017.
Evaluation of quality of the civil registration data and checking for errors in the system is very important. Errors may occur at any point of the registration process i.e. point of registration due to reporting/recording/clerical errors etc. There were some impossible cases found in the data such as events registered before they occurred (which resulted in negative ages at death, at birth registration or marriage), unknown registration offices, unknown registration year and sex of husband/wife registered as female/male since same sex marriage is not legal in Namibia.
Civil registration completeness is defined as the number of events (births or deaths) registered within a year divided by the projected births or deaths. Complete registration has been reached when every vital event that has occurred in a population of a specific country at a specified time period has been registered in the system. Overall, there has been an improvement in the completeness rates for births and deaths from 15.6% in 2011 to 80.1% in 2017, and 63.9 percent in 2011 to 76.0 percent in 2017 respectively over the years. See tables 4.1 and 4.2.
In general, completeness rates for births were found to be lower than for deaths. It is worth noting that the gap is narrowing in 2017, which implies that the completeness rates for births and death is almost equal.
The majority of registered births were for those under the age of 5 years. The sex ratio of registered births shows that there were more female than male birth registrations. Khomas, Kavango East and Ohangwena regions registered the highest number of births in both years (2016, 2017) while least number of birth registrations were in Kavango West. Most births occurred in health facilities (mostly in state/public hospitals) than elsewhere e.g. at home for both years (2016, 2017).
There were more births registered on time by mothers aged between the age groups 20 – 24 to 30 – 34 years in both years (2016, 2017), while younger and older mothers (0 – 14 and 45+ years) registered the least number of births. The data also shows that unmarried parents registered 90.6 percent births.
The number of registered deaths are generally increasing. There were more male than female deaths, about 45 percent female and 55 percent male deaths (see table 6.1). Sex ratio at death by age, shows that in general, there were more male than female deaths except after age 80 years and above.
Namibia Vital Statistics Report work 2.indd 2Namibia Vital Statistics Report work 2.indd 2 23/02/2021 7:41 AM23/02/2021 7:41 AM
3Namibia Vital Statistics Report- Registered Births, Deaths and Marriages for the period 2016 – 2017
There were more marriages without ante-nuptial contracts (in community of property) compared to those with ante-nuptial contract (out of community of property) over the years. Most marriages occurred in August (in 2016) and May (in 2017). Most people get married from the age groups of 20 – 24 to 45 – 49. Khomas region registered the highest number of marriages in both years (19.9 percent for 2016 and 22.6 for 2017) while Kavango West registered the least (1.2 percent in 2016 and 0.8 percent in 2017).
Namibia Vital Statistics Report work 2.indd 3Namibia Vital Statistics Report work 2.indd 3 23/02/2021 7:41 AM23/02/2021 7:41 AM

4 Namibia Vital Statistics Report- Registered Births, Deaths and Marriages for the period 2016 – 2017
CHAPTER 2: THE CIVIL REGISTRATION SYSTEM
2.1 BackgroundThe Civil Registration System in Namibia dates back to early 1900. However, before independence in 1990, civil registration was not compulsory to all. Civil registration only covered the white population groups and some black population particularly in urban areas. During the period, 1979 – 1990, most people above the age of 16 years were registered for the national Identity Documents (IDs) without birth certificates.
After independence, the registration of vital events (births, deaths and civil marriages) and issuance of certificates was entrusted to the Ministry of Home Affairs and Immigration (MHAI), while the Ministry of Justice (MoJ) does divorce registrations. There is no legal agreement between MoJ and MHAI to exchange data on divorces. Divorce data only exist as cases (in hard copy) at the High Court.
Namibia conducted a comprehensive assessment of the Civil Registration and Vital Statistics System in July 2014 within the framework, principles and guidelines of the Africa Programme for Accelerated Improvement of Civil Registration and Vital Statistics (APAI-CRVS). APAI-CRVS is a Pan – African initiative, created under the directives of African Ministers responsible for Civil Registration, to provide management and programmatic guidance to African countries in the improvement of CRVS systems. The programme was implemented through a regional Medium Term Plan (MTP) that ran for an initial phase of five years from 2010 – 2015, with 2010 being a preparatory year. The assessment aimed at compiling information on the status of civil registration and vital statistics system in Namibia, in terms of registration and vital events and generation of vital statistics report from civil registration data.
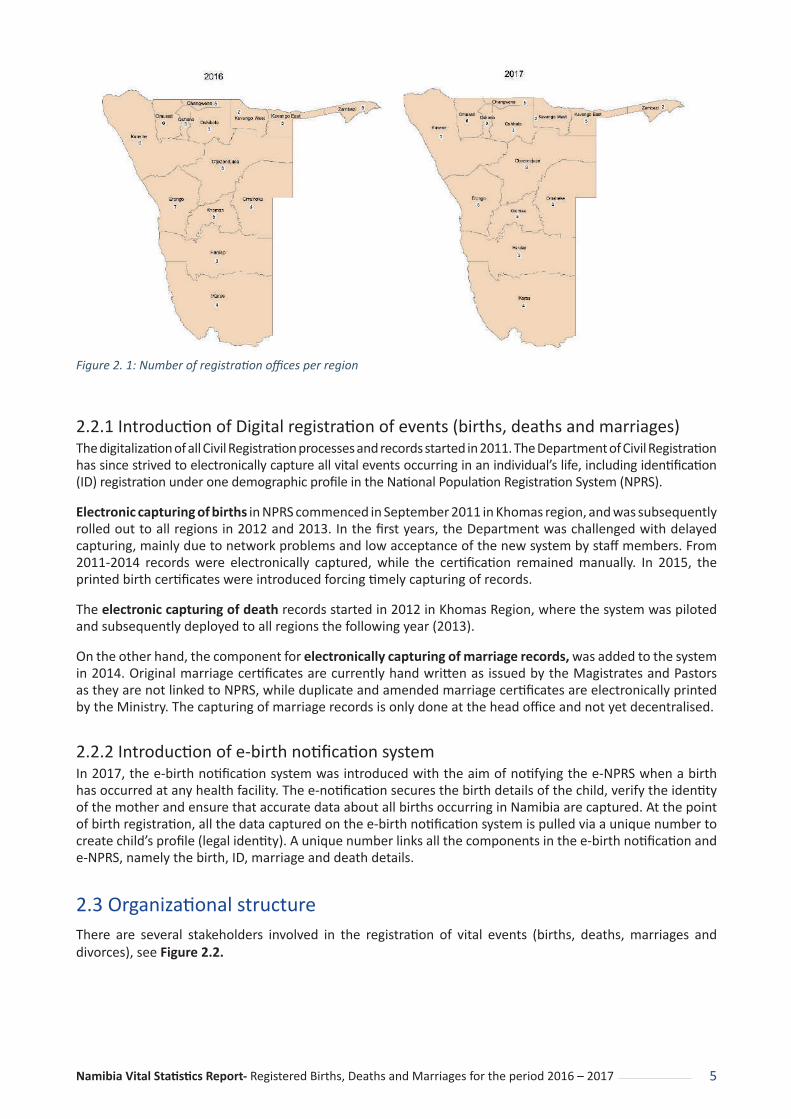
2.2 Registration process in NamibiaThe Ministry of Home Affairs and Immigration (MHAI) registers births, deaths and marriages, while medical officers in the Ministry of Health and Social Services (MoHSS) determine the causes of death. However, other institutions involved in the process of civil registration are depicted in Figure 2.1.
There is a memorandum of understanding between MHAI and MoHSS to utilise health facilities to register births and deaths. The registration of new-born babies and children below one (1) year is done at district hospitals countrywide.
Marriages are registered, after solemnization, at the Ministry of Justice or by church ministers appointed by the Minister of Home Affairs and Immigration.
Divorces are under the jurisdiction of the high court under the Ministry of Justice, which intermittently sends the final divorce order to the MHAI for recording.
Namibia Vital Statistics Report work 2.indd 4Namibia Vital Statistics Report work 2.indd 4 23/02/2021 7:41 AM23/02/2021 7:41 AM
5Namibia Vital Statistics Report- Registered Births, Deaths and Marriages for the period 2016 – 2017
Figure 2. 1: Number of registration offices per region
2.2.1 Introduction of Digital registration of events (births, deaths and marriages) The digitalization of all Civil Registration processes and records started in 2011. The Department of Civil Registration has since strived to electronically capture all vital events occurring in an individual’s life, including identification (ID) registration under one demographic profile in the National Population Registration System (NPRS).
Electronic capturing of births in NPRS commenced in September 2011 in Khomas region, and was subsequently rolled out to all regions in 2012 and 2013. In the first years, the Department was challenged with delayed capturing, mainly due to network problems and low acceptance of the new system by staff members. From 2011-2014 records were electronically captured, while the certification remained manually. In 2015, the printed birth certificates were introduced forcing timely capturing of records.
The electronic capturing of death records started in 2012 in Khomas Region, where the system was piloted and subsequently deployed to all regions the following year (2013).
On the other hand, the component for electronically capturing of marriage records, was added to the system in 2014. Original marriage certificates are currently hand written as issued by the Magistrates and Pastors as they are not linked to NPRS, while duplicate and amended marriage certificates are electronically printed by the Ministry. The capturing of marriage records is only done at the head office and not yet decentralised.
2.2.2 Introduction of e-birth notification system In 2017, the e-birth notification system was introduced with the aim of notifying the e-NPRS when a birth has occurred at any health facility. The e-notification secures the birth details of the child, verify the identity of the mother and ensure that accurate data about all births occurring in Namibia are captured. At the point of birth registration, all the data captured on the e-birth notification system is pulled via a unique number to create child’s profile (legal identity). A unique number links all the components in the e-birth notification and e-NPRS, namely the birth, ID, marriage and death details.
2.3 Organizational structureThere are several stakeholders involved in the registration of vital events (births, deaths, marriages and divorces), see Figure 2.2.
Namibia Vital Statistics Report work 2.indd 5Namibia Vital Statistics Report work 2.indd 5 23/02/2021 7:41 AM23/02/2021 7:41 AM

6 Namibia Vital Statistics Report- Registered Births, Deaths and Marriages for the period 2016 – 2017
Figure 2. 2: Structural and functionality of the Namibian NPRS
2.4 Civil registration data flow The diagram in Figure 2.3 illustrates the process flow for civil registration and vital statistics as well as key role players in the registration of vital events.
Figure 2. 3: Organizational chart presenting different levels and cooperation partners
Entering of records in NPRS: Ideally, all events should be captured on NPRS as soon they are notified. In some instances, this is not the case due to challenges such as lack of infrastructure i.e. computers, internet connectivity at some registration offices in remote areas. Hence, capturing of records in the system may be delayed.
Namibia Vital Statistics Report work 2.indd 6Namibia Vital Statistics Report work 2.indd 6 23/02/2021 7:41 AM23/02/2021 7:41 AM

7Namibia Vital Stati sti cs Report- Registered Births, Deaths and Marriages for the period 2016 – 2017
Transferring CR records from MHAI to NSA: A safe and secure system is recommended to exchange the data from civil registrati on system. However, currently there is no data exchange infrastructure in place for the two insti tuti ons. The CR data is exchanged using an external hard drive.
Data analysis for the report: Data analysis is done at the stati sti cs offi ce which is mandated to produce offi cial stati sti cs in the country. For this report, civil registrati on data on Births, Deaths and Marriages registered up to 2017 were used. Informati on provided was at individual record level. To ensure confi denti ality, names, addresses, ID numbers, or any other means by which a record could be easily identi fy an individual an applicant were not provided to the stati sti cs offi ce.
2.5 Vital Stati sti cs Report Producti on and Disseminati on ProcessThe processing, analysis and publishing of the Vital Stati sti cs report is done by the Namibia Stati sti cs Agency. The process fl ow for the producti on of vital stati sti cs report is illustrated in Figure 2.4.
Figure 2. 4: Flow for processing of civil registrati on data to produce vital stati sti cs report
Namibia Vital Statistics Report work 2.indd 7Namibia Vital Statistics Report work 2.indd 7 23/02/2021 7:41 AM23/02/2021 7:41 AM

8 Namibia Vital Statistics Report- Registered Births, Deaths and Marriages for the period 2016 – 2017
2.6 Legal There are specific Acts of Parliament that governs the registration of births, deaths, marriages and divorces in Namibia. The Birth, Marriage and Death Registration Act 81 of 1963, as amended, sets out the legal framework for civil registration of births, deaths and civil marriages that is currently used in Namibia. Divorces fall under the following Acts: Divorce Laws Amendment Ordinance 18 of 1935, Matrimonial Causes Act of 1939, Matrimonial Causes Jurisdiction Act 35 of 1945 as well as the Divorce Act 70 of 1979. The production and dissemination of statistics is done in accordance with the Statistics Act No.9 of 2011.
2.7 Incentives and disincentives of civil registrationThere are factors that influence registration of vital events either positively or negatively (incentives and/or disincentives).
2.7.1 IncentivesBirth certificate: In Namibia, the law does not require any fee for the first registration of a birth; however, a fee is required to obtain a duplicate. Registration offices are available at subnational level aiming to reach all population. It is not required for one to have a birth certificate to receive public health or education services. However, a birth certificate is required for other public or private services, such as obtaining a national Identity Document, inheritance, social services benefits, passport, driver’s license, utility services (water and electricity), and opening a bank account.
MHAI Health-based facilities provide information to expecting mothers regarding birth registration requirements in the absence of father. For unmarried parents, an affidavit/declaration and copy of the father’s ID card is used for registration using the fathers’ last name. A mother can register a birth using her own surname.
A child is issued with a non-Namibian birth certificate in an event where parents cannot prove citizenship.
Death certificate: There is no fee required to register a death and to obtain the death certificate. A death certificate is required by the family to claim investments, access to bank accounts and real estate holdings. A burial cannot take place without a burial order that is issued when registering a death.
Marriage certificate: There is no fee required to obtain the certificate. Some benefits of being in possession of a marriage certificate includes the spouse of the deceased being able to claim from insurance benefits as they can prove the marriage. Marriages are only solemnized by persons who are licensed by MHAI.
2.7.2 Disincentives Birth certificate: Based on assessment report, the following are some of the factors affecting registration negatively;
· Difficulties to access registration offices (long distances to registration offices), high travel costs, language barriers (e.g. between informant and registration officers or registration forms are in English only), long waiting lines, lack of public awareness on the registration requirements and cultural norms.
· Lack of facilities to carry out mobile registrations to reach remote and nomadic population.
Death certificate: Factors such as hard-to-reach areas could delay registration process of deaths. Registration may take long for the deceased without any identification at time of death.
Marriage certificate: Customary marriages are not recognized by the Namibian law. Marriage register books are only returned back to MHAI by appointed officials when they are full. This means that the book can be kept for more than a year and the marriages will not be recorded in NPRS in time for the vital statistics report production.
Namibia Vital Statistics Report work 2.indd 8Namibia Vital Statistics Report work 2.indd 8 23/02/2021 7:41 AM23/02/2021 7:41 AM

9Namibia Vital Statistics Report- Registered Births, Deaths and Marriages for the period 2016 – 2017
CHAPTER 3: METHODOLOGY AND DATA SOURCE
3.1 Methodology At point of registration, there are some procedures in place to ensure data quality. The statistics office checks the quality of the data by running frequencies of all variables to be analysed from the data. However, checks are being included in the data entry application based on inconsistencies detected on the data. All detected inconsistencies were verified with the data source, corrections were made where necessary, and no imputations were carried out as data was treated as in in order to identify inconsistencies and use the information to improve the CRVS system.
The statistics office manually derives variables from data such as region of birth, death and marriage from places of birth, death and marriage using the locality book compiled by NSA. This is important as statistics are better presented at i subnational level e.g. regions. Other variables such as age at marriage, death or birth registration; and month of birth, death or marriage were also derived using Statistical Package for the Social Sciences (SPSS) or Excel since CR data records the actual year of event occurrence or registration.
3.1.1 Data analysis Analysis focused on events registered in the 2016 and 2017 calendar year showing frequency distributions and cross tabulations to present statistics on births, deaths and marriages by selected socio-demographic and geographic characteristics. Statistics from the previous report was also used to construct patterns over time.
Birth data provides demographic indicators such as age at registration, sex ratio at birth (males per 100 females), place of birth occurrence and registration, type of birth facility, parents’ marital status and age of parents at time of childbirth. Death data provides demographic indicators such as ages at death, sex ratio at death (males per 100 females), place of death and registration, marital status and citizenship at time of death. A section on neonatal, infant and child deaths is also included in this report. Marriage data provides demographic indicators such as age at marriage, place of marriage, type of marriage contract and marriage by citizenship.
3.1.2 Cautionary Note on Death dataNote that the difference in the death totals in the Causes of Death (CoD) report as compared to the death totals in the Vital Statistics Report (VSR) are due to the different time of extraction of the two data sets from the National Population Register System (NPRS).
3.2 Data sourceThe report uses administrative Civil Registration (CR) data from the National Population Registration System (NPRS). The vital events records from NPRS include all births, deaths and marriages registered between January 2016 and December 2017.
3.3 Data Quality According to the United Nations Statistics Division (UNSD) Principles and Recommendations for Vital Statistics (UN 2014), “the quality of vital statistics is measured according to four quality dimensions namely: completeness, correctness or accuracy, availability and timeliness”. It is thus, important that quality control measures are put in place from the onset.
3.3.1 Checking for errors in the dataIdeally, the department of civil registration under MHAI should have data entry edit checks in the system for checking the quality of data during the data entry stage. However, there are very limited edit checks in the system. The Statistics office runs basic frequencies for each variable to check for errors in the data.
Namibia Vital Statistics Report work 2.indd 9Namibia Vital Statistics Report work 2.indd 9 23/02/2021 7:41 AM23/02/2021 7:41 AM

10 Namibia Vital Statistics Report- Registered Births, Deaths and Marriages for the period 2016 – 2017
a) Checking for duplicates
Each record has a unique applicant code that is used to check for duplicates in the data. The NPRS system creates the unique code, which makes it almost impossible to have an event recorded more than once hence, no duplicated records were found in the data.
b) Checking for improbable data
Improbable cases are those that are unrealistic or out of range such as:
i) Mother’s age at child birth too young/oldii) Mother is younger than childiii) Age at marriage (civil) below the legal age or too young iv) Birth or death is registered before occurring, (Negative ages)
All detected cases were noted and shared with civil registration office. No imputations were done as data was treated as is. A separate document on data quality issues is produced by the statistics office and shared with the members of the CRVS technical committee.
c) Checking for missing values
It is important to detect if for each vital event, all the specified variables are recorded or there are missing values, such as date of birth or death or marriage or registration dates. Generally, few records (less than 0.1%) were found to have missing values such as; date of event, unknown registration office and unknown sex.
d) Dialogue with registration office
Errors detected in the data at the statistics office are reported to the civil registration office. Meetings are held between the two offices to discuss the types of errors detected and recommendations to reduce the errors. Additionally, results are also used to identify areas (regions or registration offices) with more errors so that focus is made to improve data quality.
e) Correcting errors
The best approach to correct errors is at the point of entry when the error is detected. Errors detected at the Statistics Office were communicated to the data source for verification. Detected errors assumed to have occurred at the data entry stage are used to implement specific data entry checks. Constant communications between the two offices is maintained throughout the process
Namibia Vital Statistics Report work 2.indd 10Namibia Vital Statistics Report work 2.indd 10 23/02/2021 7:41 AM23/02/2021 7:41 AM

11Namibia Vital Statistics Report- Registered Births, Deaths and Marriages for the period 2016 – 2017
CHAPTER 4: TIMELINESS AND COMPLETENESS
4.1 TimelinessThe two key foundations for the reliability of civil registration records are completeness and timeliness. It is essential to ensure that vital events are recorded within the defined period of time, according to the country’s and international standard definitions.
It is critical to note that a complete registration system is not only determined by the timely registration of events, but also timely capturing of the events on the NPRS system. Timely capturing of the data on NPRS is crucial since it is the only way the data gets to be analysed. This enables the Statistics Office to produce timely statistics.
Timely birth registration and capturing refers to a birth that has been registered and captured within twelve (12) months from the time of occurrence. Late birth registration and capturing is when a birth is registered and captured after 12 months of event occurrence.
On the other hand, timely death registration or capturing refers to a death that has been registered or captured within 14 days from the date of occurrence. However, for comparability, the report also uses the standard 12 months’ definition for timely death registration.
4.1.1 Registration Status of eventsThe purpose of a civil registration system is to record and store information on the occurrence of vital events and their characteristics. Civil registration is carried out primarily because of the resulting legal documents are valuable as provided for by the law. The usefulness of these records as a main source of vital statistics is universally recognized. Therefore, the aim of registration is to attain full coverage of the population so that all types of events occurring to its members are accurately and completely registered on a timely basis in accordance with the registration law.
Figure 4.1 shows the status of birth registration for the years 2016 and 2017. The figure shows that there was a slight increase in registration of birth within 12 months from 51.8 percent in 2016 to 52.1 percent in 2017, while late registration declines slight from 48.2 percent in 2016 to 47.9 percent in 2017.
51.8 48.252.1
47.9
0.0
20.0
40.0
60.0
80.0
100.0
Births registered timely (within 12 months)
Births registered late
Perc
ent
Registration Status
2016 2017
Figure 4. 1: Percent registered births by status (within 12 months or late) and year of registration
Namibia Vital Statistics Report work 2.indd 11Namibia Vital Statistics Report work 2.indd 11 23/02/2021 7:41 AM23/02/2021 7:41 AM

12 Namibia Vital Statistics Report- Registered Births, Deaths and Marriages for the period 2016 – 2017
Figure 4.2 shows the status of capturing timely registered births in the NPRS. It is observed from the figure that almost 100 percent for 2016 and over 89 for 2017 of births registered timely were also captured on time in the NPRS. Similarly, late registration of births in the NPRS increased to 10.5 percent in 2017 from 0.3 percent in 2016.
Perc
ent
2016 2017
99.7
0.3
89.5
10.5
0.0
20.0
40.0
60.0
80.0
100.0
Births captured timely (within 12 months)
Births captured late
Capturing Status
Figure 4. 2: Births registered timely by status (within 12 months or late) and year of capture in NPRS
For Namibia, a death registration is considered timely if it is registered within 14 days from time of occurrence. Figure 4.3 shows a decline in the timely registration of deaths from 91.5 percent in 2016 to 88.2 percent in 2017,
Perc
ent
2016 2017
91.5
8.5
88.2
11.80.0
20.0
40.0
60.0
80.0
100.0
Deaths Registered Timely (within 14 days)
Deaths Registered Late
Registration Status
Figure 4. 3: Percent registered deaths by status (within 14 days or late) and year of registration
Namibia Vital Statistics Report work 2.indd 12Namibia Vital Statistics Report work 2.indd 12 23/02/2021 7:41 AM23/02/2021 7:41 AM

13Namibia Vital Statistics Report- Registered Births, Deaths and Marriages for the period 2016 – 2017
Analysis on how long it takes for a death record to be captured in the NPRS shows that there was an increase from 88.4 percent in 2016 to 92.2 percent in 2017 in timely capturing of deaths as shown in Figure 4.4.
Perc
ent
2016 2017
88.4
11.6
92.2
7.80.0
20.0
40.0
60.0
80.0
100.0
Deaths Captured Timely (within 14 days) Deaths Captured Late
Capture Status
Figure 4. 4: Deaths registered timely by status (within 14 days or late) and year of capture in NPRS
Figure 4.5 shows the status of death registration using the 12 months’ definition of timeliness. The figure shows a decrease in the timely registration of deaths within the 12 months’ period, from 97.6 percent in 2016 to 94.1 percent in 2017. However, in contrast the late registration of deaths within the same period increased by 3.5 percent to 5.9 percent in 2017.
Perc
ent
2016 2017
Registration Status
97.6
2.4
94.1
5.9
0.0
20.0
40.0
60.0
80.0
100.0
Deaths Registered Timely (within 12 months)
Deaths Registered Late
Figure 4. 5: Percent registered deaths by status (within 12 months or late) and year of registration
Namibia Vital Statistics Report work 2.indd 13Namibia Vital Statistics Report work 2.indd 13 23/02/2021 7:41 AM23/02/2021 7:41 AM

14 Namibia Vital Statistics Report- Registered Births, Deaths and Marriages for the period 2016 – 2017
Analysis on how long it takes to capture timely (within 12 months) registered deaths on NPRS shows that, almost 100 percent of the deaths registered timely were also captured timely on NPRS for both years as shown in Figure 4.6.
Perc
ent
2016 2017
Capturing Status
99.9
0.1
100.0
0.00.0
20.0
40.0
60.0
80.0
100.0
Deaths Captured Timely (within 12 months)
Deaths Captured Late
Figure 4. 6: Deaths registered timely by year of capture in NPRS and status (within 12 months or late)
Figure 4.7 shows the percent registered marriages that were captured in the NPRS within 12 months and those that were captured late in the NPRS. There has been a major improvement (85% improvement) in timely capturing of marriages from 7.3 percent in 2016 to 60.5 percent in 2017, resulting in a drastic reduction in late capturing.
Perc
ent
2016 2017
7.3
92.7
60.5
39.5
0.0
20.0
40.0
60.0
80.0
100.0
Marriages Captured Timely (within 12 months)
Marriages Captured Late
Capturing Status
Figure 4. 7: Percent registered marriages by status (within 12 months or late) and year of capture in NPRS
Namibia Vital Statistics Report work 2.indd 14Namibia Vital Statistics Report work 2.indd 14 23/02/2021 7:41 AM23/02/2021 7:41 AM

15Namibia Vital Statistics Report- Registered Births, Deaths and Marriages for the period 2016 – 2017
4.1.2 Timely Registration of events by regionsFigure 4.8 shows the proportion of births registered timely (within 12 months) for the years 2016 and 2017. Regions such as Kunene, Ohangwena, Kavango West, Kavango East, Omaheke and Zambezi recorded the lowest percentage of timely birth registrations in 2016. On the other hand, in 2017, the percentage timely registration of births increased in Kunene and Omaheke regions, while decreased in Kavango West and //Karas regions respectively.
Figure 4. 8: Percent timely (within 12 months) registered births by region and year of registration
Figure 4.9 presents the percentage change between 2016 and 2017 in timely (within 12 months) birth registration at regional level. Kunene, Ohangwena, Oshikoto and Zambezi were the most improved regions in the timely registration of births, while Erongo and //Karas recorded the highest declines.
Figure 4. 9: Percentage change in timely (within 12 months) birth registrations by region
Namibia Vital Statistics Report work 2.indd 15Namibia Vital Statistics Report work 2.indd 15 23/02/2021 7:41 AM23/02/2021 7:41 AM

16 Namibia Vital Statistics Report- Registered Births, Deaths and Marriages for the period 2016 – 2017
Figure 4.10 shows the percent timely (within 14 days) death registrations for the years 2016 and 2017. Kavango West recorded the lowest in 2016, while Oshikoto and Otjozondjupa recorded the lowest in 2017.
Figure 4. 10: Percent timely (within 14 days) registered deaths by registration year, 2016 & 2017
Figure 4.11 shows the percentage change in deaths registered timely (within 14 days) by region of registration for the years 2016 and 2017. Kavango West, Erongo, Khomas, Ohangwena and Omusati region recorded a positive change (improvements) in timely registration of deaths, while Oshikoto and Otjozondjupa regions have the highest decline in terms of registering deaths within 14 days.
Figure 4. 11: Percent change in timely (within 14 days) registered deaths by registration year, 2016 & 2017
Namibia Vital Statistics Report work 2.indd 16Namibia Vital Statistics Report work 2.indd 16 23/02/2021 7:41 AM23/02/2021 7:41 AM

17Namibia Vital Statistics Report- Registered Births, Deaths and Marriages for the period 2016 – 2017
Figure 4.12 shows the percent timely (within 12 months) registered deaths by region of registration for the years 2016 and 2017. In 2016, the percent of deaths registered within 12 months for all regions was above 90 percent. Oshikoto region recorded the lowest in 2017.
Figure 4. 12: Percent deaths registered timely (within 12 months) by registration year, 2016 & 2017
Figure 4.13 shows that Erongo region recorded the highest improvements in timely registration of deaths, while Oshikoto and Otjozondjupa regions had the highest decline.
Figure 4. 13: Percent change in timely registered deaths (within 12 months) for registration between 2016 & 2017
Namibia Vital Statistics Report work 2.indd 17Namibia Vital Statistics Report work 2.indd 17 23/02/2021 7:41 AM23/02/2021 7:41 AM

18 Namibia Vital Statistics Report- Registered Births, Deaths and Marriages for the period 2016 – 2017
Figure 4.14 shows that Kavango West recorded the lowest percent in timely captured marriages in 2016, while Kunene and Omaheke recorded the lowest number of timely captured marriages in 2017.
Figure 4. 14: Percent marriages captured timely (within 12 months) by registration year, 2016 & 2017
Figure 4.15 shows that there has been an improvement of more than 40 percent for all regions in timely capturing of marriages in the system from time of occurrence. Kavango East and Zambezi recorded the highest increase in timely registrations.
Figure 4. 15: Percent marriages captured timely (within 12 months) in 2017
Namibia Vital Statistics Report work 2.indd 18Namibia Vital Statistics Report work 2.indd 18 23/02/2021 7:41 AM23/02/2021 7:41 AM

19Namibia Vital Statistics Report- Registered Births, Deaths and Marriages for the period 2016 – 2017
4.2 CompletenessCivil registration completeness is defined as the number of events (births or deaths), registered within a year divided by the projected number of births or deaths for that particular year. Complete registration has been reached when every vital event that has occurred in a population of a specific country at a specified time period has been registered in the system. This implies that the system has attained 100 percent completeness within its area of coverage.
4.2.1 Estimation of completeness ratesThere are two approach to estimating the completeness of civil registration, namely, the direct and indirect method. The direct method entails matching registration records with records from an independent source, such as civil registration record for other events, administrative and social records or population censuses and surveys. The latter includes comparisons with data from other sources or other time periods such as censuses and surveys.
The indirect method entails comparison of trends, delayed registration (monitoring the interval between the date of occurrence and date of registration of events provides useful information on the timeliness of civil registration and completeness of statistical reporting).
In general, indirect methods indicate whether incompleteness or inaccuracies exist, while direct methods not only access the coverage and accuracies of data but also points to likely sources of the problem.
Estimation of completeness rate in this report used indirect methods. The number of registered events (births and deaths) is the number recorded by the civil registration system (in NPRS), whereas the number of projected events are as estimated in the Census population projections.
Birth completeness rates are calculated as follows:
(1) Birth completeness rates = Number of registrered births within the year of occurance
Projected births in a year x 100
Equally, death completeness rates were calculated as:
(2) Dealth completeness rates = Number of registrered deaths within the year of occurance
Projected deaths in a year x 100
Birth completeness rates and death completeness rates are shown in Table 4.1 and Table 4.2 respectively. Events (Births and Deaths) registered within a year implies that the event was registered within 12 months from the time it occurred. Overall, there has been a steady improvement over time in both the birth and death completeness rates. Completeness rate for birth registration range between 15.6 percent in 2011 to 80.1 percent in 2017. On the other hand, the completeness rates for death registration ranged between 63.9 percent in 2011 to 76.0 percent in 2017. Furthermore, completeness of death registration increases, there were slight declines in the rates, namely in 2014 (67.5%) and in 2016 (73.0%).
Table 4. 1: Birth completeness rates by year, 2011 – 2017
YearBirths registered
within a year Projected birthsBirth completeness
rate2011 10 304 65 900 15.62012 20 856 66 731 31.32013 36 583 67 510 54.22014 39 681 68 218 58.22015 48 723 68 827 70.82016 55 136 69 322 79.52017 55 842 69 709 80.1
Namibia Vital Statistics Report work 2.indd 19Namibia Vital Statistics Report work 2.indd 19 23/02/2021 7:41 AM23/02/2021 7:41 AM

20 Namibia Vital Statistics Report- Registered Births, Deaths and Marriages for the period 2016 – 2017
Table 4. 2: Death completeness rates by year, 2011 – 2017
Year of occurrence
Deaths registered within a year Projected deaths
Death completeness rate
2011 17 387 27 205 63.92012 17 086 26 699 64.02013 18 651 26 249 71.12014 17 466 25 864 67.52015 19 411 25 537 76.02016 18 456 25 268 73.02017 19 031 25 045 76.0
In general, completeness rates for birth registration were found to be lower than that of death registration. However, the pattern changes from 2016 were birth completeness rates are observed to be higher than the death completeness rates. It is also worth noting that the gap, between the birth and death completeness rates has been narrowing reaching a minimum of 4.1 percent in 2017 (Figure 4.16).
0.0
20.0
40.0
60.0
80.0
100.0
10.0
30.0
50.0
70.0
90.0
2011 2012 2013 2014 2015 2016 2017
Com
plet
enes
s ra
te
Birth completeness rate Death completeness rate
Registration Year
Figure 4. 16: Completeness rates for registered births and deaths by year, 2011 – 2017
Namibia Vital Statistics Report work 2.indd 20Namibia Vital Statistics Report work 2.indd 20 23/02/2021 7:41 AM23/02/2021 7:41 AM

21Namibia Vital Statistics Report- Registered Births, Deaths and Marriages for the period 2016 – 2017
CHAPTER 5: BIRTHS
Registration of births or acquiring a birth certificate is essential as it is required for other public or private services, such as obtaining a national identification document, social services benefits, passport, driver’s license, utility services (water and electricity), and opening a bank account.
This chapter present information on birth registration trends, age and sex differentials, and place of birth occurrence and registration and parent’s characteristics.
5.1 Trends in birth registrations This section shows trends of registered births by sex, number of births that occurred, Registered, as well as Crude Birth Rates.
Table 5.1 shows the number of births occurred and births registered by sex from 2011 – 2017.
Table 5. 1: Births by year of occurrence, year of registration and sex
YearBirths Occurred Births Registered
Total Female Male Unknown Total Female Male Unknown2011 25 952 13 477 12 475 0 14 257 7 513 6 744 02012 42 822 22 214 20 606 2 32 535 17 156 15 379 02013 52 932 27 279 25 652 1 65 535 34 186 31 349 02014 53 407 26 925 26 481 1 76 531 39 502 37 029 02015 53 721 27 301 26 419 1 102 907 53 040 49 866 12016 41 843 20 967 20 875 1 106 386 54 523 51 857 62017 42 423 21 263 21 154 6 107 112 54 638 52 464 10
Figure 5.1 shows the number of registered births by sex and year of birth. There was no significant difference between the number of female and male births registered in a birth year.
Male Female
0
5 000
10 000
15 000
20 000
25 000
30 000
35 000
1990
1991
1992
1993
1994
1995
1996
1997
1998
1999
2000
2001
2002
2003
2004
2005
2006
2007
2008
2009
2010
2011
2012
2013
2014
2015
2016
2017
Num
ber
of b
irth
s
Birth year
Figure 5. 1: Registered births by sex and birth year: 1990 – 2017
Namibia Vital Statistics Report work 2.indd 21Namibia Vital Statistics Report work 2.indd 21 23/02/2021 7:41 AM23/02/2021 7:41 AM

22 Namibia Vital Statistics Report- Registered Births, Deaths and Marriages for the period 2016 – 2017
Figure 5.2 shows trends in the total number of births that occurred by comparing the datasets used in previous report (2017/18 VSR) and current report (2018/2019 VSR) for the period 1990 to 2017. It shows that there were slightly more records in the 2017 dataset compared to the 2016 dataset in the respective years.
Num
ber
of b
irth
s
Birth year
0
10 000
20 000
30 000
40 000
50 000
60 000
70 000
1990
1991
1992
1993
1994
1995
1996
1997
1998
1999
2000
2001
2002
2003
2004
2005
2006
2007
2008
2009
2010
2011
2012
2013
2014
2015
2016
2017
2017/18 VSR Total 2018/19 VSRTotal
Figure 5. 2: Number of births occurred - comparing 2017/18 VSR and 2018/19 TOTAL, 1990 – 2017
Figure 5.3 shows the number of registered births that occurred as well as the number of births registered within 12 months of occurrence. Comparison between number of births occurred and those registered shows that, fewer births were registered than those occurred in 2011 and 2012. In 2013, a change is observed where more births were registered compared to those occurred. It is noted that the number of births registered within 12 months from the time of occurrence have been increasing over the years.
Num
ber
of b
irth
s
Registration Year
20 000
40 000
60 000
80 000
100 000
120 000
2011 2012 2013 2014 2015 2016 2017
Births occurred Births registered Births registered within 12 months
Figure 5. 3: Registered births by year of occurrence and year of registration, 2011 – 2017
Namibia Vital Statistics Report work 2.indd 22Namibia Vital Statistics Report work 2.indd 22 23/02/2021 7:41 AM23/02/2021 7:41 AM

23Namibia Vital Statistics Report- Registered Births, Deaths and Marriages for the period 2016 – 2017
Crude Birth Rate (CBR) is the number of live births per 1,000 population in a given year.
CBR = Number of births in a year
Population of that year x 1000
Table 5.2 shows the Crude Birth Rate (CBR) for the registered births that occurred during the period 2011 to 2017. In general, a CBR of more than 30 births per 1,000 is considered high, while CBR of less than 18 births are considered low. According to the table, CBR in 2011 was lowest (12.3) and highest in 2013 (24.1), however, CBR has been declining in the last consecutive four years.
Table 5. 2: Crude Birth Rates (CBR) by year of birth, 2011 – 2017
Year Births Occurred Population CBR
2011 25 952 2 116 077 12.32012 42 822 2 155 440 19.92013 52 932 2 196 086 24.12014 53 407 2 237 894 23.92015 53 721 2 280 716 23.62016 41 843 2 324 388 18.02017 42 423 2 368 747 17.9
5.2 Age and Sex differentials for birthsAge at registration is one of the important measures to determine the registration timeliness. Birth registration is one of the key functions in a complete civil registration system and has been at the core of the world community’s concerns since the Universal Declaration of Human Rights in 1948. It has been a concern of UNICEF (which was founded in the same year) and of child-focused NGOs, as it represents the starting point for the recognition and protection of every child’s fundamental right to identity and existence. It refers to the permanent and official recording of a child’s existence by the state. Article 7 of the convention on the Rights of the child (1989) states that every child has the right to be registered at birth by the state according to UNICEF.
Figure 5.4 compares the number of registered births by age at registration and year of registration (2016, 2017). There were more registered births for those aged under one compared to any other age group for both periods.
Num
ber
of b
irth
s
Age at Registration
10 000
20 000
30 000
40 000
50 000
60 000
0
1-4
5-9
10-1
4
15-1
9
20 -2
4
25-2
9
30-3
4
35-3
9
40-4
4
45-4
9
50-5
4
55-5
9
60-6
4
65-6
9
70-7
4
75-7
9
80+
2016 2017
Figure 5. 4: Registered births by age at registration and registration year
Namibia Vital Statistics Report work 2.indd 23Namibia Vital Statistics Report work 2.indd 23 23/02/2021 7:41 AM23/02/2021 7:41 AM

24 Namibia Vital Statistics Report- Registered Births, Deaths and Marriages for the period 2016 – 2017
In general, the majority of the births registered are of those below the age of five. The proportion of children under five slightly decreased from 70.9 in 2016 to 67.5 in 2017 as shown in Figure 5.5
Num
ber
of b
irth
s
Registration Year
70.9 67.5
29.1 32.5
0.010.020.030.040.050.060.070.080.090.0
100.0
2016 2017
Below age 5 years 5 years and above
Figure 5. 5: Proportion of children under 5 years whose births have been registered, 2016 & 2017
Figure 5.6 shows proportion of children under five registered between 2011 and2017. Overall, the proportion of birth registrations for children under five accounts for over 65 percent for all the registrations. The proportion of projected population for children under 5 is much higher than the under 5 registered births, which may imply a low completeness rate for the children.
Num
ber
of b
irth
s
0.010.020.030.040.050.060.070.080.090.0
100.0
Estimated U5 proportion using total U5 projected populationProportion U5 out of total birth registrations
Registration Year
2011 2012 2013 2014 2015 2016 2017
Figure 5. 6: Proportion of children under five whose births have been registered, 2011 – 2017
Namibia Vital Statistics Report work 2.indd 24Namibia Vital Statistics Report work 2.indd 24 23/02/2021 7:41 AM23/02/2021 7:41 AM

25Namibia Vital Statistics Report- Registered Births, Deaths and Marriages for the period 2016 – 2017
A sex ratio is the proportion of males for every 100 females. A sex ratio of less than 100 means that there are more females than males.
Table 5.3 shows the number of registered births by sex, sex ratio and year of birth. The sex ratio for all the years is less than 100 with the exception of the year 2016; which implies that there were more female registered births than males.
Table 5. 3: Registered births by sex, sex ratio and year of occurrence
Year of Birth Total Female Male Unknown Sex Ratio1990 - 2010 101 290 53 161 48 128 1 91
2011 25 952 13 477 12 475 0 932012 42 822 22 214 20 606 2 932013 52 932 27 279 25 652 1 942014 53 407 26 925 26 481 1 982015 53 721 27 301 26 419 1 972016 41 843 20 967 20 875 1 1002017 42 423 21 263 21 154 6 99
5.3 Registered births by place of occurrence and registration This section looks at the number of registered births by region of occurrence, registration and type of birth facility where the birth occurred.
In 2016, six regions (Erongo, Kavango East, Khomas, Kunene, Omaheke, and Zambezi) registered over 90 percent of the births that occurred in those regions. Figure 5.7 also shows that most (close to 70 percent) of the births that occurred in Kavango West are registered elsewhere. See detailed table at annexure (Annexure Table 2).
//Kara
s
Erongo
Hardap
Kavan
go East
Kavan
go W
est
Khomas
Kunene
Ohangw
ena
Omaheke
Omusati
Oshan
a
Oshiko
to
Otjozo
ndjupa
Zambezi
Outside Nam
ibia
Unknown0%
10%20%30%40%50%60%70%80%90%
100%
Birth region same as registration region Registered not in same region of occurrenceRegion
Figure 5. 7: Percent registered births by region of birth and region of registration, 2016
Namibia Vital Statistics Report work 2.indd 25Namibia Vital Statistics Report work 2.indd 25 23/02/2021 7:41 AM23/02/2021 7:41 AM
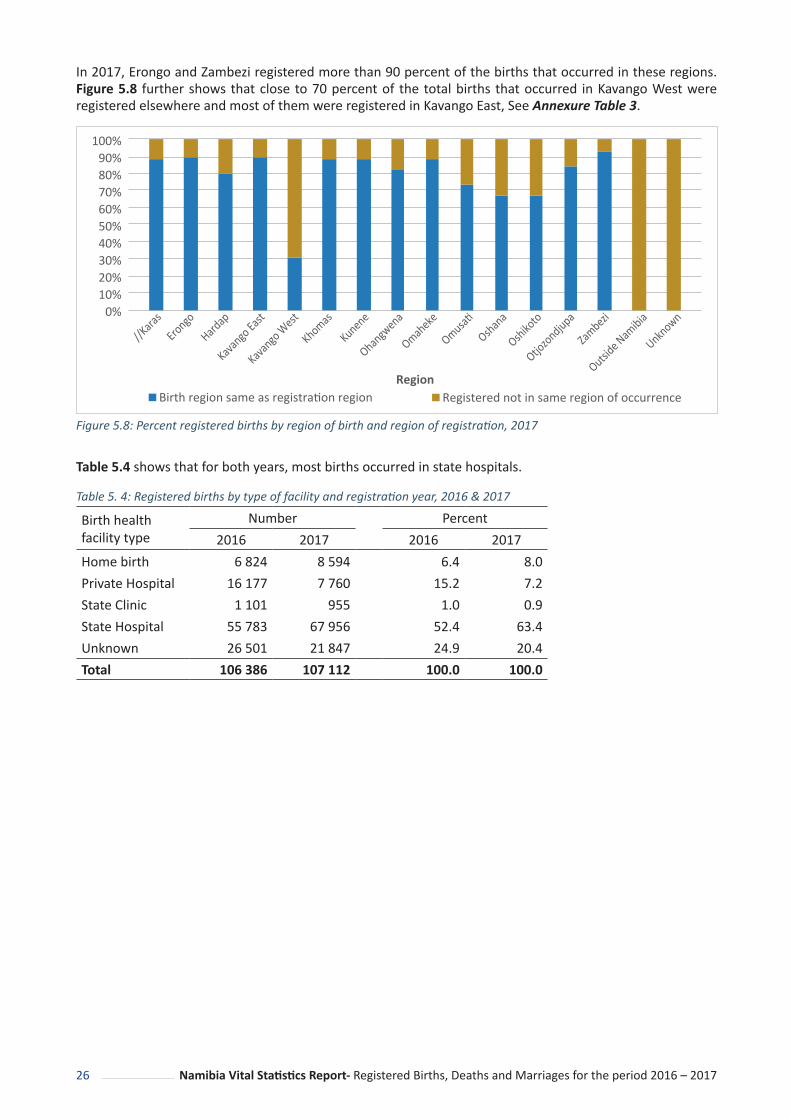
26 Namibia Vital Statistics Report- Registered Births, Deaths and Marriages for the period 2016 – 2017
In 2017, Erongo and Zambezi registered more than 90 percent of the births that occurred in these regions. Figure 5.8 further shows that close to 70 percent of the total births that occurred in Kavango West were registered elsewhere and most of them were registered in Kavango East, See Annexure Table 3.
Birth region same as registration region Registered not in same region of occurrenceRegion
//Kara
s
Erongo
Hardap
Kavan
go East
Kavan
go W
est
Khomas
Kunene
Ohangw
ena
Omaheke
Omusati
Oshan
a
Oshiko
to
Otjozo
ndjupa
Zambezi
Outside Nam
ibia
Unknown0%
10%20%30%40%50%60%70%80%90%
100%
Figure 5.8: Percent registered births by region of birth and region of registration, 2017
Table 5.4 shows that for both years, most births occurred in state hospitals.
Table 5. 4: Registered births by type of facility and registration year, 2016 & 2017
Birth health facility type
Number Percent2016 2017 2016 2017
Home birth 6 824 8 594 6.4 8.0Private Hospital 16 177 7 760 15.2 7.2State Clinic 1 101 955 1.0 0.9State Hospital 55 783 67 956 52.4 63.4Unknown 26 501 21 847 24.9 20.4Total 106 386 107 112 100.0 100.0
Namibia Vital Statistics Report work 2.indd 26Namibia Vital Statistics Report work 2.indd 26 23/02/2021 7:41 AM23/02/2021 7:41 AM

27Namibia Vital Statistics Report- Registered Births, Deaths and Marriages for the period 2016 – 2017
Figure 5.9 presents births registered within 12 months (timely) by type of birth facility where the births occurred and registration year. The graph shows that more births occurred in state health facilities, while least occurred at home for both years (2016 & 2017). There is an increase in the percent of timely birth registrations for births occurring in state health facilities while a decrease is observed in private health facilities.
0.0
20.0
40.0
60.0
80.0
100.0
Home birth Private health facility
State health facility
Unknown
Perc
ent
2016 2017
Birth facility
Figure 5. 9: Percent of births registered timely (within 12 months) by type of facility, 2016 & 2017
Figure 5.10 shows that most births registered late occurred in state health facilities, while least occurred in private health facilities for both years (2016 & 2017). There is an increase in the percent of late birth registrations for births occurring in state health facilities and at home.
Perc
ent
2016 2017
0.0
20.0
40.0
60.0
80.0
100.0
Home birth Private health facility
State health facility
Unknown
Birth facility
Figure 5. 10: Percent of births registered late by type of facility, 2016 & 2017
Namibia Vital Statistics Report work 2.indd 27Namibia Vital Statistics Report work 2.indd 27 23/02/2021 7:41 AM23/02/2021 7:41 AM
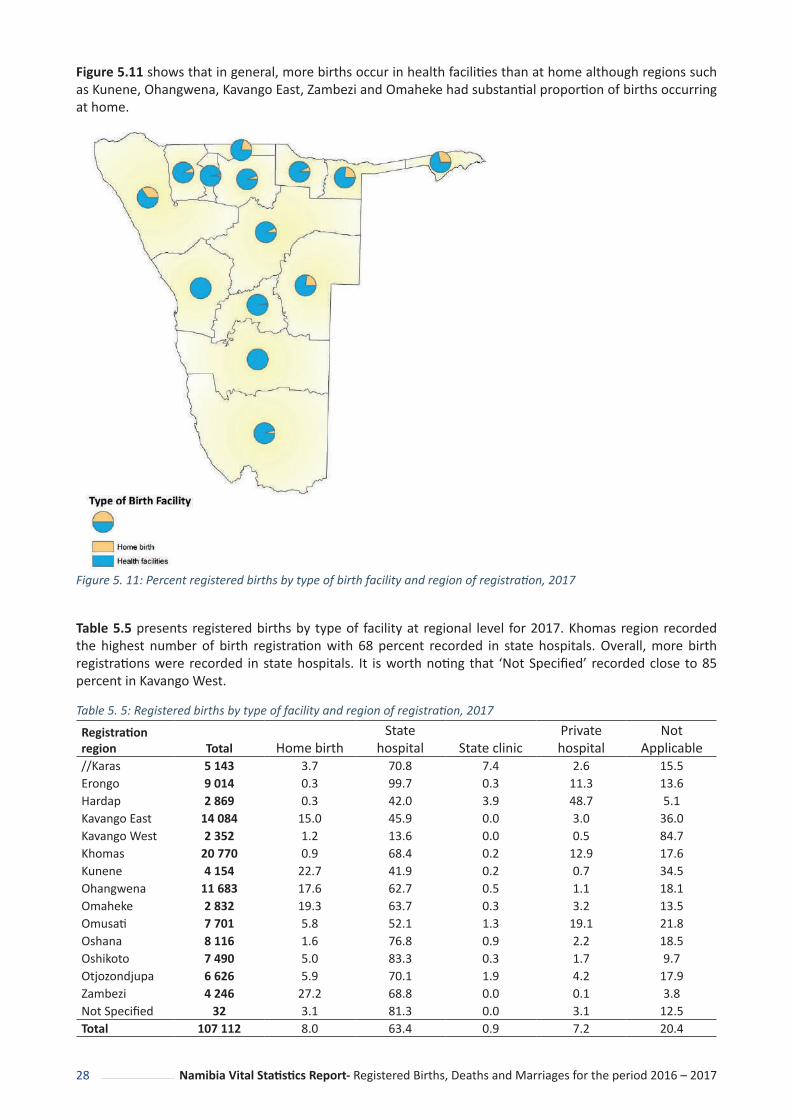
28 Namibia Vital Statistics Report- Registered Births, Deaths and Marriages for the period 2016 – 2017
Figure 5.11 shows that in general, more births occur in health facilities than at home although regions such as Kunene, Ohangwena, Kavango East, Zambezi and Omaheke had substantial proportion of births occurring at home.
Figure 5. 11: Percent registered births by type of birth facility and region of registration, 2017
Table 5.5 presents registered births by type of facility at regional level for 2017. Khomas region recorded the highest number of birth registration with 68 percent recorded in state hospitals. Overall, more birth registrations were recorded in state hospitals. It is worth noting that ‘Not Specified’ recorded close to 85 percent in Kavango West.
Table 5. 5: Registered births by type of facility and region of registration, 2017
Registration region Total Home birth
State hospital State clinic
Private hospital
Not Applicable
//Karas 5 143 3.7 70.8 7.4 2.6 15.5Erongo 9 014 0.3 99.7 0.3 11.3 13.6Hardap 2 869 0.3 42.0 3.9 48.7 5.1Kavango East 14 084 15.0 45.9 0.0 3.0 36.0Kavango West 2 352 1.2 13.6 0.0 0.5 84.7Khomas 20 770 0.9 68.4 0.2 12.9 17.6Kunene 4 154 22.7 41.9 0.2 0.7 34.5Ohangwena 11 683 17.6 62.7 0.5 1.1 18.1Omaheke 2 832 19.3 63.7 0.3 3.2 13.5Omusati 7 701 5.8 52.1 1.3 19.1 21.8Oshana 8 116 1.6 76.8 0.9 2.2 18.5Oshikoto 7 490 5.0 83.3 0.3 1.7 9.7Otjozondjupa 6 626 5.9 70.1 1.9 4.2 17.9Zambezi 4 246 27.2 68.8 0.0 0.1 3.8Not Specified 32 3.1 81.3 0.0 3.1 12.5Total 107 112 8.0 63.4 0.9 7.2 20.4
Namibia Vital Statistics Report work 2.indd 28Namibia Vital Statistics Report work 2.indd 28 23/02/2021 7:41 AM23/02/2021 7:41 AM
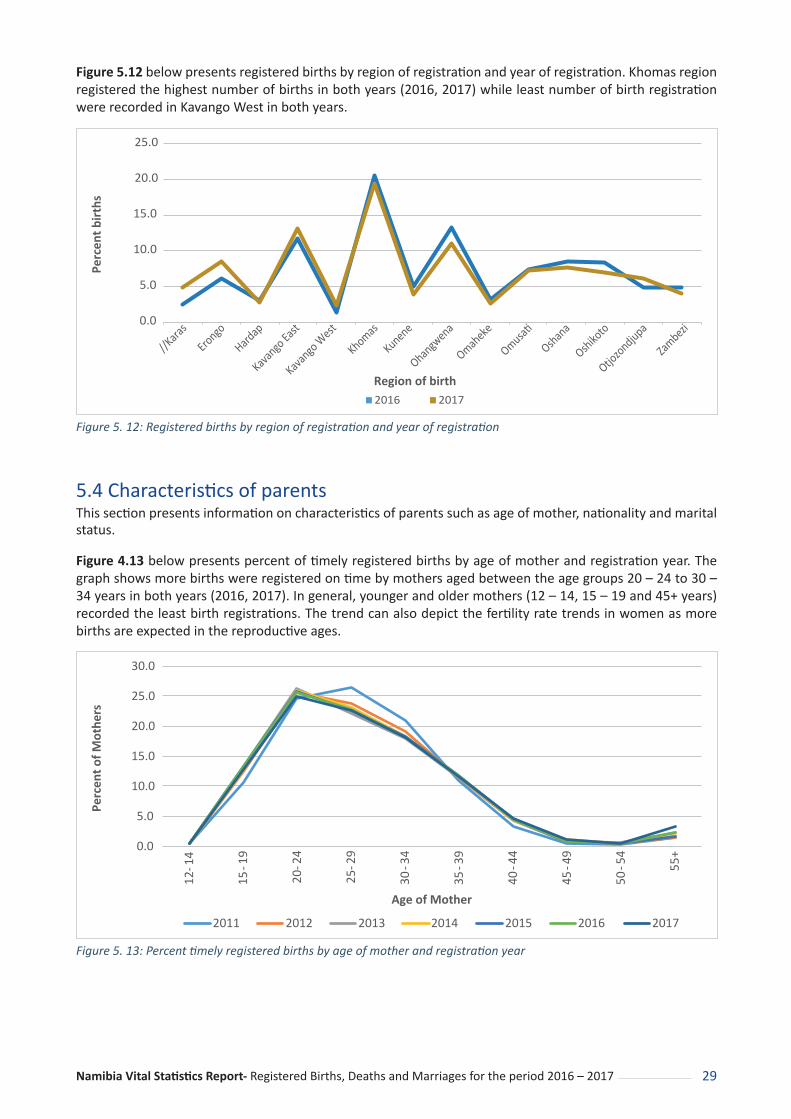
29Namibia Vital Statistics Report- Registered Births, Deaths and Marriages for the period 2016 – 2017
Figure 5.12 below presents registered births by region of registration and year of registration. Khomas region registered the highest number of births in both years (2016, 2017) while least number of birth registration were recorded in Kavango West in both years.
Region of birth
0.0
5.0
10.0
15.0
20.0
25.0
2016 2017
Perc
ent b
irth
s
//Kara
s
Erongo
Hardap
Kavan
go East
Kavan
go W
est
Khomas
Kunene
Ohangw
ena
Omaheke
Omusati
Oshan
a
Oshiko
to
Otjozo
ndjupa
Zambezi
Figure 5. 12: Registered births by region of registration and year of registration
5.4 Characteristics of parents This section presents information on characteristics of parents such as age of mother, nationality and marital status.
Figure 4.13 below presents percent of timely registered births by age of mother and registration year. The graph shows more births were registered on time by mothers aged between the age groups 20 – 24 to 30 – 34 years in both years (2016, 2017). In general, younger and older mothers (12 – 14, 15 – 19 and 45+ years) recorded the least birth registrations. The trend can also depict the fertility rate trends in women as more births are expected in the reproductive ages.
Age of Mother
Perc
ent
of M
othe
rs
0.0
5.0
10.0
15.0
20.0
25.0
30.0
12-1
4
15-1
9
20 -2
4
25-2
9
30-3
4
35-3
9
40-4
4
45-4
9
50-5
4
55+
2011 2012 2013 2014 2015 2016 2017
Figure 5. 13: Percent timely registered births by age of mother and registration year
Namibia Vital Statistics Report work 2.indd 29Namibia Vital Statistics Report work 2.indd 29 23/02/2021 7:41 AM23/02/2021 7:41 AM

30 Namibia Vital Statistics Report- Registered Births, Deaths and Marriages for the period 2016 – 2017
Table 5.6 presents marital status of parents by year of birth registration. The table shows that in general, more births were registered by unmarried parents (90.6%).
Table 5. 6: Parents’ marital status by year of birth registration, 2011 - 2017
Year of birth registration
Father MotherMarried Not Married Married Not Married
2011 280 13 605 267 13 6202012 1 138 30 347 1 118 30 3802013 1 699 59 592 1 678 59 6212014 2 387 67 145 2 370 67 1592015 2 932 89 521 2 909 89 5552016 2 894 96 169 2 881 96 2032017 2 490 96 987 2 490 96 987
Figure 5.14 presents the percent registered births by nationality of mothers and fathers in 2017. The graph shows that most of the births were registered by Namibian parents.
0.0
20.0
40.0
60.0
80.0
100.0
Namibia SADC Rest of Africa Other Countries Unknown
Perc
ent
Fathers Mothers
Nationality
Figure 5. 14: Percent registered births by nationality of mother and father, 2017
Namibia Vital Statistics Report work 2.indd 30Namibia Vital Statistics Report work 2.indd 30 23/02/2021 7:41 AM23/02/2021 7:41 AM

31Namibia Vital Statistics Report- Registered Births, Deaths and Marriages for the period 2016 – 2017
CHAPTER 6: DEATHS
This chapter presents information on the number of deaths recorded on NPRS at the Ministry of Home Affairs and Immigration. It also presents information on death registration trends, age and sex differentials, and registered deaths by place of occurrence, citizenship and marital status. Mortality indicators including infant mortality, neonatal mortality and child mortality are also presented. A death is considered registered upon issuing of a death certificate. Currently, the Namibian law does not permit a burial without a death certificate; this has a positive impact on the death data.
Although the focus year of registration of death is 2016 & 2017, some tables were presented including previous years (e.g. Table 6.1) to show trends. Data is for all deaths (citizens and non-citizens), regardless of where they occurred in the country.
6.1 Trends in death registrationsTable 6.1 shows a trend of deaths occurred and deaths registered by sex from 2011 – 2017. There were more male deaths and hence more male registration throughout 2011 to 2017
Table 6. 1: Deaths by year of occurrence, registration and sex
Death yearDeaths Occurred Deaths Registered
Female Male Unknown Female Male Unknown2011 7 966 9 619 0 8 064 9 659 02012 8 035 9 567 1 7 900 9 408 02013 8 765 10 460 0 8 785 10 375 02014 8 582 10 112 1 9 277 10 843 02015 8 559 10 053 1 9 541 11 164 12016 8 325 9 859 4 8 624 10 289 62017 8 467 10 282 4 9 231 10 987 11
Figure 6.1 shows the trend of death patterns over a time period (1990 – 2017). It shows the number of registered deaths by sex and death year for the period 1990 to 2017. The figure shows that between the periods under consideration, there were more male than female deaths registered over the years, with the highest number recorded in 2014 (11,057 females and 12,148 males) for both sexes.
Year of death
Male Female
Num
ber
of d
eath
s
0
2 000
4 000
6 000
8 000
10 000
12 000
14 000
1990
1991
1992
1993
1994
1995
1996
1997
1998
1999
2000
2001
2002
2003
2004
2005
2006
2007
2008
2009
2010
2011
2012
2013
2014
2015
2016
2017
Figure 6. 1: Registered deaths by sex and death year: 1990 – 2017
Namibia Vital Statistics Report work 2.indd 31Namibia Vital Statistics Report work 2.indd 31 23/02/2021 7:41 AM23/02/2021 7:41 AM

32 Namibia Vital Statistics Report- Registered Births, Deaths and Marriages for the period 2016 – 2017
Figure 6.2 shows trends in the total number of deaths that occurred comparing the datasets used in previous report (2017/18 VSR) and current report (2018/2019 VSR) for the period 1990 to 2017. It shows that there were more records in the current dataset compared to the previous dataset in the respective years. The gap narrows from the year 2010.
Death year
Male Female
Num
ber
of d
eath
s
0
5 000
10 000
15 000
20 000
25 000
19901991
19921993
19941995
19961997
19981999
20002001
20022003
20042005
20062007
20082009
20102011
20122013
20142015
20162017
Figure 6. 2: Number of deaths occurred - comparing 2017/18 VSR and 2018/19 TOTAL figures, 1990 – 2017
Figure 6.3 shows the number of registered deaths, deaths that occurred as well as deaths registered within 12 months of occurrence for the registration period 2011 to 2017. There were notable differences in the number of deaths that occurred and those registered between 2011 and 2012, where the figure shows that fewer deaths were registered compared to those that occurred. As from 2013, a change is observed where more deaths were registered compared to those occurring. The number of deaths registered within 12 months from the time of occurrence have been generally increasing except for a decline observed in 2014 and 2016.
Registration year
Num
ber
of d
eath
s
0
5 000
10 000
15 000
20 000
25 000
2011 2012 2013 2014 2015 2016 2017
Deaths occurred Deaths registered Deaths registered within 12 months
Figure 6. 3: Registered deaths by year of occurrence and year of registration, 2011 – 2017
Namibia Vital Statistics Report work 2.indd 32Namibia Vital Statistics Report work 2.indd 32 23/02/2021 7:41 AM23/02/2021 7:41 AM

33Namibia Vital Statistics Report- Registered Births, Deaths and Marriages for the period 2016 – 2017
Crude death rate (CDR) refer to the number of deaths occurring among the population of a given geographical area during a given year, per 1,000 mid-year total population of the given geographical area during the same year.
CDR = Number of deaths in a year
Population of that year x 1000
Table 6.2 shows the Crude Death Rates (CDR) by death year 2011 to 2017. The highest crude death rate (8.8) was observed in 2013, while the lowest (7.8) was observed in 2016 and 2017. A decline in the CDR from 2014 to 2017 was observed.
Table 6. 2: Crude Death Rates (CDR) by death year, 2011 – 2017
YearDeaths
OccurredProjected
Population CDR2011 17 585 2 116 077 8.32012 17 603 2 155 440 8.22013 19 225 2 196 086 8.82014 18 695 2 237 894 8.42015 18 613 2 280 716 8.22016 18 188 2 324 388 7.82017 18 441 2 368 747 7.8
Table 6.3 shows number of registered deaths by month and year of death from 2011 to 2017. The table shows that 2013 had the most deaths registered with most deaths having been registered in July.
Table 6. 3: Registered deaths by month and year of death, 2011 – 2017
Death MonthDeath Year
2011 2012 2013 2014 2015 2016 2017January 1 280 1 406 1 611 1 627 1 431 1 677 1 244February 1 138 1 286 1 318 1 362 1 242 1 443 1 360March 1 450 1 269 1 464 1 591 1 400 1 444 1 676April 1 458 1 250 1 394 1 597 1 345 1 505 1 469May 1 404 1 286 1 546 1 570 1 518 1 544 1 694June 1 594 1 464 1 602 1 623 1 688 1 524 1 551July 1 617 1 709 1 879 1 695 1 696 1 658 1 616August 1 545 1 576 1 763 1 687 1 681 1 740 1 814September 1 468 1 607 1 589 1 457 1 545 1 534 1 565October 1 558 1 664 1 747 1 459 1 730 1 448 1 551November 1 499 1 526 1 629 1 408 1 666 1 380 1 427December 1 574 1 560 1 683 1 619 1 671 1 291 1 474Total 17 585 17 603 19 225 18 695 18 613 18 188 18 441
Namibia Vital Statistics Report work 2.indd 33Namibia Vital Statistics Report work 2.indd 33 23/02/2021 7:41 AM23/02/2021 7:41 AM
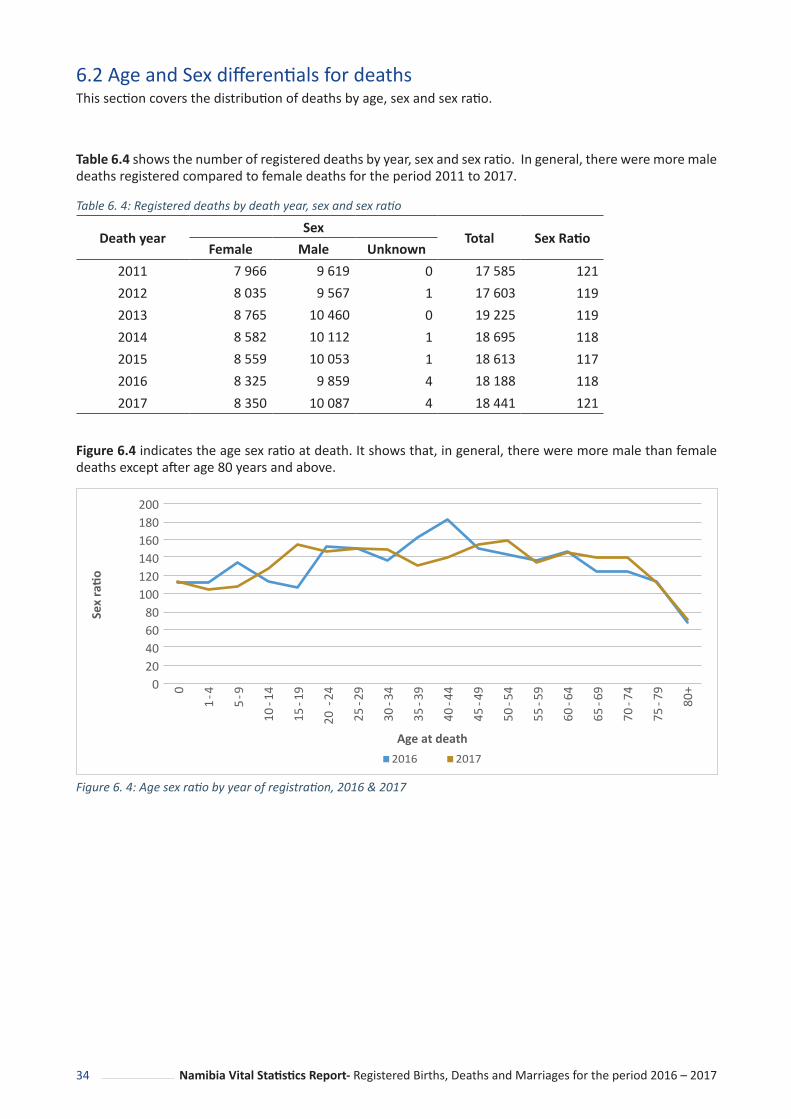
34 Namibia Vital Statistics Report- Registered Births, Deaths and Marriages for the period 2016 – 2017
6.2 Age and Sex differentials for deathsThis section covers the distribution of deaths by age, sex and sex ratio.
Table 6.4 shows the number of registered deaths by year, sex and sex ratio. In general, there were more male deaths registered compared to female deaths for the period 2011 to 2017.
Table 6. 4: Registered deaths by death year, sex and sex ratio
Death yearSex
Total Sex RatioFemale Male Unknown
2011 7 966 9 619 0 17 585 1212012 8 035 9 567 1 17 603 1192013 8 765 10 460 0 19 225 1192014 8 582 10 112 1 18 695 1182015 8 559 10 053 1 18 613 1172016 8 325 9 859 4 18 188 1182017 8 350 10 087 4 18 441 121
Figure 6.4 indicates the age sex ratio at death. It shows that, in general, there were more male than female deaths except after age 80 years and above.
Age at death
Sex
rati
o
020406080
100120140160180200
0
1-4
5-9
10-1
4
15-1
9
20 -
24
25-2
9
30-3
4
35-3
9
40-4
4
45-4
9
50-5
4
55-5
9
60-6
4
65-6
9
70-7
4
75-7
9
80+
2016 2017
Figure 6. 4: Age sex ratio by year of registration, 2016 & 2017
Namibia Vital Statistics Report work 2.indd 34Namibia Vital Statistics Report work 2.indd 34 23/02/2021 7:41 AM23/02/2021 7:41 AM

35Namibia Vital Statistics Report- Registered Births, Deaths and Marriages for the period 2016 – 2017
Figure 6.5 shows the number of registered deaths by grouped age groups and year of death. Most deaths were for the age groups 60 – 94, 15 – 59 and under 5s.
Perc
ent
deat
hs
2016 2017
Age group
21.8
2.1
39.1
32.7
4.3
21.6
2.2
40.5
31.6
4.1
0.0
5.0
10.0
15.0
20.0
25.0
30.0
35.0
40.0
45.0
Under 5 5 - 14 15 - 59 60 - 94 95+
Figure 6. 5: Percentage distribution of deaths by broad age groups and year of death
Figure 6.6 shows the number of registered deaths by sex, age and year of registration. The most deaths registered were observed among infants aged zero in both years. There were more male deaths than female deaths registered.
2016 2016
Male Female Male Female
95+
0500 5001000 10001500 15002000 2000 01000 10002000 2000
85-89
75-79
65-69
55-59
45-49
35-39
25-29
15-19
5-9
0
95+90-9485-8980-8475-7970-7465-6960-6455-5950-5445-4940-4435-3930-3425-2920-2415-1910-14
5-91-4
0
Figure 6. 6: Number of registered deaths by sex, age and year of registration, 2016 & 2017
Namibia Vital Statistics Report work 2.indd 35Namibia Vital Statistics Report work 2.indd 35 23/02/2021 7:41 AM23/02/2021 7:41 AM

36 Namibia Vital Statistics Report- Registered Births, Deaths and Marriages for the period 2016 – 2017
Figure 6.7 compares the number of deaths in civil records and the projected number of deaths. The number of observed deaths in CR and projected deaths were highest for the age group of 0 and 80 and above. The figure also shows the number of projected deaths were more than civil records in most of the age groups, except the age groups 1 – 4 and 65 – 69 years where the numbers are almost equal.
Age at death
Num
ber
of d
eath
s
0
500
1 000
1 500
2 000
2 500
3 000
3 500
4 000
4 5000
1-4
5-9
10-1
4
15-1
9
20 -2
4
25-2
9
30-3
4
35-3
9
40-4
4
45-4
9
50-5
4
55-5
9
60-6
4
65-6
9
70-7
4
75-7
9
80+
2017 CR deaths 2017 Projected deaths
Figure 6. 7: 2017 deaths according the CR data and projected deaths by age
Figure 6.8 shows the percentage distribution of deaths by age and year of death. In both years, the highest proportion of deaths consists mostly of younger and elderly people in the age groups 0 to 4 and 80 and above, followed by middle-aged individuals in the age group 30 to 49 years, which is clearly depicted by the “W-shape” graph.
Age
Perc
ent
2016 2017
02.04.06.08.0
10.012.014.016.018.020.0
0
1-4
5-9
10-1
4
15-1
9
20 -2
4
25-2
9
30-3
4
35-3
9
40-4
4
45-4
9
50-5
4
55-5
9
60-6
4
65-6
9
70-7
4
75-7
9
80+
Figure 6. 8: Percentage distribution of deaths by age and year of death, 2016 and 2017
Namibia Vital Statistics Report work 2.indd 36Namibia Vital Statistics Report work 2.indd 36 23/02/2021 7:41 AM23/02/2021 7:41 AM

37Namibia Vital Statistics Report- Registered Births, Deaths and Marriages for the period 2016 – 2017
6.3 Registered deaths by place of occurrence and registrationThis section will highlight where the deaths occurred and registered. Table 6.5 shows the registered deaths by region in which the death occurred in 2016 and 2017. Khomas region recorded the highest number of deaths.
Table 6. 5: Registered deaths by region of death and year of registration
Region of deathYear of Registration Percent
2016 2017 2016 2017//Karas 627 709 3.3 3.5Erongo 946 1 000 5.0 4.9Hardap 865 932 4.6 4.6Kavango East 1 816 1 686 9.6 8.3Kavango West 467 405 2.5 2.0Khomas 3 536 3 656 18.7 18.1Kunene 759 439 4.0 2.2Ohangwena 1 796 1 559 9.5 7.7Omaheke 699 677 3.7 3.3Omusati 1 828 1 759 9.7 8.7Oshana 2 047 2 906 10.8 14.4Oshikoto 1 653 2 042 8.7 10.1Otjozondjupa 970 1 472 5.1 7.3Zambezi 850 720 4.5 3.6Outside Namibia 36 75 0.2 0.4Not specified 24 192 0.1 0.9Total 18 919 20 229 100.0 100.0
Figure 6.9 and Figure 6.10 shows the proportion of deaths registered either in the same region of occurrence or registered in a different region where death occurred. In 2016, most deaths were not registered in the regions they occurred, see Figure 6.9. Khomas registered about 25 percent (the highest compared to all regions) of deaths that occurred in the region while the rest recorded less than 20 percent. See detailed table at Annexure Table 6.
Death region same as registration region Registered not in same region of occurrence
0%10%20%30%40%50%60%70%80%90%
100%
//Kara
s
Erongo
Hardap
Kavan
go East
Kavan
go W
est
Khomas
Not specifi
ed
Outside Nam
ibia
Kunene
Ohangw
ena
Omaheke
Omusati
Oshan
a
Oshiko
to
Otjozo
ndjupa
Zambezi
Figure 6. 9: Percent registered deaths by region of death and registration, 2016
Namibia Vital Statistics Report work 2.indd 37Namibia Vital Statistics Report work 2.indd 37 23/02/2021 7:41 AM23/02/2021 7:41 AM

38 Namibia Vital Statistics Report- Registered Births, Deaths and Marriages for the period 2016 – 2017
In 2017, the picture looks much more different as compared to 2016. Figure 6.10 shows that most deaths were registered in the regions they occurred. Only Kavango West registered the lowest (about 65 percent of deaths that occurred in the region were registered in the region) while the rest recorded above 85 percent. See Annexure Table 7
Otjozo
ndjupa
Omaheke
Death region same as registration region Registered not in same region of occurrence
//Kara
s
Erongo
Hardap
Kavan
go East
Kavan
go W
est
Khomas
Outside Nam
ibia
Unknown
Kunene
Ohangw
ena
Omusati
Oshan
a
Oshiko
to
Zambezi
0%10%20%30%40%50%60%70%80%90%
100%
Figure 6. 10: Percent registered deaths by region of death and registration, 2017
Table 6.6 shows that most registered deaths are those that occurred within the country while a few died elsewhere. It is notable that the number of deaths whose country of death was not specified has increased from 24 in 2016 to 192 in 2017.
Table 6. 6: Registered deaths by country of death and year of registration, 2011 - 2017
Registration Year
Death CountryTotal
Namibia SADCRest of Africa
Other countries
Not specified
2011 17 668 29 0 5 21 17 7232012 17 248 33 2 5 20 17 3082013 19 095 38 1 3 23 19 1602014 20 054 33 0 4 29 20 1202015 20 620 45 0 6 35 20 7062016 18 859 30 1 5 24 18 9192017 19 962 67 3 5 192 20 229
Namibia Vital Statistics Report work 2.indd 38Namibia Vital Statistics Report work 2.indd 38 23/02/2021 7:41 AM23/02/2021 7:41 AM

39Namibia Vital Statistics Report- Registered Births, Deaths and Marriages for the period 2016 – 2017
Table 6.7 shows the registered deaths by region in which the deaths were registered. Khomas registered the highest number of deaths for both years (23.7 percent in 2016 and 20.4 percent in 2017) while Kavango West registered the lowest number of deaths for both years (1.5 percent in 2016 and 1.4 percent in 2017).
Table 6. 7: Registered deaths by region of registration and year of registration
Region of death registration
Number of Deaths Percent2016 2017 2016 2017
//Karas 630 712 3.4 3.6Erongo 1 013 1 016 5.5 5.2Hardap 880 870 4.8 4.5Kavango East 1 977 1 807 10.8 9.3Kavango West 269 275 1.5 1.4Khomas 4 330 3 983 23.7 20.4Kunene 440 421 2.4 2.2Ohangwena 1 271 1 398 6.9 7.2Omaheke 751 716 4.1 3.7Omusati 1 708 1 580 9.3 8.1Oshana 2 388 3 341 13.1 17.1Oshikoto 1 557 1 939 8.5 9.9Otjozondjupa 927 1 427 5.1 7.3Zambezi 778 744 4.3 3.8Total 18 289 19 517 100.0 100.0
6.4 Registered deaths by citizenship and marital statusInformation on citizenship and marital status of persons concerned is important to help distinguish possible differentials in mortality.
Table 6.8 depicts the deceased’s citizenship at the time of death. As expected, Namibians are more than non-citizens. Records with unknown citizenship has been decreasing since 2011
Table 6. 8: Registered deaths by citizenship and year of registration, 2011 - 2017
Registration year Citizenship
TotalNamibia SADC
Rest of Africa
Other countries Unknown
2011 15 212 177 2 47 2 285 17 7232012 15 610 311 16 62 1 309 17 3082013 17 208 356 4 74 1 518 19 1602014 17 736 518 1 89 1 776 20 1202015 19 097 642 4 99 864 20 7062016 17 670 624 5 89 531 18 9192017 18 893 747 5 114 470 20 229
Namibia Vital Statistics Report work 2.indd 39Namibia Vital Statistics Report work 2.indd 39 23/02/2021 7:41 AM23/02/2021 7:41 AM

40 Namibia Vital Statistics Report- Registered Births, Deaths and Marriages for the period 2016 – 2017
Table 6.9 shows the number of deaths by marital status, most deaths occurred among single people.
Table 6. 9: Registered deaths by marital status and year of registration, 2011 - 2017
Registration YearMarital status
TotalSingle Married Divorced Widowed Other Unknown
2011 12 366 2 374 74 504 2 398 7 17 7232012 11 834 2 535 91 595 2 059 194 17 3082013 13 877 2 561 81 692 1 916 33 19 1602014 14 645 2 657 83 618 2 110 7 20 1202015 15 272 2 868 98 663 1 793 12 20 7062016 13 757 2 822 116 833 1 339 52 18 9192017 14 429 3 356 138 1 287 1 004 15 20 229
6.5 Neonatal, Infant and Child deathsPreserving the lives of new-borns has been a long-standing issue in the public health, social policy, and humanitarian endeavours. Thus reporting on the occurrence of deaths among children is important for the provision of indicators of the overall physical health of a country. Deaths in children are usually classified in three categories such as neonatal, infant and child deaths.
Neonatal deaths are deaths of neonates dying before reaching 28 days of age, while infant deaths are deaths of babies less than one year of age and child deaths refers to the death of children under the age of five. It is expected that infant deaths and child deaths be higher than neonatal deaths because they are a subset of the infants and children.
Figure 6.11 presents the percent distribution of neonatal, infant and child deaths registered in 2016 & 2017. Of all deaths registered in 2017, about 10 percent were neonatal while infant deaths made up about 17 percent and child deaths were about 22 percent.
Perc
ent
deat
hs
0.0
5.0
10.0
15.0
20.0
25.0
Neonatal Infant Child
Figure 6. 11: Percent registered neonatal, infant and child deaths, 2017
6.5.1 Neonatal deathsThe infant mortality rate is an important indicator of the overall health of a society. It is widely used as a measure of population health and the quality of health care. Neonatal deaths are deaths of neonates dying before reaching 28 days.
Table 6.10 shows all registered age-specific neonatal deaths by sex as well as the age-specific sex ratio in 2017. The sex ratio is calculated as the number of male deaths per 100 female deaths. It can be observed from the table that most babies die before they are a day old, while in general the number of neonatal deaths decrease as the babies get older. In general, there were more male neonatal deaths than females.
Namibia Vital Statistics Report work 2.indd 40Namibia Vital Statistics Report work 2.indd 40 23/02/2021 7:41 AM23/02/2021 7:41 AM

41Namibia Vital Statistics Report- Registered Births, Deaths and Marriages for the period 2016 – 2017
Table 6. 10: Registered neonatal deaths by age and sex ratio, 2017
Age at death in days
SexTotal Sex ratio
Female Male Unknown0 577 646 9 1 232 1121 81 110 0 191 1362 60 73 0 133 1223 46 48 0 94 1044 22 39 0 61 1775 20 42 0 62 2106 9 23 0 32 2567 14 27 0 41 1938 14 14 0 28 1009 18 12 0 30 67
10 14 9 0 23 6411 8 9 0 17 11312 7 11 0 18 15713 10 10 0 20 10014 11 12 0 23 10915 9 9 0 18 10016 9 8 0 17 8917 8 7 0 15 8818 10 9 0 19 9019 5 8 0 13 16020 6 7 0 13 11721 7 6 0 13 8622 9 6 0 15 6723 9 0 0 9 024 3 5 0 8 16725 2 4 0 6 20026 5 8 0 13 16027 2 1 0 3 50
Total 995 1 163 9 2 167 117
Namibia Vital Statistics Report work 2.indd 41Namibia Vital Statistics Report work 2.indd 41 23/02/2021 7:41 AM23/02/2021 7:41 AM

42 Namibia Vital Statistics Report- Registered Births, Deaths and Marriages for the period 2016 – 2017
Figure 6.12 shows that in general, there are more male neonatal deaths than female at most ages.
Age at death (in days)
Sex
Rati
o
Sex ratio at death
0
50
100
150
200
250
300
0 1 2 3 4 5 6 7 8 9 10 11 12 13 14 15 16 17 18 19 20 21 22 23 24 25 26 27
Figure 6. 12: Age -Sex ratio for neonatal deaths, 2017
Regional differences for neonatal deaths by sex and sex ratio is shown in Table 6.11. Khomas region registered the highest number of neonatal deaths (529 neonatal deaths) while Kavango West recorded the least number of neonatal deaths (37 neonatal deaths).
Table 6. 11: Registered neonatal deaths by region of death, sex and sex ratio, 2017
Death regionSex
Total Sex ratioFemale Male Unknown
//Karas 31 39 0 70 126Erongo 50 56 0 106 112Hardap 32 28 0 60 88Kavango East 88 120 0 208 136Kavango West 20 17 0 37 85Khomas 222 301 6 529 136Kunene 20 30 0 50 150Ohangwena 44 32 0 76 73Omaheke 26 38 0 64 146Omusati 57 72 0 129 126Oshana 181 188 2 371 104Oshikoto 105 113 0 218 108Otjozondjupa 94 101 1 196 107Zambezi 17 21 0 38 124Unknown 8 7 0 15 88Total 995 1 163 9 2 167 117
Namibia Vital Statistics Report work 2.indd 42Namibia Vital Statistics Report work 2.indd 42 23/02/2021 7:41 AM23/02/2021 7:41 AM

43Namibia Vital Statistics Report- Registered Births, Deaths and Marriages for the period 2016 – 2017
Figure 6.13 shows the number of neonatal deaths by sex and region. Most of the regions registered more neonatal deaths for males than females, except for Hardap, Kavango West and Ohangwena where more female deaths were registered.
Death Region
Num
ber
of N
eona
tal D
eath
s
2016 2017
0
50
100
150
200
250
300
350
Otjozo
ndjupa
Omaheke
//Kara
s
Erongo
Hardap
Kavan
go East
Kavan
go W
est
Khomas
Kunene
Ohangw
ena
Omusati
Oshan
a
Oshiko
to
Zambezi
Figure 6. 13: Registered neonatal deaths by region and sex, 2017
Figure 6.14. Shows the sex ratio of registered neonatal deaths by region of registration year 2017, Kunene and Omaheke regions have the highest sex ratio.
Death Region
Sex
Rati
o
N
20
40
60
80
100
120
140
160
Otjozo
ndjupa
Omaheke
//Kara
s
Erongo
Hardap
Kavan
go East
Kavan
go W
est
Khomas
Kunene
Ohangw
ena
Omusati
Oshan
a
Oshiko
to
Zambezi
Figure 6. 14: Sex ratio for registered neonatal deaths by region, 2017
6.5.2 Infant deathsThe Infant Mortality Rate (IMR) is the number of deaths of children before their first birthday per 1,000 live births. It is a target in the Sustainable Development Goals, goal 3 for countries to ensure healthy lives and promote well-being for all at all ages. Therefore, it is a crude indicator of health status, poverty and socioeconomic status in a community, as well as the availability and quality of health services and medical technology amongst others.
Namibia Vital Statistics Report work 2.indd 43Namibia Vital Statistics Report work 2.indd 43 23/02/2021 7:41 AM23/02/2021 7:41 AM

44 Namibia Vital Statistics Report- Registered Births, Deaths and Marriages for the period 2016 – 2017
Infant Mortality Rate (IMR) is calculated as:
IMR =
Number of infant deaths in a given year
Total live births in that year x 1000 live births
The number of infant deaths by death year, sex and sex ratio is presented in Table 6.12. Most infant deaths occurred in 2013. The sex ratio also shows more male infant deaths than female infant deaths for the period 2011 – 2017.
Table 6. 12: Registered infant death by sex and sex ratio, 2011 – 2017
Death YearSex
Total Sex ratioFemale Male Unknown
2011 1 212 1 347 0 2 559 1112012 1 272 1 340 1 2 610 1052013 1 497 1 688 0 3 184 1132014 1 338 1 537 1 2 876 1152015 1 430 1 519 0 2 947 1062016 1 396 1 538 4 2 935 1102017 1 042 1 121 0 2 163 108
Table 6.13 shows infant mortality rates by year. The results show that IMR has increased between 2011 and 2017, 2017 being the highest with, 50.1 infant deaths per 1,000 live births and 2011 being the lowest with 38.8 infant deaths per 1,000 live births). In general, there were more infant deaths amongst males than females over the years.
Table 6. 13: Infant Mortality Rates (IMR) by year, 2011 – 2017
Death Year Sex Infant
deathsProjected
births IMR
Female Male Unknown2011 1 213 1 347 0 2 560 65 900 38.8
2012 1 272 1 340 1 2 613 66 731 39.2
2013 1 497 1 688 0 3 185 67 510 47.22014 1 338 1 537 1 2 876 68 218 42.22015 1 430 1 519 0 2 949 68 827 42.82016 1 396 1 538 4 2 938 69 322 42.42017 1 634 1 851 9 3 494 69 709 50.1
Namibia Vital Statistics Report work 2.indd 44Namibia Vital Statistics Report work 2.indd 44 23/02/2021 7:41 AM23/02/2021 7:41 AM

45Namibia Vital Statistics Report- Registered Births, Deaths and Marriages for the period 2016 – 2017
Figure 6.15 reflects infant deaths by region and year of occurrence. Khomas region has the highest number of infant deaths (502 infant deaths in 2016 and 709 infant deaths in 2017). There was a decrease in the number of registered Infant deaths in Kavango West, Kunene, Zambezi, Ohangwena, Omusati and Kavango East region.
Death Region
Infa
nt d
eath
s
Outside Nam
ibia
Otjozo
ndjupa
Omaheke
//Kara
s
Erongo
Hardap
Kavan
go East
Kavan
go W
est
Khomas
Kunene
Ohangw
ena
Omusati
Oshan
a
Oshiko
to
Zambezi
0
100
200
300
400
500
600
700
800
2016 2017
Figure 6. 15: Registered infant deaths by region and year of death
6.5.3 Child deathsThe child mortality rate is a leading indicator of the level of child health and overall development in countries. The rate is expressed as the number of deaths of children under five per 1,000 live births.
Child Mortality Rate (CMR) is calculated as:
CMR = x 1,000 live births
CMR =
Number of deaths for children aged 0-4 years in a given year
Total live births in that year x 1000 live births
Table 6.14. shows the number of registered child deaths by sex, sex ratio and year of registration. The highest number of child deaths were registered in 2017 (4,421 child deaths), while the lowest number of child deaths were recorded in 2012 (3,263 child deaths). In general, there were more male deaths among children than female deaths as shown by the sex ratio over the years. The table also shows that the number of child deaths are increasing over time.
Table 6. 14: Registered child deaths by sex and sex ratio, 2011 – 2017
Registration Year
SexTotal Sex ratioFemale Male Unknown
2011 1 681 1 812 0 3 493 1082012 1 584 1 679 0 3 263 1062013 1 932 2 077 0 4 009 1082014 1 888 2 024 0 3 912 1072015 1 996 2 187 1 4 184 1102016 1 932 2 154 5 4 091 1112017 2 086 2 326 9 4 421 112
Namibia Vital Statistics Report work 2.indd 45Namibia Vital Statistics Report work 2.indd 45 23/02/2021 7:41 AM23/02/2021 7:41 AM
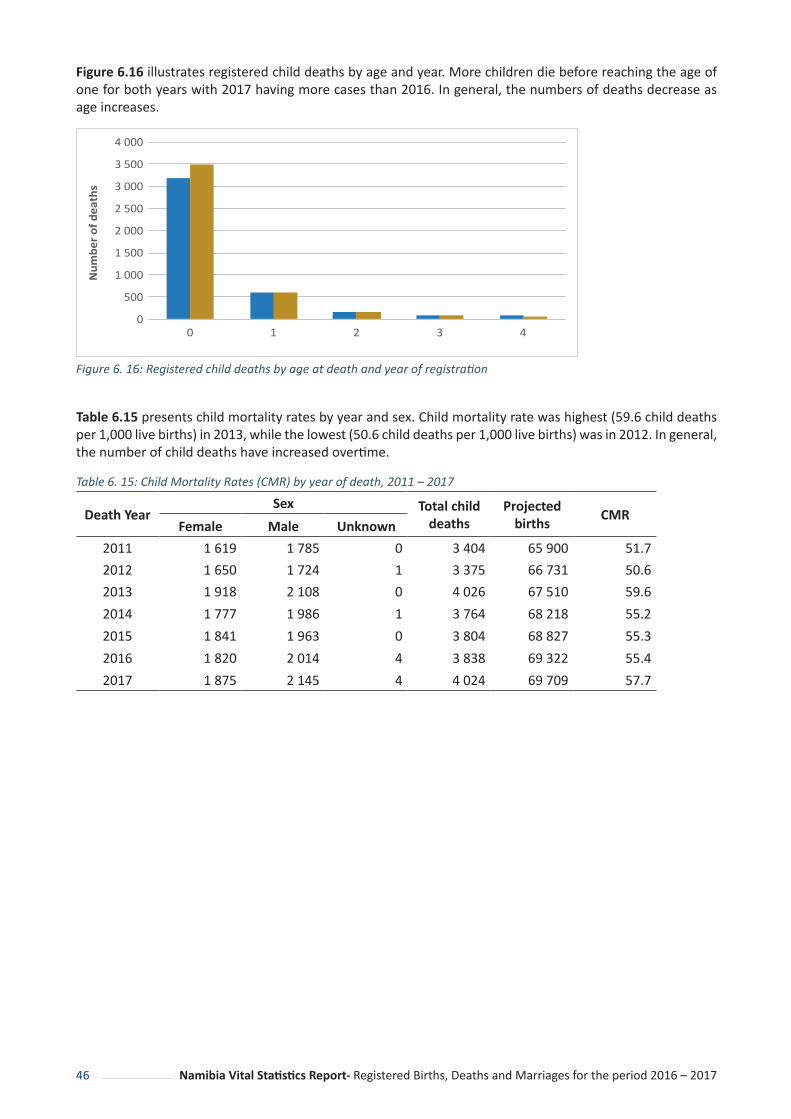
46 Namibia Vital Statistics Report- Registered Births, Deaths and Marriages for the period 2016 – 2017
Figure 6.16 illustrates registered child deaths by age and year. More children die before reaching the age of one for both years with 2017 having more cases than 2016. In general, the numbers of deaths decrease as age increases.
Num
ber
of d
eath
s
2016 2017
Age at death in years
0
500
1 000
1 500
2 000
2 500
3 000
3 500
4 000
0 1 2 3 4
Figure 6. 16: Registered child deaths by age at death and year of registration
Table 6.15 presents child mortality rates by year and sex. Child mortality rate was highest (59.6 child deaths per 1,000 live births) in 2013, while the lowest (50.6 child deaths per 1,000 live births) was in 2012. In general, the number of child deaths have increased overtime.
Table 6. 15: Child Mortality Rates (CMR) by year of death, 2011 – 2017
Death Year Sex Total child
deathsProjected
births CMRFemale Male Unknown
2011 1 619 1 785 0 3 404 65 900 51.72012 1 650 1 724 1 3 375 66 731 50.62013 1 918 2 108 0 4 026 67 510 59.62014 1 777 1 986 1 3 764 68 218 55.22015 1 841 1 963 0 3 804 68 827 55.32016 1 820 2 014 4 3 838 69 322 55.42017 1 875 2 145 4 4 024 69 709 57.7
Namibia Vital Statistics Report work 2.indd 46Namibia Vital Statistics Report work 2.indd 46 23/02/2021 7:41 AM23/02/2021 7:41 AM

47Namibia Vital Statistics Report- Registered Births, Deaths and Marriages for the period 2016 – 2017
Figure 6.17 shows child deaths by region and year. Khomas region had the highest number of child deaths (683 in 2016 and 830 in 2017). A decline in the number of child deaths is observed for Kavango West, Kunene, Zambezi, Ohangwena, Omusati and Kavango East.
Death Region
Num
ber
of C
hild
Dea
ths
Not Nam
ibia
Not Specifi
ed
Otjozo
ndjupa
Omaheke
//Kara
s
Erongo
Hardap
Kavan
go East
Kavan
go W
est
Khomas
Kunene
Ohangw
ena
Omusati
Oshan
a
Oshiko
to
Zambezi
2016 2017
0
100
200
300
400
500
600
700
800
900
Figure 6. 17: Registered child deaths by region and year
Namibia Vital Statistics Report work 2.indd 47Namibia Vital Statistics Report work 2.indd 47 23/02/2021 7:41 AM23/02/2021 7:41 AM
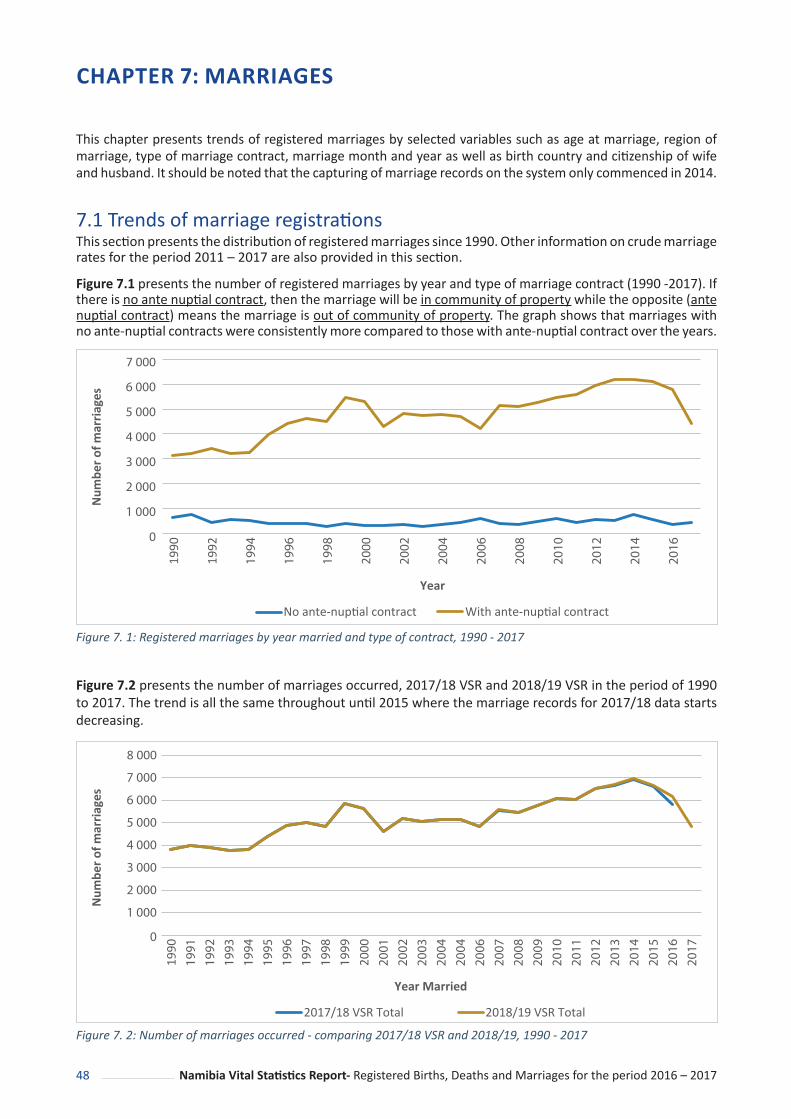
48 Namibia Vital Statistics Report- Registered Births, Deaths and Marriages for the period 2016 – 2017
CHAPTER 7: MARRIAGES
This chapter presents trends of registered marriages by selected variables such as age at marriage, region of marriage, type of marriage contract, marriage month and year as well as birth country and citizenship of wife and husband. It should be noted that the capturing of marriage records on the system only commenced in 2014.
7.1 Trends of marriage registrations This section presents the distribution of registered marriages since 1990. Other information on crude marriage rates for the period 2011 – 2017 are also provided in this section.
Figure 7.1 presents the number of registered marriages by year and type of marriage contract (1990 -2017). If there is no ante nuptial contract, then the marriage will be in community of property while the opposite (ante nuptial contract) means the marriage is out of community of property. The graph shows that marriages with no ante-nuptial contracts were consistently more compared to those with ante-nuptial contract over the years.
Year
Num
ber
of m
arri
ages
No ante-nuptial contract With ante-nuptial contract
0
1 000
2 000
3 000
4 000
5 000
6 000
7 000
1990
1992
1994
1996
1998
2000
2002
2004
2006
2008
2010
2012
2014
2016
Figure 7. 1: Registered marriages by year married and type of contract, 1990 - 2017
Figure 7.2 presents the number of marriages occurred, 2017/18 VSR and 2018/19 VSR in the period of 1990 to 2017. The trend is all the same throughout until 2015 where the marriage records for 2017/18 data starts decreasing.
Year Married
Num
ber
of m
arri
ages
2017/18 VSR Total 2018/19 VSR Total
1 000
0
2 000
3 000
4 000
5 000
6 000
7 000
8 000
1990
1991
1992
1993
1994
1995
1996
1997
1998
1999
2000
2001
2002
2003
2004
2004
2006
2007
2008
2009
2010
2011
2012
2013
2014
2015
2016
2017
Figure 7. 2: Number of marriages occurred - comparing 2017/18 VSR and 2018/19, 1990 - 2017
Namibia Vital Statistics Report work 2.indd 48Namibia Vital Statistics Report work 2.indd 48 23/02/2021 7:41 AM23/02/2021 7:41 AM

49Namibia Vital Statistics Report- Registered Births, Deaths and Marriages for the period 2016 – 2017
The crude marriage rate is the number of marriages occurring among the population during a given year, per 1,000 mid-year total population of a given geographical area during the same year.
Table 7.1 presents registered marriages by year married and crude marriage rates from 2011 to 2017. The table shows that there was a decrease in the crude rate due to the decrease in number of marriages as opposed to increase in the annual population projected.
Table 7. 1: Registered marriages by year married and crude marriage rates, 2011 - 2017
Marriage yearNumber of marriages
Projected population
Crude Marriage Rate
2011 5 976 2 116 077 2.82012 6 397 2 155 440 3.02013 6 613 2 196 086 3.02014 6 879 2 237 894 3.12015 6 471 2 280 716 2.82016 3 335 2 324 388 1.42017 2 818 2 368 747 1.2
Figure 7.3 shows the change in crude marriage rates by year. A decrease is observed from year 2014 to 2017.
Crud
e M
arri
age
Rat
e
Year
0.0
0.5
1.0
1.5
2.0
2.5
3.0
3.5
2011 2012 2013 2014 2015 2016 2017
Figure 7. 3: Crude marriage rates by year, 2011 – 2017
Figure 7.4 presents the number of registered marriages by marriage month and year of occurrence. It can be seen from the graph that in 2016, most marriages occurred in August whereas in 2017, most of the marriages took place in May.
Namibia Vital Statistics Report work 2.indd 49Namibia Vital Statistics Report work 2.indd 49 23/02/2021 7:41 AM23/02/2021 7:41 AM

50 Namibia Vital Statistics Report- Registered Births, Deaths and Marriages for the period 2016 – 2017
Month married
Num
ber
of m
arri
ages
January
February
March
AprilMay
JuneJuly
August
September
October
November
December
2016 2017
100
0
200
300
400
500
600
700
Figure 7. 4: Registered marriages by marriage month and year
7.2 Age differentials in MarriagesThis section presents information on age at marriage for wives and husbands. Figure 7.5 presents age at marriage for wife and husband by year. In general, for both years, both men and women tend to get married from the ages 20 – 24 to 45 – 49, as illustrated by the figure.
2016 2016
Wife Husband
3000 2000 1000 0 1000 2000 3000
20-24
25-29
30-34
35-39
40-44
45-49
50-54
55-59
60-64
65-69
70-74
75-79
80+
60 000 20 000 20 000 60 000
15-19
20-24
25-29
30-34
35-39
40-44
45-49
50-54
55-59
60-64
65-69
70-74
75-79
80+
Wife Husband
Figure 7. 5: Age at marriage for wife and husband by year married, 2016 & 2017
Namibia Vital Statistics Report work 2.indd 50Namibia Vital Statistics Report work 2.indd 50 23/02/2021 7:41 AM23/02/2021 7:41 AM

51Namibia Vital Statistics Report- Registered Births, Deaths and Marriages for the period 2016 – 2017
7.3 Marriage registrations by place of occurrence and nationalityThe section presents registered marriages by place of occurrence and nationality. Figure 7.6 shows percent registered marriages by region married and year captured. Khomas region registered the highest number of marriages in both years (19.9 percent for 2016 and 22.6 for 2017) while Kavango West registered the least (1.2 percent in 2016 and 0.8 percent in 2017).
Region married
Prec
ent
Not Nam
ibia
Not Specifi
ed
Otjozo
ndjupa
Omaheke
//Kara
s
Erongo
Hardap
Kavan
go East
Kavan
go W
est
Khomas
Kunene
Ohangw
ena
Omusati
Oshan
a
Oshiko
to
Zambezi
2016 2017
0.0
5.0
10.0
15.0
20.0
25.0
Figure 7. 6: Percent registered marriages by region married and year captured
Table 7.2 presents registered marriages by nationality of husband and wife in 2017. The table shows that most marriages registered (7 558) were between Namibian citizens, followed by those between Namibian husbands and wives who are of SADC nationality (616).
Table 7. 2: Registered marriages by nationality of husband and wife, 2017
Husband’s nationality
Wife’s nationalityTotal
Namibia SADC Rest of Africa
Other Countries Unknown
Namibia 7 558 616 3 52 120 8 349SADC 11 317 1 5 2 336Rest of Africa 0 41 2 1 0 44Other Countries 0 98 1 45 0 144Unknown 45 98 1 1 53 198
Namibia Vital Statistics Report work 2.indd 51Namibia Vital Statistics Report work 2.indd 51 23/02/2021 7:41 AM23/02/2021 7:41 AM

52 Namibia Vital Statistics Report- Registered Births, Deaths and Marriages for the period 2016 – 2017
CONCLUSIONA well-functioning CRVS system has statistical advantages over censuses and sample surveys. It provides reliable disaggregated data at any geographical or administrative level, at a relatively low cost. Data obtained through complete and accurate civil registration processes are not subject to sampling errors and contain relatively few response errors. In addition to the legal, administrative, and statistical advantages, CRVS systems play an important role in monitoring the Sustainable Development Goals (SDGs) at regional and global levels (UNSD, 2014). Data from complete and accurate CRVS systems can also provide information used to monitor other targets and indicators.
The birth and death completeness rates have improved over the years (2011 – 2017). Completeness rates for births was lowest with 15.6 percent in 2011 and highest with 80.1 percent in 2017. The death completeness rates were lowest in 2011 with 63.9 percent and highest in 2015 and 2017 with 76 percent. Completeness rates for deaths are generally higher than that of births. While notable improvements were observed over the years, the completeness rates for Namibia are still lower than the SDG target as per indicator 17.19.2(b) which aims at achieving 100 percent birth registration and 80 percent death registration.
In general, the quality of the data has improved though not significantly from 2016 to 2017 for the variables that were analysed such as: records registered before they occurred (which resulted in negative ages at death, at birth registration or marriage), unknown registration offices, unknown sex, husband’s sex registered as female and vice versa, as well as unknown registration year. The proportion of errors in the births data increased by 0.01 percent (0.05 percent in 2016 to 0.06 percent in 2017) and errors in death data decreased by 0.28 percent (3.19 percent in 2016 to 2.91 percent in 2017) while errors in marriage data increased by 0.62 percent (1.19 percent in 2016 to 1.81 percent in 2017).
The number of registered births and deaths has increased between 2016 and 2017 while number of marriages has decreased.
In terms of timeliness where events are registered within 12 months (timely) of occurring, there are more deaths registered timely compared to births. Timely death registrations were 97.6 percent in 2016 and 94.1 percent in 2017, while timely birth registrations were 51.8 percent in 2016 and 52.1 percent in 2017. Timely death registrations have slightly decreased while timely birth registration has slightly increased.
Mortality statistics can be used to measure the quality of health in a country. Analysis shows that there is a decrease in crude death rates for the deaths that occurred from 2011 to 2017. The lowest CDR was 7.8 in 2016 and 2017 and highest in 2013 with 8.8 deaths per 1,000 population. Deaths among children under-five are increasing over the years. Under-five mortality rates were found to be lowest (50.6) in 2012 and highest (59.6) in 2013, decreased in 2014 to 55.2 and stands at 57.7 in 2017.
There is a lot that the country needs to do to improve under-five mortality as the estimated figures for Namibia are much higher than what is aimed for in the SDGs (target 3.2), which intends to reduce under – five mortality to at least as low as 25 per 1,000 live births by 2030. In addition, the inconsistencies in these trends call for further investigation in order to address the root cause of under – five mortality.
The number of marriages that occurred per 1,000 population indicate that marriages are decreasing over the years.
There is room to improve the quality of the data as recommended by the UN principles and recommendations for vital statistics in order to compile detailed statistics needed for evidence-based planning from the administrative data.
8.1 Challenges1. Not all recommended tables by the UN principles and recommendation could be produced due to data
limitation (some key variables missing in NPRS). See annex II;2. Indicators such as Age Specific Fertility Rate and Total Fertility Rate cannot be computed from the
available CR data. The system cannot establish from the data as to how many births women in specific ages have;
3. Time-consuming manual process data cleaning activities (for variables such as place of death/birth/marriage) due to lack of or wrong information on region of event occurrence;
4. There are cases (0.01%) in death data for marital status variable in the categories “Other”; 5. High number (20.4%) of records whose facility birth type is unknown;
Namibia Vital Statistics Report work 2.indd 52Namibia Vital Statistics Report work 2.indd 52 23/02/2021 7:41 AM23/02/2021 7:41 AM

53Namibia Vital Statistics Report- Registered Births, Deaths and Marriages for the period 2016 – 2017
6. There were records found with default date of occurrence 01/01/1900;7. There are still cases of records with Unknown Registration office where the event was registered;8. There is no divorce data available on NPRS.
8.2 Recommendations1. Revise civil registration forms (births, deaths and marriages) to include missing recommended
variables (see annexure II);2. Set the system to be able to bring out children born alive to mother during her entire reproductive
lifetime; 3. Record information accurately on place, constituency and region of birth/marriage/death; 4. Revise marital status categories as per recommended standards to avoid category “other”; 5. Remove category “Not Applicable” as type of birth facility; 6. Reduce data quality issues by implementing edit checks fields in the system; 7. Collect information on divorces based on recommended form;8. Collect information on education attainment for mother;9. Collect information on employment status (employed or unemployed) of mother;10. Collect information on education attainment for deceased;11. Collect information on employment status (employed or unemployed) for deceased;12. Collect information on mother’s usual place of residence;13. Collect information on deceased’s usual place of residence;14. Collect information on education attainment for bride and groom;15. Collect information on employment status (employed or unemployed) for bride and groom;16. Set Registration office name and region as a default in the system based on location to avoid the
clerk selecting.
Namibia Vital Statistics Report work 2.indd 53Namibia Vital Statistics Report work 2.indd 53 23/02/2021 7:41 AM23/02/2021 7:41 AM

54 Namibia Vital Statistics Report- Registered Births, Deaths and Marriages for the period 2016 – 2017
ANNEXURE
Figure 1: Flow diagram for Civil Registration data processing
Namibia Vital Statistics Report work 2.indd 54Namibia Vital Statistics Report work 2.indd 54 23/02/2021 7:41 AM23/02/2021 7:41 AM

55Namibia Vital Statistics Report- Registered Births, Deaths and Marriages for the period 2016 – 2017
Annex I: Tables
Births
Table 1: Number of births occurred - comparing 2017/18 VSR and 2018/19 TOTAL figures, 1990 – 2017
Birth year
2017/18 VSR Total
2018/19 VSR Total
Birth year
2017/18 VSR Total
2018/19 VSR Total
1990 1 504 2 223 2004 4 240 5 9111991 1 439 2 090 2005 5 264 7 0171992 2 014 2 775 2006 6 403 8 3461993 2 299 3 139 2007 8 131 10 2061994 2 511 3 454 2008 9 716 11 8691995 2 615 3 498 2009 12 160 14 8001996 3 050 4 161 2010 14 801 22 2721997 3 120 4 263 2011 25 952 29 5341998 3 490 4 966 2012 42 822 47 4871999 3 768 5 547 2013 52 932 57 3452000 3 515 5 117 2014 53 407 58 9212001 3 308 4 753 2015 53 721 60 5752002 3 645 5 157 2016 41 843 59 9022003 4 031 5 551 2017 - 49 282
Namibia Vital Statistics Report work 2.indd 55Namibia Vital Statistics Report work 2.indd 55 23/02/2021 7:41 AM23/02/2021 7:41 AM

56 Namibia Vital Statistics Report- Registered Births, Deaths and Marriages for the period 2016 – 2017
Tabl
e 2:
Reg
ister
ed b
irths
by
regi
on o
f birt
h an
d re
gist
ratio
n, 2
016
Regi
on o
f bi
rth
Regi
stra
tion
Regi
on
Tota
l//
Kara
sEr
ongo
Hard
apKa
vang
o Ea
stKa
vang
o W
est
Khom
asKu
nene
Oha
ngw
ena
Om
ahek
eO
mus
atiO
shan
aO
shik
oto
Otjo
zond
jupa
Zam
bezi
Not
Sp
ecifi
ed
//Ka
ras
2099
2336
130
108
712
1112
235
106
023
65
Eron
go14
5127
88
021
922
4326
3153
2555
90
5640
Hard
ap38
2926
956
019
34
729
48
317
21
3036
Kava
ngo
East
105
5521
9468
281
293
1019
2916
720
115
610
1050
0
Kava
ngo
Wes
t27
1915
2536
1167
118
77
91
417
307
139
65
Khom
as10
227
515
862
016
297
5413
728
010
311
967
211
230
1788
8
Kune
ne5
393
51
9947
7015
2574
2712
490
051
24
Oha
ngw
ena
4319
730
320
1731
3411
815
1714
264
838
013
26
315
210
Om
ahek
e4
1410
20
175
55
2829
146
511
20
3082
Om
usati
4617
726
140
679
115
231
2866
5954
078
795
186
78
Osh
ana
3214
218
210
560
8975
314
660
5844
364
579
285
65
Osh
ikot
o39
214
2138
464
625
972
1610
615
9477
3411
08
511
532
Otjo
zond
jupa
1589
1583
137
195
3475
3238
8143
146
052
49
Zam
bezi
1210
655
022
00
82
66
721
4858
052
11
Out
side
Nam
ibia
01
01
043
012
20
71
01
068
Unk
now
n8
610
346
6117
278
1945
1512
50
273
Tota
l25
8964
1730
7212
378
1460
2181
352
5414
097
3400
7879
8969
8814
5223
5008
1310
6386
Namibia Vital Statistics Report work 2.indd 56Namibia Vital Statistics Report work 2.indd 56 23/02/2021 7:41 AM23/02/2021 7:41 AM

57Namibia Vital Statistics Report- Registered Births, Deaths and Marriages for the period 2016 – 2017
Tabl
e 3:
Reg
ister
ed b
irths
by
regi
on o
f birt
h an
d oc
curr
ence
, 201
7
Regi
on o
f birt
hRe
gist
ratio
n Re
gion
Tota
l//
Kara
sEr
ongo
Hard
apKa
vang
o Ea
stKa
vang
o W
est
Khom
asKu
nene
Oha
ngw
ena
Om
ahek
eO
mus
atiO
shan
aO
shik
oto
Otjo
zond
jupa
Zam
bezi
Not
Sp
ecifi
ed
//Ka
ras
3 66
494
6714
120
03
139
1522
621
80
4 13
7
Eron
go73
6 42
617
171
368
1450
1523
5733
590
07
153
Hard
ap16
310
62
452
61
282
65
205
714
182
03
087
Kava
ngo
East
156
106
339
490
332
300
813
308
1226
122
232
10 6
61
Kava
ngo
Wes
t63
3020
4 11
51
982
151
712
61
217
574
06
467
Khom
as27
353
415
160
416
238
6712
123
411
411
585
316
219
18 3
42
Kune
ne27
144
36
010
33
670
1415
7226
1870
10
4 16
9
Oha
ngw
ena
150
334
4045
665
222
9 70
711
116
473
156
993
1111
825
Om
ahek
e27
449
50
158
56
2 38
88
95
427
02
713
Om
usati
183
375
2926
072
614
816
619
6 58
246
688
994
48
915
Osh
ana
143
266
1533
146
988
618
1462
45
758
449
874
38
572
Osh
ikot
o12
628
913
3710
560
2489
210
861
077
6 50
314
53
19
776
Otjo
zond
jupa
5122
27
772
348
7933
4128
4272
5 45
79
06
468
Zam
bezi
3535
659
315
42
23
311
727
4 15
20
4 49
9
Out
side
Nam
ibia
33
14
030
22
01
71
11
056
Unk
now
n6
66
909
319
2917
1532
106
42
272
Tota
l5
143
9 01
42
869
14 0
842
352
20 7
704
154
11 6
832
832
7 70
18
116
7 49
06
626
4 24
632
107
112
Namibia Vital Statistics Report work 2.indd 57Namibia Vital Statistics Report work 2.indd 57 23/02/2021 7:41 AM23/02/2021 7:41 AM

58 Namibia Vital Statistics Report- Registered Births, Deaths and Marriages for the period 2016 – 2017
Table 4: Registered births by age and year of registration
Age at Registration
Year of birth registration2016 2017
0 54 220 549661 - 4 21 200 173725 - 9 10 671 927410 - 14 5 685 565015 - 19 4 359 530520 - 24 2 435 320425 - 29 1 353 203630 - 34 894 145535 - 39 630 114540 - 44 559 91845 - 49 824 107950 - 54 854 124155 - 59 935 127760 - 64 900 101765 - 69 326 41870 - 74 177 23475 - 79 151 22080+ 213 301
DeathsTable 5: Number of deaths occurred - comparing 2017/18 VSR and 2018/19 TOTAL figures, 1990 – 2017
Death year
2017/18 VSR Total
2018/19 VSR Total
Death year
2017/18 VSR Total
2018/19 VSR Total
1990 19 5 740 2004 90 23 205
1991 23 5 349 2005 80 21 878
1992 8 6 120 2006 68 20 743
1993 28 7 113 2007 75 19 067
1994 31 7 974 2008 170 18 443
1995 19 8 835 2009 182 17 450
1996 51 10 791 2010 524 17 751
1997 64 11 997 2011 17 585 17 738
1998 494 12 784 2012 17 603 17 908
1999 63 14 627 2013 19 225 19 585
2000 47 17 091 2014 18 695 19 184
2001 163 19 999 2015 18 613 19 498
2002 82 21 189 2016 18 188 19 286
2003 1 540 22 393 2017 - 18 753
Namibia Vital Statistics Report work 2.indd 58Namibia Vital Statistics Report work 2.indd 58 23/02/2021 7:41 AM23/02/2021 7:41 AM
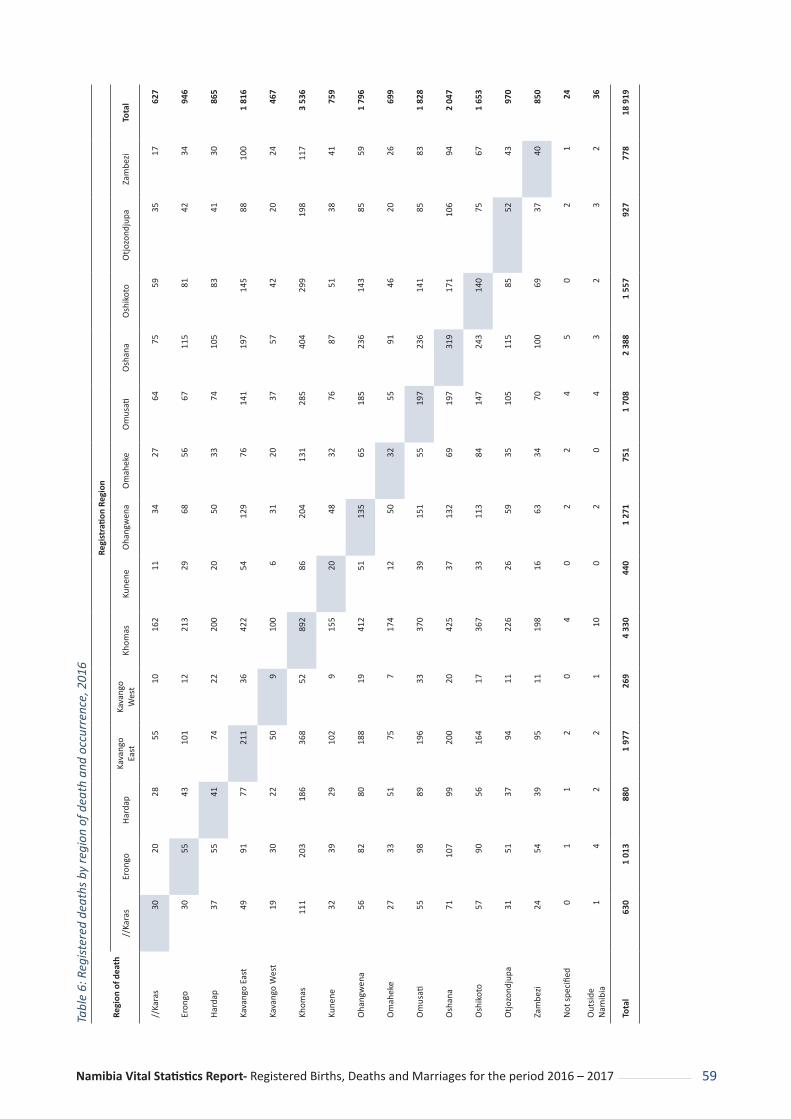
59Namibia Vital Statistics Report- Registered Births, Deaths and Marriages for the period 2016 – 2017
Tabl
e 6:
Reg
ister
ed d
eath
s by
regi
on o
f dea
th a
nd o
ccur
renc
e, 2
016
Regi
on o
f dea
thRe
gist
ratio
n Re
gion
//Ka
ras
Eron
goHa
rdap
Kava
ngo
East
Kava
ngo
Wes
tKh
omas
Kune
neO
hang
wen
aO
mah
eke
Om
usati
Osh
ana
Osh
ikot
oO
tjozo
ndju
paZa
mbe
ziTo
tal
//Ka
ras
3020
2855
1016
211
3427
6475
5935
1762
7
Eron
go30
5543
101
1221
329
6856
6711
581
4234
946
Hard
ap37
5541
7422
200
2050
3374
105
8341
3086
5
Kava
ngo
East
4991
7721
136
422
5412
976
141
197
145
8810
01
816
Kava
ngo
Wes
t19
3022
509
100
631
2037
5742
2024
467
Khom
as11
120
318
636
852
892
8620
413
128
540
429
919
811
73
536
Kune
ne32
3929
102
915
520
4832
7687
5138
4175
9
Oha
ngw
ena
5682
8018
819
412
5113
565
185
236
143
8559
1 79
6
Om
ahek
e27
3351
757
174
1250
3255
9146
2026
699
Om
usati
5598
8919
633
370
3915
155
197
236
141
8583
1 82
8
Osh
ana
7110
799
200
2042
537
132
6919
731
917
110
694
2 04
7
Osh
ikot
o57
9056
164
1736
733
113
8414
724
314
075
671
653
Otjo
zond
jupa
3151
3794
1122
626
5935
105
115
8552
4397
0
Zam
bezi
2454
3995
1119
816
6334
7010
069
3740
850
Not
spec
ified
01
12
04
02
24
50
21
24
Out
side
Nam
ibia
14
22
110
02
04
32
32
36
Tota
l63
01
013
880
1 97
726
94
330
440
1 27
175
11
708
2 38
81
557
927
778
18 9
19
Namibia Vital Statistics Report work 2.indd 59Namibia Vital Statistics Report work 2.indd 59 23/02/2021 7:41 AM23/02/2021 7:41 AM

60 Namibia Vital Statistics Report- Registered Births, Deaths and Marriages for the period 2016 – 2017
Tabl
e 7:
Reg
ister
ed d
eath
s by
regi
on o
f dea
th a
nd o
ccur
renc
e, 2
017
Regi
on o
f dea
thRe
gion
of r
egis
trati
on
//Ka
ras
Eron
goHa
rdap
Kava
ngo
East
Kava
ngo
Wes
tKh
omas
Kune
neO
hang
wen
aO
mah
eke
Om
usati
Osh
ana
Osh
ikot
oO
tjozo
ndju
paZa
mbe
ziTo
tal
//Ka
ras
681
102
00
70
06
00
02
170
9
Eron
go0
979
00
011
20
21
02
30
1 00
0
Hard
ap8
085
00
048
10
190
01
50
932
Kava
ngo
East
00
01
661
65
10
10
00
39
1 68
6
Kava
ngo
Wes
t0
00
120
265
150
00
00
12
240
5
Khom
as10
516
31
3 58
82
113
13
013
03
656
Kune
ne0
10
00
2838
80
011
64
10
439
Oha
ngw
ena
01
03
04
21
346
028
165
91
01
559
Om
ahek
e2
10
00
113
065
60
10
30
677
Om
usati
00
00
040
920
21
512
158
171
01
759
Osh
ana
00
02
016
312
014
2 81
246
10
2 90
6
Osh
ikot
o0
00
00
160
81
217
21
841
20
2 04
2
Otjo
zond
jupa
15
00
069
31
21
212
1 37
33
1 47
2
Zam
bezi
00
05
05
00
00
00
071
072
0
Out
side
Nam
ibia
67
16
034
12
23
80
41
75
Unk
now
n4
71
73
866
812
714
613
1819
2
Tota
l71
21
016
870
1 80
727
53
983
421
1 39
871
61
580
3 34
11
939
1 42
774
420
229
Namibia Vital Statistics Report work 2.indd 60Namibia Vital Statistics Report work 2.indd 60 23/02/2021 7:41 AM23/02/2021 7:41 AM

61Namibia Vital Statistics Report- Registered Births, Deaths and Marriages for the period 2016 – 2017
Marriages
Table 8: Number of marriages occurred - comparing 2017/18 VSR and 2018/19 TOTAL figures, 1990 - 2017
Year married
2017/18 VSR Total
2018/19 VSR Total
1990 3 832 3 8331991 4 003 4 0051992 3 884 3 8841993 3 790 3 7911994 3 834 3 8351995 4 383 4 3851996 4 870 4 8711997 5 031 5 0341998 4 831 4 8341999 5 870 5 8742000 5 638 5 6402001 4 634 4 6382002 5 197 5 1982003 5 043 5 0462004 5 158 5 1622005 5 137 5 1392006 4 851 4 8522007 5 574 5 5772008 5 446 5 4502009 5 758 5 7592010 6 071 6 0762011 6 021 6 0282012 6 521 6 5392013 6 676 6 7182014 6 937 6 9762015 6 598 6 6752016 5 793 6 1532017 - 4 859
Namibia Vital Statistics Report work 2.indd 61Namibia Vital Statistics Report work 2.indd 61 23/02/2021 7:41 AM23/02/2021 7:41 AM

62 Namibia Vital Statistics Report- Registered Births, Deaths and Marriages for the period 2016 – 2017
Annex II: Topics and Themes recommended by UN
Topics and themes to be investigated for vital statistics purposes through the civil registration systems
Live Birth
Number
Topic Available from civil
registration of birth
Available from other
sources
Not available Year(s) available
(i) Characteristic of the event a Date of occurrence Y N 2011-2017b Date of registration Y N 2011-2017c Place of occurrence Y Y 2011-2017d Locality of occurrence Y Y 2011-2017e Urban/rural occurrence Y Y 2011-2017f Place of registration Y N 2011-2017g Type of birth (i.e., single, twin,
triplet, quadruplet or higher multiple delivery)
N Y 2011-2017
h Attendant at birth N Y 2011-2017i Type of place of occurrence (hospital,
home, etc.) Y N 2011-2017
(ii) Characteristics of the new-born a Sex Y Y 2011-2017b Weight at birth N Y 2011-2017
(iii) Characteristics of the mother a Date of birth Y Y 2011-2017b Age Y Y 2011-2017c Marital status Y Y 2011-2017d Child born in wedlock (legitimacy
status of the child) N N Y 2011-2017
e Educational attainment N Y 2011-2017f Literacy status N Y 2011-2017g Ethnic and/or national group N N Y 2011-2017h Citizenship Y Y 2011-2017i Economic activity status N Y 2011-2017j Usual occupation N Y 2011-2017k Socioeconomic status N Y 2011-2017l Place of usual residence N Y 2011-2017
m Locality of residence Y Y 2011-2017n Urban/rural residence Y Y 2011-2017o Duration of residence in usual place N Y 2011-2017p Place of previous residence N Y 2011-2017q Place/country of birth Y Y 2011-2017r Migrant status N Y 2011-2017s Date of last menstrual cycle of the
mother N Y 2011-2017
Namibia Vital Statistics Report work 2.indd 62Namibia Vital Statistics Report work 2.indd 62 23/02/2021 7:41 AM23/02/2021 7:41 AM

63Namibia Vital Statistics Report- Registered Births, Deaths and Marriages for the period 2016 – 2017
t Gestational age N Y 2011-2017u Number of prenatal visits N Y 2011-2017v Month of pregnancy prenatal care
began N Y 2011-2017
w Children born alive to mother during her entire lifetime
N Y 2011-2017
x Birth order or parity N Y 2011-2017y Foetal deaths to mother during her
entire lifetime N Y 2011-2017
z Date of last previous live birth N Y 2011-2017aa Foetal deaths to mother during her
entire lifetime N Y 2011-2017
ab Date of last previous live birth N Y 2011-2017ac Interval since last previous live birth N Y 2011-2017ad Date of marriage Y N 2011-2017ae Duration of marriage N N Y 2011-2017
(iv) Characteristics of the father (if known) 2011-2017
a Date of birth Y Y 2011-2017b Age Y Y 2011-2017c Marital status Y Y 2011-2017d Educational attainment N Y 2011-2017e Literacy status N Y 2011-2017f Ethnic and/or national group N N Y 2011-2017g Citizenship Y Y 2011-2017h Economic activity status N Y 2011-2017i Usual occupation N Y 2011-2017j Socioeconomic status N Y 2011-2017k Place of usual residence N Y 2011-2017l Locality of residence Y Y 2011-2017
m Urban/rural residence Y Y 2011-2017(v) Characteristics of population at risk (see United Nations (2014, p. 48)
Death
Number
Topic Available from civil
registration of births
Available from other
sources
Not available Year(s) available
(i) Characteristics of the event a Date of occurrence Y Y 2011-2017
b Date of registration Y N 2011-2017c Place of occurrence Y Y 2011-2017d Locality of occurrence Y Y 2011-2017e Urban/rural occurrence Y Y 2011-2017f Place of registration Y N 2011-2017g Cause of death Y Y 2011-2017h Manner of death N Y 2011-2017
Namibia Vital Statistics Report work 2.indd 63Namibia Vital Statistics Report work 2.indd 63 23/02/2021 7:41 AM23/02/2021 7:41 AM
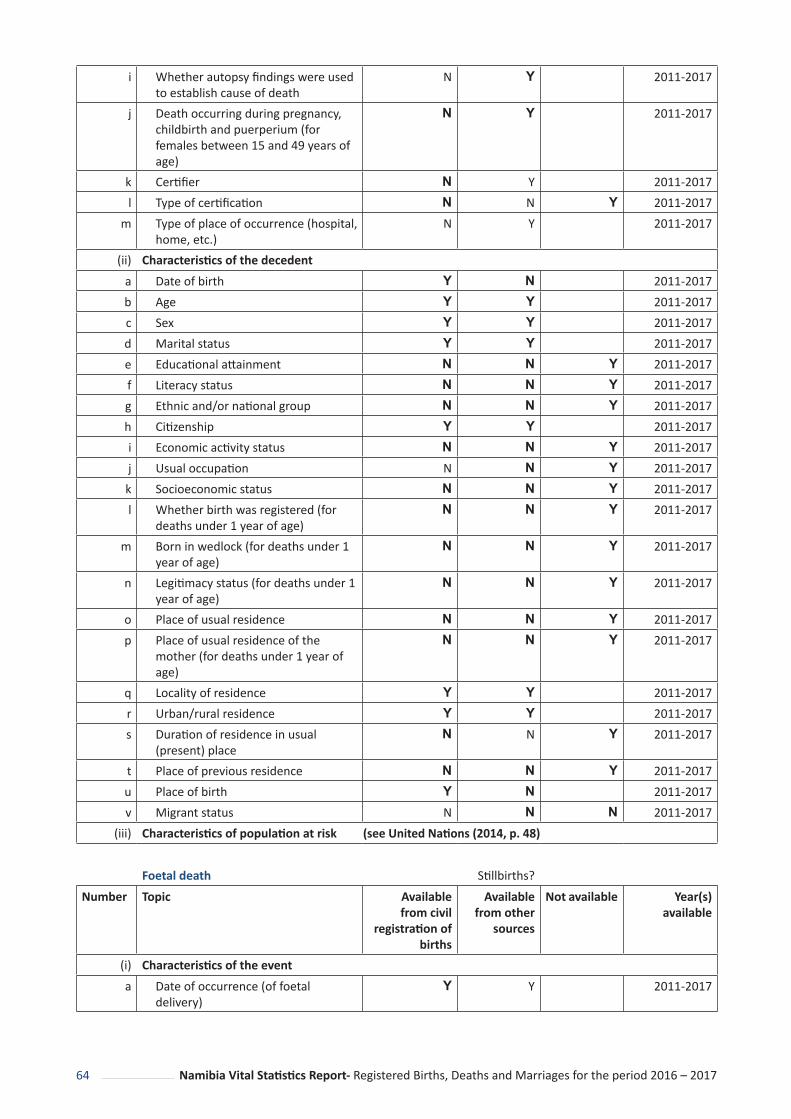
64 Namibia Vital Statistics Report- Registered Births, Deaths and Marriages for the period 2016 – 2017
i Whether autopsy findings were used to establish cause of death
N Y 2011-2017
j Death occurring during pregnancy, childbirth and puerperium (for females between 15 and 49 years of age)
N Y 2011-2017
k Certifier N Y 2011-2017l Type of certification N N Y 2011-2017
m Type of place of occurrence (hospital, home, etc.)
N Y 2011-2017
(ii) Characteristics of the decedent a Date of birth Y N 2011-2017b Age Y Y 2011-2017c Sex Y Y 2011-2017d Marital status Y Y 2011-2017e Educational attainment N N Y 2011-2017f Literacy status N N Y 2011-2017g Ethnic and/or national group N N Y 2011-2017h Citizenship Y Y 2011-2017i Economic activity status N N Y 2011-2017j Usual occupation N N Y 2011-2017k Socioeconomic status N N Y 2011-2017l Whether birth was registered (for
deaths under 1 year of age) N N Y 2011-2017
m Born in wedlock (for deaths under 1 year of age)
N N Y 2011-2017
n Legitimacy status (for deaths under 1 year of age)
N N Y 2011-2017
o Place of usual residence N N Y 2011-2017p Place of usual residence of the
mother (for deaths under 1 year of age)
N N Y 2011-2017
q Locality of residence Y Y 2011-2017r Urban/rural residence Y Y 2011-2017s Duration of residence in usual
(present) place N N Y 2011-2017
t Place of previous residence N N Y 2011-2017u Place of birth Y N 2011-2017v Migrant status N N N 2011-2017
(iii) Characteristics of population at risk (see United Nations (2014, p. 48)
Foetal death Stillbirths? Number Topic Available
from civil registration of
births
Available from other
sources
Not available Year(s) available
(i) Characteristics of the event a Date of occurrence (of foetal
delivery) Y Y 2011-2017
Namibia Vital Statistics Report work 2.indd 64Namibia Vital Statistics Report work 2.indd 64 23/02/2021 7:41 AM23/02/2021 7:41 AM

65Namibia Vital Statistics Report- Registered Births, Deaths and Marriages for the period 2016 – 2017
b Date of registration Y N 2011-2017c Place of occurrence Y N 2011-2017d Locality of occurrence Y N 2011-2017e Urban/rural occurrence Y N 2011-2017f Place of registration Y N 2011-2017g Type of birth (i.e., single, twin,
triplet, quadruplet, or higher multiple delivery)
N Y 2011-2017
h Attendant at birth N Y 2011-2017i Certifier N Y 2011-2017j Type of certification N Y 2011-2017k Cause of foetal death Y Y 2011-2017l Type of place of occurrence (hospital,
home, etc.) N Y 2011-2017
(ii) Characteristics of the foetus n Sex Y Y 2011-2017a Delivered in wedlock N N Y 2011-2017b Legitimacy status N N Y 2011-2017c Weight at delivery N Y 2011-2017d Date of last menstrual period of the
mother N Y 2011-2017
e Gestational age N Y 2011-2017(iii) Characteristics of the mother
a Date of birth N Y 2011-2017b Age N Y 2011-2017c Number of prenatal visits N Y 2011-2017d Children born alive to mother during
her entire lifetime N Y 2011-2017
e Birth order or parity N Y 2011-2017f Children born to mother during her
entire lifetime and still living N Y 2011-2017
g Foetal deaths to mother during her entire lifetime
N Y 2011-2017
h Date of last previous live birth N Y 2011-2017i Interval since last previous live birth N Y 2011-2017j Date of marriage N N Y 2011-2017k Duration of marriage N N Y 2011-2017l Educational attainment N Y 2011-2017
m Literacy status N N Y 2011-2017n Economic activity status N N Y 2011-2017o Usual occupation N Y 2011-2017p Socioeconomic status N Y 2011-2017q Ethnic and/or national group N N Y 2011-2017r Citizenship N Y 2011-2017s Place of usual residence N N Y 2011-2017t Locality of residence N Y 2011-2017u Urban/rural residence Y Y 2011-2017
Namibia Vital Statistics Report work 2.indd 65Namibia Vital Statistics Report work 2.indd 65 23/02/2021 7:41 AM23/02/2021 7:41 AM

66 Namibia Vital Statistics Report- Registered Births, Deaths and Marriages for the period 2016 – 2017
v Duration of residence in usual (present) place
N N Y 2011-2017
x Place of previous residence N N Y 2011-2017y Place of birth N Y 2011-2017z Migrant status N N Y 2011-2017
(iv) Characteristics of the father a Date of birth N N Y 2011-2017b Age N N Y 2011-2017c Education attainment (30) ¦ N N Y 2011-2017d Literacy status (31) ¦ N N Y 2011-2017e Economic activity status (34) ¦ N N Y 2011-2017f Usual occupation (35) ¦ N N Y 2011-2017g Socioeconomic status N N Y 2011-2017h Place of usual residence N N Y 2011-2017i Locality of residence N N Y 2011-2017j Urban/rural residence N N Y 2011-2017k Duration of residence in usual
(present) place N N Y 2011-2017
l Place of previous residence N N Y 2011-2017m Place of birth N N Y 2011-2017n Migrant status N N Y 2011-2017o Ethnic and/or national group N N Y 2011-2017p Citizenship N N Y 2011-2017
(v) Characteristics of population at risk (see United Nations (2014, p. 48)
Marriage
Number Topic Available from civil
registration of marriages
Available from other
sources
Not available Year(s) available
(i) Characteristics of the event a Date of occurrence Y N 2011-2017b Date of registration Y N 2011-2017c Place of occurrence Y N 2011-2017d Locality of occurrence Y N 2011-2017e Urban/rural occurrence Y N 2011-2017f Place of registration Y N 2011-2017g Type of marriage Y N 2011-2017
(ii) Characteristics of bride and groom (separately) a Date of birth Y N 2011-2017b Age Y Y 2011-2017c Marital status (previous) N N Y 2011-2017d Number of previous marriages N N Y 2011-2017e Marriage order N N Y 2011-2017f Educational attainment N N Y 2011-2017g Literacy status N N Y 2011-2017h Economic activity status N N Y 2011-2017
Namibia Vital Statistics Report work 2.indd 66Namibia Vital Statistics Report work 2.indd 66 23/02/2021 7:41 AM23/02/2021 7:41 AM

67Namibia Vital Statistics Report- Registered Births, Deaths and Marriages for the period 2016 – 2017
i Usual occupation N N Y 2011-2017j Socioeconomic status N N Y 2011-2017k Ethnic and/or national group N N Y 2011-2017l Citizenship Y Y 2011-2017
m Place of usual residence N N Y 2011-2017n Locality of residence Y N 2011-2017o Urban/rural residence Y N 2011-2017p Duration of residence in usual
(present) place N N Y 2011-2017
q Place of previous residence N N Y 2011-2017r Place of birth Y N 2011-2017s Migrant status N N Y 2011-2017
(iii) Characteristics of population at risk (see United Nations (2014, p. 48)
Divorce
Number Topic Available from civil
registration of divorces
Available from other
sources
Not available Year(s) available
(i) Characteristics of the event a Date of occurrence N Y 2011-2017b Date of registration N Y 2011-2017c Place of occurrence N Y 2011-2017d Locality of occurrence N Y 2011-2017e Urban/rural occurrence N Y 2011-2017f Place of registration N Y 2011-2017
(ii) Characteristics of divorcees (husband and wife separately) a Date of birth N Y 2011-2017b Age N Y 2011-2017c Type of marriage being dissolved N Y 2011-2017d Number of dependent children of
divorced persons N Y 2011-2017
e Number of children born alive to the marriage being dissolved
N N Y 2011-2017
f Date of marriage N Y 2011-2017g Duration of marriage N Y 2011-2017h Mode of dissolution of previous
marriage N Y 2011-2017
i Number of previous marriages N Y 2011-2017j Marriage order N N Y 2011-2017k Educational attainment N N Y 2011-2017l Literacy status N N Y 2011-2017
m Economic activity status N N Y 2011-2017n Usual occupation N Y 2011-2017o Socioeconomic status N N Y 2011-2017p Ethnic and/or national group N N Y 2011-2017q Place of usual residence N N Y 2011-2017
Namibia Vital Statistics Report work 2.indd 67Namibia Vital Statistics Report work 2.indd 67 23/02/2021 7:41 AM23/02/2021 7:41 AM
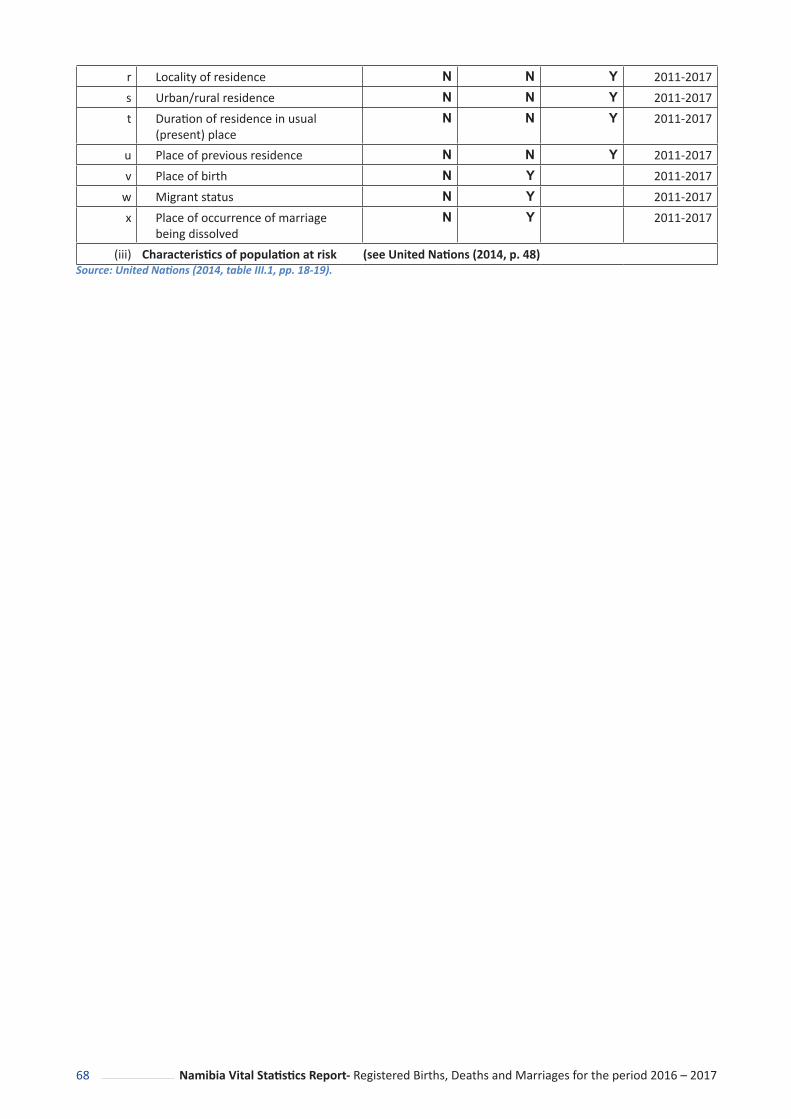
68 Namibia Vital Statistics Report- Registered Births, Deaths and Marriages for the period 2016 – 2017
r Locality of residence N N Y 2011-2017s Urban/rural residence N N Y 2011-2017t Duration of residence in usual
(present) place N N Y 2011-2017
u Place of previous residence N N Y 2011-2017v Place of birth N Y 2011-2017
w Migrant status N Y 2011-2017x Place of occurrence of marriage
being dissolved N Y 2011-2017
(iii) Characteristics of population at risk (see United Nations (2014, p. 48) Source: United Nations (2014, table III.1, pp. 18-19).
Namibia Vital Statistics Report work 2.indd 68Namibia Vital Statistics Report work 2.indd 68 23/02/2021 7:41 AM23/02/2021 7:41 AM

69Namibia Vital Statistics Report- Registered Births, Deaths and Marriages for the period 2016 – 2017
Annex III: Minimum list of tabulations recommended by UN
This annexure includes the tables recommended by the United Nations Principles and Recommendations (2014) and other tables proposed in these guidelines. It may be useful to go through these lists when making the tabulation plan and to include the years(s) for which the tables can (or should) be produced. The choice and numbering of the tables is up to the country.
Place of usual residence is commonly considered to be the most important location variable. The number of administrative units to be included depends on the administrative structure of the civil registration system and the number of units. If the number of units is large, a more detailed table may be included as an annexure to the vital statistics report and/or a web table.
Table A2.1: Live births
Number in the United Nations Principles and Recommen-dations
Table content Possible: Yes/ No
Possible if civil registration data are combined with data from other sources
Year(s)
First priority tablesIB-1 Total number of live births by sex, incl. sex ratio at
birth and site of deliveryY N 2011-2017
ST-3 Live births by place of residence1 and urban–rural residence of the mother
N Y 2011-2017
LB-9 Live births by age of mother (15-19, 20-24 … 45-49) Y Y 2011-2017LB-1 Live births by place of occurrence and sex of child Y Y 2011-2017LB-2 Live births by place of occurrence and place of usual
residence of motherN Y 2011-2017
Second priority tables 2011-2017LB-3 Live births by place of registration, month of
occurrence and month of registrationY N 2011-2017
LB-9 Live births by place of usual residence and age of mother, sex of child and live-birth order
N N 2011-2017
LB-11 Live births by place of birth, place of usual residence and age of mother
N Y 2011-2017
LB-13 Live births by place of occurrence, site of delivery and attendant at birth
N Y 2011-2017
LB-4 Live births by month, place of occurrence and place of usual residence of mother
N N 2011-2017
LB-5 Live births by age, place of usual residence and marital status of mother
N Y 2011-2017
LB-6 Live births by age of father Y N 2011-2017LB-7 Live births by place of usual residence, age and
educational attainment of motherN Y 2011-2017
LB-8 Live births by educational attainment and age of mother, and live-birth order
N N 2011-2017
Namibia Vital Statistics Report work 2.indd 69Namibia Vital Statistics Report work 2.indd 69 23/02/2021 7:41 AM23/02/2021 7:41 AM
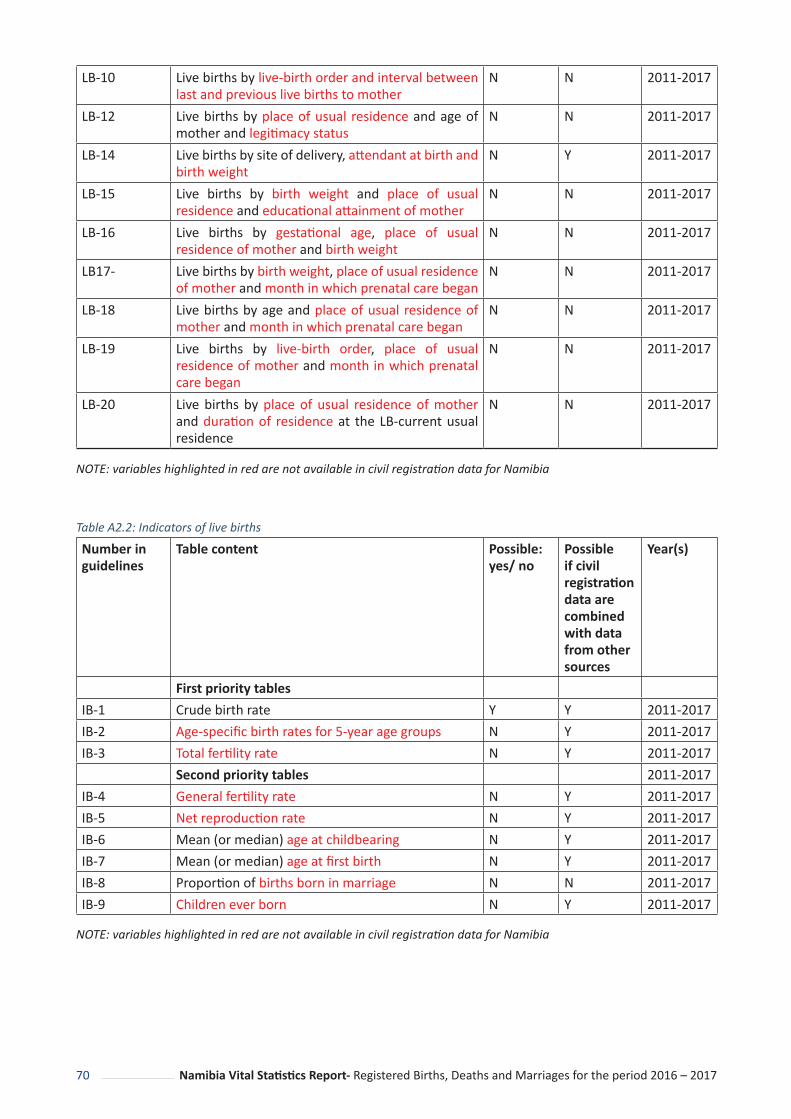
70 Namibia Vital Statistics Report- Registered Births, Deaths and Marriages for the period 2016 – 2017
LB-10 Live births by live-birth order and interval between last and previous live births to mother
N N 2011-2017
LB-12 Live births by place of usual residence and age of mother and legitimacy status
N N 2011-2017
LB-14 Live births by site of delivery, attendant at birth and birth weight
N Y 2011-2017
LB-15 Live births by birth weight and place of usual residence and educational attainment of mother
N N 2011-2017
LB-16 Live births by gestational age, place of usual residence of mother and birth weight
N N 2011-2017
LB17- Live births by birth weight, place of usual residence of mother and month in which prenatal care began
N N 2011-2017
LB-18 Live births by age and place of usual residence of mother and month in which prenatal care began
N N 2011-2017
LB-19 Live births by live-birth order, place of usual residence of mother and month in which prenatal care began
N N 2011-2017
LB-20 Live births by place of usual residence of mother and duration of residence at the LB-current usual residence
N N 2011-2017
NOTE: variables highlighted in red are not available in civil registration data for Namibia
Table A2.2: Indicators of live births
Number in guidelines
Table content Possible: yes/ no
Possible if civil registration data are combined with data from other sources
Year(s)
First priority tablesIB-1 Crude birth rate Y Y 2011-2017IB-2 Age-specific birth rates for 5-year age groups N Y 2011-2017IB-3 Total fertility rate N Y 2011-2017
Second priority tables 2011-2017IB-4 General fertility rate N Y 2011-2017IB-5 Net reproduction rate N Y 2011-2017IB-6 Mean (or median) age at childbearing N Y 2011-2017IB-7 Mean (or median) age at first birth N Y 2011-2017IB-8 Proportion of births born in marriage N N 2011-2017IB-9 Children ever born N Y 2011-2017
NOTE: variables highlighted in red are not available in civil registration data for Namibia
Namibia Vital Statistics Report work 2.indd 70Namibia Vital Statistics Report work 2.indd 70 23/02/2021 7:41 AM23/02/2021 7:41 AM

71Namibia Vital Statistics Report- Registered Births, Deaths and Marriages for the period 2016 – 2017
Table A2.3: Deaths
Number in the United Nations Principles and Recommen-dations
Table content Possible: yes/ no
Possible if civil registration data are combined with data from other sources
Year(s)
First priority tablesDE-1 Deaths by place of usual residence and sex of
decedentN Y 2011-2017
DE-2 Deaths by place of occurrence and place of usual residence and sex of decedent
N Y 2011-2017
DE-4 Deaths by place of registration, month of occurrence and month of registration
Y N 2011-2017
DE-5 Deaths by place of occurrence and site of occurrence Y Y 2011-2017DE-6 Deaths by place of usual residence, age and sex of
decedentN N 2011-2017
Second priority tablesDE-3 Deaths by month and place of occurrence and place
of usual residence of decedentN Y 2011-2017
DE-7 Deaths by age, sex, place of usual residence and marital status of decedent
N N 2011-2017
DE-8 Deaths by place of usual residence, age, sex and educational attainment of decedent
N N 2011-2017
DE-9 Deaths by sex, cause of death, place of usual residence and age of decedent
N Y 2011-2017
DE-10 Deaths by month of occurrence and cause of death Y N 2011-2017DE-11 Deaths by place of occurrence, sex of decedent and
type of certificationN N 2011-2017
DE-12 Maternal deaths by cause of death and age of woman
Y N 2011-2017
DE-13 Deaths by age and type of usual activity of decedent N N 2011-2017
NOTE: variables highlighted in red are not available in civil registration data for Namibia
Table A2.4: Indicators of deaths
Number in the United Nations Principles and Recommen-dations
Table content Possible: yes/ no
Possible if civil registration data are combined with data from other sources
Year(s)
First priority tablesID-1 Total number of deaths by sex Y Y 2011-2017ID-2 Crude death rate Y Y 2011-2017ID-3 Infant mortality rate Y Y 2011-2017
Namibia Vital Statistics Report work 2.indd 71Namibia Vital Statistics Report work 2.indd 71 23/02/2021 7:41 AM23/02/2021 7:41 AM

72 Namibia Vital Statistics Report- Registered Births, Deaths and Marriages for the period 2016 – 2017
ID-4 Under-five mortality rate Y Y 2011-2017ID-5 Maternal mortality rate N Y 2011-2017ID-6 Age-specific death rates (mx) for 5-year age groups
by sexN Y 2011-2017
ID-7 Life expectancy at birth (e0) N Y 2011-2017Second priority tables 2011-2017
ID-8 Life table for each sex N Y 2011-2017
NOTE: variables highlighted in red are not available in civil registration data for Namibia
Table A2.5: Marriage and divorce
Number in the United Nations Principles and Recommen-dations
Table content Possible: yes/ no
Possible if civil registration data are combined with data from other sources
Year(s)
MA-1 Marriages by place of usual residence of groom and month of occurrence
N N 2011-2017
MA-2 Marriages by place of usual residence of groom and age of bride and of groom
N N 2011-2017
MA-3 Marriages by age and previous marital status of bride and of groom
N N 2011-2017
MA-4 Marriages by educational attainment of bride and of groom
N N 2011-2017
MA-5 Marriages by occupation of bride and of groom N N 2011-2017DI-1 Divorces by place of usual residence of husband N N 2011-2017DI-2 Divorces by age of husband and wife N N 2011-2017DI-3 Divorces by duration of marriage and age of
husband and of wifeN N 2011-2017
DI-4 Divorces by duration of marriage and number of dependent children
N N 2011-2017
DI-5 Divorces by educational attainment of husband and of wife
N N 2011-2017
DI-6 Divorces by occupation of husband and of wife N N 2011-2017DI-7 Divorces by number of previous marriages of
husband and of wifeN N 2011-2017
ST-7 Time series of marriages by place of usual residence of groom (past 10 years)
N N 2011-2017
ST-8 Time series of divorces by place of usual residence of husband (past 10 years)
N N 2011-2017
NOTE: variables highlighted in red are not available in civil registration data for Namibia
Namibia Vital Statistics Report work 2.indd 72Namibia Vital Statistics Report work 2.indd 72 23/02/2021 7:41 AM23/02/2021 7:41 AM

73Namibia Vital Statistics Report- Registered Births, Deaths and Marriages for the period 2016 – 2017
Table A2.6: Indicators of marriages and divorces
Number in guidelines
Table content Possible yes/ No
Possible if civil registration data are combined with data from other sources
Year(s)
First priority tablesMI-1 Crude marriage rate and crude divorce rate N Y 2011-2017MI-2 Mean age at first marriage N N 2011-2017MI-3 Mean age at divorce N N 2011-2017
Second priority tablesMI-4 Proportion of marriages ending in divorce N N 2011-2017
NOTE: variables highlighted in red are not available in civil registration data for Namibia
Table A2.7: Summary tables
Number in the United Nations Principles and Recommen-dations
Table content Possible: yes/ no
Possible if civil registration data are combined with data from other sources
Year(s)
ST-1 Live births, deaths, infant deaths, foetal deaths, marriages and divorces by place of usual residence
N Y 2011-2017
ST-2 Crude birth rate, crude death rate, infant mortality rate by sex, foetal mortality rate, crude marriage rate and crude divorce rate, by place of usual residence
N Y 2011-2017
ST-3 Time series of live births by place of usual residence of mother (past 10 years)*
N N 2011-2017
ST-4 Time series of deaths by place of usual residence of decedent (past 10 years)*
N N 2011-2017
ST-5 Time series of infant deaths by place of usual residence of mother (past 10 years)*
N N 2011-2017
ST-6 Time series of foetal deaths by place of usual residence of mother (past 10 years)*
N N 2011-2017
ST-7 Time series of marriages by place of usual residence of groom (past 10 years)*
N N 2011-2017
ST-8 Time series of divorces by place of usual residence of husband (past 10 years)*
N N 2011-2017
ST-9 Times series of vital events in the country (past 10 years)
Y N 2011-2017
Note: The tables marked with a star (*) may be more appropriate in the chapter on each vital event.
Namibia Vital Statistics Report work 2.indd 73Namibia Vital Statistics Report work 2.indd 73 23/02/2021 7:41 AM23/02/2021 7:41 AM

74 Namibia Vital Statistics Report- Registered Births, Deaths and Marriages for the period 2016 – 2017
REFERENCES
1. Namibia Statistics Agency [2015]: Comprehensive assessment of the civil registration and vital statistics system in Namibia, Namibia
2. Namibia Statistics Agency [2014]: Namibia Population Projections 2011 – 2041, Namibia3. Statistics Norway [2017]: Draft guidelines and template for developing a vital statistics report, Norway4. The World Bank [2017]: Civil Registration and Vital Statistics (CRVS) for Monitoring the Sustainable
Development Goals (SDGs), USA5. United Nations [2014]: Principles and Recommendations for a Vital Statistics System, Revision 3, New
York6. https://www.unicef.org/esaro/Technical_paper_low_res_.pdf
Namibia Vital Statistics Report work 2.indd 74Namibia Vital Statistics Report work 2.indd 74 23/02/2021 7:41 AM23/02/2021 7:41 AM

75Namibia Vital Statistics Report- Registered Births, Deaths and Marriages for the period 2016 – 2017
NOTES_______________________________________________________________________________________
_______________________________________________________________________________________
_______________________________________________________________________________________
_______________________________________________________________________________________
_______________________________________________________________________________________
_______________________________________________________________________________________
_______________________________________________________________________________________
_______________________________________________________________________________________
_______________________________________________________________________________________
_______________________________________________________________________________________
_______________________________________________________________________________________
_______________________________________________________________________________________
_______________________________________________________________________________________
_______________________________________________________________________________________
_______________________________________________________________________________________
_______________________________________________________________________________________
_______________________________________________________________________________________
_______________________________________________________________________________________
_______________________________________________________________________________________
_______________________________________________________________________________________
Namibia Vital Statistics Report work 2.indd 75Namibia Vital Statistics Report work 2.indd 75 23/02/2021 7:41 AM23/02/2021 7:41 AM

76 Namibia Vital Statistics Report- Registered Births, Deaths and Marriages for the period 2016 – 2017
NOTES_______________________________________________________________________________________
_______________________________________________________________________________________
_______________________________________________________________________________________
_______________________________________________________________________________________
_______________________________________________________________________________________
_______________________________________________________________________________________
_______________________________________________________________________________________
_______________________________________________________________________________________
_______________________________________________________________________________________
_______________________________________________________________________________________
_______________________________________________________________________________________
_______________________________________________________________________________________
_______________________________________________________________________________________
_______________________________________________________________________________________
_______________________________________________________________________________________
_______________________________________________________________________________________
_______________________________________________________________________________________
_______________________________________________________________________________________
_______________________________________________________________________________________
_______________________________________________________________________________________
Namibia Vital Statistics Report work 2.indd 76Namibia Vital Statistics Report work 2.indd 76 23/02/2021 7:41 AM23/02/2021 7:41 AM

inside back coverblank
unprinted
Namibia Vital Statistics Report work 2.indd 77Namibia Vital Statistics Report work 2.indd 77 23/02/2021 7:41 AM23/02/2021 7:41 AM

Namibia Vital Statistics Report- Registered Births, Deaths and Marriages for the period 2016 – 2017
Namibia Vital Stati sti cs ReportBirths, Deaths and Marriages registered in 2016 & 2017
Namibia Stati sti cs AgencyP.O. Box 2133, FGI House, PostStreet MallWindhoek, Namibia
Tel: +264 61 431 3200Fax: +264 61 431 3253
Email: [email protected]
Namibia Vital Statistics Report work 2.indd 78Namibia Vital Statistics Report work 2.indd 78 23/02/2021 7:41 AM23/02/2021 7:41 AM