nanofiltration membrane characterization using mass transfer data
TRANSCRIPT
Nanofiltration Membrane Characterization
using Mass Transfer Data with Emphasis
on Temperature Effects
Ramesh R. SharmaTrussell Technologies, Inc., Pasadena, CA
Shankar ChellamDepartment of Civil and Environmental Engineering,
University of Houston, Houston, TX
Importance of Nanofiltration
• Capable of achieving high removals of
natural organic matter, disinfection by-
products, pesticides, arsenic, hardness,
etc.
• Lower cost than reverse osmosis
technology
• However, transport mechanisms are not
yet fully understood
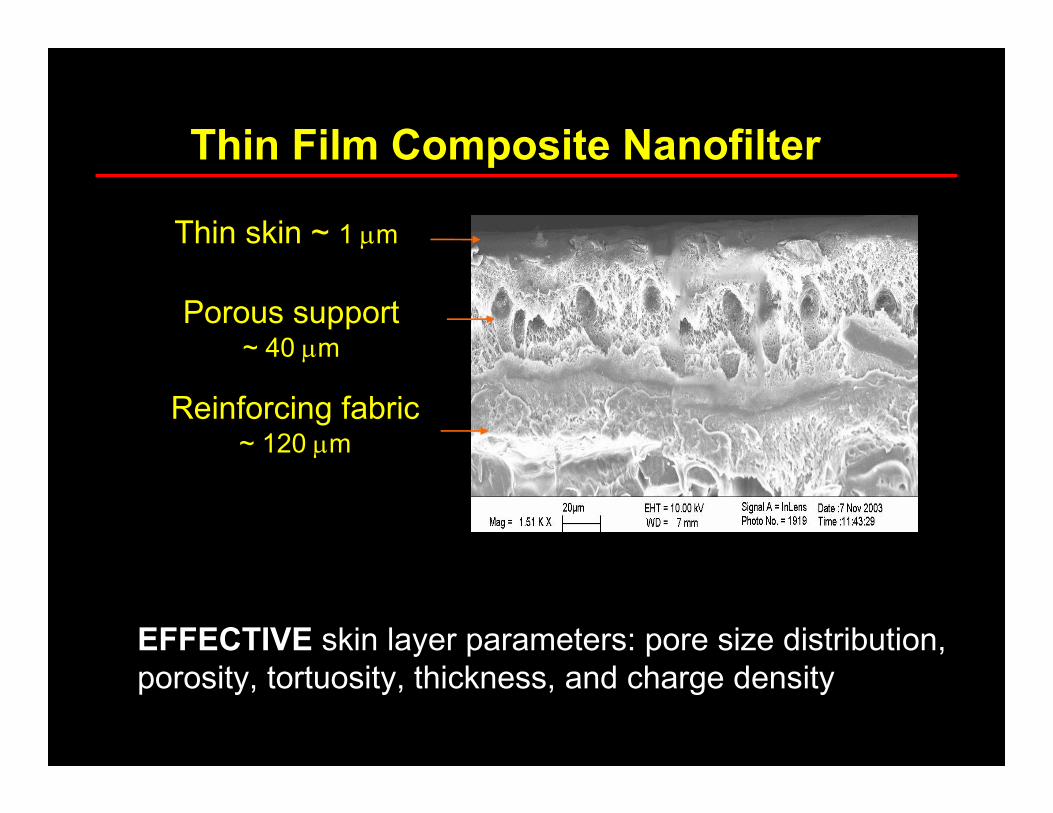
Thin Film Composite Nanofilter
Porous support~ 40 µm
Reinforcing fabric~ 120 µm
Thin skin ~ 1 µm
EFFECTIVE skin layer parameters: pore size distribution,
porosity, tortuosity, thickness, and charge density
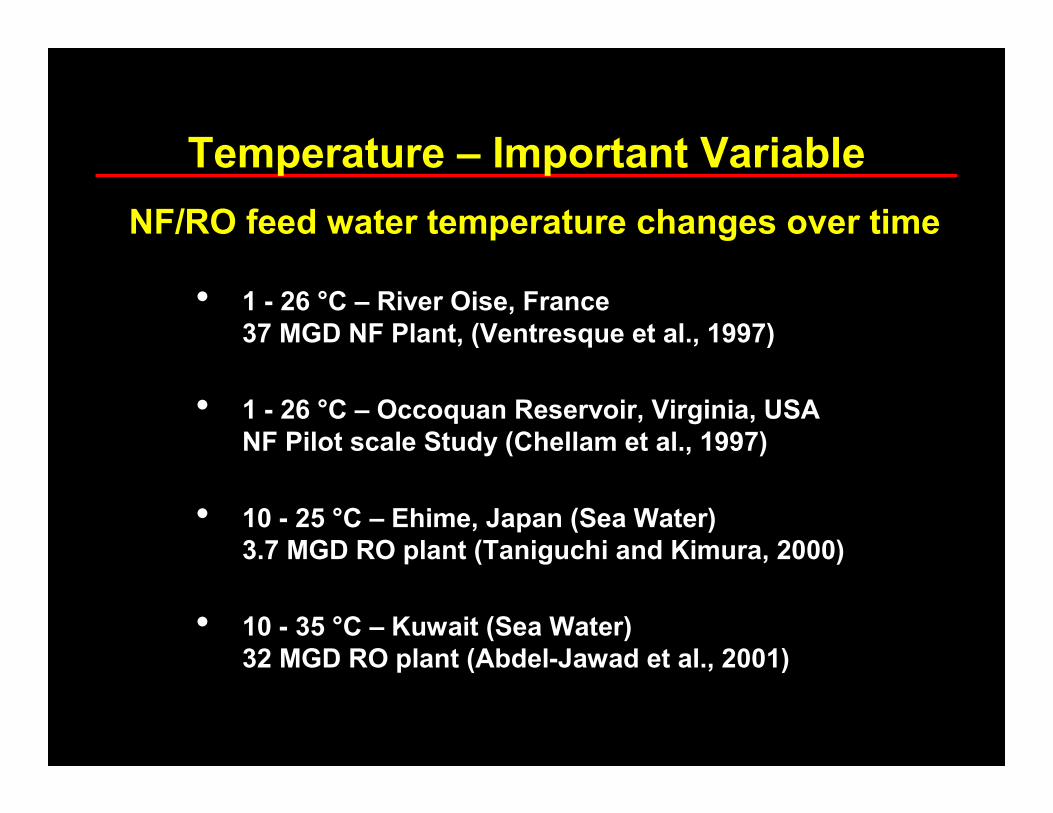
Temperature – Important Variable
NF/RO feed water temperature changes over time
• 1 - 26 °C – River Oise, France
37 MGD NF Plant, (Ventresque et al., 1997)
• 1 - 26 °C – Occoquan Reservoir, Virginia, USA
NF Pilot scale Study (Chellam et al., 1997)
• 10 - 25 °C – Ehime, Japan (Sea Water)
3.7 MGD RO plant (Taniguchi and Kimura, 2000)
• 10 - 35 °C – Kuwait (Sea Water)
32 MGD RO plant (Abdel-Jawad et al., 2001)
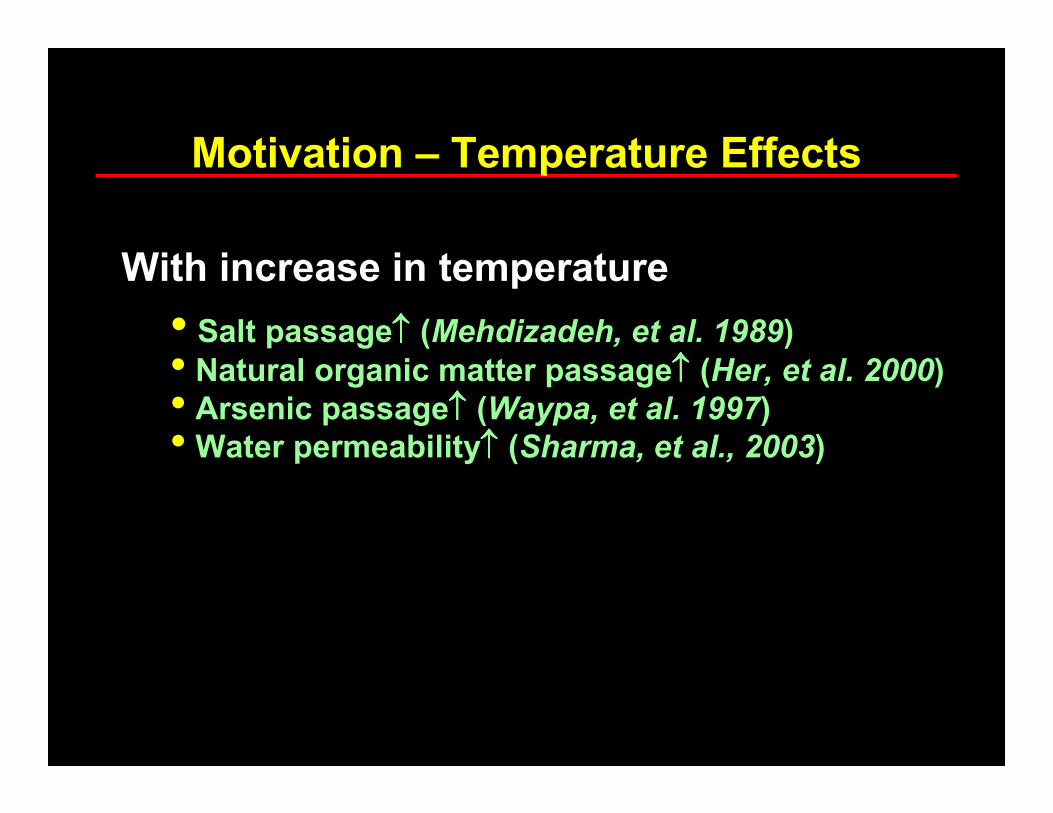
Motivation – Temperature Effects
With increase in temperature
• Salt passage↑↑↑↑ (Mehdizadeh, et al. 1989)• Natural organic matter passage↑↑↑↑ (Her, et al. 2000)• Arsenic passage↑↑↑↑ (Waypa, et al. 1997)
•Water permeability↑↑↑↑ (Sharma, et al., 2003)
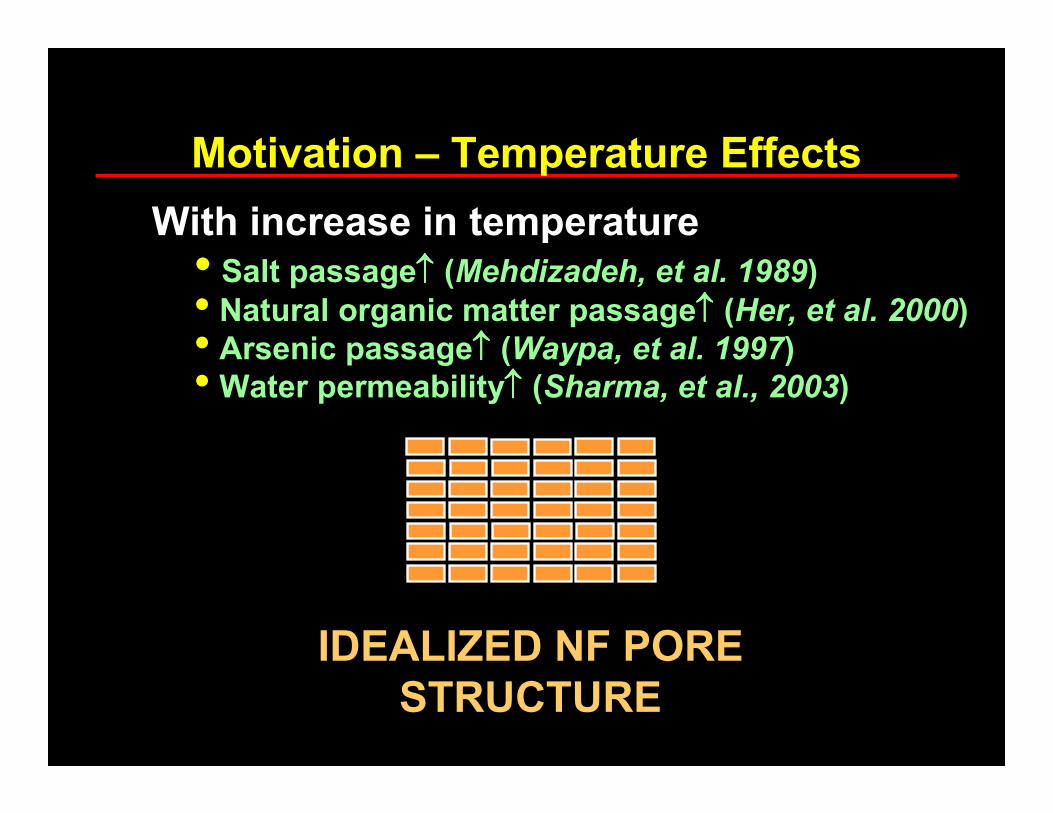
Motivation – Temperature Effects
• Salt passage↑↑↑↑ (Mehdizadeh, et al. 1989)• Natural organic matter passage↑↑↑↑ (Her, et al. 2000)• Arsenic passage↑↑↑↑ (Waypa, et al. 1997)
•Water permeability↑↑↑↑ (Sharma, et al., 2003)
With increase in temperature
IDEALIZED NF PORE
STRUCTURE

Motivation – Temperature Effects
High TemperatureLow Temperature
• Salt passage↑↑↑↑ (Mehdizadeh, et al. 1989)• Natural organic matter passage↑↑↑↑ (Her, et al. 2000)• Arsenic passage↑↑↑↑ (Waypa, et al. 1997)
•Water permeability↑↑↑↑ (Sharma, et al., 2003)
With increase in temperature
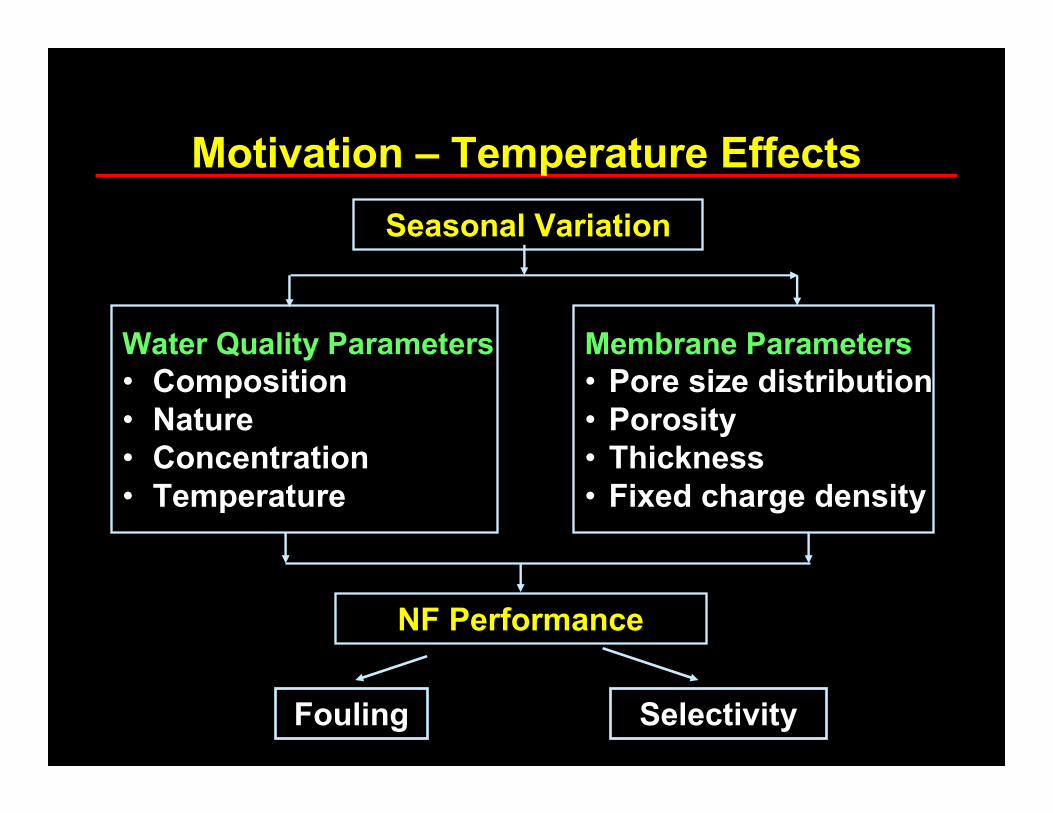
Motivation – Temperature Effects
Seasonal Variation
Water Quality Parameters
• Composition
• Nature
• Concentration
• Temperature
Membrane Parameters
• Pore size distribution
• Porosity
• Thickness
• Fixed charge density
NF Performance
Fouling Selectivity
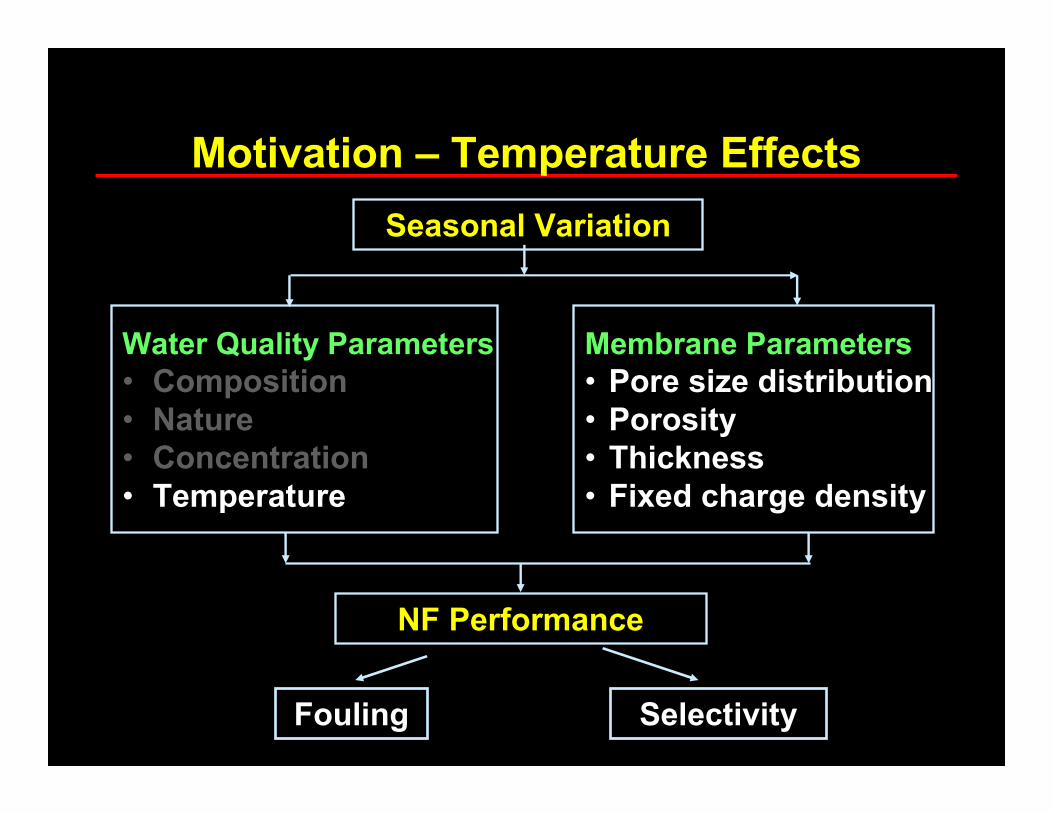
Motivation – Temperature Effects
Seasonal Variation
Water Quality Parameters
• Composition
• Nature
• Concentration
• Temperature
Membrane Parameters
• Pore size distribution
• Porosity
• Thickness
• Fixed charge density
NF Performance
Fouling Selectivity
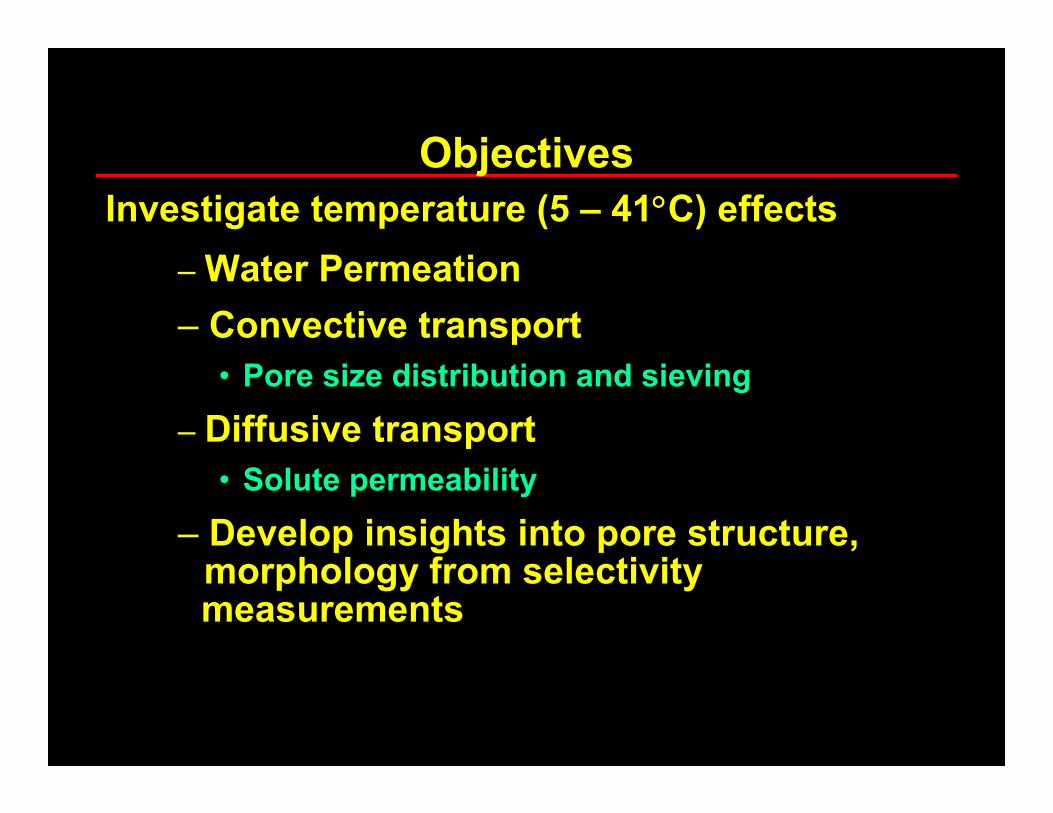
Objectives
Investigate temperature (5 – 41°°°°C) effects
–Water Permeation
– Convective transport
• Pore size distribution and sieving
– Diffusive transport
• Solute permeability
– Develop insights into pore structure,morphology from selectivity measurements

Membranes Employed
Manufacturer Model Composition MWCO
Osmonics,
Minnetonka, MN
DL Polyamide ~200
Koch Fluid Systems,
San Diego, CA
TFCS Polyamide ~ 300
Manufacturer specifications
Water Permeation
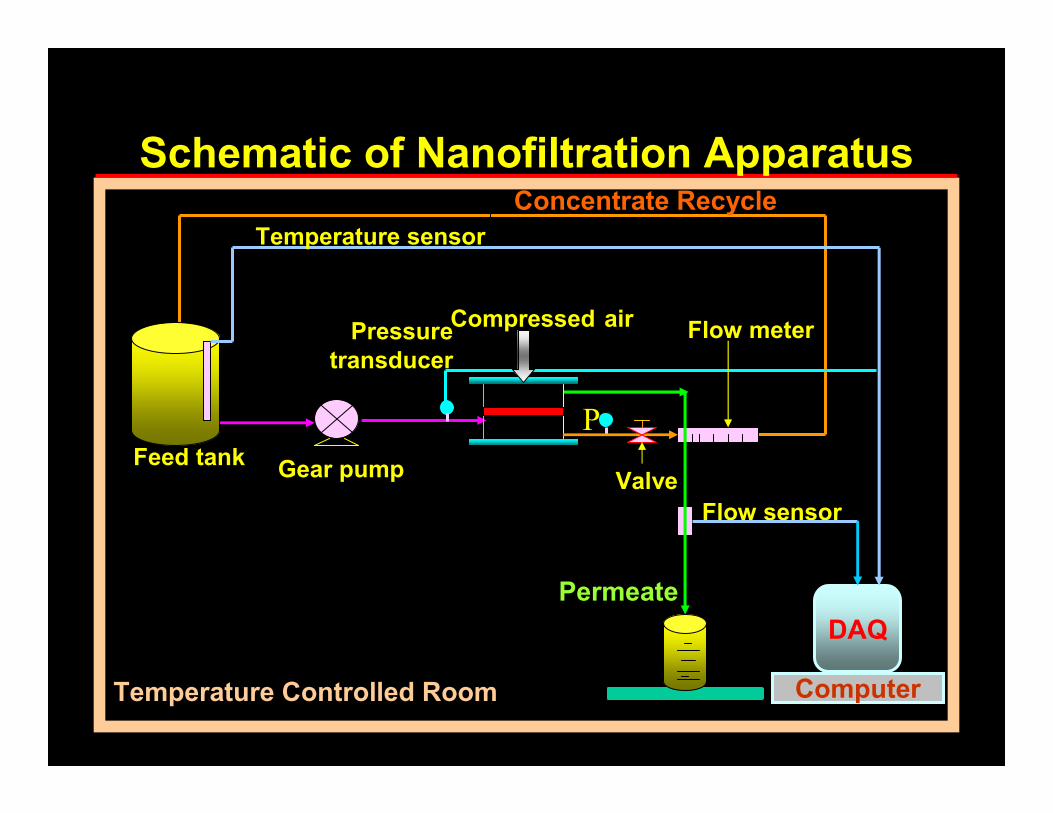
Schematic of Nanofiltration Apparatus
Pressure
transducer
Temperature Controlled Room
DAQ
Computer
Feed tank
Compressed air
Gear pump
Permeate
Valve
P
Flow meter
Flow sensor
Temperature sensor
Concentrate Recycle

Validity of Darcy’s Law – Nanofiltration
0.0 0.1 0.2 0.3 0.4 0.5 0.6 0.7 0.8
0
1
2
3
4
5
6
7
8
9
10
DL membrane 41 °C
23 °C
5 °C
15 °C
35 °C
Flux (µµ µµm/s)
Pressure differential, ∆∆∆∆P (MPa)
PR
J
LR
PLJ
m
V
p
m
PV
∆=
=
∆=
1
1
µ
µ
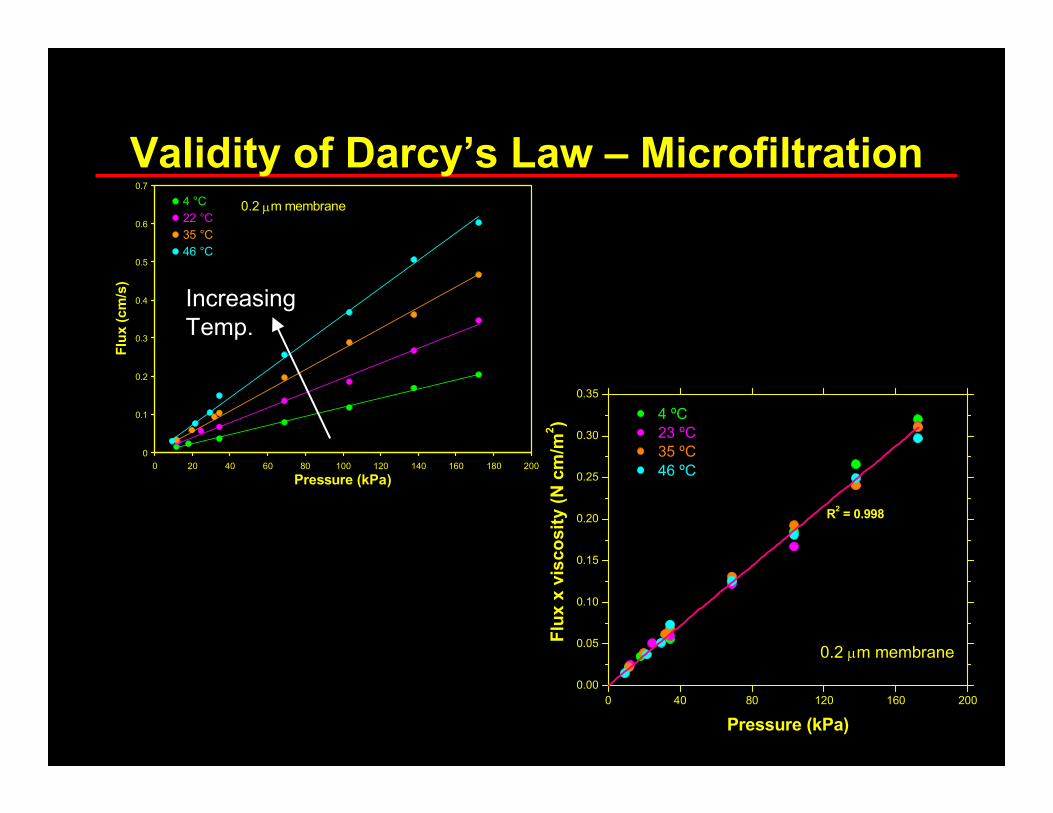
Validity of Darcy’s Law – Microfiltration
0 40 80 120 160 200
0.00
0.05
0.10
0.15
0.20
0.25
0.30
0.35
Flux x viscosity (N cm/m
2)
Pressure (kPa)
4 ºC
23 ºC
35 ºC
46 ºC
R2 = 0.998
0.2 µm membrane
0
0.1
0.2
0.3
0.4
0.5
0.6
0.7
0 20 40 60 80 100 120 140 160 180 200
Pressure (kPa)
Flux (cm/s)
4 °C
22 °C
35 °C
46 °C
0.2 µm membrane
Increasing
Temp.
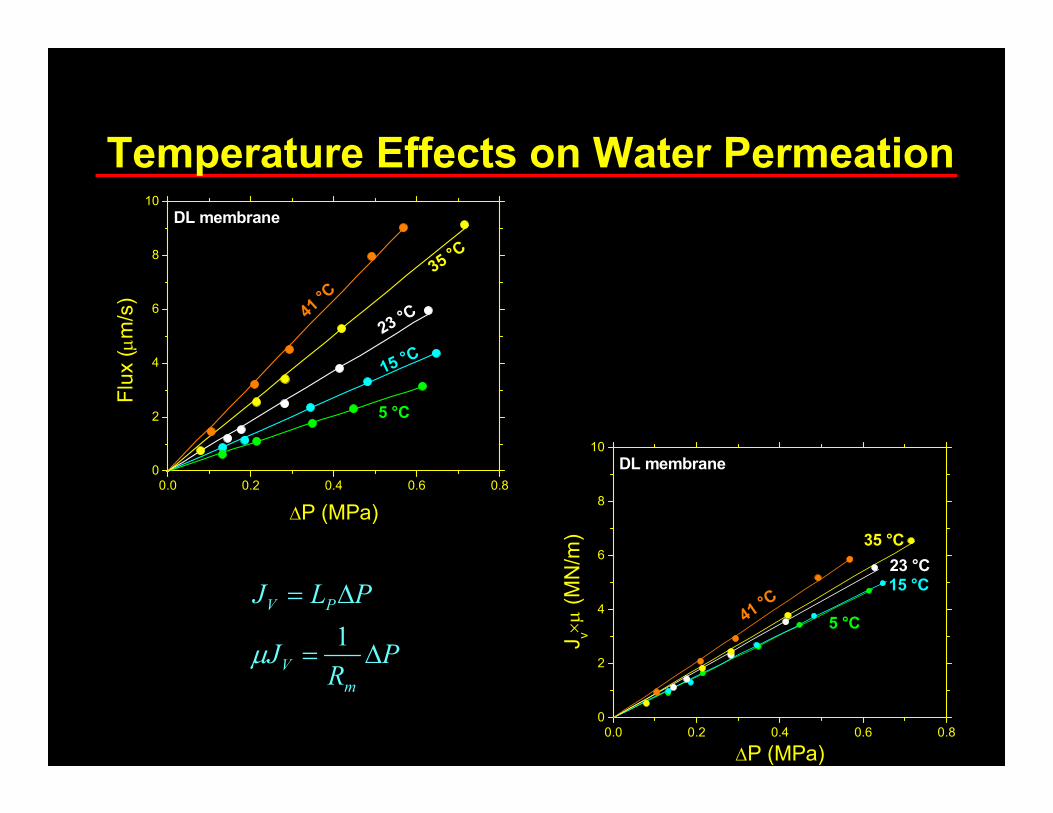
Temperature Effects on Water Permeation
0.0 0.2 0.4 0.6 0.8
0
2
4
6
8
10
DL membrane
41 °C
23 °C
5 °C
15 °C
35 °C
Flux (µm/s)
∆P (MPa)
0.0 0.2 0.4 0.6 0.80
2
4
6
8
10
DL membrane
41 °C
23 °C
5 °C
15 °C
35 °C
Jv×µ (MN/m
)
∆P (MPa)
PR
J
PLJ
m
V
PV
∆=
∆=
1µ

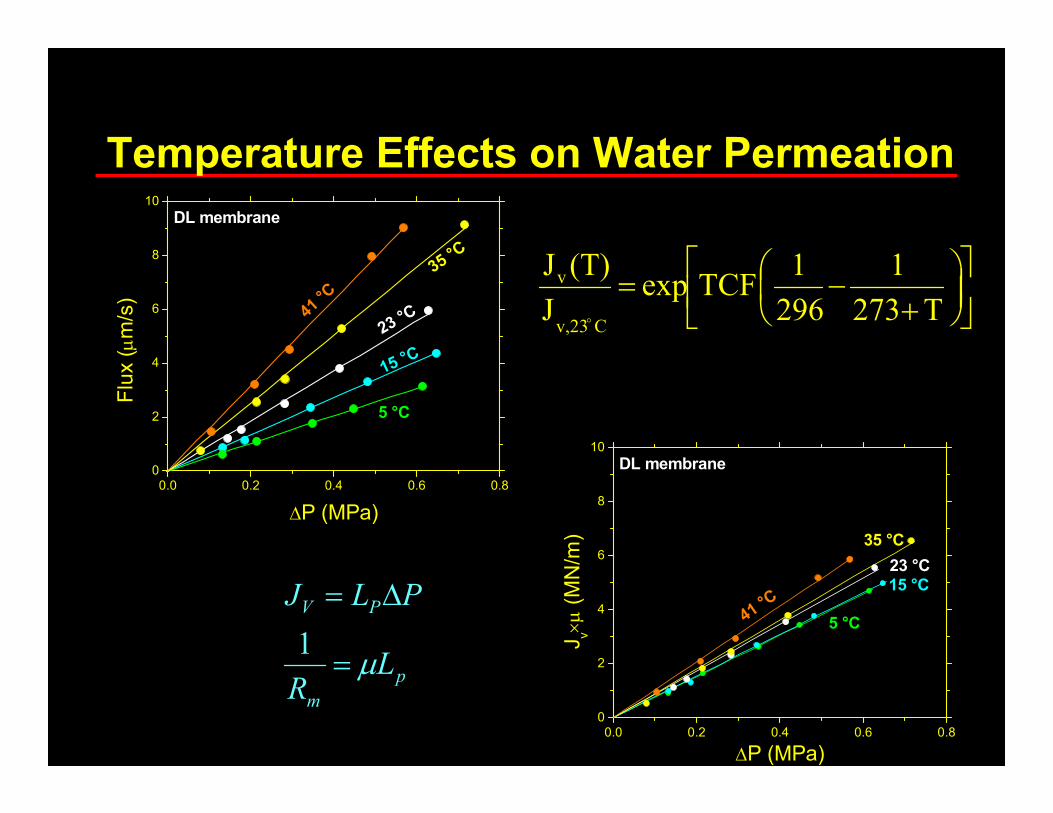
Temperature Effects on Water Permeation
0.0 0.2 0.4 0.6 0.8
0
2
4
6
8
10
DL membrane
41 °C
23 °C
5 °C
15 °C
35 °C
Flux (µm/s)
∆P (MPa)
0.0 0.2 0.4 0.6 0.80
2
4
6
8
10
DL membrane
41 °C
23 °C
5 °C
15 °C
35 °C
Jv×µ (MN/m
)
∆P (MPa)
p
m
PV
LR
PLJ
µ=
∆=
1
Temperature Effects on Water Permeation
0.0 0.2 0.4 0.6 0.8
0
2
4
6
8
10
DL membrane
41 °C
23 °C
5 °C
15 °C
35 °C
Flux (µm/s)
∆P (MPa)
0.0 0.2 0.4 0.6 0.80
2
4
6
8
10
DL membrane
41 °C
23 °C
5 °C
15 °C
35 °C
Jv×µ (MN/m
)
∆P (MPa)
p
m
PV
LR
PLJ
µ=
∆=
1
+
−=T273
1
296
1 TCFexp
J
(T)J
Cv,23
v
o
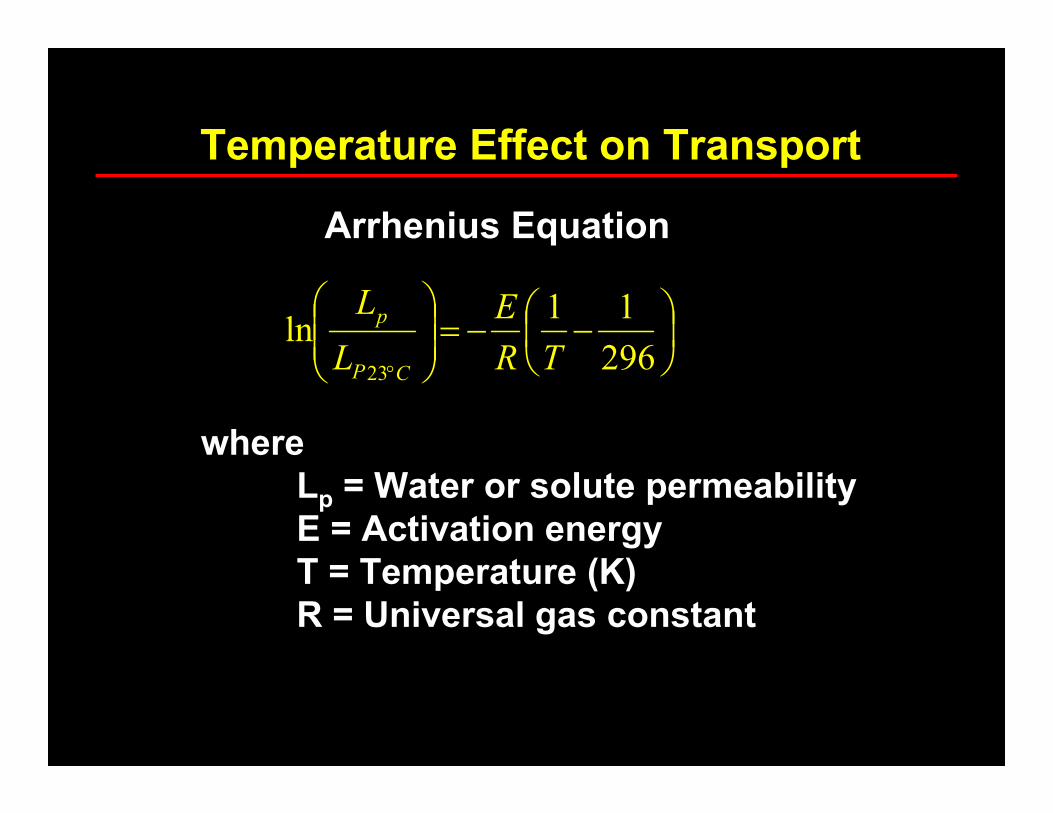
Temperature Effect on Transport
Arrhenius Equation
−−=
° 296
11ln
23TR
E
L
L
CP
p
where
Lp = Water or solute permeability
E = Activation energy
T = Temperature (K)
R = Universal gas constant
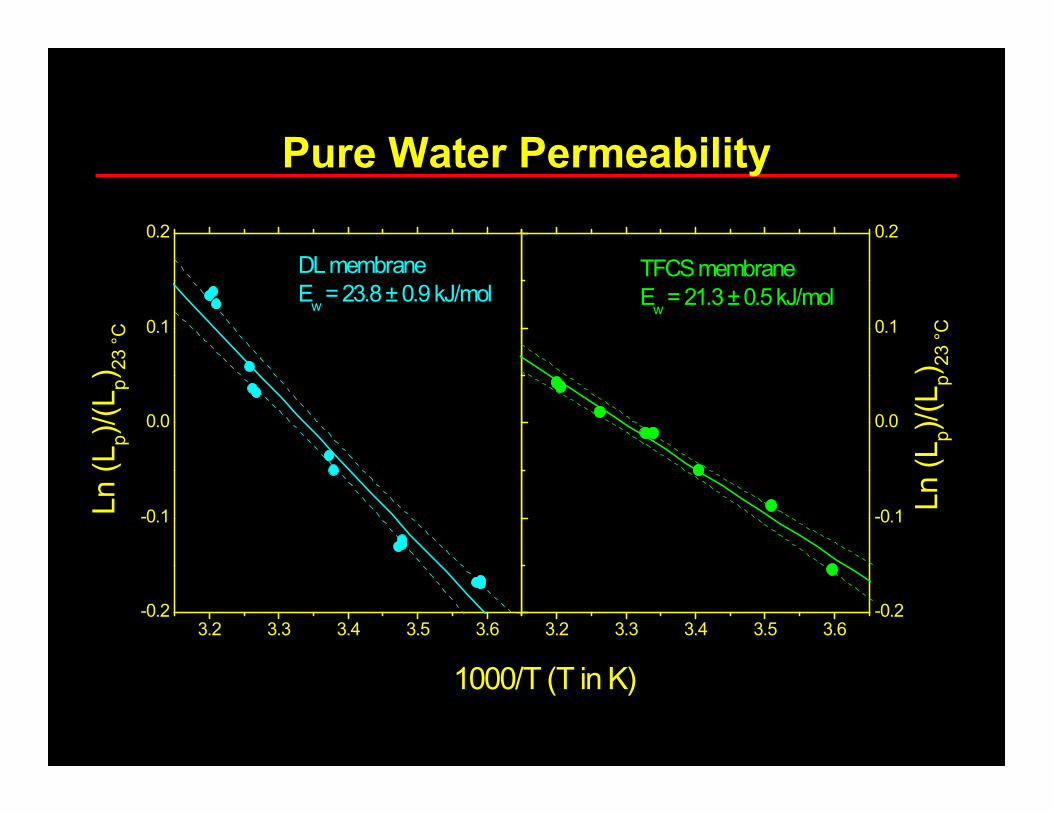
3.2 3.3 3.4 3.5 3.6-0.2
-0.1
0.0
0.1
0.2
3.2 3.3 3.4 3.5 3.6-0.2
-0.1
0.0
0.1
0.2
Ln (Lp)/(L
p) 23 °C
TFCS membrane
Ew = 21.3 ± 0.5 kJ/mol
1000/T (T in K)
Ln (Lp)/(L
p) 23 °C
DL membrane
Ew = 23.8 ± 0.9 kJ/mol
Pure Water Permeability
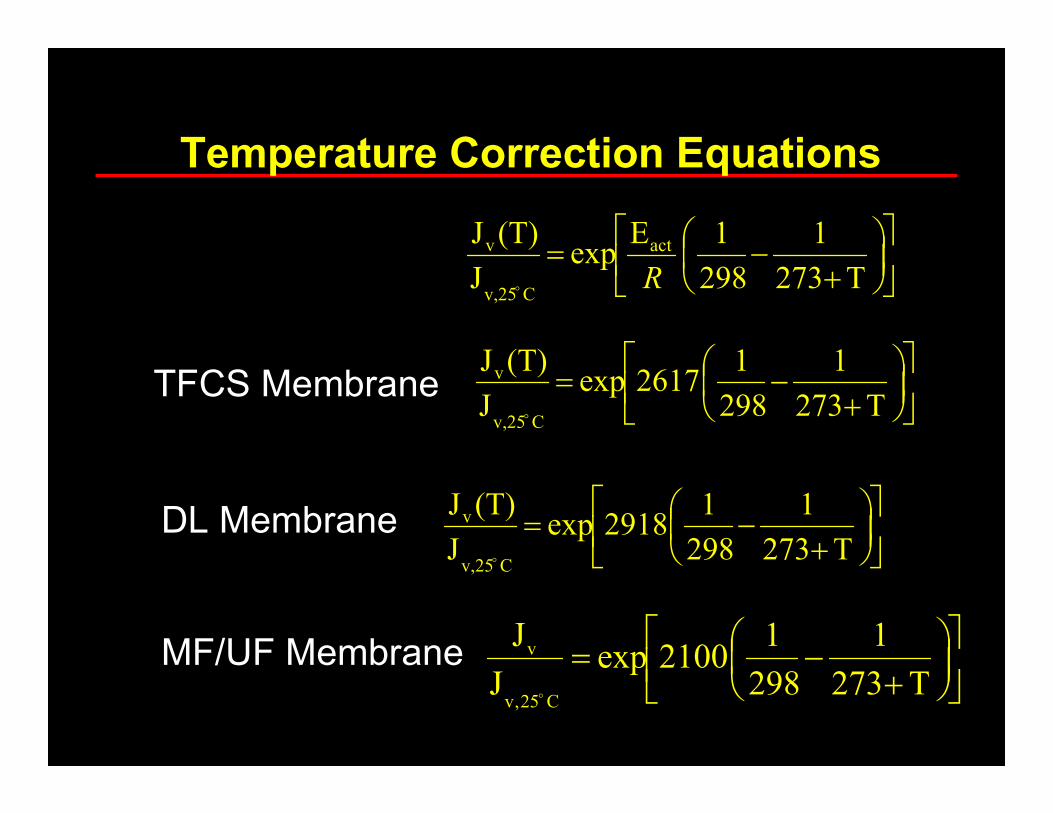
Temperature Correction Equations
+
−=T273
1
298
1 2617exp
J
(T)J
Cv,25
v
o
TFCS Membrane
+
−=T273
1
298
1 2918exp
J
(T)J
Cv,25
v
o
DL Membrane
+
−=T273
1
298
1 2100exp
J
J
C25,v
v
o
MF/UF Membrane
+
−=T273
1
298
1
Eexp
J
(T)J act
Cv,25
v
Ro

Need for Membrane-Specific TCFs
5 10 15 20 25 30 35 40
0.6
0.8
1.0
1.2
1.4
1.6
Permeate flux normalized to 25 °C
Temperature (°C)
TFCS
DL
Generic
1.03T-25
5 10 15 20 25 30 35 40-4
-2
0
2
4
6
8
10
12
Relative error (%)
Temperature (°C)
Perfect fit
DL
TFCS

Neutral Solute Transport and
Changes in Membrane Morphology
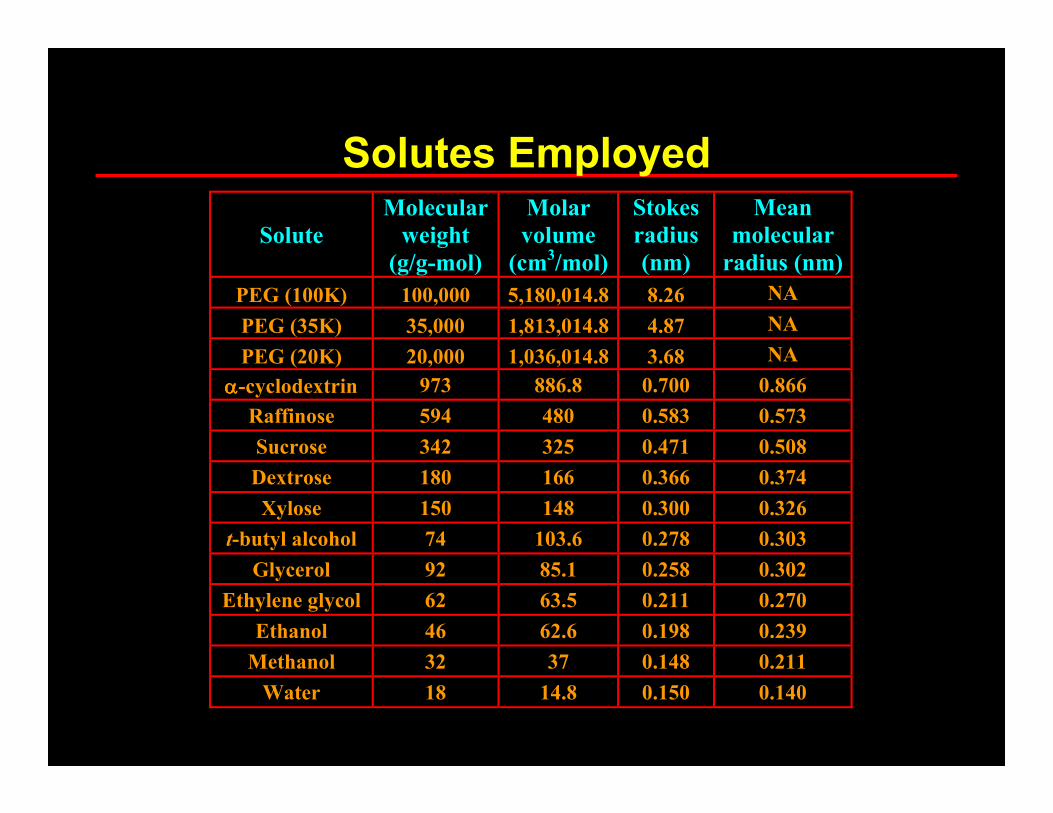
Solutes Employed
Solute
Molecular
weight
(g/g-mol)
Molar
volume
(cm3/mol)
Stokes
radius
(nm)
Mean
molecular
radius (nm)
PEG (100K) 100,000 5,180,014.8 8.26 NA
PEG (35K) 35,000 1,813,014.8 4.87 NA
PEG (20K) 20,000 1,036,014.8 3.68 NA
αααα-cyclodextrin 973 886.8 0.700 0.866
Raffinose 594 480 0.583 0.573
Sucrose 342 325 0.471 0.508
Dextrose 180 166 0.366 0.374
Xylose 150 148 0.300 0.326
t-butyl alcohol 74 103.6 0.278 0.303
Glycerol 92 85.1 0.258 0.302
Ethylene glycol 62 63.5 0.211 0.270
Ethanol 46 62.6 0.198 0.239
Methanol 32 37 0.148 0.211
Water 18 14.8 0.150 0.140
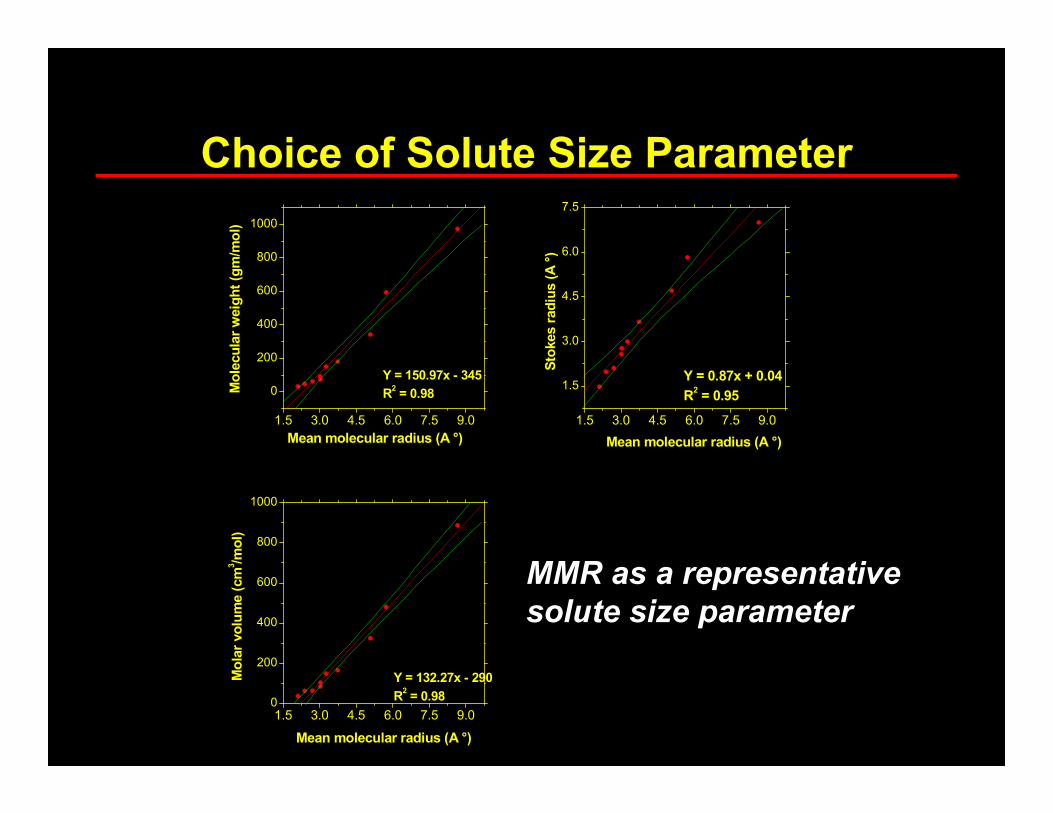
Choice of Solute Size Parameter
1.5 3.0 4.5 6.0 7.5 9.0
0
200
400
600
800
1000
1.5 3.0 4.5 6.0 7.5 9.0
1.5
3.0
4.5
6.0
7.5
1.5 3.0 4.5 6.0 7.5 9.00
200
400
600
800
1000
Y = 150.97x - 345
R2 = 0.98
Molecular weight (gm/mol)
Mean molecular radius (A °)
Y = 0.87x + 0.04
R2 = 0.95
Stokes radius (A °)
Mean molecular radius (A °)
Y = 132.27x - 290
R2 = 0.98
Molar volume (cm
3/mol)
Mean molecular radius (A °)
MMR as a representative
solute size parameter
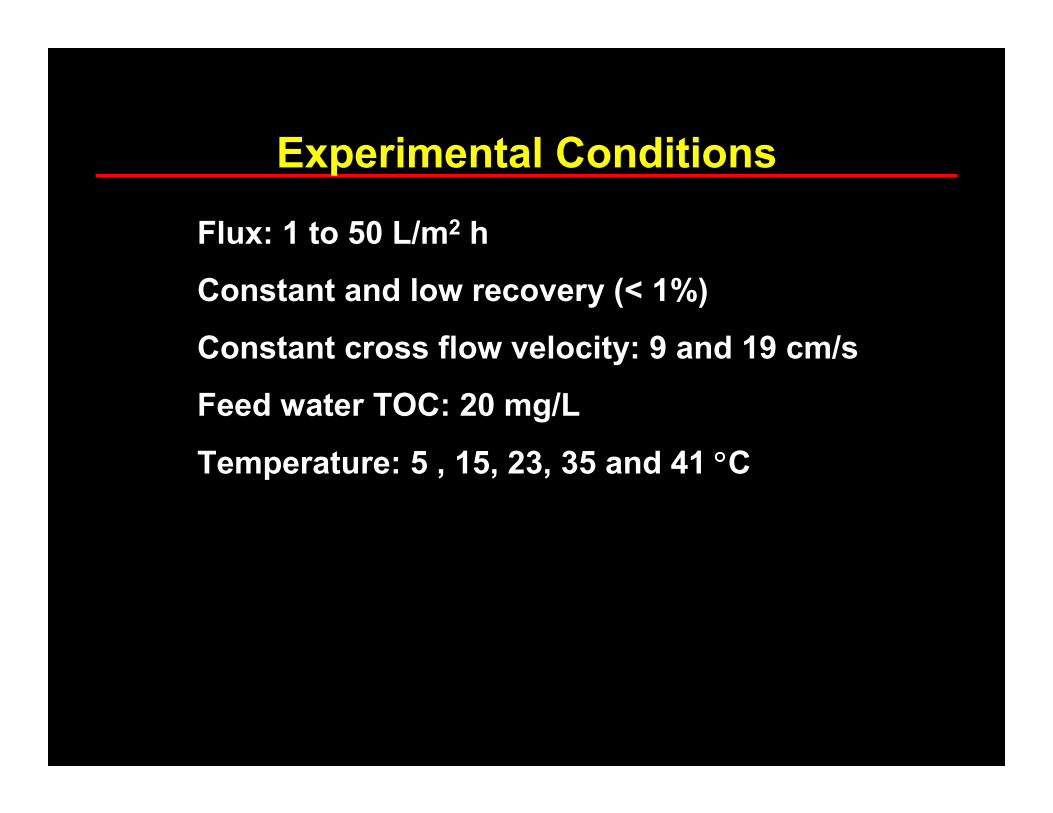
Experimental Conditions
Flux: 1 to 50 L/m2 h
Constant and low recovery (< 1%)
Constant cross flow velocity: 9 and 19 cm/s
Feed water TOC: 20 mg/L
Temperature: 5 , 15, 23, 35 and 41 °°°°C
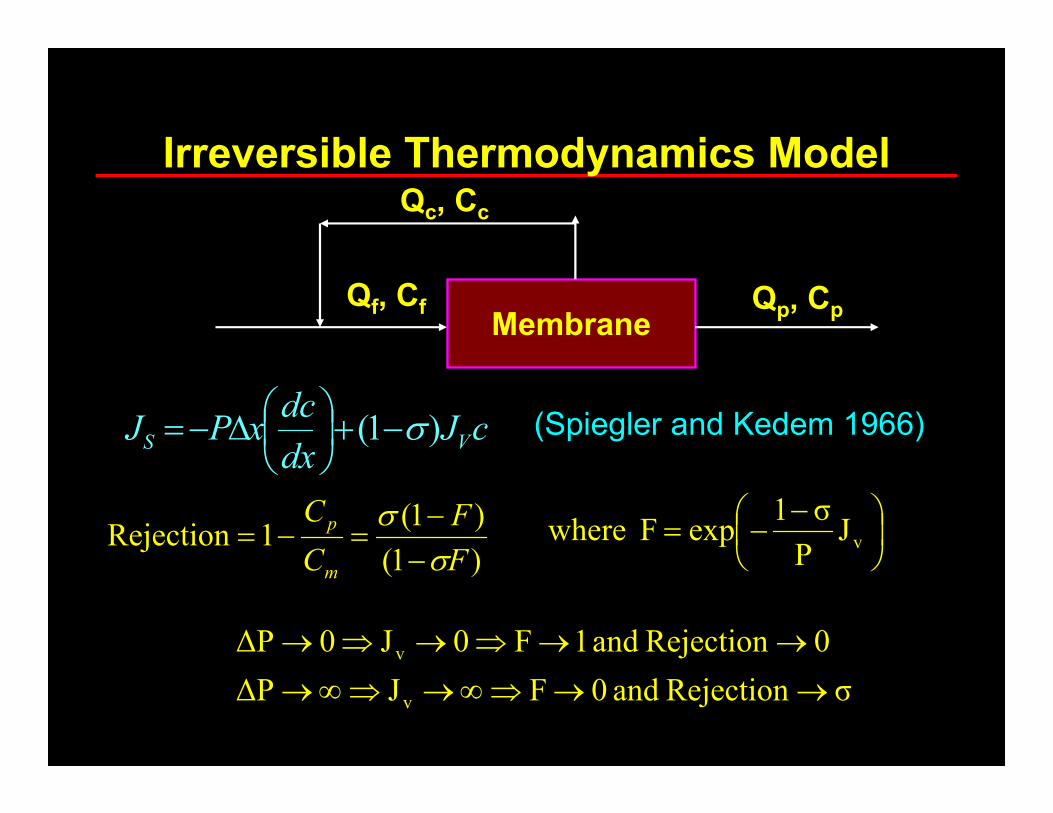
Irreversible Thermodynamics Model
MembraneQf, Cf Qp, Cp
Qc, Cc
)1(
)1(1Rejection
F
F
C
C
m
p
σσ−−
=−=
−−= vJ
P
σ1expF where
cJdx
dcxPJ VS )1( σ−+
∆−= (Spiegler and Kedem 1966)
σRejection and 0FJ∆P
0Rejection and 1F0J0∆P
v
v
→→⇒∞→⇒∞→
→→⇒→⇒→

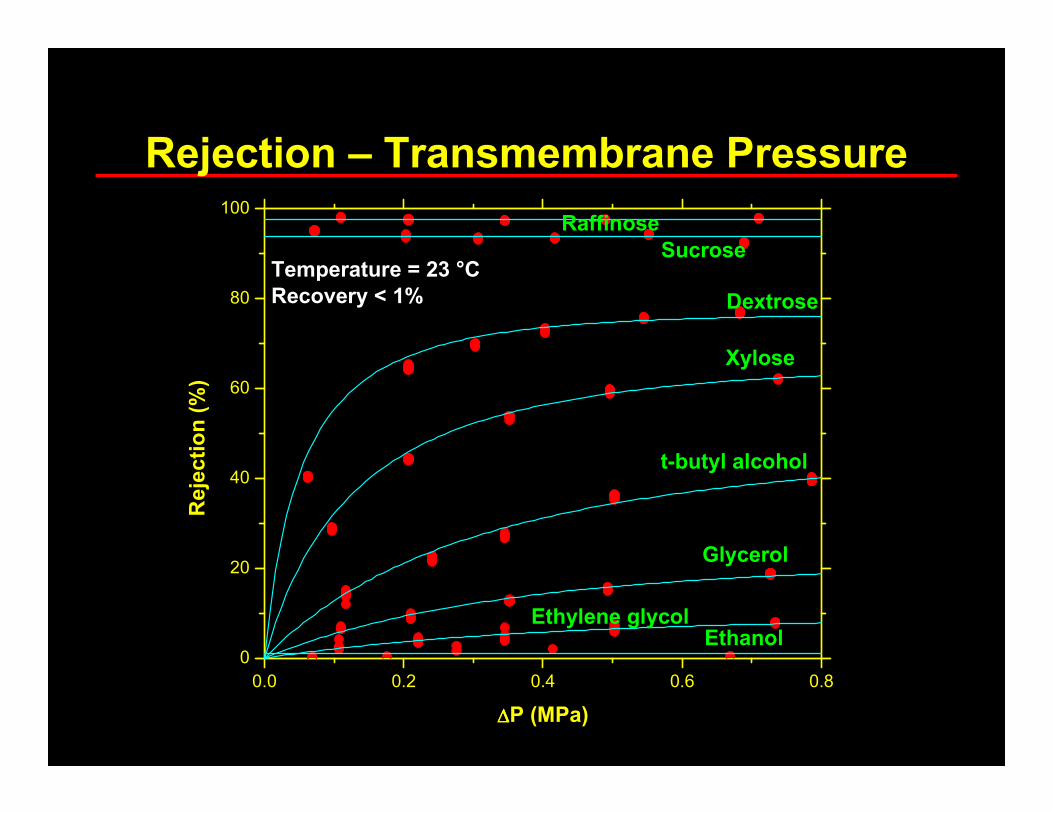
Rejection – Transmembrane Pressure
0.0 0.2 0.4 0.6 0.8
0
20
40
60
80
100
Temperature = 23 °C
Recovery < 1%
Raffinose
Sucrose
Dextrose
Xylose
Glycerol
t-butyl alcohol
Ethylene glycolEthanol
Rejection (%)
∆∆∆∆P (MPa)
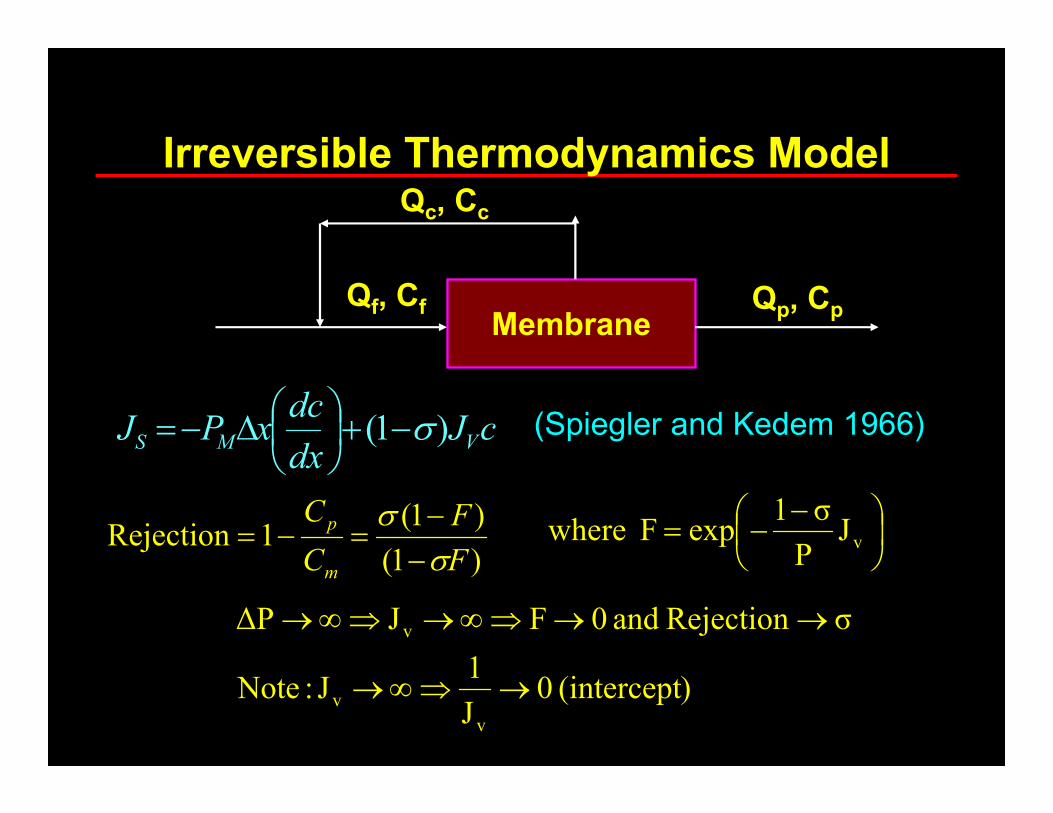
Irreversible Thermodynamics Model
MembraneQf, Cf Qp, Cp
Qc, Cc
)1(
)1(1Rejection
F
F
C
C
m
p
σσ−−
=−=
−−= vJ
P
σ1expF where
cJdx
dcxPJ VMS )1( σ−+
∆−= (Spiegler and Kedem 1966)
)(intercept 0J
1J :Note
σRejection and 0FJ∆P
v
v
v
→⇒∞→
→→⇒∞→⇒∞→
Rejection – Transmembrane Pressure
0.0 0.2 0.4 0.6 0.8
0
20
40
60
80
100
Temperature = 23 °C
Recovery < 1%
Raffinose
Sucrose
Dextrose
Xylose
Glycerol
t-butyl alcohol
Ethylene glycolEthanol
Rejection (%)
∆∆∆∆P (MPa)

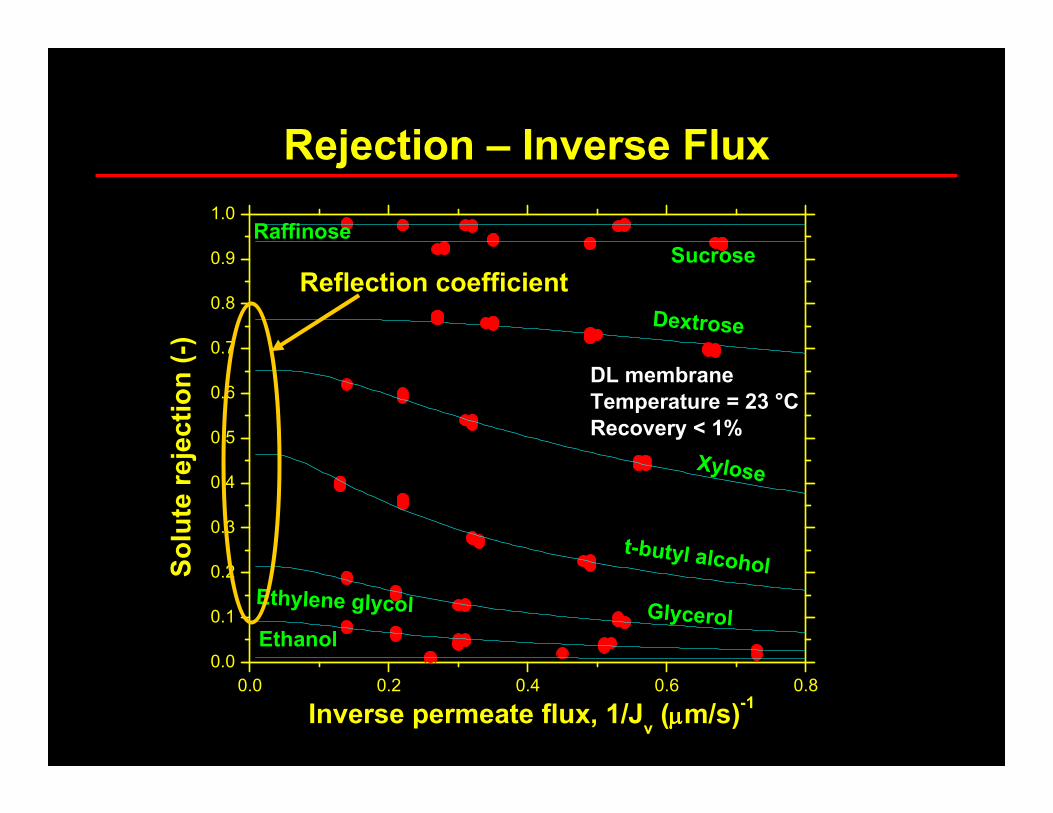
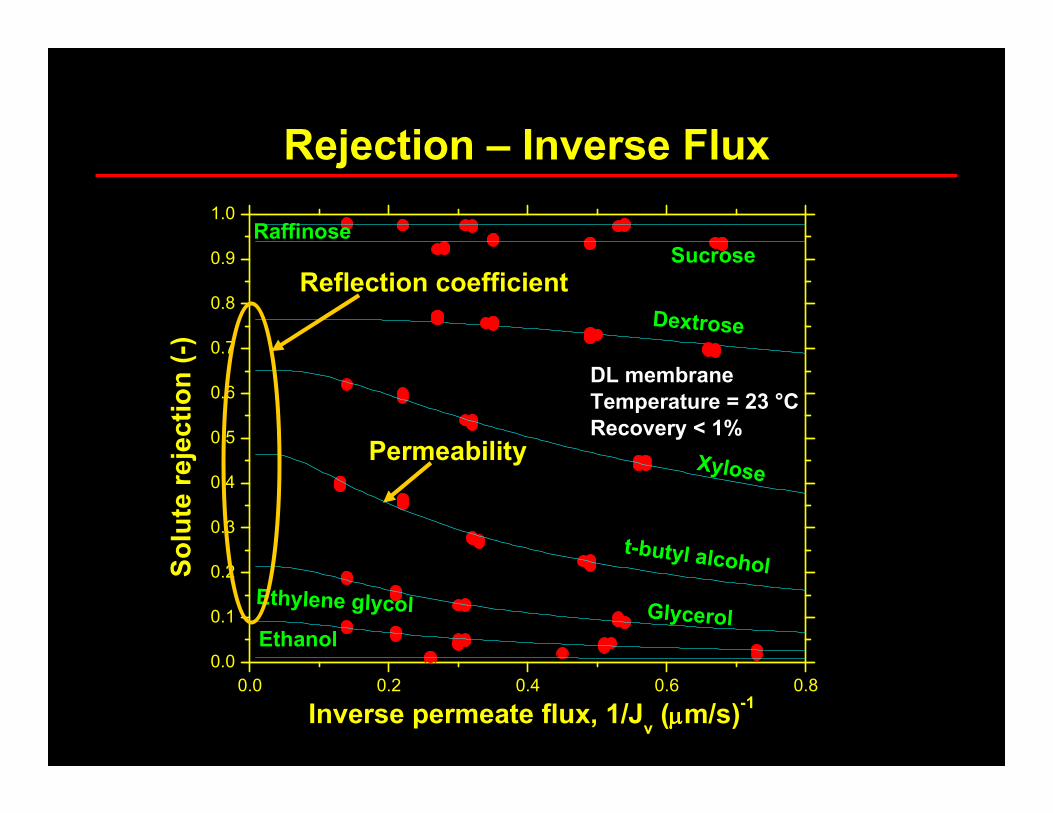
Rejection – Inverse Flux
0.0 0.2 0.4 0.6 0.8
0.0
0.1
0.2
0.3
0.4
0.5
0.6
0.7
0.8
0.9
1.0
DL membrane
Temperature = 23 °C
Recovery < 1%
Xylose
Ethanol
Ethylene glycol Glycerol
t-butyl alcohol
Dextrose
SucroseRaffinose
Inverse permeate flux, 1/Jv (µµµµm/s)
-1
Solute rejection (-)
Rejection – Inverse Flux
0.0 0.2 0.4 0.6 0.8
0.0
0.1
0.2
0.3
0.4
0.5
0.6
0.7
0.8
0.9
1.0
DL membrane
Temperature = 23 °C
Recovery < 1%
Xylose
Ethanol
Ethylene glycol Glycerol
t-butyl alcohol
Dextrose
SucroseRaffinose
Inverse permeate flux, 1/Jv (µµµµm/s)
-1
Solute rejection (-)
Reflection coefficient
Permeability

Lognormal Model
• Assumption of lognormal distribution of pore
sizes
• No hydrodynamic lag involved
( )dr
S2
)rln()rln(exp
r
1
2S
1*)r(
*r
02p
2
p∫
−−
π=σ
Rejection at Jv→∞
∞→vJ
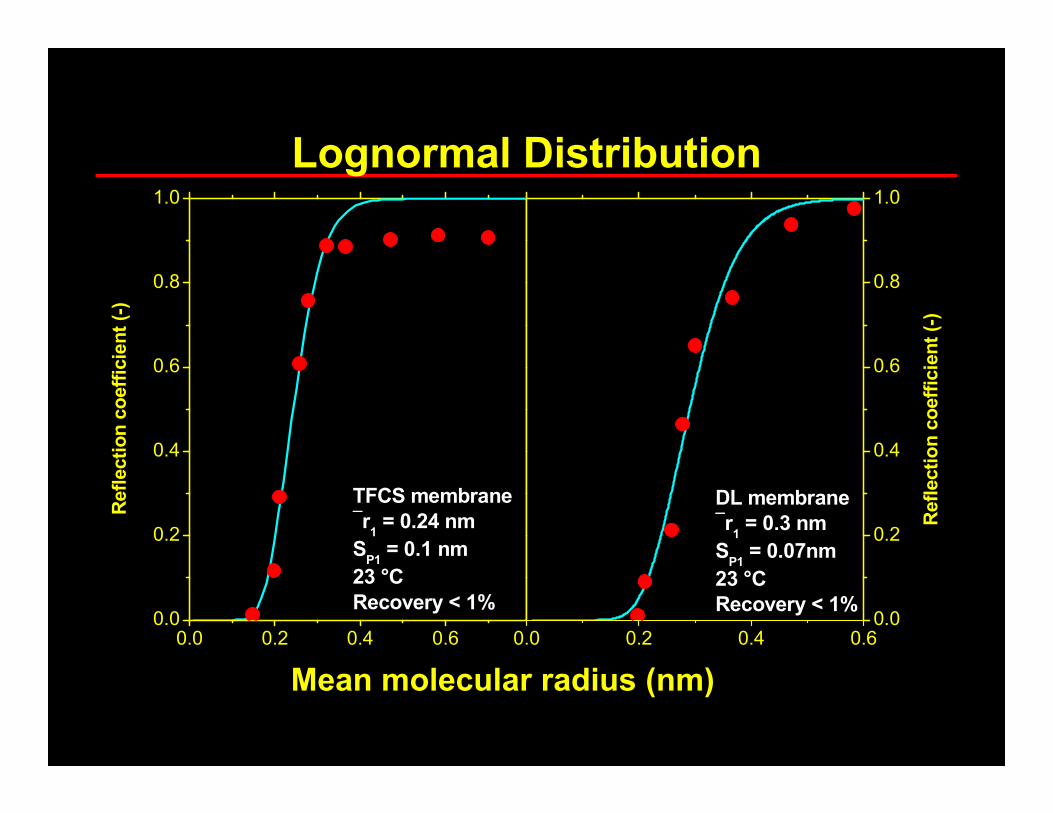
Lognormal Distribution
0.0 0.2 0.4 0.60.0
0.2
0.4
0.6
0.8
1.0
0.0 0.2 0.4 0.60.0
0.2
0.4
0.6
0.8
1.0
Reflection coefficient (-)
TFCS membrane
r1 = 0.24 nm
SP1 = 0.1 nm
23 °C
Recovery < 1%
Solute Stokes radius (nm)
DL membrane
r1 = 0.3 nm
SP1 = 0.07nm
23 °C
Recovery < 1%
Reflection coefficient (-)
Mean molecular radius (nm)
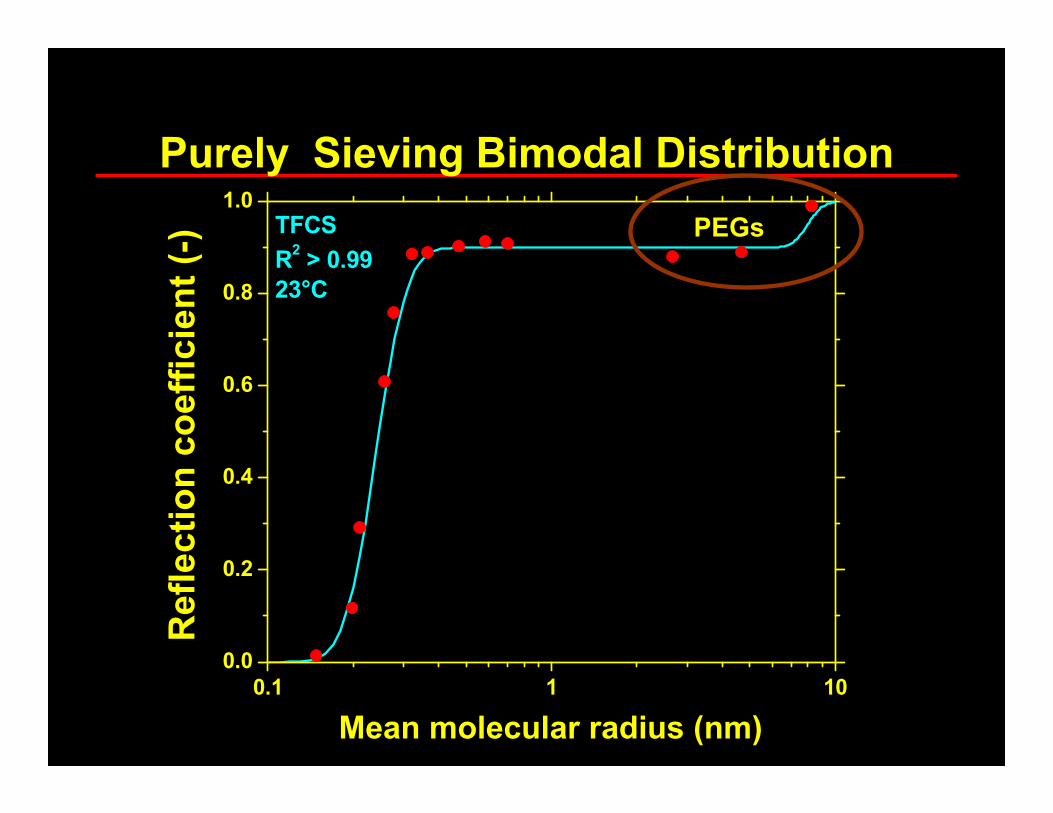
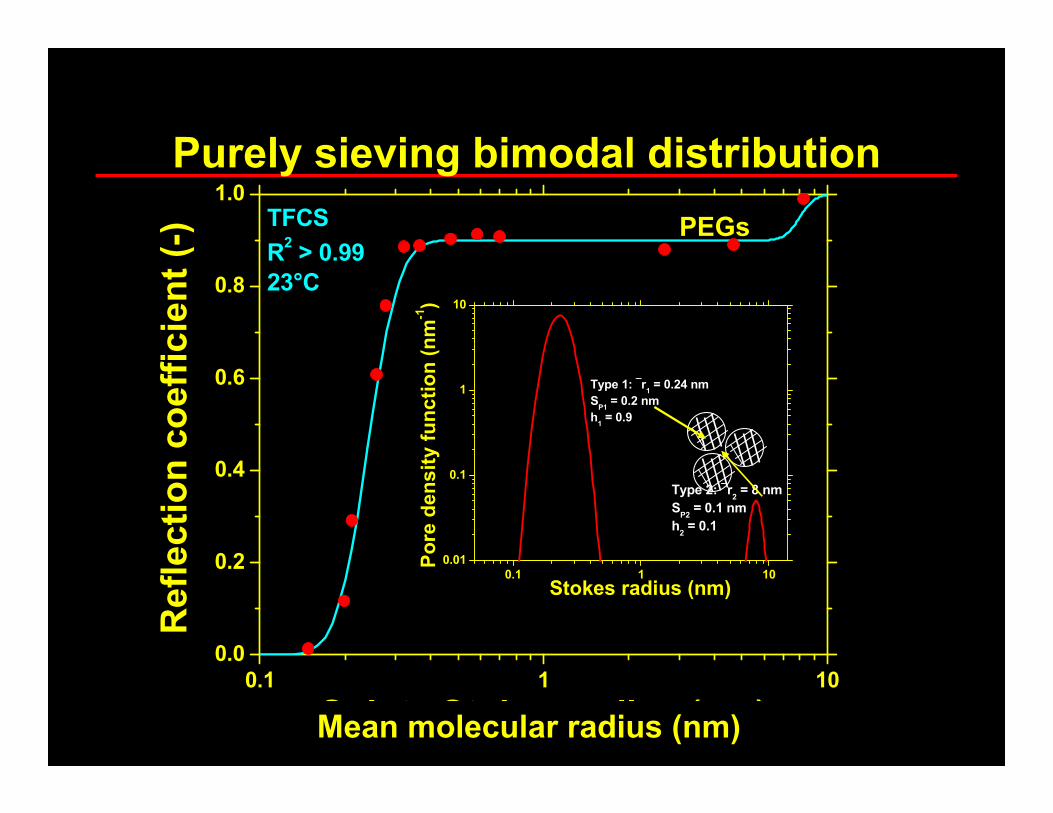
Purely Sieving Bimodal Distribution
0.1 1 10
0.0
0.2
0.4
0.6
0.8
1.0TFCS
R2 > 0.99
23°C
Reflection coefficient (-)
Solute Stokes radius (nm)
PEGs
Mean molecular radius (nm)
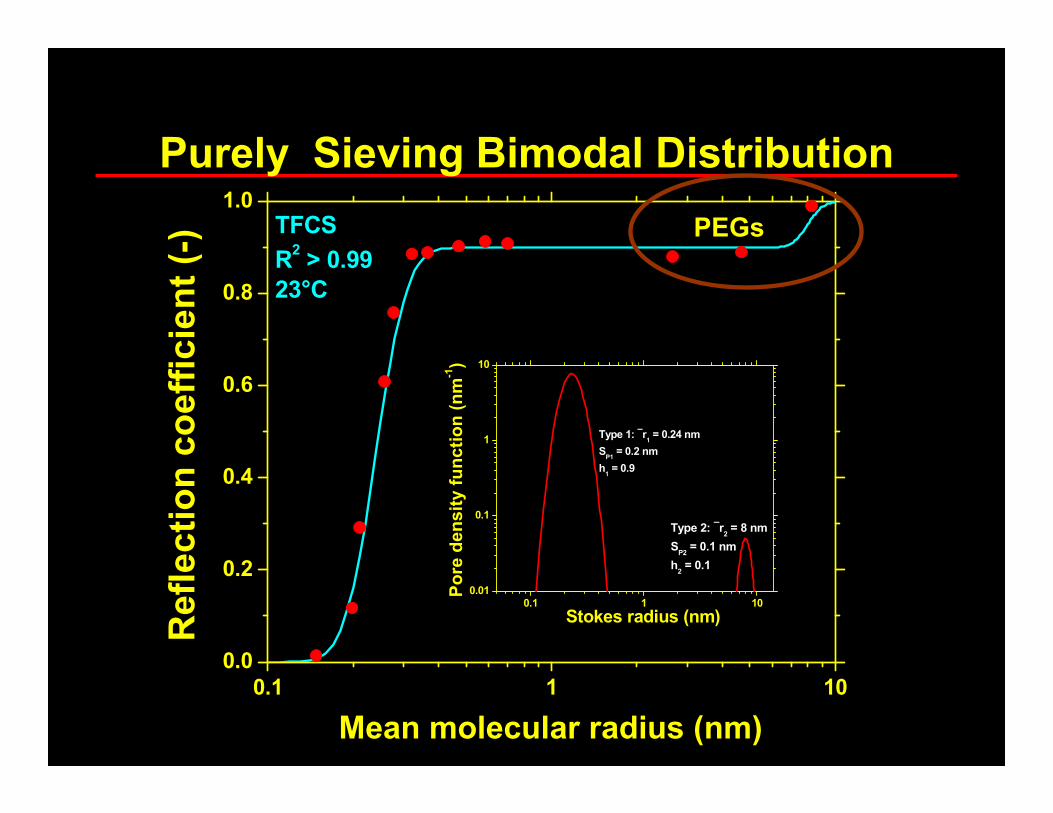
Purely Sieving Bimodal Distribution
0.1 1 10
0.0
0.2
0.4
0.6
0.8
1.0TFCS
R2 > 0.99
23°C
Reflection coefficient (-)
Solute Stokes radius (nm)
0.1 1 100.01
0.1
1
10
Type 2: r2 = 8 nm
SP2 = 0.1 nm
h2 = 0.1
Type 1: r1 = 0.24 nm
SP1 = 0.2 nm
h1 = 0.9
Pore density function (nm
-1)
Stokes radius (nm)
PEGs
Mean molecular radius (nm)
Purely sieving bimodal distribution
0.1 1 10
0.0
0.2
0.4
0.6
0.8
1.0TFCS
R2 > 0.99
23°C
Reflection coefficient (-)
Solute Stokes radius (nm)
0.1 1 10
0.01
0.1
1
10
Type 2: r2 = 8 nm
SP2 = 0.1 nm
h2 = 0.1
Type 1: r1 = 0.24 nm
SP1 = 0.2 nm
h1 = 0.9
Pore density function (nm
-1)
Stokes radius (nm)
PEGs
Mean molecular radius (nm)
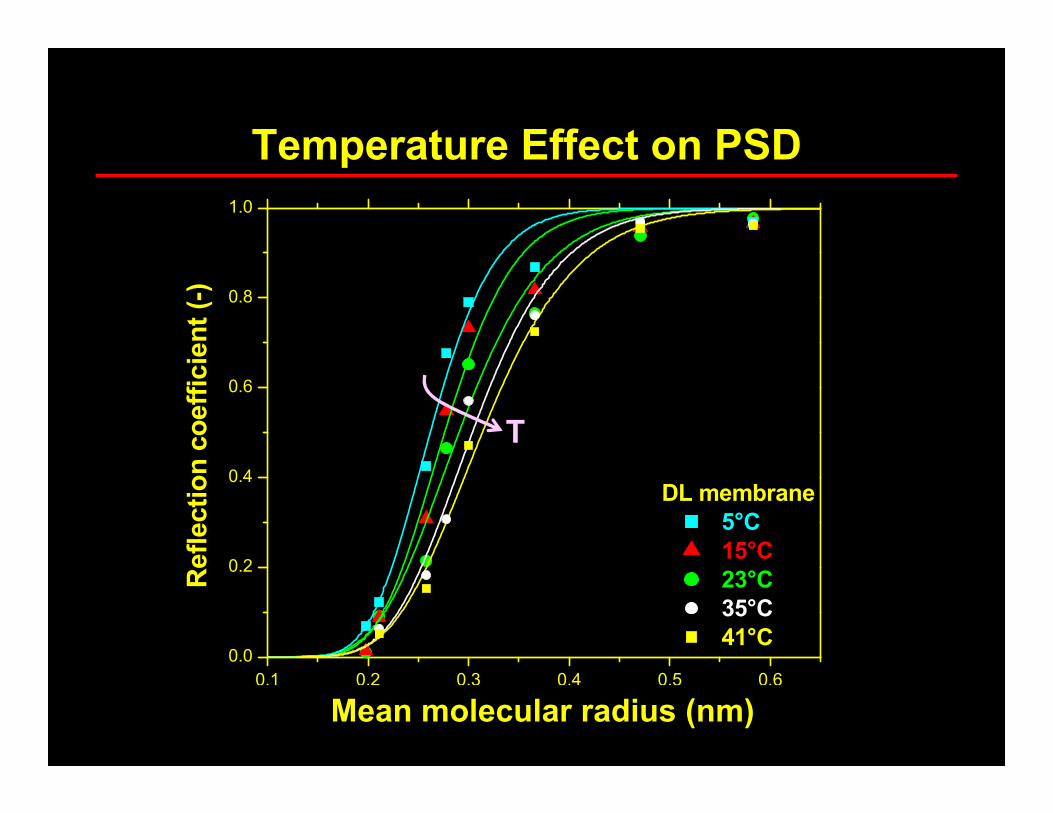
0.1 0.2 0.3 0.4 0.5 0.6
0.0
0.2
0.4
0.6
0.8
1.0
DL membrane
5°C
15°C
23°C
35°C
41°C
Reflection coefficient (-)
Solute Stokes radius (nm)Mean molecular radius (nm)
Temperature Effect on PSD
T
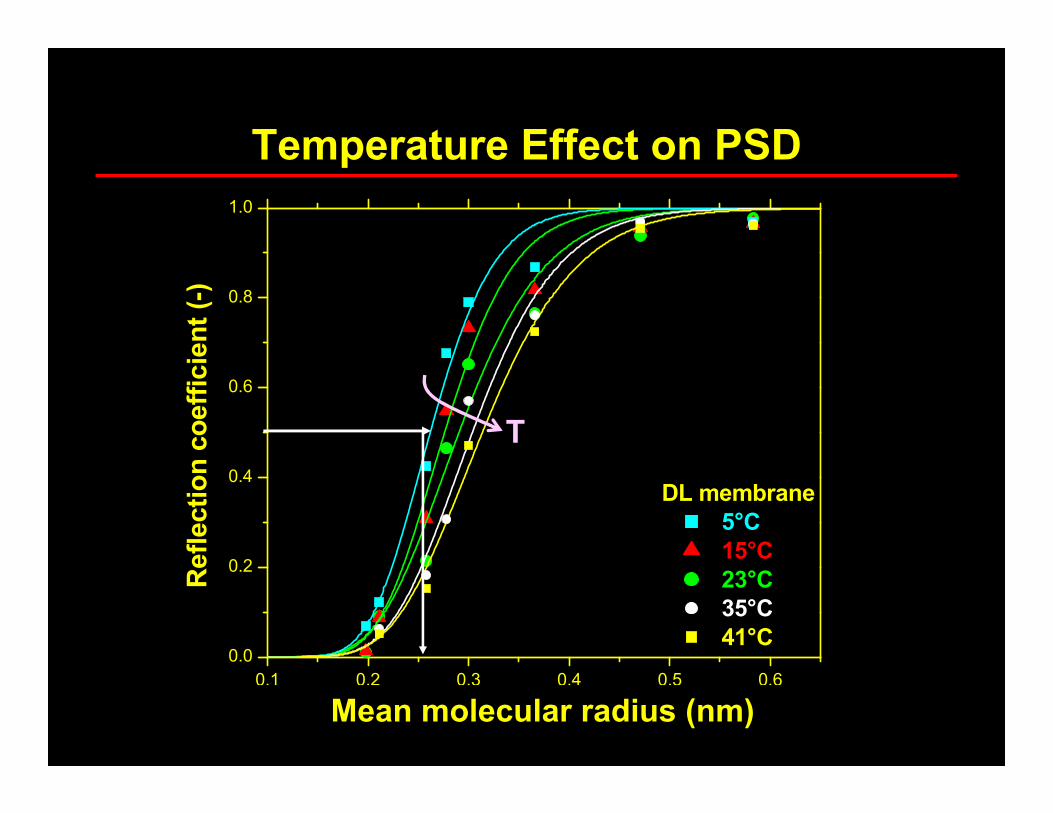
0.1 0.2 0.3 0.4 0.5 0.6
0.0
0.2
0.4
0.6
0.8
1.0
DL membrane
5°C
15°C
23°C
35°C
41°C
Reflection coefficient (-)
Solute Stokes radius (nm)Mean molecular radius (nm)
Temperature Effect on PSD
T

Increasing Mean Pore Radii
0 5 10 15 20 25 30 35 40 45
0.27
0.30
0.33
0.35
Mean pore radius (nm)
Temperature (°C)
DL
TFCS

Irreversible Thermodynamics Model
MembraneQf, Cf Qp, Cp
Qc, Cc
)1(
)1(1Rejection
F
F
C
C
m
p
σσ−−
=−=
−−= vJ
P
σ1expF where
cJdx
dcxPJ VS )1( σ−+
∆−= (Spiegler and Kedem 1966)
0Rejection and 1F0J0∆P
σRejection and 0FJ∆P
v
v
→→⇒→⇒→
→→⇒∞→⇒∞→
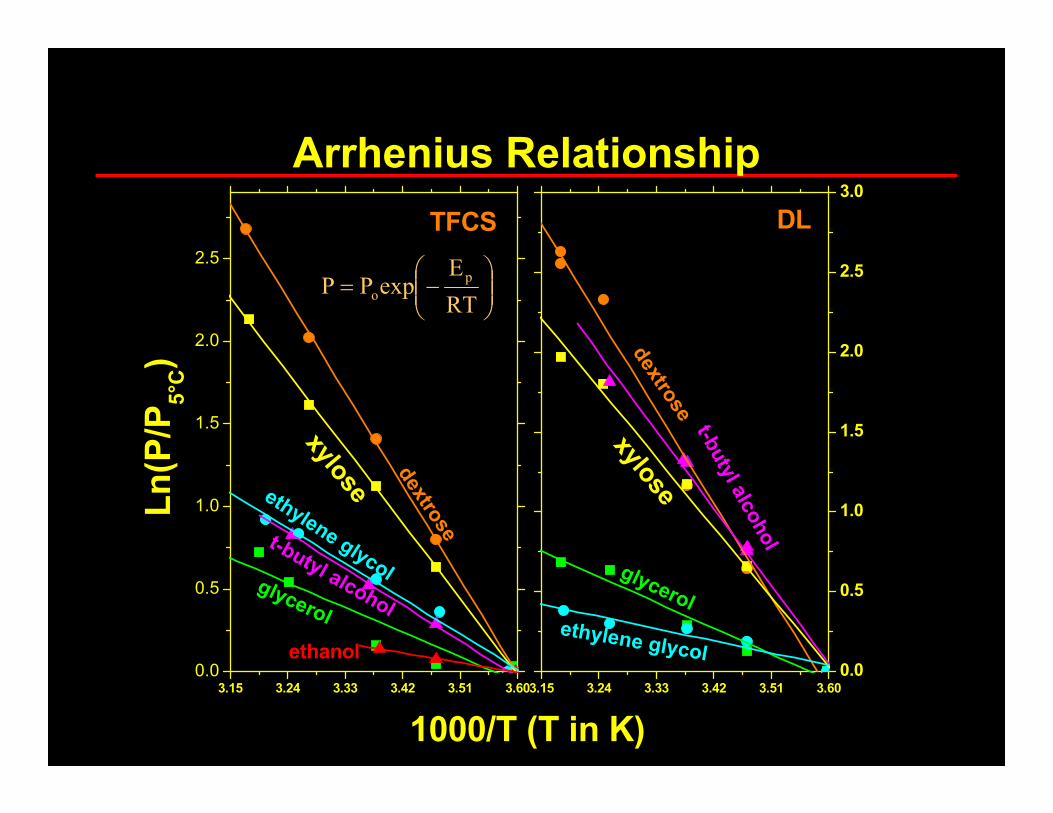
Arrhenius Relationship
3.15 3.24 3.33 3.42 3.51 3.60
0.0
0.5
1.0
1.5
2.0
2.5
3.15 3.24 3.33 3.42 3.51 3.60
0.0
0.5
1.0
1.5
2.0
2.5
3.0
1000/T (T in K)
Ln(P/P
5°C)
TFCS
dextro
se
xyloseethylene glycol
t-butyl alcoholglycerol
ethanol
t-butyl alcohol
dextro
se
xylose
glycerol
ethylene glycol
DL
−=RT
EexpPP
p
o
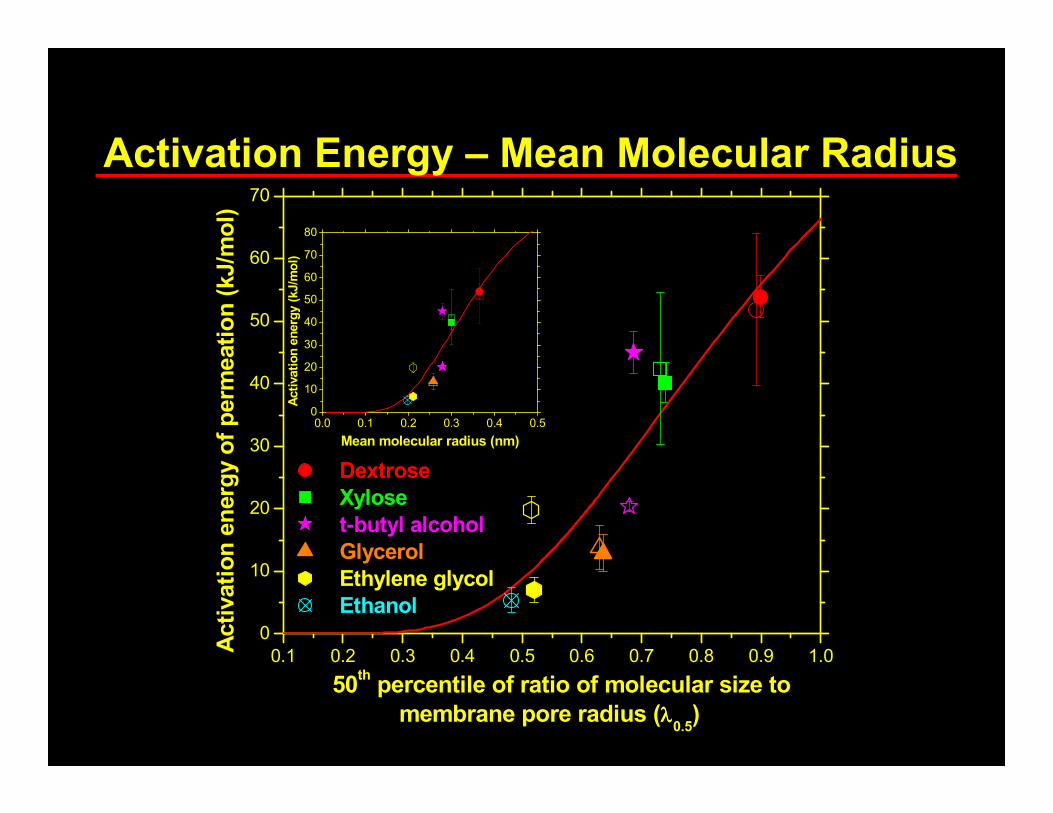
Activation Energy – Mean Molecular Radius
0.1 0.2 0.3 0.4 0.5 0.6 0.7 0.8 0.9 1.0
0
10
20
30
40
50
60
70
0.0 0.1 0.2 0.3 0.4 0.50
10
20
30
40
50
60
70
80
50th percentile of ratio of molecular size to
membrane pore radius (λλλλ0.5)
Dextrose
Xylose
t-butyl alcohol
Glycerol
Ethylene glycol
Ethanol
Activation energy of permeation (kJ/mol)
Activation energy (kJ/mol)
Mean molecular radius (nm)

Conclusion
Low Temperature High Temperature
With increase in temperature
• Salt passage↑↑↑↑ (Mehdizadeh, et al. 1989)• Natural organic matter passage↑↑↑↑ (Her, et al. 2000)• Arsenic passage↑↑↑↑ (Waypa, et al. 1997)
•Water permeability↑↑↑↑ (Sharma, et al., 2003)
Lessons Learned!
• NF membranes are NOT like RO membranes
• Because pore sizes are lognormally
distributed, even a few large pores may
determine membrane selectivity
• Need for a membrane specific temperature
correction factor
• Rejection of larger size contaminant is more
sensitive to temperature
Peer Reviewed Articles• Temperature Effects on Sieving Characteristics of
Nanofiltration Membranes: Pore Size Distributions and
Transport Parameters. JMS (2003) 223, 69-87
• Temperature Effects on Morphology of Porous Nanofiltration
Membranes. ES&T, (2005) 39, 5022-5030.
• Temperature and Concentration Effects on Electrolyte
Transport across Porous Nanofiltration Membranes. JCIS,
(2006) 298, 327-340.
• Frictional interpretation of thermodynamic transport
parameters for porous nanofiltration membranes. Journal of
Water Supply: Research and Technology—AQUA Vol 55 No 7-
8 pp 571–587

Acknowledgement
Funding agency National Science
Foundation
Collaborators Dr. Advincula and Prasad for
molecular mechanics simulations

Questions!