nanomaterials and fabrication: atomic force microscopy ii · interaction forces, surface potential...
TRANSCRIPT

Vertiefungsvorlesung
Nanomaterials and Fabrication:Atomic Force Microscopy II
PD Dr. André SchirmeisenPhysikalisches Institut, WWU Münster
www.CeNTech.de/nanoMechanics
4-Quadranten-Photodiode Laser
Cantilever
Probe Spitze
x-, y-, z-Raster-einheit (“Scanner”)
Typische Parameter:
Cantilever:
Länge: 125 ... 450 µmBreite: 15 ... 50 µm
Dicke: 0.3 ... 5 µm
Federkonstanten:
Kontaktmodus:
0.005 ... 0.5 N/m
Dynamischer Modus:
5 ... 50 N/m
Raster-Kraft-Mikroskop(engl. Atomic Force Microscope, AFM)

interaction forces,surface potential
tip-sampledistance
repulsiveforces
attractiveforces
F(z)=-dV/dz
V(z)
1 Å
contact
non-contact
intermittent contact / tapping
Spitzen-Proben-Kräfte/Potential
image: B. Anczykowski, nanoAnalytics GmbH
FM-AFM - Prinzip
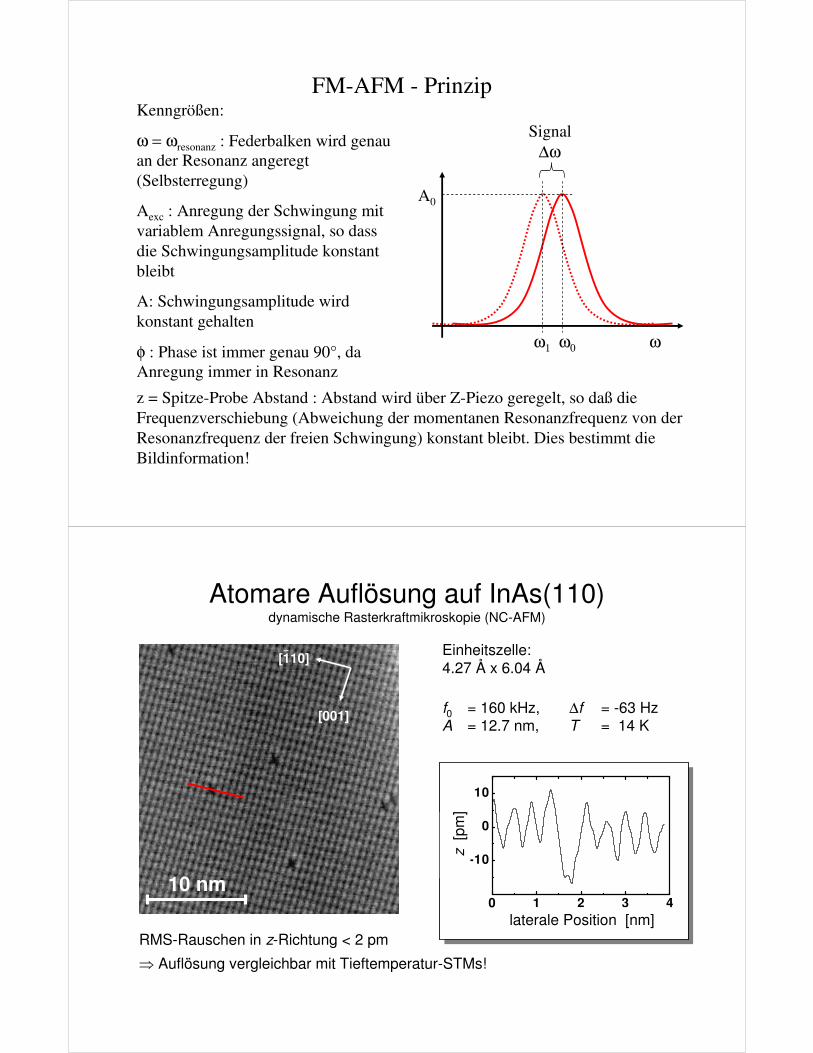
FM-AFM - PrinzipKenngrößen:
ω = ωresonanz : Federbalken wird genau
an der Resonanz angeregt
(Selbsterregung)
Aexc : Anregung der Schwingung mit
variablem Anregungssignal, so dass
die Schwingungsamplitude konstant
bleibt
A: Schwingungsamplitude wird
konstant gehalten
φ : Phase ist immer genau 90°, da
Anregung immer in Resonanz
ω0 ω
A0
ω1
∆ω
z = Spitze-Probe Abstand : Abstand wird über Z-Piezo geregelt, so daß die
Frequenzverschiebung (Abweichung der momentanen Resonanzfrequenz von der
Resonanzfrequenz der freien Schwingung) konstant bleibt. Dies bestimmt die
Bildinformation!
Signal
f0 = 160 kHz, ∆f = -63 HzA = 12.7 nm, T = 14 K
Einheitszelle:4.27 Å x 6.04 Å
10 nm
[001]
[110]
0 1 2 3 4
-10
0
10
z [
pm
]
lateral position [nm]laterale Position [nm]
z[p
m]
RMS-Rauschen in z-Richtung < 2 pm
⇒ Auflösung vergleichbar mit Tieftemperatur-STMs!
Atomare Auflösung auf InAs(110)dynamische Rasterkraftmikroskopie (NC-AFM)

Bildkontrastmechanismus
am Beispiel Ag(110)
Case Study – Theory & Experiment Ag(110)
Top layeratoms2nd layer
atoms
rows
ncAFM on Ag(110), UHV, room temperature
0.290 nm 0.409 nm
Ag(110)
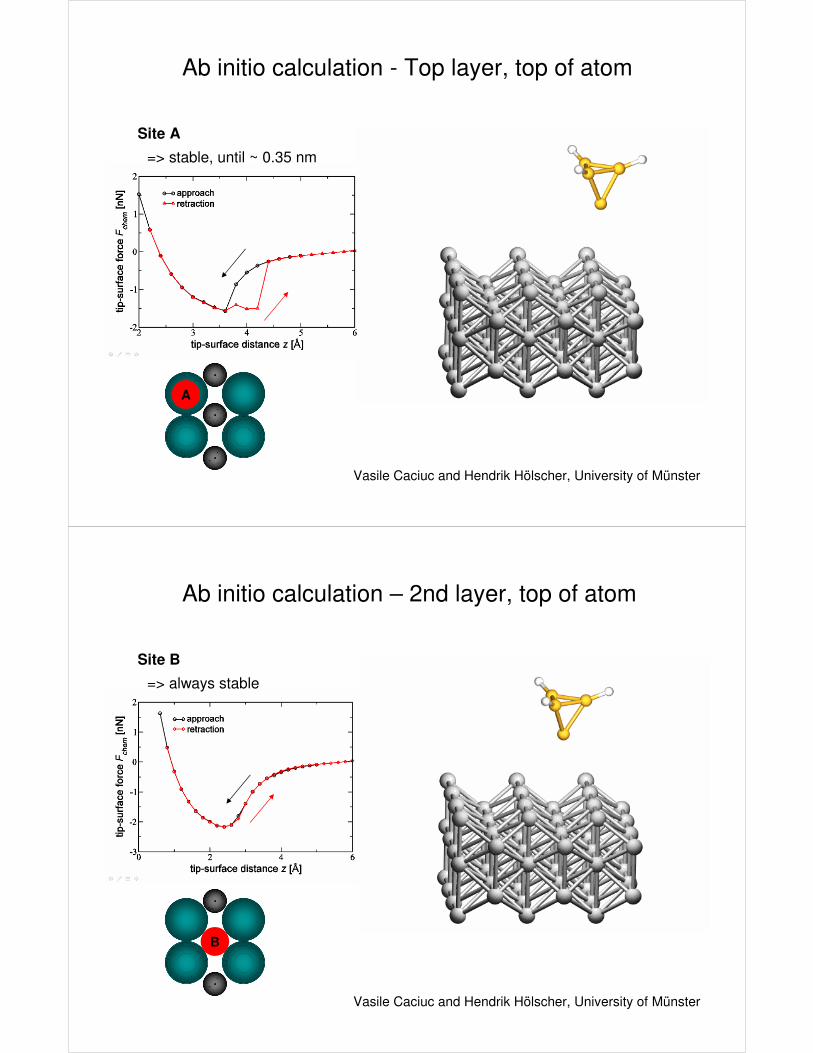
Ab initio calculation - Top layer, top of atom
Vasile Caciuc and Hendrik Hölscher, University of Münster
=> stable, until ~ 0.35 nm
Site A
A
Ab initio calculation – 2nd layer, top of atom
=> always stable
Site B
Vasile Caciuc and Hendrik Hölscher, University of Münster
B
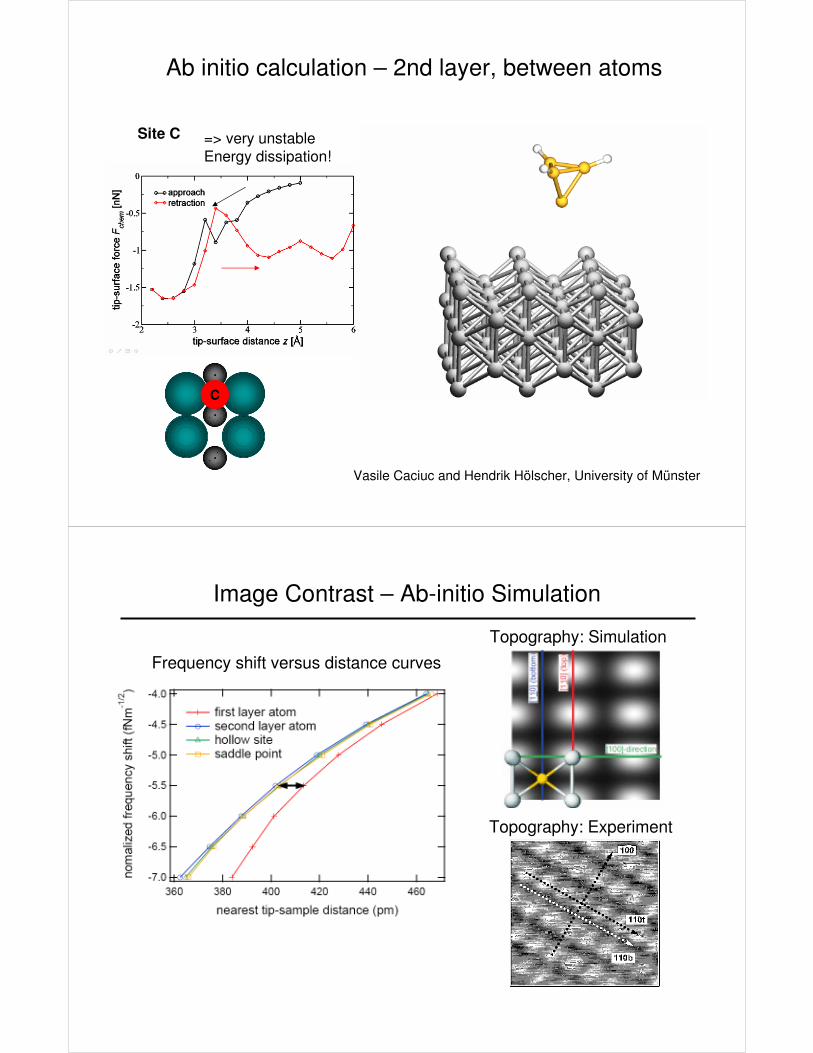
Ab initio calculation – 2nd layer, between atoms
=> very unstableEnergy dissipation!
Site C
C
Vasile Caciuc and Hendrik Hölscher, University of Münster
Frequency shift versus distance curves
Topography: Simulation
Image Contrast – Ab-initio Simulation
Topography: Experiment

Ab-initio simulation
Height Profiles – Theory vs. Experiment
NC-AFM experiment
Atomic contrast in NC-AFM: Short range chemical binding forces
Energy Dissipation in Dynamic AFM
Energy dissipationcauses damping of oscillation
Amplitude gainfactor is a measureof dissipated energy
From: Schirmeisen, Anczykowski, Fuchs in Springer Handbook of Nanotechnology, Edt. Bushan, 2007

2x2 nm
topography
dissipation
line profile A
line profile B
Experiment: topography and dissipation
topography
topographydissipation
dissipation
Energy Dissipation in Dynamic AFM
NC-AFM: Spitze oszilliert durchgehend (~ 5-10 nm)
Krafthysterese in den Kurven:Fläche zwischen ‘Approach’und ‘Retraction’ = Dissipierte Energie

A. Reversable(until force minimum) B. Fully reversable
C. Irreversable,Strong mechanical relaxation
Summary ab initio simulations
Little energy dissipation Increased energy dissipation
topography dissipation
2x2 nm
Experiment: topography and dissipation
Experiment: Domenique Weiner, University of Münster
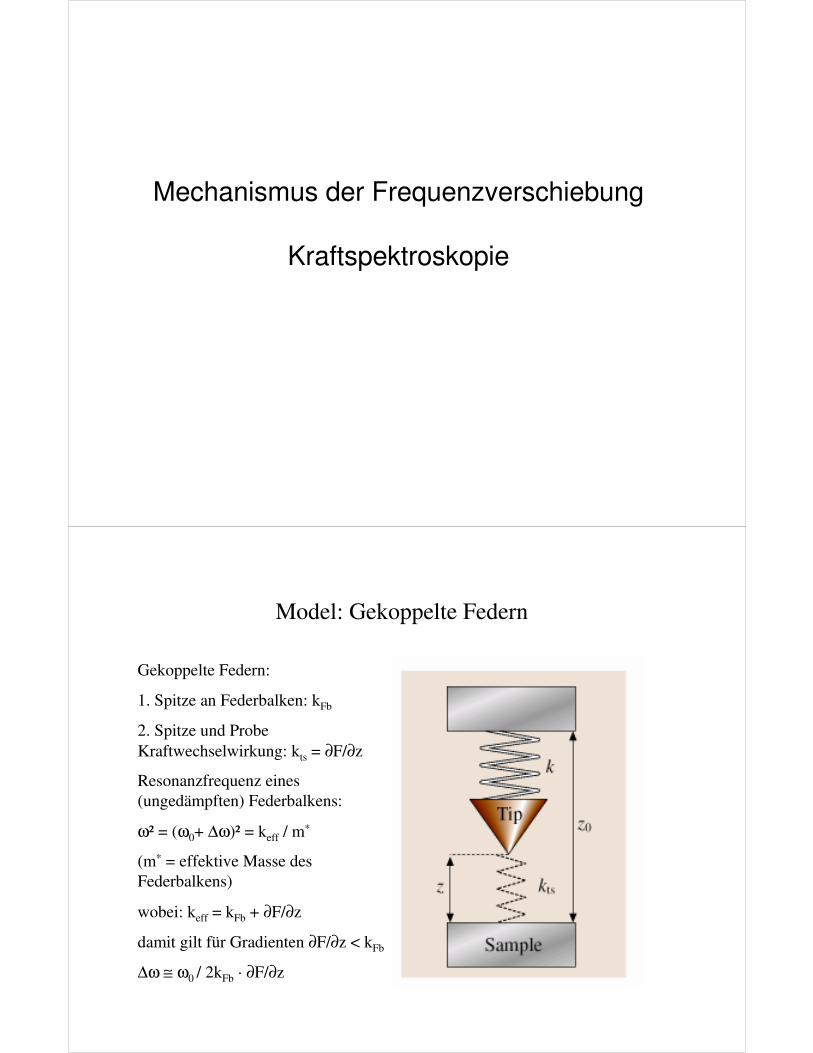
Mechanismus der Frequenzverschiebung
Kraftspektroskopie
Model: Gekoppelte Federn
Gekoppelte Federn:
1. Spitze an Federbalken: kFb
2. Spitze und Probe
Kraftwechselwirkung: kts = ∂F/∂z
Resonanzfrequenz eines
(ungedämpften) Federbalkens:
ω² = (ω0+ ∆ω)² = keff / m*
(m* = effektive Masse des
Federbalkens)
wobei: keff = kFb + ∂F/∂z
damit gilt für Gradienten ∂F/∂z < kFb
∆ω ≅ ω0 / 2kFb · ∂F/∂z
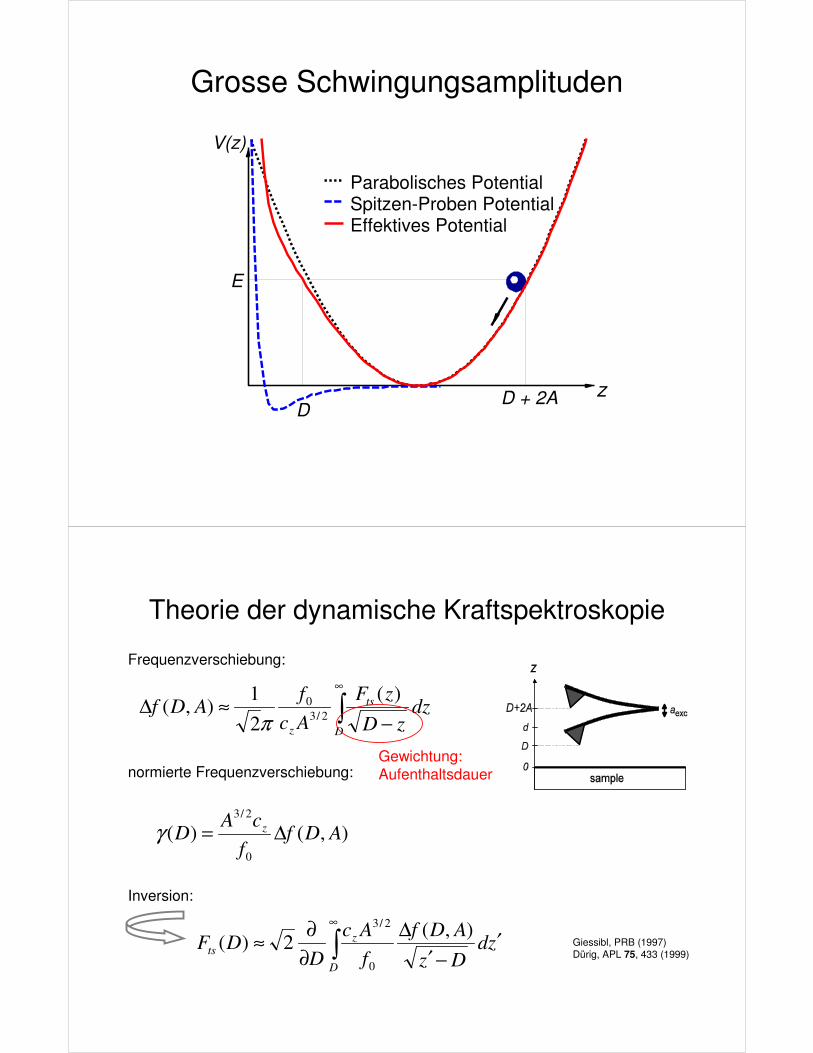
V(z)
E
zD + 2AD
Parabolisches PotentialSpitzen-Proben PotentialEffektives Potential
Grosse Schwingungsamplituden
Theorie der dynamische Kraftspektroskopie
∫∞
−≈∆
D
ts
z
dzzD
zF
Ac
fADf
)(
2
1),(
2/3
0
π
Giessibl, PRB (1997)Dürig, APL 75, 433 (1999)
Frequenzverschiebung:
Inversion:
∫∞
′−′
∆
∂
∂≈
D
zts zd
Dz
ADf
f
Ac
DDF
),(2)(
0
2/3
normierte Frequenzverschiebung:
),()(0
2/3
ADff
cAD z ∆=γ
Gewichtung: Aufenthaltsdauer
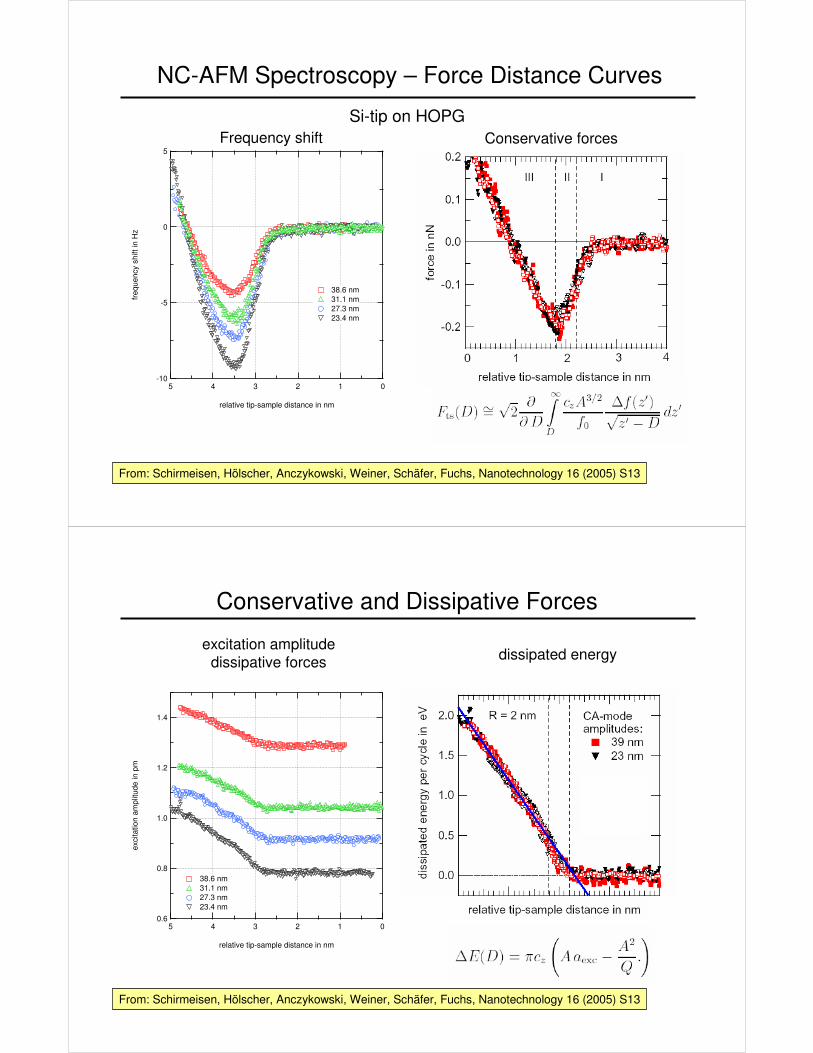
NC-AFM Spectroscopy – Force Distance Curves
-10
-5
0
5
freq
uenc
y sh
ift in
Hz
5 4 3 2 1 0
relative tip-sample distance in nm
38.6 nm 31.1 nm 27.3 nm 23.4 nm
Frequency shiftSi-tip on HOPG
From: Schirmeisen, Hölscher, Anczykowski, Weiner, Schäfer, Fuchs, Nanotechnology 16 (2005) S13
Conservative forces
Conservative and Dissipative Forces
dissipated energy
1.4
1.2
1.0
0.8
0.6
exci
tatio
n am
plitu
de in
pm
5 4 3 2 1 0
relative tip-sample distance in nm
38.6 nm 31.1 nm 27.3 nm 23.4 nm
excitation amplitude dissipative forces
From: Schirmeisen, Hölscher, Anczykowski, Weiner, Schäfer, Fuchs, Nanotechnology 16 (2005) S13

3-dimensionale Kraftfelder
Dynamics of Adatoms on Surface
Energy barrier for atomic jumps
different interaction potential energy fo A and B sites
- Potential energy landscape responsible for surface atom dynamics
- Crystal growth, facetting, catalytic action
- Tribology: Atomic friction models
A site B site
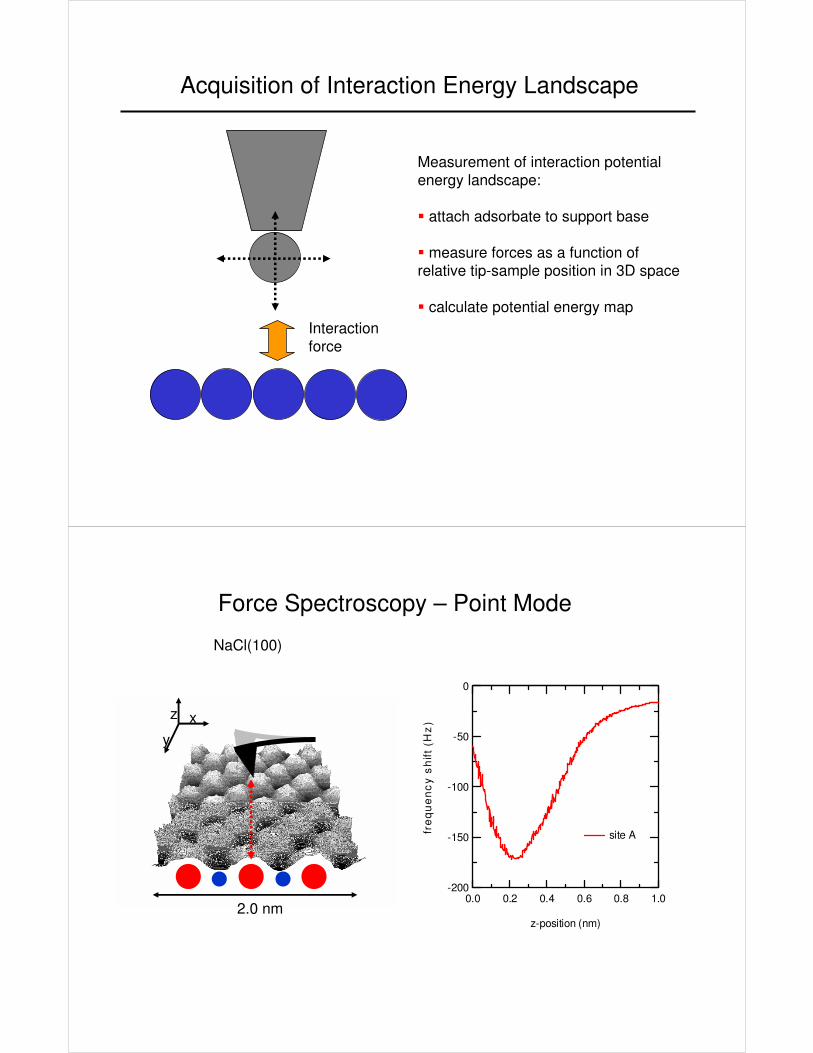
Acquisition of Interaction Energy Landscape
Interaction force
Measurement of interaction potential energy landscape:
� attach adsorbate to support base
� measure forces as a function of relative tip-sample position in 3D space
� calculate potential energy map
Force Spectroscopy – Point Mode
2.0 nm
yxz
-200
-150
-100
-50
0
fre
qu
en
cy
sh
ift (
Hz
)
1.00.80.60.40.20.0
z-position (nm)
site A
NaCl(100)

2.0 nm
yxz
-200
-150
-100
-50
0
fre
qu
en
cy
sh
ift (
Hz
)
1.00.80.60.40.20.0
z-position (nm)
site A site B
Force Spectroscopy – Point Mode
NaCl(100)
3D Spectroscopy – Principle of Operation
2.0 nm
y
xz Na+Cl-
a = 0.56 nm
3d force spectroscopy: Hölscher et al., Appl. Phys. Lett. 81 (2002) 4428
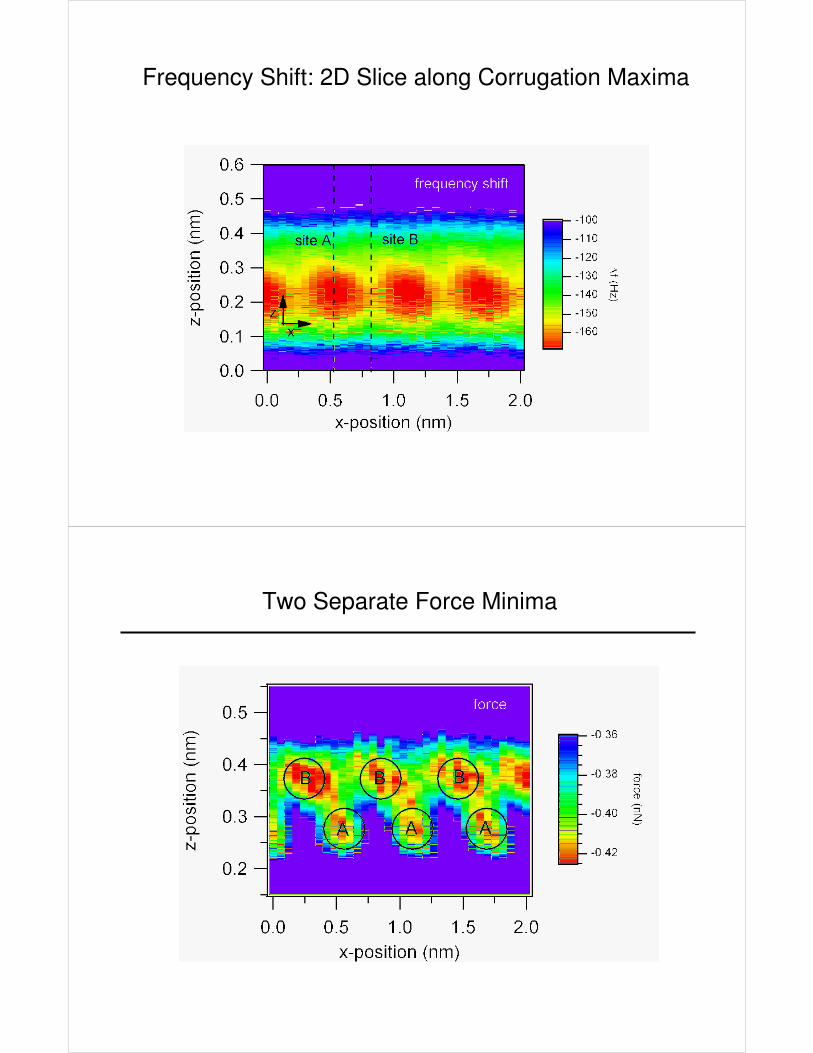
Frequency Shift: 2D Slice along Corrugation Maxima
Two Separate Force Minima
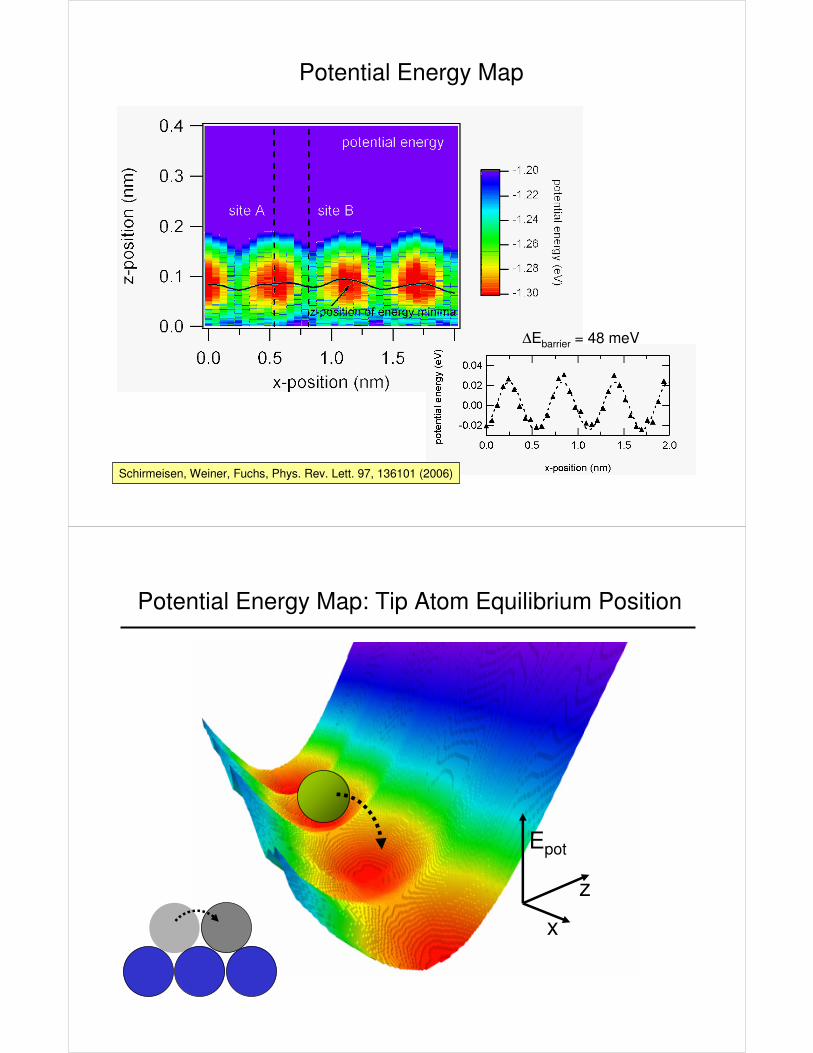
Potential Energy Map
∆Ebarrier = 48 meV
Schirmeisen, Weiner, Fuchs, Phys. Rev. Lett. 97, 136101 (2006)
Potential Energy Map: Tip Atom Equilibrium Position
x
z
Epot
x
z
Epot
z
zxEzxF
pot
z∂
∂=
),(),(
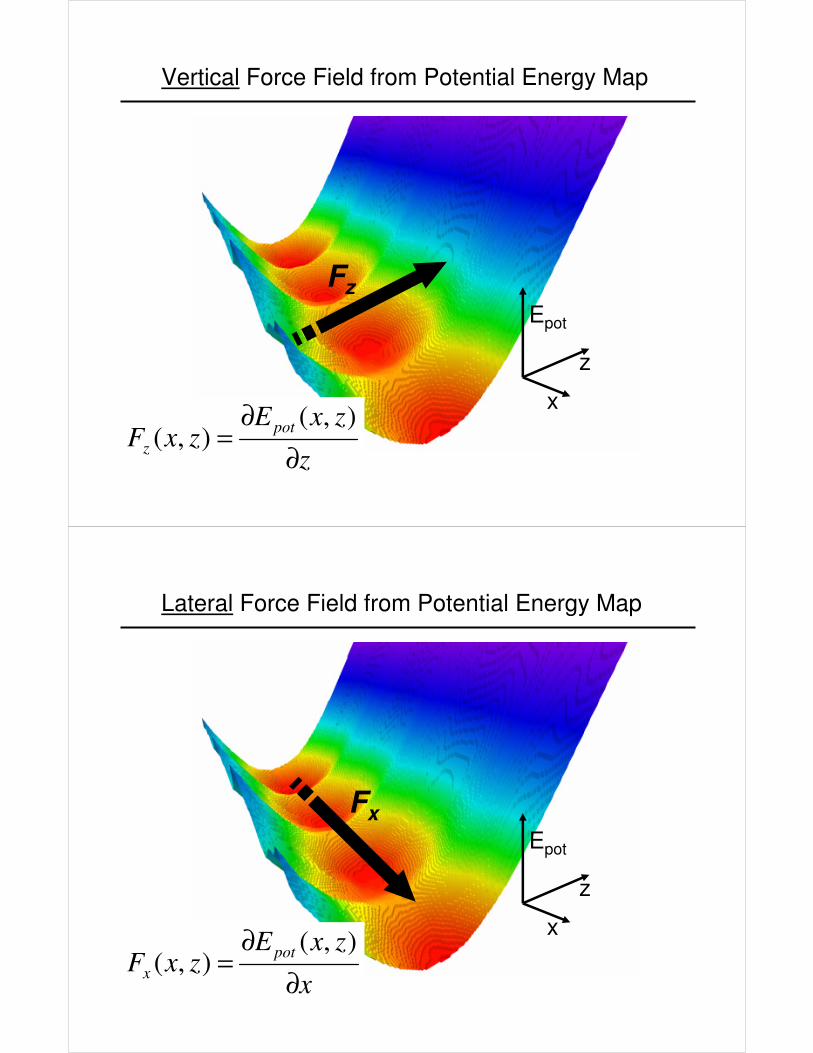
Vertical Force Field from Potential Energy Map
Fz
x
z
Epot
Lateral Force Field from Potential Energy Map
Fx
x
zxEzxF
pot
x∂
∂=
),(),(

Lateral Forces from Potential Energy Map
Flateral = dVts(x,z) / dx
A A ABBB
Lateral forces similar to ‘site-specific’ normal forces!
Lateral forces from energy profile:Schwarz et al., AIP Conf. Proc. 696 (2003) 68
Simultaneously Acquired Energy Dissipation
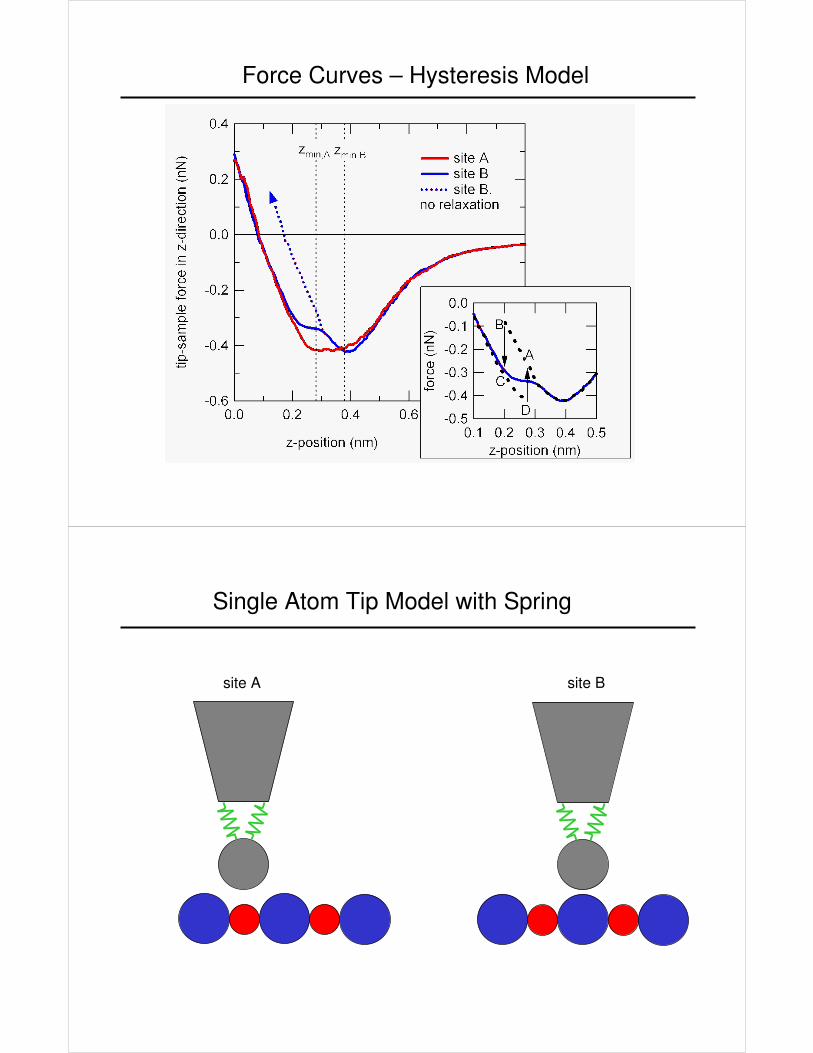
Force Curves – Hysteresis Model
Single Atom Tip Model with Spring
site A site B
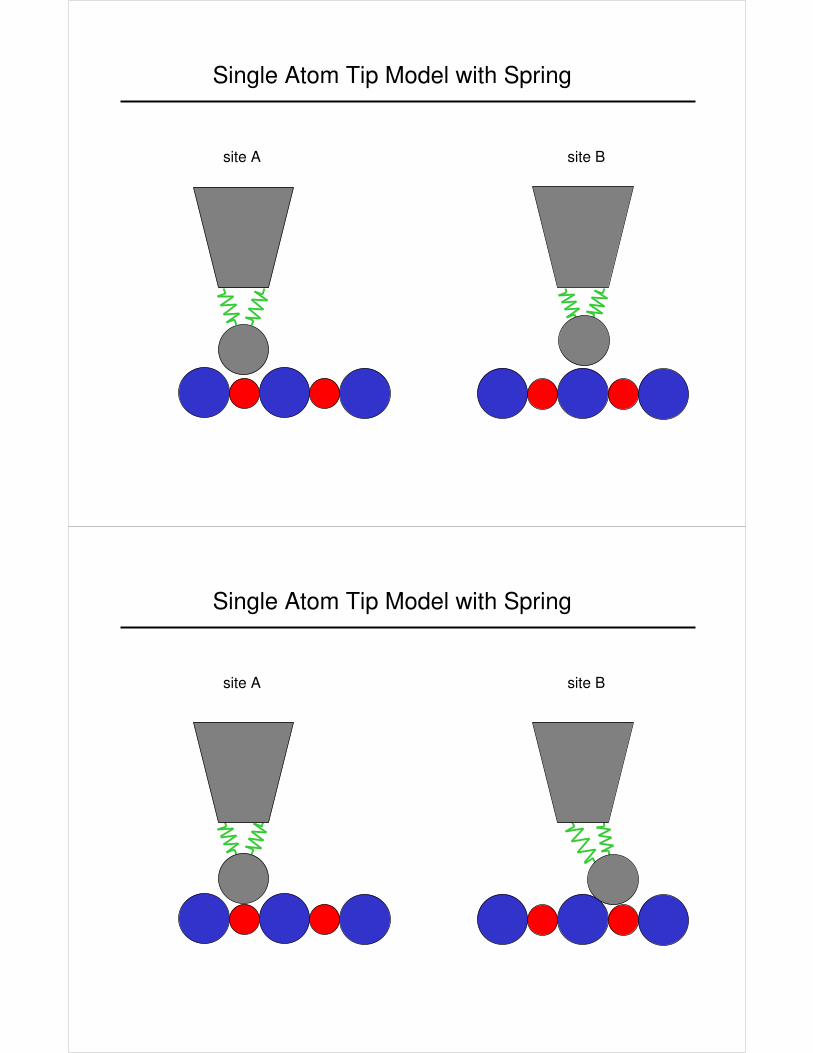
Single Atom Tip Model with Spring
site A site B
Single Atom Tip Model with Spring
site A site B
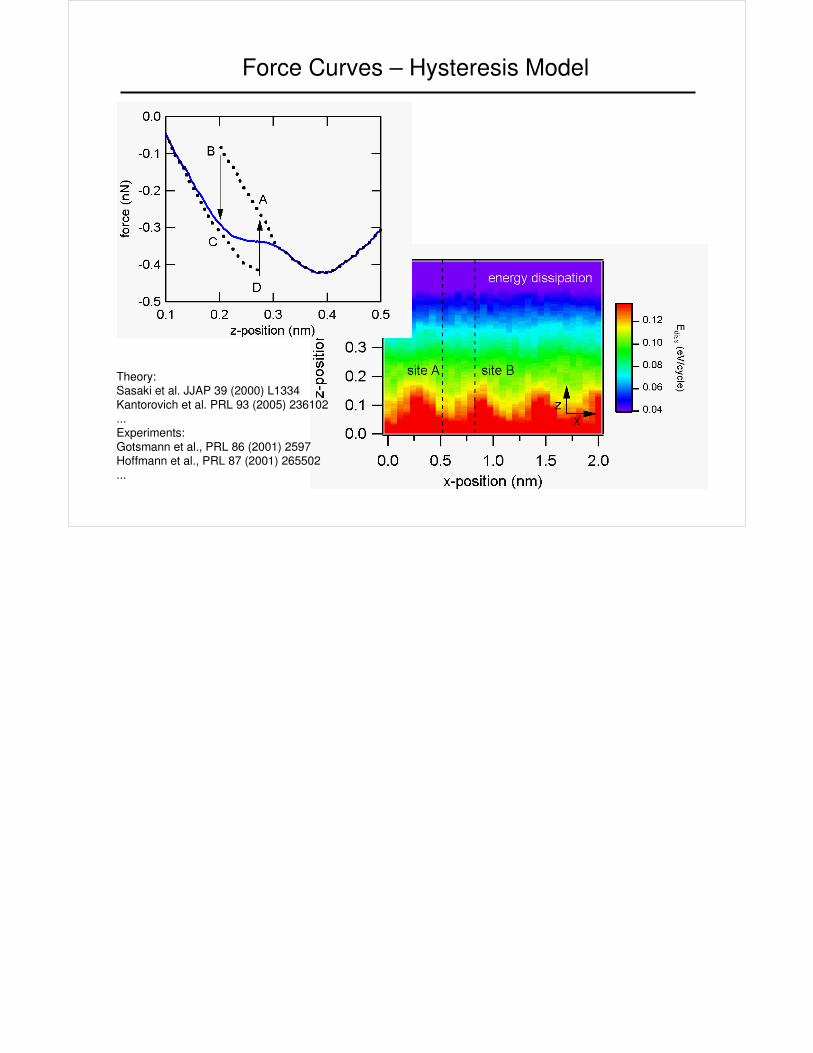
Force Curves – Hysteresis Model
Theory:Sasaki et al. JJAP 39 (2000) L1334Kantorovich et al. PRL 93 (2005) 236102...Experiments:Gotsmann et al., PRL 86 (2001) 2597Hoffmann et al., PRL 87 (2001) 265502...